

Abstract
N-methyl-d-aspartate (NMDA) receptors are ligand-gated, cation-selective channels that mediate a slow component of excitatory synaptic transmission. Subunit-selective positive allosteric modulators of NMDA receptor function have therapeutically relevant effects on multiple processes in the brain. A series of pyrrolidinones, such as PYD-106, that selectively potentiate NMDA receptors that contain the GluN2C subunit have structural determinants of activity that reside between the GluN2C amino terminal domain and the GluN2C agonist binding domain, suggesting a unique site of action. Here we use molecular biology and homology modeling to identify residues that line a candidate binding pocket for GluN2C-selective pyrrolidinones. We also show that occupancy of only one site in diheteromeric receptors is required for potentiation. Both GluN2A and GluN2B can dominate the sensitivity of triheteromeric receptors to eliminate the actions of pyrrolidinones, thus rendering this series uniquely sensitive to subunit stoichiometry. We experimentally identified NMR-derived conformers in solution, which combined with molecular modeling allows the prediction of the bioactive binding pose for this series of GluN2C-selective positive allosteric modulators of NMDA receptors. These data advance our understanding of the site and nature of the ligand-protein interaction for GluN2C-selective positive allosteric modulators for NMDA receptors.
Introduction
Postsynaptic and nonsynaptic N-methyl-d-aspartate receptors (NMDA-Rs) are heterotetrameric assemblies of two GluN1 and any two of the four GluN2A–D subunits (Traynelis et al., 2010) that endow NMDA-Rs with unique properties that enable them to serve different roles in various brain regions (Stern et al., 1992; Vicini et al., 1998; Wyllie et al., 1998; Traynelis et al., 2010; Vance et al., 2012). NMDA-Rs have been discussed in connection with a wide range of neurologic complications that include schizophrenia, intellectual disability, depression, epilepsy, ischemic/hypoxic brain injury, neurodegenerative conditions such as Parkinson’s disease, and intractable seizures in pediatric populations (Choi, 1992; Menniti et al., 2000; Traynelis et al., 2010; Coyle, 2012; Carvill et al., 2013; Lakhan et al., 2013; Lemke et al., 2013; Lesca et al., 2013; Yuan et al., 2014; Hu et al., 2016). Cell-specific differences in GluN2 expression create an opportunity to alter neuronal function with subunit-selective modulators that target only circuits expressing particular GluN2 subunits (Preskorn et al., 2008). This potential utility has focused considerable attention of industry and academia on the development of subunit-selective allosteric NMDA-R modulators (Ogden and Traynelis, 2011; Collingridge et al., 2013; Santangelo Freel et al., 2013). Moreover, unlike orthosteric ligands or channel blockers, allosteric modulators target weakly conserved portions of the protein, increasing the possibility of identifying strong subunit-selectivity. Thus, the development of potent, brain-penetrant, subunit-selective allosteric modulators of NMDA-R function should provide exceptionally useful probes with which to test therapeutically relevant hypotheses about NMDA-R function in models of disease.
Potent and selective (>200-fold) inhibitors for GluN2B have been known for decades (Williams, 1993). However, subunit-selective positive and negative modulators for other GluN2 subunits have been identified only recently (Bettini et al., 2010; Costa et al., 2010; Mosley et al., 2010; Mullasseril et al., 2010; Acker et al., 2011; Santangelo Freel et al., 2013; Hackos et al., 2016; Strong et al., 2017) and include the GluN2C-selective pyrrolidinones (Zimmerman et al., 2014). The identification of new ligands acting on GluN2A, C, and D has led to the elucidation of potentially new modulator binding sites, including the pre-M1/M1 helix of GluN2C/D [CIQ (Ogden et al., 2014; Swanger et al., 2017)], the membrane proximal face of the agonist binding domain [QNZ-46 and DQP-1105 (Acker et al., 2011; Hansen and Traynelis, 2011)] and the dimer interface of the GluN1/GluN2A ligand binding domain [TCN-201 (Hansen et al., 2012) and GNE compounds (Hackos and Hanson, 2017)]. Mutagenesis studies suggested the existence of a novel pocket that lies between the GluN2C agonist binding domain and the GluN2C amino terminal domain as a candidate site for pyrrolidinones, which rapidly bind to GluN2C to increase channel open time and open probability (Khatri et al., 2014). In this study we combined molecular biology, pharmacology, molecular modeling, and NMR-based methods to elucidate the nature of this pocket, explore the mechanism of potentiation, and determine the bioactive protein-ligand complex within this candidate binding site. The results of these experiments strengthen the idea that pyrrolidinones bind to a pocket at the agonist binding domain (ABD)–amino terminal domain (ATD) interface in GluN2C and suggest that further exploration of this pocket could be insightful.
Materials and Methods
Molecular Biology
The cDNAs encoding rat GluN1-1a (hereafter GluN1, U11418, U08261), GluN2A (D13211), GluN2B (U11419), GluN2C (M91563), and GluN2D (L31611) were provided by Dr. S. Heinemann (Salk Institute, La Jolla, CA), Dr. S. Nakanishi (Osaka Bioscience Institute, Osaka, Japan), and Dr. P. Seeburg (Max Planck Institute for Medical Research, Heidelberg, Germany). The amino acids are numbered according to the full-length protein, including the signal peptide (the initiating methionine is 1). For GluN2C, the numbering described in GenBank M91563 was used, which was the same as Khatri et al. (2014) but differed from NCBI Reference Sequence NM_012575.3, which is numbered to start at a second methionine 13 residues upstream of the initiating methionine in M9156. Chimeric NMDA receptors were created using the In-Fusion method (Takara Bio USA, Mountain View, CA). A segment of GluN2C between the ATD and ABD containing the proposed binding pocket was amplified via polymerase chain reaction and subcloned into the other GluN2 subunits, replacing the analogous stretches of DNA in GluN2A, B, and D. In addition, roughly 1-kb GeneStrand fragments of GluN2A, B, and D containing the point mutations that changed the residues to those found in GluN2C to reproduce the pocket of interest were obtained from Eurofins (Huntsville, AL) and subcloned in the same manner via In-Fusion as the chimeric proteins described above. Other mutant subunits were created via site-directed mutagenesis using the QuikChange strategy (Agilent Technologies, Santa Clara, CA). For synthesis of cRNA in vitro, cDNA constructs were linearized by restriction enzymes, purified using QIAquick purification kit (Qiagen, Germantown, MD), and used for in vitro transcription according to the manufacturer’s recommendations (mMessage mMachine; Ambion, Austin, TX) (Chen et al., 2017). The cDNA constructs that enable control of subunit stoichiometry were generated using rat GluN2 subunits with modified C-terminal peptide tags encoding coiled-coil domains and an endoplasmic reticulum (ER) retention signal, as previously described (Hansen et al., 2014). Briefly, two peptides comprising a synthetic helix, the leucine zipper motifs from GABAB1 (referred to as C1) or GABAB2 (referred to as C2), and a di-lysine KKTN ER retention signal were inserted in frame in place of the stop codon of GluN2A (Jackson et al., 1992; Zerangue et al., 2001) to yield GluN2AC1 and GluN2AC2. Only receptors with one copy of a C1 tag and one copy of a C2 tag will mask the ER retention signal and reach the cell surface, allowing control of GluN2 stoichiometry (Hansen et al., 2014). The C-terminal domain of the GluN2C subunit following position 837 was replaced by the modified C-terminal domain of GluN2AC1 or GluN2AC2 following position 837 in GluN2A. We also modified GluN2B by replacing the GluN2B C-terminal following position 838 by the GluN2AC2 C-terminal starting at position 837. We introduced two binding site mutations (GluN2C-R529K, T701I, referred to as RK/TI) into GluN2CC1 and GluN2CC2 subunits to allow a determination of the magnitude of the escape current, which is a measure of the ability of the ER retention signal to prevent trafficking to the plasma membrane of receptors that contain either two C1-tagged GluN2 subunits or two C2-tagged GluN2 subunits. Only receptors that contain C1-tagged GluN2 subunits or two C2-tagged GluN2 subunits can give rise to the current responses when the other subunit harbors the RK/TI mutation. We likewise introduced the RK/TI mutations into GluN2AC1 (GluN2A-R518K, T690I) and GluN2BC1 (GluN2CB-R519K, T691I). Wild-type and modified GluN2 cDNAs were subcloned into pCI-neo (Promega, Madison, WI) and used to synthesize cRNA in vitro for injection into Xenopus oocytes. On average, GluN1/GluN2AC1/GluN2CC2 triheteromeric receptor experiments showed a summed escape current of approximately 3–10.4%. We also expressed GluN1/GluN2BC1/GluN2CC2 receptors in oocytes using GluN2CC2 as described above in addition to GluN2BC1 as described in Hansen et al. (2010), as well as their corresponding RK/TI mutants. On average, the summed escape currents for GluN1/GluN2BC1/GluN2CC2 receptors were between 3 and 4%. We also introduced the S472T or K470G mutations into GluN2CC2 (either in pCI-neo or SP6 plasmids) to test PYD-106 on GluN1/GluN2AC1/GluN2CC2 triheteromeric NMDARs with controlled stoichiometry. All mutations and chimeric receptors were sequence verified.
Two-Electrode Voltage Clamp Recording
Defolliculated Xenopus laevis oocytes (stage V–VI) were obtained from Ecocyte BioScience (Austin, TX) and injected with cRNAs encoding GluN1 and GluN2 at a 1:2 ratio. The cRNA was diluted with RNase-free water to give responses with amplitudes ranging between 200 and 2000 nA (0.2–10 ng total cRNA). Following cRNA injection, the oocytes were stored at 15–19°C in Barth’s solution that contained (in mM) 88 NaCl, 2.4 NaHCO3, 1 KCl, 0.33 Ca(NO3)2, 0.41 CaCl2, 0.82 MgSO4, and 5 Tris-HCl (pH 7.4 with NaOH), supplemented with 100 IU/ml penicillin, 100 μg/ml streptomycin (Invitrogen/Thermo Fisher Scientific, Carlsbad, CA), and 100 μg/ml gentamicin (Fisher Scientific, Pittsburg, PA). Recordings were performed 2–5 days following cRNA microinjection at room temperature (23°C) using a two-electrode voltage-clamp amplifier (OC725; Warner Instrument, Hamilton, CT) to measure current responses to 100 μM glutamate and 30 μM glycine, unless otherwise stated. The signal was low-pass filtered at 10–20 Hz (4-pole, −3 dB Bessel) and digitized at the Nyquist rate using PCI-6025E or USB-6212 BNC data acquisition boards (National Instruments, Austin, TX). Oocytes were placed in a custom-made chamber and continuously perfused (2.5 ml/min) with oocyte recording solution containing (in millimolar concentrations) 90 NaCl, 1 KCl, 10 HEPES, 0.5 BaCl2, and 0.01 EDTA (pH 7.4 with NaOH). Solutions were applied by gravity, and solution exchange was controlled through a rotary valve (Hamilton, Reno, NV). Recording electrodes were filled with 0.3–3.0 M KCl, and current responses were recorded at a holding potential of −40 mV. Data acquisition, voltage, and solution exchange were controlled by custom software. Concentration-effect curves were expressed as a percentage of the response in the absence of test ligand and fitted by
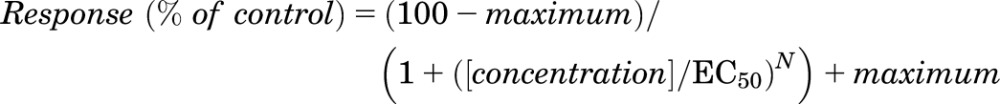 |
(1) |
where N is the Hill slope and maximum is the maximal response predicted for saturating concentration of potentiator.
NMR Experiments
Ten milligrams of PYD-106 was dissolved in 0.8 ml CDCl3 and the solution was degassed for 1 hour by bubbling Ar through the sample. A one-dimensional proton NMR spectrum was acquired on a Varian 400-MHz NMR spectrometer (Supplemental Fig. S1). We also acquired 200-, 300-, and 400-millisecond spectra from two-dimensional nuclear Overhauser effect spectroscopy (NOESY) (Supplemental Fig. S2). Using the integral of the NOESY cross-peak for the interaction of proton C and proton D (Supplemental Fig. S3), it was found that the relationship between mixing time and area of cross-peak was linear (Supplemental Fig. S3). Therefore, we could use the internal standard of adjacent methines on an aromatic ring of 2.48 Å as the distance between B and C and calculate the unknown interatomic distances using the following relationship:
| (2) |
where aij is the nuclear Overhauser effect (NOE) cross-peak integral and rij is the interatomic distance between the two protons i and j. Given an internal known distance between two protons (rref) and its cross-peak integral observed in the NOESY (aref), a distance (rij) can be calculated from another NOE volume of the two protons of interest (aij). These observed integrals and the resulting internuclear distances are represented in Supplemental Fig. S3.
Conformational Searches and Deconvolution
Conformational searches were performed for both enantiomers of the chiral analog PYD-106. The conformational search parameters were as follow: 80,000-steps (10,000 steps per rotatable bond) of Monte Carlo Macro Model and Mixed Torsional/Low-Mode sampling were performed on PYD-106 using three different individual force fields (AMBER*, MMFFs, and OPLS-2005) within the MacroModel module of Maestro (Schrödinger Release 2016-3: MacroModel; Schrödinger, LLC, New York, NY). The Generalized Born and Surface Area (GBSA)/H2O and GBSA/CHCl3 solvation models were used along with a relaxed 30 kJ/mol energy cut-off. To ensure complete energy convergence, the resulting structures were subjected to 50 steps of full-matrix Newton-Raphson minimization with a gradient of 0.05. Conformers resulting from the conformational searches were combined and redundant conformations removed using a 0.1-Å atom deviation of the heavy atoms. The global minimum was found between 32 and 162 times for the different searches, assuring complete coverage of conformational space. The resulting conformers represent the conformer pool.
Sixteen possible structural permutations exist given the proton assignment of PYD-106. The NOE distance and dihedral angles were used to deconvolve and identify the in-solution conformers that best represent the NMR data for all permutations. The permutation set that resulted in the lowest sum of square differences were selected and its conformers were retrieved from the conformation pool.
Homology Models
Full-Length Models.
Amino acids are numbered with the initiating methionine set to 1. A protein family alignment was generated for the NMDA (GluN1/GluN2A-D), AMPA (GluA1-4), and kainate (GluK1-5) receptors using the program Muscle (Edgar, 2004). Homology models were generated for a diheteromeric GluN2C receptor from two template structures [Protein Data Bank (PDB) entries: 4MTL and 4PE5] using Modeler 9.14 (Sali and Overington, 1994). The models were subjected to quality analysis using the PDBsum generator [http://www.ebi.ac.uk/pdbsum; Laskowski (2009)]. The model was prepared for analysis using the protein preparation wizard in which protonation states were assigned followed by an energy minimization to relieve unfavorable constraints (Schrödinger Release 2016-3; Protein Preparation Wizard; Epik version 3.7; Impact version 7.2; Prime version 4.5; Schrödinger, LLC).
Ensemble Models.
Eighty homology models consisting of the ATD and ABD region of the GluN2C subunit were generated to sample the phase space of the identified PYD-106 binding pocket. The alignment used was taken from the Muscle alignment, as described above. The structures were prepared for analysis using the protein preparation wizard module in Knime (Nicola et al., 2015), in which protonation states were assigned followed by an energy minimization to relieve unfavorable constraints. The models were built void of ligands to allow for maximum side-chain conformation sampling. The models were structurally aligned to help analysis during the study.
Molecular Dynamics
A 10-nanosecond molecular dynamics simulation at 300K was performed on the GluN2C diheterotetrameric structure bound with compound 73 (Zimmerman et al., 2014). The complex was prepared for molecular dynamics (MD) simulation using Desmond (Schrödinger Release 2016-3: Desmond Molecular Dynamics System, D. E. Shaw Research, New York, NY; Maestro-Desmond Interoperability Tools, Schrödinger, LLC). Ligand and protein were treated using the OPLS2005 force field, and then solvated with a box volume of 4,046,312 Å3 (buffer distance of 10 Å) containing 365,745 atoms. The system was solvated using the simple point charge water model. The overall system was neutralized at pH 7.0 using an ion concentration of 0.15 NaCl. The system was first relaxed using the Desmond relaxation model. The completed equilibration run was followed by a production run performed under normal temperature and pressure conditions using the Berendsen thermostat (300K and 1.103 bar) and particle mesh Ewald (PME) electrostatics with a cutoff of 9 Å. Time-step calculations were performed every 2 femtoseconds. Average structures were prepared from the final 10 nanoseconds of simulation. Frames were selected throughout the simulation and used in docking studies.
Molecular Docking
All compounds for docking were prepared with ligprep (Schrödinger Release 2016-3: LigPrep; Schrödinger, LLC). Protonation states were predicted with epic with a target pH of 7.0 ± 2.0, specific chiralities were retained, and one low-energy conformation was generated per ring (Shelley et al., 2007). Glide was used for docking in this study (Friesner et al., 2004). Docking GRIDs were generated for all 80 homology models with the center of the binding pocket set to the following coordinates X: −20.1887; Y:19.0665; Z: −15.0559. The inner box was set to 10 Å and the outer box to 30 Å. Rigid docking to 80 models was performed using each of the nine solution conformers obtained from nuclear magnetic resonance analysis of molecular flexibility in solution (NAMFIS). Both the standard precision and extra precision (XP) scoring functions were used in analysis (Friesner et al., 2006). Only the best docking poses were kept, which were subjected to postdocking minimization using either the OPLS2005 or OPLS3 force field with a rejection threshold of 0.5 kcal/mol (Harder et al., 2016). For all other docking procedures that did not involve the in-solution NAMFIS conformers, the structures were treated as flexible, which allowed for the sampling of ring conformations and nitrogen inversion.
Conformational Generation and Shape-Based Screening
Compound conformers were generated for the Drug-Now ZINC database [(Irwin and Shoichet, 2005); 2013-11-11; 8,356,438 compounds] and selected compounds from a similarity screen using Omega2 resulting in ∼1 billion conformers (Hawkins and Nicholls, 2012). The maximum number of conformations to be generated per molecule was set to 255 with an energy window of 7 kcal/mol to accept or reject molecules with respect to the lowest energy conformation. The flipper parameter was set to “true” to generate an ensemble of stereoisomers for unspecified stereo centers.
Results
The PYD series of positive allosteric NMDA-R modulators selectively potentiates the response of diheteromeric GluN1/GluN2C NMDA-Rs (Khatri et al., 2014; Zimmerman et al., 2014). The PYD series appears to act at a novel site that resides between the GluN2C amino terminal domain and the agonist binding domain (Khatri et al., 2014). This pocket is only present in the GluN2 subunits, being notably absent in the GluN1 subunit (Fig. 1). The absence of the PYD pocket on the GluN1 subunit can be explained by the different orientation that the ATD domains adopt with respect to the ABD when the GluN1 and GluN2 subunits are compared [Fig. 1; Karakas and Furukawa (2014); Lee et al. (2014)]. The spatial locations of the residues that form the PYD pocket in the GluN2 subunit and that of the corresponding residues of the GluN1 pocket are shown in Fig. 1. The comparison of homologous residues was made on the basis of a sequence alignment that showed a 23% sequence identity and 46% sequence similarity between GluN1 and GluN2C (Supplemental Table S1). The characteristics of the PYD pocket are predicted to be consistent with compounds that bind with submicromolar activity (site score 1.079) and therefore could be considered druggable [DScore 1.033; DScore > 0.98 is considered druggable; pocket volume 814 Å3; Halgren (2009)]. However the existing structure-activity relationship (SAR) for this series is relatively flat, spanning ∼1.5 log units (4.3–61 μM) with a potentiation ranging between 123% and 257% at 100 μM [Table 1; Zimmerman et al. (2014)]. The prediction that the binding pocket is druggable at submicromolar concentrations and the observed single-digit micromolar SAR of the PYD series prompted us to use novel methods to characterize the binding of this series to the GluN2C subunit and facilitate the design of potent compounds that can overcome the flat SAR. We addressed this by exploring the mechanism of potentiation and the structural determinants of the pocket, including its shape, and using an array of structural-based approaches to identify the bioactive pose of the active ligands. Structure-based ligand-design approaches use information about the binding pocket and rely on the determination of the bioactive receptor-ligand complex (Seeliger and de Groot, 2010). In the absence of an experimentally determined structure, homologous receptor structures can be used to generate homology models. Receptors coresolved with ligands have shown improved success in structure-based approaches (Seeliger and de Groot, 2010). However, the only available NMDA-R structures show low resolution (3.59–3.96 Å) with no ligands resolved within the pocket of interest in this study (Karakas and Furukawa, 2014; Lee et al., 2014). To reduce the complexity of finding the bioactive receptor complex, we first experimentally identified the small molecule PYD-106 conformers present in solution by utilizing NAMFIS (see below). Solution conformations have previously been shown to capture the bioactive conformation of ligands, that is, the conformation of a small molecule when bound to a receptor (Snyder et al., 2000; Thepchatri et al., 2005; McCloskey et al., 2009; Danelius et al., 2016). The identified PYD-106 conformations were rigidly docked into an ensemble of protein structures representative of a snapshot of the dynamic movements or phase space of the binding pocket that was generated by homology modeling. A schematic representation of the steps in this approach is given in Fig. 2, which describes optimization of the protein backbone and side-chain positions, identification of conformers, and docking of the NAMFIS-derived solution structures into the model. This multi-step approach allows determination of a candidate bioactive pose for the receptor-ligand complex. As a final step, a binding pose can be selected on the basis of the known SAR of the series. Each of these steps will be describe in more detail below.
Fig. 1.

(A) The location of the PYD binding pocket (green) between the ATD and ABD of GluN2C. The homologous residues of the PYD binding pocket of the GluN1 subunit (magenta). (B) A cartoon of the proposed binding of PYD-106. Residues colored in dark red are nonconserved (also shown in bold in C). Residues in dark blue are conserved between GluN2 subunits. Residues showing various degrees of similarity are colored in a spectrum varying between blue (conserved) and red (nonconserved). The similarity score was generated using a Blosum65 matrix. (C) The residues that constitute the PYD binding pocket for all four subunits are shown (GluN2A–D). Residues highlighted in bold are the residues that are not conserved throughout the subunits.
TABLE 1 .
Summary of the activity data of the PYD series of positive allosteric modulators
| Mean ± S.E.M. | N | Minimum | Q1 | Median | Q3 | Maximum | |
|---|---|---|---|---|---|---|---|
| EC50 (μM) | 23 ± 15 | 37 | 4.3 | 12 | 16 | 35 | 61 |
| I 100 μM/I Control | 170 ± 33 | 37 | 120 | 140 | 160 | 191 | 257 |
A summary of all active compounds previously described by Zimmerman et al. (2014) are provided; values are given to two significant figures. EC50 is given as the mean. I100μM/IControl is the ratio of the current to saturating co-agonists (100 μM glutamate, 30 μM glycine) in the presence of 100 μM test compound to response in the absence of test compound. N is the number of active molecules, Q1 is value for the most potent quartile and Q3 is the value for the 75th percentile.
Fig. 2.

An overview of how a bioactive ligand-receptor complex was selected. (A) The receptor-based modeling highlights how homology models were generated from low-resolution crystal structure (3.59–3.96 Å) to capture possible conformations of the active site. (B) The ligand-based portion shows how in-solution conformers were determined using NMR-derived constraints and NAMFIS. (C) The ligand-receptor complex part illustrates that various different techniques including quantitative structure–activity relationship, molecular dynamics and docking were used to select a representative bioactive ligand-receptor complex. (D) The PYD series highlights the SAR developed by Zimmerman et al. (2014).
Receptor-Based Modeling.
Homology models of the GluN1/GluN2C diheterotetramer were built using as a template the resolved GluN1/GluN2B structures (PDB: 4TLM and 4PE5). The target and template share 37% and 49% sequence identity and similarity over the full-length sequence, respectively (Supplemental Table S1). Previous work suggested that a cavity within the interface between the ATD and ABD regions of the GluN2C subunit may harbor the PYD binding site (Khatri et al., 2014). This pocket shares between 57% and 65% sequence identity between the GluN2 subunits, providing confidence in our models ability to accurately represent a bio-relevant pocket (Hillisch et al. (2004); Fig. 1, B and C; Supplemental Table S1). Special attention was given in modeling to the L0-linker region connecting the ATD and ABD domains, which forms an important part of the binding pocket; more detail on this is provide in Supplemental Fig. S4.
To identify the PYD receptor pocket conformation that would bind the PYD series and explain the associated SAR, we first used homology modeling to sample the phase space. Different phase space sampling methods exist and include molecular dynamics and Monte Carlo sampling (da Silva et al., 2004; Burger et al., 2015; Kalas et al., 2017). The GluN2B receptor used as template was resolved in an inhibited state (receptor is bound by negative allosteric modulator); however, the PYD series are positive allosteric modulators that, when bound, modify the functions of agonist-bound receptors. The latter therefore requires structural rearrangements of the receptor to occur following agonist binding to accurately capture a representative receptor-ligand complex for the series. The interdomain movements between the ATD and ABD were not sampled at this stage owing to the size of the molecular system (∼3200 amino acids; ∼50,000 atoms) and the additional complexity that the sampling would introduce into evaluation of the receptor-ligand complex. Domain movement was incorporated later using molecular dynamics. Eighty GluN1/GluN2C homology models were generated and provided a diverse phase-space for performing ensemble docking. Root-mean-square deviation (RMSD) were calculated for heavy atoms (backbone and side chain) of the binding pocket to ensure we had sufficient phase-space sampling. The average RMSD (all heavy atoms) over the 80 models was 1.36 ± 0.11 Å compared with the starting structure, with a minimum value of 1.09 Å and maximum value of 1.63 Å. Likewise, the average RMSD over the 80 models of the backbone was 0.14 ± 0.03 Å with a minimum value of 0.09 Å and maximum value of 0.23 Å. This provided confidence that we have sampled an adequate number of diverse binding pocket conformations to be used in docking studies to identify the biorelevant binding pose. The binding pocket with the side chains is shown in Fig. 1B.
Ligand-Based Modeling.
Having sampled the conformational space of the receptor (Fig. 2A), we next identified representative solution conformers of the PYD series to be used in docking. For this we used NAMFIS, an algorithm that determines the solution conformers and their mole fractions by matching experimentally determined NMR-derived geometric constraints to in silico conformers by means of deconvolution (Cicero et al., 1995). NAMFIS provides an independent, empirical bias, which we used to determine viable binding poses of structurally undetermined ligand-protein complexes. We selected a representative compound of the series, PYD-106, and experimentally identified its solution conformers. Performing an exhaustive conformational search generated a complete set of in silico conformers by combining sampling methods. Moreover, implicit solvent models (water and chloroform) with three different force fields (MMFFs, AMBER*, and OPLS-2005) were applied. A complete set of in silico conformers is necessary to extract the correct conformers when using the NMR constraints. The global minimum was observed more than 30 times for each conformational sampling, ensuring complete coverage of the conformational space. The conformational searches were combined, and the duplicates removed, which resulted in a conformational pool of 1159 conformers (with a RMSD of 0.01 Å; Fig. 2B). NMR experiments (NOESY) were used to extract geometric constraints, which were represented by 14 NOESY H–H distances and two 3JH-H dihedral angles (Supplemental Figs. S1–3). The 32 possible proton assignments or permutations of PYD-106 were generated as input constraints. The input constraints were used by NAMFIS to deconvolute the in silico conformation pool with the best-fit solution, resulting in nine solution conformers with a mole fraction distribution of 1 and 28% (Fig. 2B). The results captured the measured NMR parameters as indicated by a goodness-of-fit (sum of square differences = 0.64).
Ligand-Receptor Complex.
The identification of the solution conformations of PYD-106 was followed by a rigid ensemble docking study performed on the 80 homology models as described above (Figs. 2C and 3). As the first step of this process, we used visual inspection as a means to identify binding poses that would describe the SAR associated with the binding of the PYD series. Visual inspection was performed on all docking poses (nine poses for each of the 80 homology models). To facilitate visual inspection, we identified SAR features of interest observed during development of the SAR (Fig. 2D), and these features were used to guide pose selection. For illustrative purposes, two such features are highlighted in Fig. 3B and are discussed below to show how the SAR was incorporated into the selection of the potential binding modes (Fig. 3). For example, during binding pose evaluation, we considered whether a substitution could potentially be tolerated (Fig. 3). One such example observed from the SAR is an alkyl ester (Fig. 3, magenta box) to sulfonamide substitution on the benzyl ring (R2 position; Figs. 2D and 3, B and C). If it was apparent that a substitution was in agreement with the experimental SAR and could be tolerated, then that binding pose was advanced to the next round of visual inspections. A second example is the addition of an unsaturated six-membered ring at the R1 position (cyan box; Figs. 2D and 3, A and B). This was followed by consideration of additional structural features important to the experimental SAR until the final ligand-receptor complex was selected. The NAMFIS-determined structure, NAMFIS-2, was selected as the final binding conformer and is shown in gray (highlighted by gray surface) in Fig. 4.
Fig. 3.

An illustration of how the SAR was used to select a binding pose. (A) First, we selected the docking pose and visually inspected it. (B) Second, we considered substitution points on the molecule that changed the activity of the compounds. For example, it is known that an alkyl ester can be replaced by a sulphonamide in the PYD series and the activity is retained. We envision that if the substitution could be tolerated at the position of interest, as in this case, the receptor structure would advance to the next round. (C) Third, we selected a second substitution point and inspected the effect of substitutions there.
Fig. 4.

ROC curves of the PYD series docked to a randomly selected homology model (red) as well as the selected homology model that represents the bioactive binding pose (blue). (A) ROC curve and ROC scores of the PYD series docked to both modeled receptors. (B) The binding poses of the PYD series highlighted in red (random) and blue (bioactive) correspond to the ROC curve and score in (A). The binding poses highlighted in blue clearly show a binding pattern for the series, whereas the binding poses highlighted in red are random. (C) An overlay of the rigidly docked NAMFIS structure highlighted by the transparent surface (NAMFIS-2; gray) and flexibly docked PYD series (green).
A second independent selection criterion was used in which we docked the PYD series (79 compounds) to the ensemble of receptors using both the standard precision and extra precision scoring functions. The docking results were evaluated using receiver operating characteristics (ROC) plots to distinguish the ability of each receptor conformation to identify and rank active compounds over inactive compounds. The rationale is that receptor conformations that distinguish between active and inactive compounds most probably represent the bioactive receptor-ligand complex. Both the R and S enantiomers of chiral PYD analogs were docked, with the average ROC score for the R enantiomer being 0.57 ± 0.05, with a minimum value of 0.50 (fail) and a maximum value of 0.76 (fair). The S enantiomer ROC score resulted in a similar average of 0.57 ± 0.04, with a minimum value of 0.50 (fail) and a maximum value of 0.69 (poor), suggesting this approach alone is insufficient to distinguish which enantiomer is active. An ROC curve with a value of 1.0 would have the ability to distinguish all active compounds from inactive compounds. ROC plots with scores of 0.5 suggest that the receptor conformations do not distinguish between active and inactive compounds better than if compounds were randomly selected. A limitation of the ROC curves is that they only consider the docking scores of the PYD series and the related EC50 values, at the same time being naive to the binding poses of PYD series. In this study, we assume a common binding pocket with a common binding pose from which the SAR can be extracted. Using only the ROC curves as selection criteria is potentially to be misleading, as compounds could be identified as tight binders on the basis of the scoring functions alone. However, their binding poses might not agree with the SAR of the PYD series, which may result in a protein structure seemingly representative of the SAR for the PYD series that is incorrect. To exemplify this phenomenon, Fig. 4 shows the ROC curves from our docking results to two homology models, one which is the final ligand-receptor complex proposed within this study for the PYD series and the other a homology model selected to illustrate our point. The difference between the ROC scores of the two structures is only 0.07 (Fig. 4A). However, when taking into consideration the overall binding pattern of the series, it is clear that one of the receptor structures (highlighted in blue) shows a binding pattern that emerges compared with the other receptor structure (highlighted in red). The two independent selection methods came up with the same homology model as the most probable receptor structure to have the correct bioactive binding pose. Finally, we show the similarity of the binding poses from the first (gray) and second selection criteria in a molecular overlay (green; Fig. 4C). These results corroborate the selected bioactive receptor complex, first because the selected PYD conformation is on of the prevalent solution conformers, which have been shown previously to resemble closely the bioactive binding pose of small molecules (Snyder et al., 2000; Thepchatri et al., 2005; McCloskey et al., 2009; Danelius et al., 2016), and second the docking poses of the PYD series are able to describe the SAR and enrich for active over inactive compounds.
Enantiomer Selection.
The PYD series has previously been shown to have one enantiomer more biologically active than the other (Zimmerman et al., 2014). Numerous experimental efforts were made to resolve the exact stereochemistry of the active enantiomer without success (Supplemental Material S5). As a result, we used theoretical methods to predict the absolute configuration for the active enantiomer. Computational studies up to this point were performed on both the R and S enantiomer. However, in all of our studies, we were unable to come up with a binding pose featuring the S enantiomer that was able to describe the SAR. Furthermore, we were also unable to identify a pattern emerging when docking the S PYD series to the 80 homology models (Supplemental Fig. S6). By contrast, we could identify a ligand-receptor complex that could explain the SAR for the R enantiomer, and thus only studied the R enantiomer in complex with the GluN2C receptor.
One of the caveats in this study is that the GluN2C receptor structure was generated from a homolog (GluN2B) that was resolved in the inhibited state of NMDA-R. However, the PYD series are positive allosteric modulators, and therefore relaxation of the ligand-receptor complex was needed to give a realistic representative conformation. To do this, we selected a receptor-ligand complex of GluN2C and a docked compound, PYD-73 (Zimmerman et al., 2014), to perform a 10-nanosecond molecular dynamics simulation (Fig. 5). PYD-73 was selected over PYD-106 since the pyridine ring substitution at the R2 position of PYD-73 occupies additional space within the binding pocket (Fig. 2, C and D). Selecting PYD-73 ensured that the receptor pocket would not be filled with surrounding side chains during domain movements when simulated, and thus prevented interference in further docking studies. From the MD trajectory, four frames spaced throughout the simulation were selected for the docking studies. These included the starting structure (postequilibration run), a structure at 3.5, 7.0, and 10 nanoseconds. The frames were prepared and subjected to docking, which showed ROC scores of 0.77 (fair), 0.86 (good), 0.85 (good), and 0.80 (good), respectively (Supplemental Fig. S7). Figure 5 shows the interaction of the proposed bioactive ligand-receptor complex between PYD-73 and GluN2C in two dimensions. The three-dimensional representation is shown in Fig. 2C for PYD-106 (Supplemental Data Ligand-receptor complex). Hydrogen bonds are shown in purple, i.e., a hydrogen bond was found between Thr430 and the nitrogen of the indole ring (Fig. 5A). Hydrogen bonds were also found between the pyrrolidinone ring and Tyr473. Ser472 and Tyr473 both made hydrogen bonds with the carbonyl linker adjacent to the pyrrolidinone ring. Lastly, a hydrogen bond was observed between the methyl ester and Leu475. The use of molecular dynamics allowed for relaxation and the shaping of the binding pocket and resulted in a 0.12 increase in the ROC score compared with that of the homology model (Fig. 5B). The effect on the overall binding pose is shown in Fig. 5C with the core scaffold showing a pronounced binding pattern when docked to the structure after MD (gray) in comparison with that of the homology model (green). Finally a better enrichment for the PYD series was observed for the MD structure (Supplemental Fig. S8)
Fig. 5.

Molecular dynamics improves docking of bioactive pose. (A) Two-dimensional representation of the interactions between PYD-73 and GluN2C. Hydrogen bonds are shown in purple. (B) A ROC curve for the PYD series docked against the selected homology model from Fig. 4 (red) and the MD relaxed structure (blue). (C) Compounds in green represents the PYD series docked to the homology model. Compounds in gray represents the PYD series docked to the relaxed homology model that was subjected to molecular dynamics.
Experimental Validation of Modeling of the Bioactive Pose.
The experimentally determined solution conformers and in silico modeling strongly suggest that the pocket residing between the GluN2C ABD and ATD harbors the PYD binding site. This view is consistent with the previous identification of three residues within this pocket (Arg194, Lys470, and Ser472), at which mutations eliminate PYD-1 potentiation at all concentrations tested, as well as with the identification of residues adjacent to the pocket (Ser393, Arg401, Lys 467, Lys470), at which mutations can reduce PYD potentiation (Khatri et al., 2014). We initiated two new lines of investigation to better understand the nature of this binding pocket. First, we identified an additional seven residues from our modeling that were predicted to be involved in the binding and downstream actions of PYD-106 (Trp162, Ser163, Asp220, Gly249, Gly425, Val431, Tyr473; Fig. 6). We mutated each of these residues, and introduced additional substitutions for Arg194 and Tyr473 to assess the role of the side chain in PYD potentiation. We then generated concentration-effect curves for PYD-106 at each of these mutations for enhancement of the response of GluN1/GluN2C receptors activated by 100 μM glutamate and 30 μM glycine (Fig. 6A). Figure 6 and Table 2 summarize the results of these experiments, which identified six of seven new residues (Trp162, Ser163, Asp220, Gly249, Tyr473; Fig. 6, cyan) in which substitutions significantly altered the effects on PYD-106 modulation. Two of these GluN2C mutations (W162F, D220R) virtually eliminated the actions of PYD-106 at all concentrations tested, and potentiation was not further increased by increasing the concentration of PYD-106 to 300 μM (n = 8, 7 respectively). Figure 6 illustrates the position of these residues in relation to the docked pose for PYD-106. The W162F mutation most probably disrupts the formation of the PYD binding pocket. Interestingly, mutation D220R, which was selected to investigate the potential role it plays in stabilizing interactions between the ABD and ATD, eliminated PYD activity. This result is consistent with the finding that mutations (Khatri et al., 2014) of charged residues (K401, R467, and K470) at the edge of the PYD binding pocket altered PYD activity (Fig. 6, orange). We speculate that Asp220 can potentially interact with Lys401 and Arg467 when large domain movements occur. Moreover, we found that substitution of Lys for Arg194 significantly enhanced the potency of PYD-106, whereas a previous study (Khatri et al., 2014) showed that substitution of Asp for Arg194 strongly reduced activity, suggesting that the charge and side-chain size at this position are important for the actions of this potentiator. However, we cannot exclude that this substitution is similar to other observed mutations whose change of charged residues result in a change in activity.
Fig. 6.

Experimental validation of the PYD pocket. (A) Eight residues that were interrogated via site-directed mutagenesis are highlighted within the PYD binding pocket. PYD-106 is displayed within the binding pocket. Novel mutations evaluated in this study are colored cyan, whereas residues previously mutated are colored in gray and orange. Residues colored in orange represent charged residues at the edge of the PYD binding pocket that have a significant effect on PYD activity when mutated (Khatri et al., 2014). (B) Concentration-response curve for PYD-106 potentiation of GluN1/GluN2C receptors containing ATD-linker mutations in GluN2C activated by 100 μM glutamate and 30 μM glycine. (C) Concentration-response curve for potentiation of GluN1/GluN2C receptors containing S1 mutations in GluN2C activated by 100 μM glutamate and 30 μM glycine. For all panels, the number of oocytes, which were obtained from two to four different frogs, are given in parentheses. Error bars are S.E.M.
TABLE 2 .
Structural determinants of PYD action within the GluN2C ATD-S1 interface pocket
| EC50 (95% CI) | Maximum | N | |
|---|---|---|---|
| μM | % | ||
| WT GluN2C | 16 (15, 17) | 257 ± 3.8 | 20 |
| GluN2C-W162F | N.D. | N.D. | 9 |
| GluN2C-S163Y | 25 (24, 26)* | 280 ± 8.1 | 10 |
| GluN2C-R194I | 21 (20, 23)* | 250 ± 3.0 | 9 |
| GluN2C-R194K | 8.0 (7, 9)* | 246 ± 5.0 | 8 |
| GluN2C-D220R | N.D. | N.D. | 14 |
| GluN2C-G249D | 13 (11, 15)* | 200 ± 3.6 | 10 |
| GluN2C-G425F | 18 (17, 19) | 252 ± 6.7 | 11 |
| GluN2C-V431F | 36 (34, 39)* | 258 ± 9.1 | 9 |
| GluN2C-Y473F | 34 (32, 36)* | 258 ± 5.0 | 12 |
| GluN2C-Y473I | 39 (29, 47)* | 228 ± 9.5 | 8 |
P < 0.05 for log EC50 values compared with same day controls (ANOVA, Bonferroni post-hoc test; F8,86 = 97.14). Power to detect an effect size of 0.5 was 0.94.
Concentration-effect curves for PYD-106 were generated for GluN2C mutations and fitted by the Hill equation (see Materials and Methods). The mean EC50 and mean fitted maximum response as a percent of control (95% CI determined from log EC50) are given. N is the number of oocytes, which were isolated from two to four different frogs. N.D., the EC50 could not be determined because either there was no effect of PYD-106 or the maximal potentiation was not obtained in the concentration range tested.
To further explore the nature of the PYD binding pocket, we designed chimeric receptors that transferred either a portion or the entire binding pocket from GluN2C (residues 158–472) to other GluN2 subunits by replacing some or all residues 163–474 in GluN2A, 162–475 in GluN2B, and 177–499 in GluN2D (Fig. 7, A–C). NMDA-Rs that contained a subset of residues were evaluated and did not render GluN2B or GluN2D PYD-sensitive (Fig. 7, D and E). Chimeric GluN2A-GluN2C chimeric receptors expressed poorly and were not studied further. GluN2B-GluN2C chimeric receptors gave robust responses but were only minimally sensitive to PYD-106 at the highest concentrations (Fig. 7F). By contrast, we found clear potentiation of NMDA-Rs that contained the chimeric GluN2D-GluN2C subunit (Fig. 7E). These data support the idea that residues hypothesized to compose the PYD-106 pocket can introduce PYD-sensitivity to the GluN2D subunits in GluN2C/D chimeric receptors. Moreover, the substantially larger potentiating effect of PYD-106 for GluN2C/D compared with GluN2B/C chimeric subunits suggests that regions outside GluN2C residues 158–472 that are dissimilar in GluN2A and GluN2B but similar between GluN2C and GluN2D influence potentiation. That is, there are unique features of GluN2C shared by GluN2D that are permissive for potentiation.
Fig. 7.

Structural determinants of PYD modulation. (A) A homology model of GluN1/GluN2B is shown with the region replaced by GluN2C residues in chimeric receptors highlighted as magenta. (B) An expansion of the PYD binding pocket is shown with residues that were all individually exchanged in a single GluN2C cDNA shown in green. (C) The sequence of the region of GluN2C that was substituted into GluN2A, GluN2B, and GluN2D is shown below in red. The S1 region is shown as bold, underlined. (D) Concentration-response relationship for potentiation of diheteromeric NMDA-Rs containing mutant GluN2B-Y167S, I168A, V195L, G196S, E198R, D404R, T428G, C430V, R431P, Q437R, S469A, T475S, or chimeric GluN2B/GluN2C subunits by PYD-106; current responses recorded from oocytes were activated by 100 μM glutamate and 30 μM glycine. (E) Concentration-response relationship for potentiation of diheteromeric NMDA-Rs containing GluN1 plus the mutant GluN2D-T182S, S183A, V210L, G211S, E213R, Q239P, L412V, Q427R, T451G, I453V, R454P, D455N, S456T, H494K, G497K, or chimeric GluN2C/GluN2D subunits by PYD-106; current responses recorded from oocytes were activated by 100 μM glutamate and 30 μM glycine. (F) Concentration-response relationship for potentiation by PYD-106 of triheteromeric NMDA-Rs containing chimeric GluN1/GluN2AC1/GluN2AC2, GluN1/GluN2BC1/GluN2BC2, GluN1/GluN2CC1/GluN2CC2, GluN1/GluN2AC1/GluN2CC2, and GluN1/GluN2BC1/GluN2CC2. Current responses recorded from oocytes were activated by 100 μM glutamate and 30 μM glycine. (G) Concentration-response relationship for potentiation of GluN1/GluN2CC1/GluN2CC2, GluN1/GluN2CC1/GluN2C-S472TC2, and GluN1/GluN2CC1/GluN2C-K470GC2 by PYD-106. Current responses recorded from oocytes were activated by 100 μM glutamate and 30 μM glycine; data for GluN1/GluN2CC1/GluN2CC2 from (F) were included for comparison. For all panels, the number of oocytes, which were obtained from two to four different frogs, is given in parentheses. Error bars are S.E.M.
We previously described the lack of effect of PYD-106 on triheteromeric receptors that contain a single copy each of GluN2A and GluN2C (Khatri et al., 2014). We tested whether this dominant-negative action was unique to GluN2A, or a feature of triheteromeric receptors in general. We extended our strategy in which coiled-coil domains were used to mask an ER-retention signal to control GluN2B/GluN2C subunit stoichiometry (Hansen et al., 2014) (see Materials and Methods). Evaluation of both triheteromeric GluN1/GluN2A/GluN2C and triheteromeric GluN1/GluN2B/GluN2C receptors expressed in Xenopus oocytes showed no effects at up to 100 μM PYD-106 on either triheteromeric receptor, suggesting that the receptors that do not contain two GluN2C subunits are insensitive to the effects of PYD-106 binding (Fig. 7D). To ensure that the currents we measured reflected triheteromeric GluN1/GluN2A/GluN2C and GluN1/GluN2A/GluN2B receptors, we evaluated the response of oocytes injected with the modified GluN2 subunits, one of which contained the RK/TI mutations (see Materials and Methods) that eliminate glutamate binding. All receptors containing GluN2 subunit(s) with these mutations are nonfunctional, and thus any current we record must reflect surface receptors that contain two copies of the other GluN2 subunit, which had escaped the ER despite an unmasked ER retention signal (Hansen et al., 2014). The summed escape currents calculated from each combination of triheteromeric receptors were between 3 and 10% (see Materials and Methods). Thus, the responses we see are primarily produced by triheteromeric receptors.
Next, we wanted to determine whether the lack of action of PYD-106 on triheteromeric receptors with a single copy of the GluN2C subunit reflected the requirement for two NMDA-R-bound PYD-106 molecules. To test this hypothesis, we introduced mutations (S472T or K470G) that eliminate the effects of PYD-106 into GluN2CC2 to enable control of subunit stoichiometry. This allowed evaluation of the actions of PYD-106 on GluN1/GluN2C1/GluN2C2 receptors that contained one or two PYD binding sites. The results show that PYD-106 produced similar potentiation of receptors with either one or two viable PYD-106 binding pockets, suggesting that a single molecule of PYD-106 is capable of promoting potentiation when only a single active PYD-106 site is present in diheteromeric GluN1/GluN2C receptors (Fig. 7G). These data indicate that the lack of effect of PYD-106 on GluN1/GluN2A/GluN2C and GluN1/GluN2B/GluN2C receptors reflects a dominant negative action of the GluN2A and GluN2B subunits, rather than the absence of a second PYD binding site. This result is consistent with the conclusion from chimeric studies that regions exist outside the immediate pocket that impact PYD-106 sensitivity, and these are perturbed in triheteromeric receptors.
Structure-Based Screen for GluN2C-Selective Modulators.
One of the goals of an atomic-level understanding of the bioactive ligand-protein interactions is the ability to exploit this understanding to identify novel ligands. We thus devised a high-throughput screening strategy that used similarity searches, docking, and a ligand-based shape and electrostatic screen. We first performed a validation run using ROC to determine how well the shape and electrostatic–based method would be able to distinguish active compounds over inactive compounds. Shape and electrostatic–based ROC queries were generated using three different ligands [PYD-73, -92, -159; Zimmerman et al. (2014)], which were selected because they capture the chemical diversity in the PYD series (Fig. 8). The queries were screened against the PYD series, which yielded ROC scores of between 0.62 (poor) and 0.78 (fair) (Fig. 8). We subsequently tested our screen of the best scoring query against a library containing compounds different from the PYD series as a control to determine how well the shape-based screen would perform in identifying and ranking active compounds. To do this, we generated the conformer pool of two diverse libraries from ChemDiv and Asinex that have previously been screened in vitro against GluN1/GluN2C [57,504 compounds (Zimmerman et al., 2014)] and GluN1/GluN2D receptors [42,660 compounds (Hansen et al. 2010; Mullasseril et al., 2010)]. These are the libraries from which the original hit of the PYD series was identified (Zimmerman et al., 2014). The screen resulted in a perfect ROC score, 1.0 (excellent), consistent with the in vitro screen in which only the hit with selective potentiation of GluN2C [PYD-1; Zimmerman et al. (2014)] was ranked as the top scoring compound (Fig. 8). Moreover, an enrichment plot showed all active compounds were identified within the top 0.01% of the database (Fig. 8D). This result suggests that this approach should identify active compounds resembling the PYD series, if present in the library.
Fig. 8.

ROCS screen and validation run. (A) The ROC curves of shape-based query screened against the PYD series (red) as well as the PYD series and the ChemDiv/Asinex library (CDL, blue). (B) An enrichment plot of PYD series screen is shown. All the active compounds were identified after 80% of the samples were screened. (C) A representation of one of the five shape-based ROCS queries generated. (D) An enrichment plot of PYD series and the CDL library screen. All the active compounds identified after 0.01% (top 100 compounds) of the samples were screened.
A three-dimensional conformer library was generated from compounds identified during similarity searches using compounds PYD-73, -92, and -159 (Zimmerman et al., 2014) as template in both Scifinder and the ZINC All Purchasable subset (∼22 million compounds). The resulting top scoring compounds (∼210,000) were kept. In addition the three-dimensional conformers for the ZINC Drug-like Now subset were generated and combined with the later library [Irwin and Shoichet (2005); 2013 release; ∼8 million compounds]. Each of the five ROCS queries generated in the validation study described above was screened against the three-dimensional conformer database using FastROCS, a program that efficiently screens large three-dimensional conformational libraries (Hawkins et al., 2007). The top 20,000 compounds were kept on the basis of the TanimotoCombo scores (∼0.25% of the database) for each of the five shape-based queries. Duplicates were removed, and the top scoring 20,000 compounds were again kept. The TanimotoCombo score is a combined measure of how well the shape and electrostatics of a molecule matches the queries, a perfect score would be 2.0. The TanimotoCombo scores ranged between 0.51 and 1.61 with a mean 0.65 ± 0.18. These compounds were next docked to the GluN2C structure captured after 3.5 nanoseconds of molecular dynamics, using first the standard precision scoring function. A second round of docking was performed on compounds with docking scores lower than −6.5 kcal/mol (9262 compounds) using the XP scoring functions. The docking scores of the active compound in the PYD series ranged from −8.5 to −10.7 kcal/mol (XP). The resulting binding poses were visually inspected, from which 12 compounds were selected and tested at 100 μM (or at the solubility limit) for effects on GluN1/GluN2C currents activated by maximal concentration of glutamate (100 μM) and glycine (30 μM, Table 3). The 12 compounds selected for testing included compounds closely resembling the PYD scaffold as well as compounds that deviate from it. Four compounds, PYD-181, PYD-182, PYD-183, and PYD-184 showed moderate activity, whereas none of the new scaffolds showed any activity (Table 3). This is perhaps not surprising owing to the flat SAR, which suggested that the scaffold is intolerant to major changes [Zimmerman et al. (2014); Fig. 1; Table 1]. Moreover, the TanimotoCombo scores of the inactive compounds are suboptimal, ranging between 0.51 and 0.65 compared with the active compounds, which range from 1.41 to 1.61, making them the top four scoring compounds. From these results we can conclude that the three-dimensional models are able to enrich for active compounds over inactive compounds when present in a library. The validated three-dimensional model can therefore be used in future studies against directed libraries to explore modification of the PYD scaffold.
TABLE 3 .
ZINC Compounds identified by virtual screening and tested for activity
| IPYD/IControl Mean ± S.E.M. % |
EC50
μM (%)a |
IPYD/IControl
Mean ± S.E.M. % |
EC50
μM (%)a
μM (%)a |
||||||||||
|---|---|---|---|---|---|---|---|---|---|---|---|---|---|
| GluN2A | GluN2B | GluN2C | GluN2D | GluN2C | GluN2A | GluN2B | GluN2C | GluN2D | GluN2C | ||||
| 181c |  |
100 ± 1.5 | 96 ± 0.61 | 114 ± 2.3 | 99 ± 1.1 | N.D. (130) | 187b |  |
97 ± 1.8 | 95 ± 2.6 | 97 ± 1.4 | 94 ± 0.82 | N.D. |
| 182c |  |
96 ± 1.3 | 96 ± 0.93 | 108 ± 2.4 | 97 ± 0.70 | N.D. (114) | 188b |  |
95 ± 1.7 | 92 ± 1.9 | 89 ± 1.2 | 89 ± 0.86 | N.D. |
| 183c |  |
99 ± 4.2 | 96 ± 2.1 | 120 ± 2.2 | 83 ± 0.84 | N.D. (115) | 189b |  |
97 ± 0.56 | 94 ± 1.5 | 93 ± 0.45 | 91 ± 0.90 | N.D. |
| 184c |  |
92 ± 3.9 | 91 ± 1.9 | 134 ± 4.1 | 103 ± 6.1 | 9 (132) | 190d |  |
96 ± 6.2 | 65 ± 1.0 | 71 ± 0.27 | 67 ± 0.78 | N.D. |
| 185d | 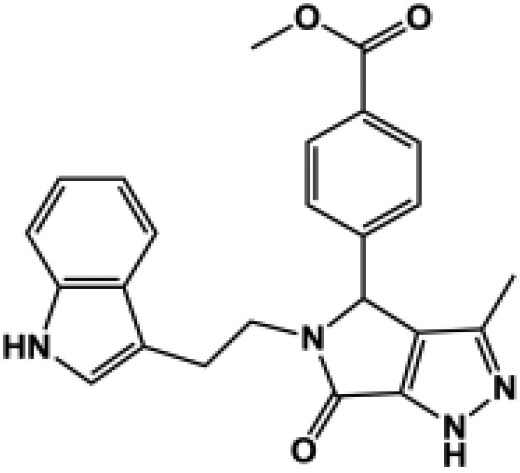 |
97 ± 1.5 | 90 ± 1.5 | 93 ± 0.96 | 76 ± 2.2 | N.D. | 191b |  |
94 ± 1.6 | 94 ± 4.2 | 90 ± 1.4 | 90 ± 0.41 | N.D. |
| 186d |  |
76 ± 5.2 | 55 ± 4.5 | 48 ± 2.5 | 36 ± 1.9 | N.D. | 192c |  |
100 ± 6.9 | 90 ± 0.99 | 85 ± 0.37 | 84 ± 0.52 | N.D. |
All compounds were coapplied with 100 glutamate and 30 μM glycine. The concentration-effect curve was recorded for active compounds and fitted by the Hill equation (see Materials and Methods) to determine the EC50 value; parentheses show the response to 100 μM test compound as a percentage of the response to maximally effective concentrations of glutamate (100 μM) and glycine (30 μM) for compounds tested at multiple concentrations. Compounds were screened at b10 μM, c30 μM, and d100 μM depending on availability and solubility. N.D., not determined. For all compounds, data are from three to 12 oocytes from one to three different frogs.
Discussion
There are three important and novel findings from this study, which built on previous work by Khatri et al. (2014) and Zimmerman et al. (2014) to advance our knowledge of the PYD binding pocket characteristics. First, we combined experimental data and in silico modeling to predict a bioactive ligand-receptor complex of the PYD series of positive allosteric modulators at the diheteromeric GluN1/GluN2C NMDA-Rs. We built a broad range of models to sample the phase space of the pocket, docked to the ensemble collection a series of ligand conformers identified on the basis of solution-NMR analysis, and combined this data with theory to identify the bioactive conformation. We identified a conformer that fits within the pocket in a manner consistent with our understanding of the SAR for this series of compounds and suggests enantiomeric selectivity. Second, we used site-directed mutagenesis and a chimeric strategy to provide strong support that the pocket we modeled does indeed harbor the binding site for PYD series of compounds. Third, we showed that we can transfer the binding pocket from GluN2C to GluN2D and identified additional residues that are critical for the actions of PYD. We have also shown that the binding of a single PYD molecule is sufficient to potentiate NMDA-Rs, suggesting that the lack of effect of PYD on triheteromeric GluN1/GluN2A/GluN2C and GluN1/GluN2B/GluN2C reflects dominant negative actions of the GluN2A (Sun et al., 2017) and GluN2B subunits rather than simply the loss of one PYD binding site. This suggests that triheteromeric receptors will have a unique pharmacology (Hansen et al., 2014; Stroebel et al., 2014).
In the absence of a well defined binding pocket, various techniques can be used to determine the bioactive receptor complex, including docking, induced-fit docking, molecular dynamics, and metadynamics simulations (Shan et al., 2011; Söderhjelm et al., 2012; Clark et al., 2016). The NMDA-R system studied here does not lend itself to the use of long MD simulations owing to its size (3200 amino acids with ∼50,000 atoms). Here we describe an approach to identify the bioactive ligand-receptor complex for a ligand series and a poorly resolved apo binding pocket (resolution > 3 Å). To increase our chance of success, we first reduced the accessible conformational space of the ligand to only the most prevalent conformers in solution using NMR-derived geometric constraints and the NAMFIS algorithm. One of these solution conformers closely represents the bioactive conformer, as shown previously (Snyder et al., 2000; Thepchatri et al., 2005; McCloskey et al., 2009; Danelius et al., 2016). This reduced the possible conformers that needed to be tested computationally for binding to the receptor by ∼130-fold (given exploration of the complete conformer pool). In addition, the solution conformers could be docked rigidly, significantly reducing the docking time. More importantly, the solution conformers provided confidence that the conformers being investigated are closely representative of the bioactive conformer, which in turn facilitates the incorporation of the SAR into pose selection. Receptor flexibility was incorporated next by generation of an ensemble of receptor structures that captured a diverse set of binding pocket conformations. The domain movements between the ATD and ABD were investigated only after the receptor complexes were identified because of the time and geometric scale of the movements highlighted by cryo-EM studies of a different NMDA-R subtype (Tajima et al., 2016; Zhu et al., 2016). A 100-nanosecond full-length MD simulation of both the apo and holo states of diheteromeric structures showed very little change in domain rearrangement (data not presented here), suggesting that much longer simulations will be needed to capture the complete domain movement. However, a comparison of the PYD GluN2C receptor complex and cryo-EM structure of GluN1/GluN2B bound with glutamate and glycine (PDB entry: 5IOU; activated state) revealed modest changes in the PYD pocket region (Supplemental Fig. S9). The modest changes are in contrast to the large domain movements (∼25 Å) observed in the rearrangement of the ATDs that accompany transition from the active to inactive receptor forms, which provides confidence in the binding pocket conformation used in this study that was derived from an inhibited state NMDA-R (Tajima et al., 2016; Zhu et al., 2016). The bioactive receptor complex was determined using the above-discussed techniques and is supported by site-directed mutagenesis. The combination of shape-based and electrostatic models of the ligand combined with the identified bioactive receptor complex resulted in a predictive model that enriches for active over inactive compounds. The model was able to identify four novel potentiators and will be used in future studies in conjunction with specific and directed compound libraries to identify and synthesize potent compounds within the PYD series. Finally, there are at least six allosteric modulation sites on the NMDA receptors, three of which do not have resolved ligand bound (Strong et al., 2014). This method has been shown to be informative and can therefore be used to study and help identify the bioactive pose and to make structure-based drug discovery possible for other compounds series.
This study is consistent with the ATD playing a modulatory role that controls NMDA-R function (Gielen et al., 2009; Yuan et al., 2009). Moreover, the ATD is well known to harbor a site for a negative allosteric modulator selective for GluN1/GluN2B (Karakas et al., 2011) and, thus, is a domain at which exogenous compounds can impact NMDA-R function. The work described here firmly establishes the GluN2 ATD-ABD interface as a specific site for allosteric regulation and highlights key residues that play an essential role in the actions of ligands binding to this site. The ability to transfer this modulatory site to the GluN2D-containing NMDA-R receptors suggests that the mechanisms of action are at least partially shared for this subunit, which shows more sequence similarity (47%) than GluN2A (37%) or GluN2B (37%). The minimal effects of PYD on similar GluN2B/GluN2C chimeric receptors is consistent with the importance of structural determinants outside of the immediate pocket for the subunit-selective actions of the PYD series of compounds. This is supported by the finding that the presence of a different subunit rather than the loss of one binding site eliminates the actions of PYD-106. Other features of GluN2C-containing receptors appear unique, raising the question of whether NMDA-Rs that contain this subunit have distinct structural conformations for some domains that differ from GluN2A, GluN2B, and GluN2D. For example, the ability of several glycine site agonists (Sheinin et al., 2001; Dravid et al., 2010; Maolanon et al., 2017) to enhance activity to levels above those observed for saturating glycine is unique to the GluN2C subunit, and unrelated to the glycine pocket, which resides within the GluN1 subunit. Thus, GluN2C could be a unique pharmacological target for modulation of thalamic and cerebellar circuits, where it is abundantly expressed (Akazawa et al., 1994; Karavanova et al., 2007).
In summary, we have provided structural, pharmacological, and functional data that all argue in support of an allosteric modulatory pocket at the interface between the amino terminal domain and the agonist binding domain on GluN2C. The pocket is absent in GluN1, and appears to require unique features of GluN2C to express modulation when occupied by ligand. This modulatory site could be of therapeutic interest as more potent positive, negative, and neutral ligands are identified that act within this pocket.
Acknowledgments
The authors thank Jing Zhang and Phuong Le for excellent technical assistance.
Abbreviations
- ABD
agonist binding domain
- ATD
amino terminal domain
- ER
endoplasmic reticulum
- MD
molecular dynamics
- NAMFIS
nuclear magnetic resonance analysis of molecular flexibility in solution
- NMDA
N-methyl-d-aspartate
- NMDA-R
N-methyl-d-aspartate receptor
- NOE
nuclear Overhauser effect
- NOESY
nuclear Overhauser effect spectroscopy
- PDB
Protein Data Bank
- PYD-106
methyl 4-(3-acetyl-4-hydroxy-1-(2-(2-methyl-1H-indol-3-yl)ethyl)-5-oxo-2,5-dihydro-1H-pyrrol-2-yl)benzoate
- RMSD
root-mean-square deviation
- ROC
receiver operating characteristic
- SAR
structure-activity relationship
- XP
extra precision
Authorship Contributions
Participated in research design: Kaiser, Menaldino, Liotta, Traynelis. Burger.
Conducted experiments: Burger, Kaiser, Kell, Kusumoto, Shaulsky, Epplin, Strong, Miller, Menaldino.
Contributed new reagents or analytic tools: Kaiser, Burger.
Performed data analysis: Kaiser, Kusumoto, Shaulsky, Traynelis, Burger.
Wrote or contributed to the writing of the manuscript: All authors.
Footnotes
This work was supported by funding from the National Institutes of Health, National Institute of Neurologic Disorders and Stroke [NS036654 and NS065371]. Disclosure: S.F.T. is a consultant for Boehringer-Ingelheim Pharma GmbH and Janssen Pharmaceuticals Inc., a member of the SAB for Sage Therapeutics, and a cofounder of NeurOp Inc. D.C.L. is a member of the board of directors for NeurOp Inc. D.C.L., D.S.M., K.L.S., M.P.E., and S.F.T. are co-inventors on Emory University-owned intellectual property that includes positive allosteric modulators of NMDA receptor function.
 This article has supplemental material available at molpharm.aspetjournals.org.
References
- Acker TM, Yuan H, Hansen KB, Vance KM, Ogden KK, Jensen HS, Burger PB, Mullasseril P, Snyder JP, Liotta DC, et al. (2011) Mechanism for noncompetitive inhibition by novel GluN2C/D N-methyl-D-aspartate receptor subunit-selective modulators. Mol Pharmacol 80:782–795. [DOI] [PMC free article] [PubMed] [Google Scholar]
- Akazawa C, Shigemoto R, Bessho Y, Nakanishi S, Mizuno N. (1994) Differential expression of five N-methyl-D-aspartate receptor subunit mRNAs in the cerebellum of developing and adult rats. J Comp Neurol 347:150–160. [DOI] [PubMed] [Google Scholar]
- Bettini E, Sava A, Griffante C, Carignani C, Buson A, Capelli AM, Negri M, Andreetta F, Senar-Sancho SA, Guiral L, et al. (2010) Identification and characterization of novel NMDA receptor antagonists selective for NR2A- over NR2B-containing receptors. J Pharmacol Exp Ther 335:636–644. [DOI] [PubMed] [Google Scholar]
- Burger PB, Williams M, Sprenger J, Reeksting SB, Botha M, Müller IB, Joubert F, Birkholtz L-M, Louw AI. (2015) A novel inhibitor of Plasmodium falciparum spermidine synthase: a twist in the tail. Malar J 14:54. [DOI] [PMC free article] [PubMed] [Google Scholar]
- Carvill GL, Regan BM, Yendle SC, O’Roak BJ, Lozovaya N, Bruneau N, Burnashev N, Khan A, Cook J, Geraghty E, et al. (2013) GRIN2A mutations cause epilepsy-aphasia spectrum disorders. Nat Genet 45:1073–1076. [DOI] [PMC free article] [PubMed] [Google Scholar]
- Chen W, Shieh C, Swanger SA, Tankovic A, Au M, McGuire M, Tagliati M, Graham JM, Madan-Khetarpal S, Traynelis SF, et al. (2017) GRIN1 mutation associated with intellectual disability alters NMDA receptor trafficking and function. J Hum Genet 62:589–597. [DOI] [PMC free article] [PubMed] [Google Scholar]
- Choi DW. (1992) Excitotoxic cell death. J Neurobiol 23:1261–1276. [DOI] [PubMed] [Google Scholar]
- Cicero DO, Barbato G, Bazzo R. (1995) NMR analysis of molecular flexibility in solution: a new method for the study of complex distributions of rapidly exchanging conformations. Application to a 13-residue peptide with an 8-residue loop. J Am Chem Soc 117:1027–1033. [Google Scholar]
- Clark AJ, Tiwary P, Borrelli K, Feng S, Miller EB, Abel R, Friesner RA, Berne BJ. (2016) Prediction of protein-ligand binding poses via a combination of induced fit docking and metadynamics simulations. J Chem Theory Comput 12:2990–2998. [DOI] [PubMed] [Google Scholar]
- Collingridge GL, Volianskis A, Bannister N, France G, Hanna L, Mercier M, Tidball P, Fang G, Irvine MW, Costa BM, et al. (2013) The NMDA receptor as a target for cognitive enhancement. Neuropharmacology 64:13–26. [DOI] [PMC free article] [PubMed] [Google Scholar]
- Costa T, Constantino LC, Mendonça BP, Pereira JG, Herculano B, Tasca CI, Boeck CR. (2010) N-methyl-D-aspartate preconditioning improves short-term motor deficits outcome after mild traumatic brain injury in mice. J Neurosci Res 88:1329–1337. [DOI] [PubMed] [Google Scholar]
- Coyle JT. (2012) NMDA receptor and schizophrenia: a brief history. Schizophr Bull 38:920–926. [DOI] [PMC free article] [PubMed] [Google Scholar]
- Danelius E, Pettersson M, Bred M, Min J, Waddell MB, Guy RK, Grøtli M, Erdelyi M. (2016) Flexibility is important for inhibition of the MDM2/p53 protein-protein interaction by cyclic β-hairpins. Org Biomol Chem 14:10386–10393. [DOI] [PubMed] [Google Scholar]
- da Silva RA, Degrève L, Caliri A. (2004) LMProt: an efficient algorithm for Monte Carlo sampling of protein conformational space. Biophys J 87:1567–1577. [DOI] [PMC free article] [PubMed] [Google Scholar]
- Dravid SM, Burger PB, Prakash A, Geballe MT, Yadav R, Le P, Vellano K, Snyder JP, Traynelis SF. (2010) Structural determinants of D-cycloserine efficacy at the NR1/NR2C NMDA receptors. J Neurosci 30:2741–2754. [DOI] [PMC free article] [PubMed] [Google Scholar]
- Edgar RC. (2004) MUSCLE: multiple sequence alignment with high accuracy and high throughput. Nucleic Acids Res 32:1792–1797. [DOI] [PMC free article] [PubMed] [Google Scholar]
- Friesner RA, Banks JL, Murphy RB, Halgren TA, Klicic JJ, Mainz DT, Repasky MP, Knoll EH, Shelley M, Perry JK, et al. (2004) Glide: a new approach for rapid, accurate docking and scoring. 1. Method and assessment of docking accuracy. J Med Chem 47:1739–1749. [DOI] [PubMed] [Google Scholar]
- Friesner RA, Murphy RB, Repasky MP, Frye LL, Greenwood JR, Halgren TA, Sanschagrin PC, Mainz DT. (2006) Extra precision glide: docking and scoring incorporating a model of hydrophobic enclosure for protein-ligand complexes. J Med Chem 49:6177–6196. [DOI] [PubMed] [Google Scholar]
- Gielen M, Siegler Retchless B, Mony L, Johnson JW, Paoletti P. (2009) Mechanism of differential control of NMDA receptor activity by NR2 subunits. Nature 459:703–707. [DOI] [PMC free article] [PubMed] [Google Scholar]
- Hackos DH, Hanson JE. (2017) Diverse modes of NMDA receptor positive allosteric modulation: mechanisms and consequences. Neuropharmacology 112 (Pt A):34–45. [DOI] [PubMed] [Google Scholar]
- Hackos DH, Lupardus PJ, Grand T, Chen Y, Wang TM, Reynen P, Gustafson A, Wallweber HJ, Volgraf M, Sellers BD, et al. (2016) Positive allosteric modulators of GluN2A-containing NMDARs with distinct modes of action and impacts on circuit function. Neuron 89:983–999. [DOI] [PubMed] [Google Scholar]
- Halgren TA. (2009) Identifying and characterizing binding sites and assessing druggability. J Chem Inf Model 49:377–389. [DOI] [PubMed] [Google Scholar]
- Hansen KB, Mullasseril P, Dawit S, Kurtkaya NL, Yuan H, Vance KM, Orr AG, Kvist T, Ogden KK, Le P, et al. (2010) Implementation of a fluorescence-based screening assay identifies histamine H3 receptor antagonists clobenpropit and iodophenpropit as subunit-selective N-methyl-D-aspartate receptor antagonists. J Pharmacol Exp Ther 333:650–662. [DOI] [PMC free article] [PubMed] [Google Scholar]
- Hansen KB, Ogden KK, Traynelis SF. (2012) Subunit-selective allosteric inhibition of glycine binding to NMDA receptors. J Neurosci 32:6197–6208. [DOI] [PMC free article] [PubMed] [Google Scholar]
- Hansen KB, Ogden KK, Yuan H, Traynelis SF. (2014) Distinct functional and pharmacological properties of Triheteromeric GluN1/GluN2A/GluN2B NMDA receptors. Neuron 81:1084–1096. [DOI] [PMC free article] [PubMed] [Google Scholar]
- Hansen KB, Traynelis SF. (2011) Structural and mechanistic determinants of a novel site for noncompetitive inhibition of GluN2D-containing NMDA receptors. J Neurosci 31:3650–3661. [DOI] [PMC free article] [PubMed] [Google Scholar]
- Harder E, Damm W, Maple J, Wu C, Reboul M, Xiang JY, Wang L, Lupyan D, Dahlgren MK, Knight JL, et al. (2016) OPLS3: a force field providing broad coverage of drug-like small molecules and proteins. J Chem Theory Comput 12:281–296. [DOI] [PubMed] [Google Scholar]
- Hawkins PCD, Nicholls A. (2012) Conformer generation with OMEGA: learning from the data set and the analysis of failures. J Chem Inf Model 52:2919–2936. [DOI] [PubMed] [Google Scholar]
- Hawkins PCD, Skillman AG, Nicholls A. (2007) Comparison of shape-matching and docking as virtual screening tools. J Med Chem 50:74–82. [DOI] [PubMed] [Google Scholar]
- Hillisch A, Pineda LF, Hilgenfeld R. (2004) Utility of homology models in the drug discovery process. Drug Discov Today 9:659–669. [DOI] [PMC free article] [PubMed] [Google Scholar]
- Hu C, Chen W, Myers SJ, Yuan H, Traynelis SF. (2016) Human GRIN2B variants in neurodevelopmental disorders. J Pharmacol Sci 132:115–121. [DOI] [PMC free article] [PubMed] [Google Scholar]
- Irwin JJ, Shoichet BK. (2005) ZINC--a free database of commercially available compounds for virtual screening. J Chem Inf Model 45:177–182. [DOI] [PMC free article] [PubMed] [Google Scholar]
- Jackson A, Koek W, Colpaert FC. (1992) NMDA antagonists make learning and recall state-dependent. Behav Pharmacol 3:415–421. [DOI] [PubMed] [Google Scholar]
- Kalas V, Pinkner JS, Hannan TJ, Hibbing ME, Dodson KW, Holehouse AS, Zhang H, Tolia NH, Gross ML, Pappu RV, et al. (2017) Evolutionary fine-tuning of conformational ensembles in FimH during host-pathogen interactions. Sci Adv 3:e1601944. [DOI] [PMC free article] [PubMed] [Google Scholar]
- Karakas E, Furukawa H. (2014) Crystal structure of a heterotetrameric NMDA receptor ion channel. Science 344:992–997. [DOI] [PMC free article] [PubMed] [Google Scholar]
- Karakas E, Simorowski N, Furukawa H. (2011) Subunit arrangement and phenylethanolamine binding in GluN1/GluN2B NMDA receptors. Nature 475:249–253. [DOI] [PMC free article] [PubMed] [Google Scholar]
- Karavanova I, Vasudevan K, Cheng J, Buonanno A. (2007) Novel regional and developmental NMDA receptor expression patterns uncovered in NR2C subunit-beta-galactosidase knock-in mice. Mol Cell Neurosci 34:468–480. [DOI] [PMC free article] [PubMed] [Google Scholar]
- Khatri A, Burger PB, Swanger SA, Hansen KB, Zimmerman S, Karakas E, Liotta DC, Furukawa H, Snyder JP, Traynelis SF. (2014) Structural determinants and mechanism of action of a GluN2C-selective NMDA receptor positive allosteric modulator. Mol Pharmacol 86:548–560. [DOI] [PMC free article] [PubMed] [Google Scholar]
- Lakhan SE, Caro M, Hadzimichalis N. (2013) NMDA receptor activity in neuropsychiatric disorders. Front Psychiatry 4:52. [DOI] [PMC free article] [PubMed] [Google Scholar]
- Laskowski RA. (2009) PDBsum new things. Nucleic Acids Res 37:D355–D359. [DOI] [PMC free article] [PubMed] [Google Scholar]
- Lee C-H, Lü W, Michel JC, Goehring A, Du J, Song X, Gouaux E. (2014) NMDA receptor structures reveal subunit arrangement and pore architecture. Nature 511:191–197. [DOI] [PMC free article] [PubMed] [Google Scholar]
- Lemke JR, Lal D, Reinthaler EM, Steiner I, Nothnagel M, Alber M, Geider K, Laube B, Schwake M, Finsterwalder K, et al. (2013) Mutations in GRIN2A cause idiopathic focal epilepsy with rolandic spikes. Nat Genet 45:1067–1072. [DOI] [PubMed] [Google Scholar]
- Lesca G, Rudolf G, Bruneau N, Lozovaya N, Labalme A, Boutry-Kryza N, Salmi M, Tsintsadze T, Addis L, Motte J, et al. (2013) GRIN2A mutations in acquired epileptic aphasia and related childhood focal epilepsies and encephalopathies with speech and language dysfunction. Nat Genet 45:1061–1066. [DOI] [PubMed] [Google Scholar]
- Maolanon AR, Risgaard R, Wang SY, Snoep Y, Papangelis A, Yi F, Holley D, Barslund AF, Svenstrup N, Hansen KB, et al. (2017) Subtype-specific agonists for NMDA receptor glycine binding sites. ACS Chem Neurosci 8:1681–1687. [DOI] [PMC free article] [PubMed] [Google Scholar]
- McCloskey DE, Bale S, Secrist JA, III, Tiwari A, Moss TH, III, Valiyaveettil J, Brooks WH, Guida WC, Pegg AE, Ealick SE. (2009) New insights into the design of inhibitors of human S-adenosylmethionine decarboxylase: studies of adenine C8 substitution in structural analogues of S-adenosylmethionine. J Med Chem 52:1388–1407. [DOI] [PMC free article] [PubMed] [Google Scholar]
- Menniti FS, Pagnozzi MJ, Butler P, Chenard BL, Jaw-Tsai SS, Frost White W. (2000) CP-101,606, an NR2B subunit selective NMDA receptor antagonist, inhibits NMDA and injury induced c-fos expression and cortical spreading depression in rodents. Neuropharmacology 39:1147–1155. [DOI] [PubMed] [Google Scholar]
- Mosley CA, Acker TM, Hansen KB, Mullasseril P, Andersen KT, Le P, Vellano KM, Bräuner-Osborne H, Liotta DC, Traynelis SF. (2010) Quinazolin-4-one derivatives: a novel class of noncompetitive NR2C/D subunit-selective N-methyl-D-aspartate receptor antagonists. J Med Chem 53:5476–5490. [DOI] [PMC free article] [PubMed] [Google Scholar]
- Mullasseril P, Hansen KB, Vance KM, Ogden KK, Yuan H, Kurtkaya NL, Santangelo R, Orr AG, Le P, Vellano KM, et al. (2010) A subunit-selective potentiator of NR2C- and NR2D-containing NMDA receptors. Nat Commun 1:90. [DOI] [PMC free article] [PubMed] [Google Scholar]
- Nicola G, Berthold MR, Hedrick MP and Gilson MK (2015) Connecting proteins with drug-like compounds: open source drug discovery workflows with BindingDB and KNIME. Database (oxford) DOI: 10.1093/database/bav087 [published ahead of print]. [DOI] [PMC free article] [PubMed]
- Ogden KK, Khatri A, Traynelis SF, Heldt SA. (2014) Potentiation of GluN2C/D NMDA receptor subtypes in the amygdala facilitates the retention of fear and extinction learning in mice. Neuropsychopharmacology 39:625–637. [DOI] [PMC free article] [PubMed] [Google Scholar]
- Ogden KK, Traynelis SF. (2011) New advances in NMDA receptor pharmacology. Trends Pharmacol Sci 32:726–733. [DOI] [PMC free article] [PubMed] [Google Scholar]
- Preskorn SH, Baker B, Kolluri S, Menniti FS, Krams M, Landen JW. (2008) An innovative design to establish proof of concept of the antidepressant effects of the NR2B subunit selective N-methyl-D-aspartate antagonist, CP-101,606, in patients with treatment-refractory major depressive disorder. J Clin Psychopharmacol 28:631–637. [DOI] [PubMed] [Google Scholar]
- Sali A, Overington JP. (1994) Derivation of rules for comparative protein modeling from a database of protein structure alignments. Protein Sci 3:1582–1596. [DOI] [PMC free article] [PubMed] [Google Scholar]
- Santangelo Freel RM, Ogden KK, Strong KL, Khatri A, Chepiga KM, Jensen HS, Traynelis SF, Liotta DC. (2013) Synthesis and structure activity relationship of tetrahydroisoquinoline-based potentiators of GluN2C and GluN2D containing N-methyl-D-aspartate receptors. J Med Chem 56:5351–5381. [DOI] [PMC free article] [PubMed] [Google Scholar]
- Seeliger D, de Groot BL. (2010) Conformational transitions upon ligand binding: holo-structure prediction from apo conformations. PLOS Comput Biol 6:e1000634. [DOI] [PMC free article] [PubMed] [Google Scholar]
- Shan Y, Kim ET, Eastwood MP, Dror RO, Seeliger MA, Shaw DE. (2011) How does a drug molecule find its target binding site? J Am Chem Soc 133:9181–9183. [DOI] [PMC free article] [PubMed] [Google Scholar]
- Sheinin A, Shavit S, Benveniste M. (2001) Subunit specificity and mechanism of action of NMDA partial agonist D-cycloserine. Neuropharmacology 41:151–158. [DOI] [PubMed] [Google Scholar]
- Shelley JC, Cholleti A, Frye LL, Greenwood JR, Timlin MR, Uchimaya M. (2007) Epik: a software program for pK( a ) prediction and protonation state generation for drug-like molecules. J Comput Aided Mol Des 21:681–691. [DOI] [PubMed] [Google Scholar]
- Snyder JP, Nevins N, Cicero DO, Jansen J. (2000) The conformations of taxol in chloroform. J Am Chem Soc 122:724–725. [Google Scholar]
- Söderhjelm P, Tribello GA, Parrinello M. (2012) Locating binding poses in protein-ligand systems using reconnaissance metadynamics. Proc Natl Acad Sci USA 109:5170–5175. [DOI] [PMC free article] [PubMed] [Google Scholar]
- Stern P, Béhé P, Schoepfer R, Colquhoun D. (1992) Single-channel conductances of NMDA receptors expressed from cloned cDNAs: comparison with native receptors. Proc Biol Sci 250:271–277. [DOI] [PubMed] [Google Scholar]
- Stroebel D, Carvalho S, Grand T, Zhu S, Paoletti P. (2014) Controlling NMDA receptor subunit composition using ectopic retention signals. J Neurosci 34:16630–16636. [DOI] [PMC free article] [PubMed] [Google Scholar]
- Strong KL, Epplin MP, Bacsa J, Butch CJ, Burger PB, Menaldino DS, Traynelis SF, Liotta DC. (2017) The structure-activity relationship of a tetrahydroisoquinoline class of N-Methyl-d-Aspartate receptor modulators that potentiates GluN2B-Containing N-Methyl-d-Aspartate receptors. J Med Chem 60:5556–5585. [DOI] [PMC free article] [PubMed] [Google Scholar]
- Strong KL, Jing Y, Prosser AR, Traynelis SF, Liotta DC. (2014) NMDA receptor modulators: an updated patent review (2013-2014). Expert Opin Ther Pat 24:1349–1366. [DOI] [PMC free article] [PubMed] [Google Scholar]
- Sun W, Hansen KB, Jahr CE. (2017) Allosteric interactions between NMDA receptor subunits shape the developmental shift in channel properties. Neuron 94:58–64 e53. [DOI] [PMC free article] [PubMed] [Google Scholar]
- Swanger SA, Vance KM, Acker TM, Zimmerman SS, DiRaddo JO, Myers SJ, Bundgaard C, Mosley CA, Summer SL, Menaldino DS, Jensen HS, Liotta DC and Traynelis SF (2017) A novel negative allosteric modulator selective for GluN2C/2D-containing NMDA receptors inhibits synaptic transmission in hippocampal interneurons. ACS Chem Neurosci DOI: 10.1021/acschemneuro.7b00329 [published ahead of print]. [DOI] [PMC free article] [PubMed]
- Tajima N, Karakas E, Grant T, Simorowski N, Diaz-Avalos R, Grigorieff N, Furukawa H. (2016) Activation of NMDA receptors and the mechanism of inhibition by ifenprodil. Nature 534:63–68. [DOI] [PMC free article] [PubMed] [Google Scholar]
- Thepchatri P, Cicero DO, Monteagudo E, Ghosh AK, Cornett B, Weeks ER, Snyder JP. (2005) Conformations of laulimalide in DMSO-d6. J Am Chem Soc 127:12838–12846. [DOI] [PubMed] [Google Scholar]
- Traynelis SF, Wollmuth LP, McBain CJ, Menniti FS, Vance KM, Ogden KK, Hansen KB, Yuan H, Myers SJ, Dingledine R. (2010) Glutamate receptor ion channels: structure, regulation, and function. Pharmacol Rev 62:405–496. [DOI] [PMC free article] [PubMed] [Google Scholar]
- Vance KM, Hansen KB, Traynelis SF. (2012) GluN1 splice variant control of GluN1/GluN2D NMDA receptors. J Physiol 590:3857–3875. [DOI] [PMC free article] [PubMed] [Google Scholar]
- Vicini S, Wang JF, Li JH, Zhu WJ, Wang YH, Luo JH, Wolfe BB, Grayson DR. (1998) Functional and pharmacological differences between recombinant N-methyl-D-aspartate receptors. J Neurophysiol 79:555–566. [DOI] [PubMed] [Google Scholar]
- Williams K. (1993) Ifenprodil discriminates subtypes of the N-methyl-D-aspartate receptor: selectivity and mechanisms at recombinant heteromeric receptors. Mol Pharmacol 44:851–859. [PubMed] [Google Scholar]
- Wyllie DJ, Béhé P, Colquhoun D. (1998) Single-channel activations and concentration jumps: comparison of recombinant NR1a/NR2A and NR1a/NR2D NMDA receptors. J Physiol 510:1–18. [DOI] [PMC free article] [PubMed] [Google Scholar]
- Yuan H, Hansen KB, Vance KM, Ogden KK, Traynelis SF. (2009) Control of NMDA receptor function by the NR2 subunit amino-terminal domain. J Neurosci 29:12045–12058. [DOI] [PMC free article] [PubMed] [Google Scholar]
- Yuan H, Hansen KB, Zhang J, Pierson TM, Markello TC, Fajardo KVF, Holloman CM, Golas G, Adams DR, Boerkoel CF, et al. (2014) Functional analysis of a de novo GRIN2A missense mutation associated with early-onset epileptic encephalopathy. Nat Commun 5:3251. [DOI] [PMC free article] [PubMed] [Google Scholar]
- Zerangue N, Malan MJ, Fried SR, Dazin PF, Jan YN, Jan LY, Schwappach B. (2001) Analysis of endoplasmic reticulum trafficking signals by combinatorial screening in mammalian cells. Proc Natl Acad Sci USA 98:2431–2436. [DOI] [PMC free article] [PubMed] [Google Scholar]
- Zhu S, Stein RA, Yoshioka C, Lee CH, Goehring A, Mchaourab HS, Gouaux E. (2016) Mechanism of NMDA receptor inhibition and activation. Cell 165:704–714. [DOI] [PMC free article] [PubMed] [Google Scholar]
- Zimmerman SS, Khatri A, Garnier-Amblard EC, Mullasseril P, Kurtkaya NL, Gyoneva S, Hansen KB, Traynelis SF, Liotta DC. (2014) Design, synthesis, and structure-activity relationship of a novel series of GluN2C-selective potentiators. J Med Chem 57:2334–2356. [DOI] [PMC free article] [PubMed] [Google Scholar]