

Abstract
Huntington's disease (HD) is a neurodegenerative disorder caused by an expanded CAG trinucleotide repeat in the huntingtin gene (HTT). Molecular chaperones have been implicated in suppressing or delaying the aggregation of mutant Htt. Using in vitro and in vivo assays, we have identified a trimeric chaperone complex (Hsc70, Hsp110, and J‐protein) that completely suppresses fibrilization of HttExon1Q48. The composition of this chaperone complex is variable as recruitment of different chaperone family members forms distinct functional complexes. The trimeric chaperone complex is also able to resolubilize Htt fibrils. We confirmed the biological significance of these findings in HD patient‐derived neural cells and on an organismal level in Caenorhabditis elegans. Among the proteins in this chaperone complex, the J‐protein is the concentration‐limiting factor. The single overexpression of DNAJB1 in HEK293T cells is sufficient to profoundly reduce HttExon1Q97 aggregation and represents a target of future therapeutic avenues for HD.
Keywords: disaggregation, HttpolyQ, molecular chaperones, NPCs, suppression
Subject Categories: Molecular Biology of Disease, Neuroscience, Protein Biosynthesis & Quality Control
Introduction
Huntington's disease (HD) is caused by a CAG trinucleotide repeat expansion in the first exon of the Huntingtin gene (HTT), which renders N‐terminal fragments of the protein (HttQn) aggregation‐prone and ultimately results in β‐sheet formation and amyloid fibrilization. The pathogenic threshold of the polyQ expansion in HTT is 35, and the aggregation propensity correlates with the number of glutamine residues (Scherzinger et al, 1999; Gusella & MacDonald, 2000). The aggregation of HttQn is proteotoxic and is associated with cellular dysfunction and neuronal degeneration (Hoffner et al, 2007). Consequently, the search for factors that interfere with the amyloid formation in particular by suppressing the formation of toxic oligomeric and high molecular weight aggregates such as amyloid fibrils represents an attractive therapeutic strategy. Commonly, in response to protein misfolding and aggregation the cell induces the expression of the proteostasis network (PN) that is composed of proteases, molecular chaperones, and many other proteins (Balch et al, 2008). However, the expression of polyQ proteins fails to induce this network (Bersuker et al, 2013). The expression of HttQn triggers a protein aggregation cascade. Oligomers and protofibrils can act as nuclei (seeds) that induce a conformational switch in soluble monomeric HttQn molecules by primary and secondary nucleation events (Scherzinger et al, 1999; Wetzel, 2012; Kakkar et al, 2016). Moreover, HttQn fibrils sequester aggregation‐prone endogenous proteins and molecular chaperones and also inhibit the ubiquitin proteasome system (Olzscha et al, 2011; Hipp et al, 2012; Kirstein‐Miles et al, 2013; Kim et al, 2016). Such an impairment of the PN leads to further accumulation of misfolded and aggregated proteins that ultimately results in degeneration of the affected neuronal cells (Cicchetti et al, 2011).
Molecular chaperones represent an attractive target to prevent the accumulation of proteotoxic amyloid proteins such as HttQn as demonstrated by recent findings. The first observations that chaperones can to a certain extent decrease the aggregation propensity of HttQn in in vitro assays were obtained using bacterial or yeast Hsp70 and Hsp40 (J‐protein) chaperones, respectively (Muchowski et al, 2000). In vivo, overexpression of Hsp70, J‐protein, Hsp110, or TRiC reduces the aggregation toxicity of Htt in cultured cells, flies, and HD mouse models (Chan et al, 2000; Tam et al, 2006; Kuo et al, 2013; Monsellier et al, 2015; Kakkar et al, 2016). It was also observed that expression of two chaperones (Hsp70/J‐protein or Hsp110/J‐protein) synergistically suppressed Htt aggregation (Kuo et al, 2013). These findings are in agreement with previous reports indicating that these chaperones form functional complexes (Rampelt et al, 2012; Nillegoda et al, 2015) and suggest that they cooperate in vivo to prevent or reverse polyQ aggregation (Chan et al, 2000; Kuo et al, 2013). Despite these efforts, many open questions remain. Are there specific chaperones or chaperone complexes that recognize distinct moieties of misfolded and aggregated Htt? The diversity within the chaperone families increased in the course of evolution (Brehme et al, 2014). A pronounced expansion in the number of distinct chaperones occurred, for example, within the J‐protein family, suggesting an increased functional specialization of chaperones. Do chaperones interfere with the nucleation events of beta‐sheet formation or influence seeding activities? Can chaperones resolubilize Htt once it is assembled into amyloid fibrils?
To address these questions, we set out to gain mechanistic insights into how chaperones maintain and restore the solubility of HttQn in vitro and in vivo. In this study, we demonstrate that a trimeric chaperone complex composed of a member each of the Hsp70, Hsp110, and type B J‐protein family can completely suppress the amyloid fibril formation of HttExon1Q48 and almost completely the fibrilization of HttExon1Q75. We also demonstrate for the first time the disaggregation of HttExon1Q48 fibrils by this trimeric chaperone complex. The composition of the chaperone complex is variable. The combination of different Hsp70 and J‐protein chaperones together with Hsp110 leads to distinct chaperone complexes that exhibit different suppression and disaggregation activities. Depletion of these chaperones in HD patient‐derived neural progenitor cells (NPCs) leads to a pronounced increase in Htt protein aggregates (Q44). We could confirm the importance of Hsc70, HSP‐110, and the J‐protein to maintain the solubility of HttQn and related polyQ proteins on an organismal level in Caenorhabditis elegans. We can show that the J‐protein is the chaperone component whose concentration is most critical in the in vitro assays and exhibited the strongest effect on HttQ44 upon knockdown in the NPCs. Accordingly, overexpression of a specific J‐protein (DNAJB1) can ameliorate the aggregation of HttExon1Q97 in human cell culture.
Results
FRET‐based assay to monitor the fibrilization of HttExon1Q48
To gain mechanistic insight into how molecular chaperones maintain Htt protein species in a soluble state and prevent their self‐assembly into amyloid fibrils, we employed a FRET‐based HttExon1 aggregation assay. The assay is based on GST‐HttExon1Q48 that is fused at the C‐terminus to either CyPet or YPet (Nguyen & Daugherty, 2005). These fluorescent proteins represent a potential FRET pair with CyPet being the donor and YPet the acceptor molecule. The globular GST tag fused to the N‐terminus inhibits the fibril formation of the pathogenic polyQ stretch in the HttExon1 fragment. The cleavage of this tag with the PreScission protease (PreSP) liberates the HttExon1Q48‐CyPet/YPet (from now on referred to as HttExon1Q48) protein and initiates its self‐assembly into fibrils (Fig 1A). In this fibrilized form, the fluorescent fusion proteins come into close proximity that enables the energy transfer from CyPet to YPet. Thus, the FRET efficiency between CyPet and YPet reports on the aggregation status of HttExon1Q48 (Fig 1A).
Figure 1. Trimeric human chaperone complex can suppress the fibrilization of HttExon1Q48 and resolubilize HttExon1Q48 fibrils.
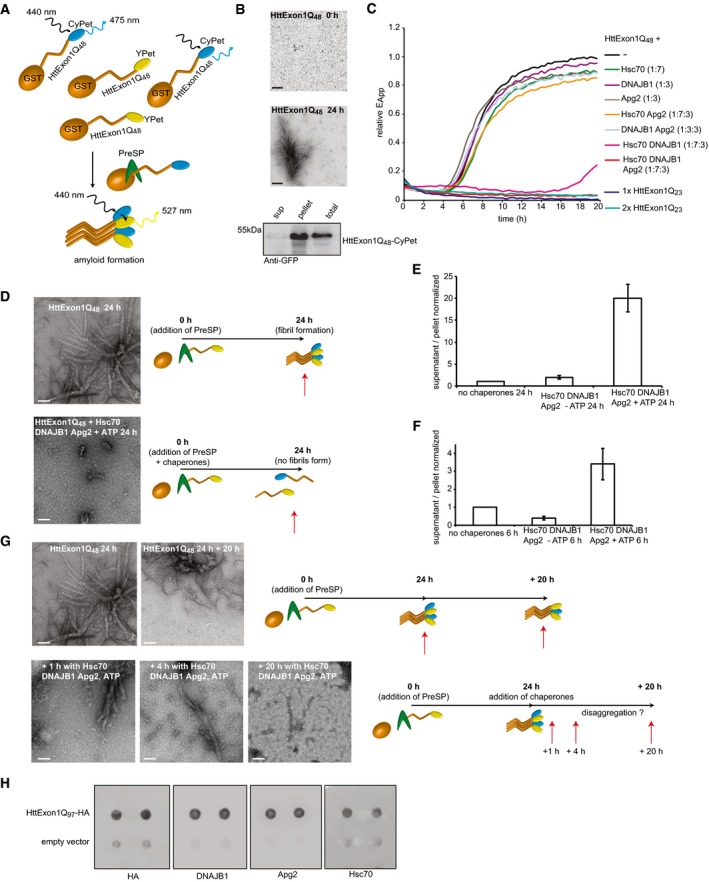
- Scheme of experimental FRET‐based assay for the analysis of fibrilization of HttExon1Q48. In all FRET assays, we use the fluorescently tagged HttExon1Q48‐YPet/CyPet proteins yet refer to them as HttExon1Q48 for clarity.
- TEM images of HttExon1Q48 fibrils at time points 0 and 24 h after addition of PreSP. Analysis of the sedimentation by ultracentrifugation of HttExon1Q48 24 h post‐PreSP treatment is depicted below. The supernatant represents the soluble species and the pellet the insoluble HttExon1Q48 protein. The total depicts a sample before the centrifugation step. Scale bars: 200 nm.
- FRET analysis of HttExon1Q48 fibrilization. The black curve represents the HttExon1Q48‐YPet/CyPet mixtures alone (no chaperone control) in all figures. The relative concentrations of HttExon1Q48 and the chaperones are indicated as ratios in brackets. The first number always refers to HttExon1Q48. The chaperones were added at time point 0 together with HttExon1Q48 and PreSP. The addition of Hsc70, Apg2, and DNAJB1 completely suppresses the fibrilization of HttExon1Q48 (bright red curve). The effect of individual chaperones and chaperone mixtures on the HttExon1Q48 fibrilization is indicated in the figure. The non‐pathogenic HttExon1Q23‐YPet/CyPet mixtures display no FRET post‐PreSP treatment even upon doubling their concentration (dark blue and turquoise curves).
- TEM analysis of the suppression of HttExon1Q48 fibrilization by Hsc70, Apg2, and DNAJB1. A scheme of the experimental outline is depicted on the right. The red arrow refers to the time point of sample analysis. Scale bar: 100 nm.
- Suppression of HttExon1Q48 fibrilization by sedimentation analysis in the absence or presence of Hsc70, Apg2, DNAJB1, and ATP. The values refer to the ratio between the fluorescent signal of HttExon1Q48‐CyPet in the supernatant (soluble) and pellet (aggregated moiety) fraction. Depicted is the average of three independent experiments with error bars representing the standard deviation.
- Sedimentation analysis of the disaggregation of HttExon1Q48 by Hsc70, Apg2, and DNAJB1 in the presence or absence of ATP. Depicted are the ratios of supernatant (soluble) to pellet (aggregated HttExon1Q48). Depicted is the average of three independent experiments with error bars representing the standard deviation.
- TEM analysis of disaggregation of HttExon1Q48 fibrils by Hsc70, Apg2, and DNAJB1. The top left image depicts fibrils after 24 h post‐PreSP treatment and the top right after an additional 20 h without addition of chaperones. The bottom row depicts images of HttExon1Q48 fibrils 24 h post‐PreSP + 1 h (left), 4 h (middle), and 20 h (right) in the presence of Hsc70, Apg2, DNAJB1, and ATP. A scheme of the experimental outline is depicted on the right. The red arrow refers to the time point of sample analysis. Scale bar: 100 nm.
- Filter retardation analysis of HttExon1Q97‐HA aggregates. Lysates of HEK293T cells expressing HttExon1Q97‐HA were probed on the filter membrane with antibodies against HA (HttExon1Q97), DNAJB1, Apg2 (Hsp110), and Hsc70 to detect their association with the respective chaperones (second to fourth membranes) and to confirm the presence of the HttExon1Q97 aggregates (first membrane). Lysates were spotted on the filter in duplicates, and the bottom row depicts the control (cells that do not express HttExon1Q97‐HA).
We additionally used transmission electron microscopy (TEM) analysis to monitor the aggregation of the HttExon1Q48 proteins in vitro. Images taken 24 h post‐PreSP treatment of tagged and untagged HttExon1Q48 proteins show fibrilization of the Htt proteins and validate amyloid formation. Furthermore, they demonstrate that the fluorescent tags do not interfere with amyloid formation (Figs 1B and EV1A). Using the FRET‐based Htt fibrilization assay, we observed an initial decrease in FRET efficiency that accounts for the monomerization of the GST‐tagged Htt proteins. After a lag phase of about 3 h, the FRET efficiency sharply increases, reflecting the fibrilization process (elongation phase). The FRET signal reaches a plateau within the next 2 h and remains there for the entire duration of the experiment (Fig 1C; black curve). TEM analysis of samples of the plateau phase shows only fibrilized Htt that can be sedimented with ultracentrifugation (Fig 1B), indicating that HttExon1Q48 is converted into amyloid fibrils. We used a sedimentation approach to further validate the time course of fibrilization. For that, we used the CFP fluorescence of HttExon1Q48‐CyPet as readout for the abundance of the protein in the soluble and insoluble fractions and could confirm the aggregation of HttExon1Q48 at the respective time points post‐PreSP treatment (Fig EV1B), mirroring the FRET fibrilization curve (Fig 1C; black curve). As a control, we employed HttExon1Q23‐CyPet/YPet constructs whose polyQ length is below the pathogenic threshold of 35Q residues required to form Htt fibrils. As expected, the HttExon1Q23‐CyPet/YPet proteins do not exhibit any FRET upon PreSP treatment even when we doubled the HttExon1Q23 concentration (Fig 1C; dark blue and turquoise curves). Taken together, we conclude that the FRET assay provides a quantitative and reliable method to monitor the fibrilization of HttExon1Q48.
Figure EV1. Controls for Htt fibrilization and the kinetics, point mutations in HSP‐1 and HSP‐110, and analysis of ATPase rates of HSP‐70s and HSP‐110.
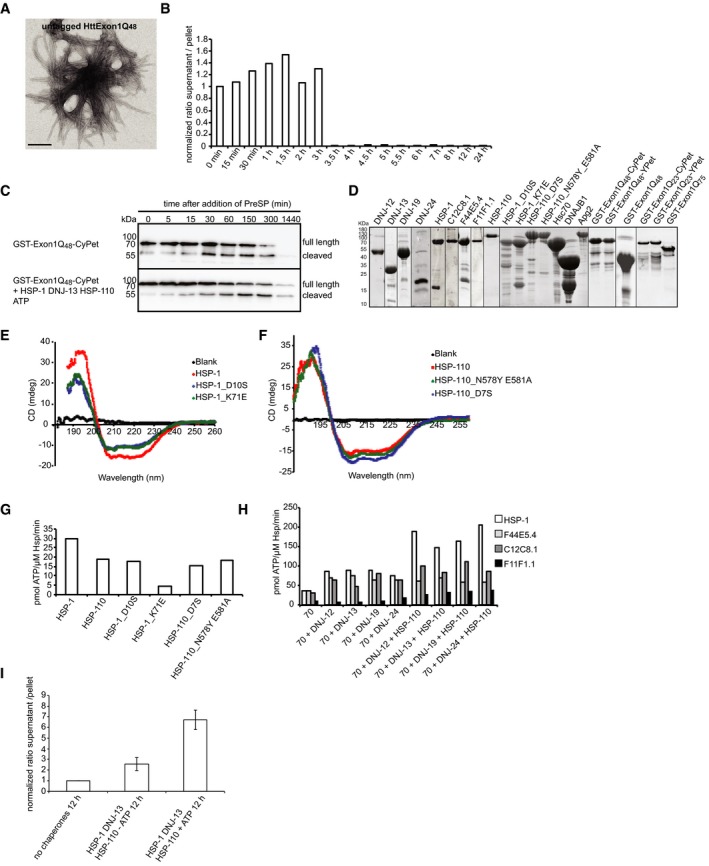
- TEM image of untagged HttExon1Q48 24 h post‐PreSP treatment. Scale bar: 200 nm.
- Sedimentation analysis of the kinetics of HttExon1Q48‐CyPet fibrilization. Depicted are the ratios of the supernatant (soluble HttExon1Q48‐CyPet) and the pellet (insoluble, aggregated HttExon1Q48‐CyPet) at the indicated time points. The graph shows the average of two independent analyses.
- Analysis of the GST‐cleavage reaction of GST‐HttExon1Q48 via SDS–PAGE in the presence (bottom) and absence (top) of HSP‐1, DNJ‐13, and HSP‐110. The time points are indicated on top, and the migration of the full‐length and cleaved GST‐HttExon1Q48 protein is indicated on the right.
- SDS–PAGE and Coomassie staining of all purified proteins used in this study.
- CD analysis of HSP‐1 (red) and the point mutants HSP‐1_D10S (blue) and HSP‐1_K71E (green) and the blank control (black).
- CD analysis of HSP‐110 (red) and the point mutants HSP‐110_D7S (blue) and HSP‐110_N578Y/E581A (green) and the blank control (black).
- Basal ATPase rates of HSP‐1 and HSP‐110 and its point mutants. The ATPase rate is indicated on the y‐axis in pmol ATP/μM Hsp/min (N = 2).
- ATPase rates of the Hsp70s: HSP‐1 (white), F44E5.4 (light gray), C12C8.1 (dark gray), and F11F1.1 (black) alone and in the presence of the DNJ proteins, DNJ‐12, DNJ‐13, DNJ‐19, and DNJ‐24 (N = 2).
- Sedimentation analysis of disaggregation of HttExon1Q48 fibrils by HSP‐1, HSP‐110, and DNJ‐13 in the presence or absence of ATP after 12 h. Depicted are the ratios of the supernatant (soluble HttExon1Q48) and the pellet (insoluble, aggregated HttExon1Q48). The error bars represent the standard deviation of three independent experiments (N = 3).
A distinct trimeric chaperone complex completely suppresses and reverses HttExon1Q48 fibril formation
Recently, a metazoan disaggregation complex was identified that has the capacity to disaggregate amorphous aggregates as well as α‐synuclein fibrils in vitro (Rampelt et al, 2012; Gao et al, 2015; Nillegoda et al, 2015). Disaggregation in higher eukaryotes requires a member of the Hsp70 chaperone family, a corresponding J‐protein and a member of the Hsp110 protein family (Rampelt et al, 2012). Complete suppression of amyloid fibril formation has not been demonstrated yet. Therefore, we set out to first test the ability of human chaperones to suppress the formation of HttExon1Q48 amyloid fibrils by using the aforementioned FRET‐based aggregation assay. First, we analyzed human chaperones that exhibited in vitro disaggregation activity for α−synuclein fibrils (Gao et al, 2015). This included the constitutive Hsc70 protein, the Hsp110 protein Apg2, and the class B J‐protein DNAJB1. All chaperones were purified without additional tags. The purities of all chaperones and HttExon1Qn variants used in this study were assessed by SDS–PAGE and Coomassie staining (Fig EV1D). We then mixed HttExon1Q48 with the respective chaperones just prior to PreSP treatment. The addition of individual chaperones did not affect the fibrilization kinetics of HttExon1Q48 (Fig 1C). The proteins Hsc70 and DNAJB1 together, however, suppressed the aggregation of HttExon1Q48 for about 15 h. The additional presence of Apg2 (Hsp110) led to a complete suppression of HttExon1Q48 fibrilization for the entire duration of the experiment (20 h; red curve). We refer from now on only to a complete suppression if the chaperones fully inhibit any FRET signal of the HttExon1Q48‐CyPet/YPet pair over the complete time period of the experiment that lasts usually between 20 and 30 h. The three chaperones functionally cooperate to suppress the HttExon1Q48 fibrilization and are from now on referred to as chaperone complex. The full suppression of aggregation required ATP and a sevenfold excess of Hsc70 over HttExon1Q48 protein. The ideal ratio between the chaperones Hsc70:DNAJB1:Apg2 for this activity is 2:1:1 (Fig 1C and data not shown). We confirmed the suppression of fibrilization by TEM and sedimentation analyses (Fig 1D and E). We analyzed the GST‐cleavage reaction in a time course reaction in the presence and absence of the chaperones to exclude the possibility that the addition of the chaperones might inhibit or delay the PreSP cleavage reaction that liberates the HttExon1Q48 from the GST tag. Importantly, we did not observe an adverse effect of the chaperones on the GST‐cleavage reaction (Fig EV1C). Next, we asked if the same chaperone complex could also disaggregate preformed HttExon1Q48 fibrils. We incubated Hsc70, Apg2, and DNAJB1 and ATP with HttExon1Q48 fibrils and analyzed samples after 1, 4, and 20 h by TEM. As can be seen in Fig 1G, the addition of the chaperones results in a decrease in fibrils over time. No fibrillar structures were visible at the 20‐h time point. We confirmed the TEM data of the disaggregation using first a sedimentation analysis of HttExon1Q48 in the presence or absence of chaperones and ATP (Fig 1F) and second by using a filter retardation analysis that allows the detection of SDS‐resistant amyloid proteins (Fig 4E). Taken together, these studies show that the chaperone complex Hsc70, Apg2, and DNAJB1 can suppress and reverse the aggregation of HttExon1Q48 in vitro. To demonstrate a physical interaction of all three chaperones with the aggregated Htt moiety, HttExon1Q97‐HA aggregates from HEK293T cells were isolated via a filter retardation assay and probed with antibodies against Hsc70 (HSPA8), DNAJB1 and Apg2 (HSPA4). All three chaperones were found to be associated with the aggregated HttExon1Q97‐HA moiety isolated from HEK293T cells (Fig 1H).
Figure 4. Colocalization of chaperones with HttExon1Q48 aggregates in vitro and in vivo .
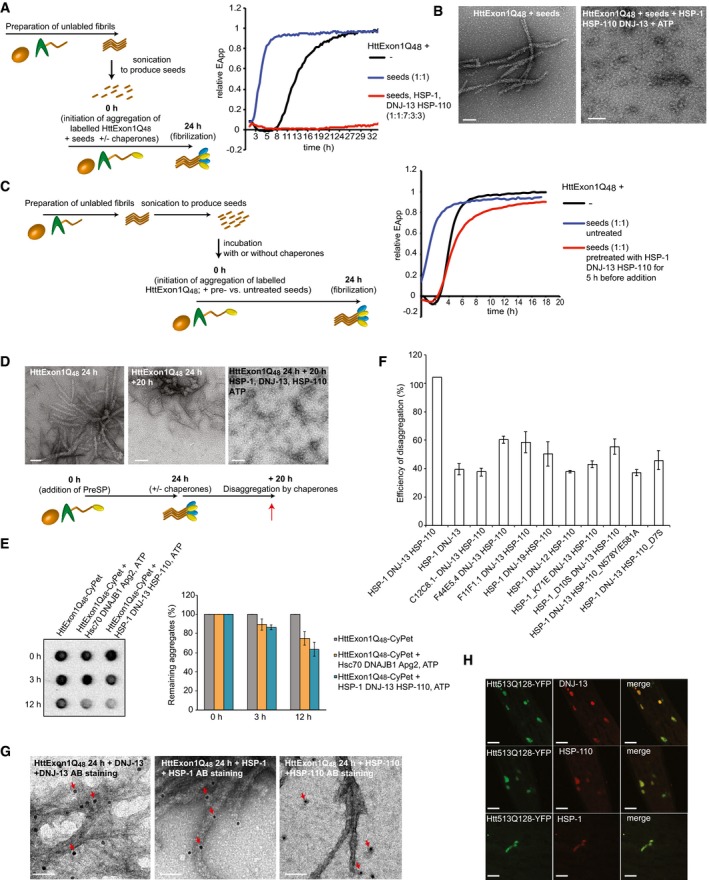
- A scheme of the experimental outline is depicted on the left. On the right, FRET assay of Htt fibrilization in the presence of Htt seeds (blue), in the presence of Htt seeds + HSP‐1, HSP‐110, and DNJ‐13 (red) and the control (black).
- TEM analysis of (A). Scale bars: 100 nm.
- A scheme of the experimental outline is depicted on the left. On the right, FRET assay of suppression of fibrilization in the presence of seeds (blue) and seeds that were incubated with the chaperones for 5 h prior to initiation of FRET assay (red). The control is depicted in black.
- TEM analysis of disaggregation of HttEx1Q48 fibrils. On the left: HttExon1Q48 fibrils 24 h post‐PreSP treatment (t = 0 h; same image as depicted in Figs 1D and G, and 2C); middle: HttExon1Q48 fibrils at t = 20 h; right: disaggregation of HttExon1Q48 fibrils by nematode chaperones (HSP‐1, HSP‐110, DNJ‐13, ATP) t = 20 h. A scheme of the experimental outline is depicted below. Scale bars: 100 nm.
- Filter retardation analysis of the disaggregation of HttExon1Q48 fibrils by human (Hsc70, DNAJB1, Apg2; middle row) and nematode chaperones (HSP‐1, DNJ‐13, HSP‐110; right row). The control (absence of chaperones) is depicted on the left. The time points of analysis are indicated on the left side. A quantification of the disaggregation reaction is depicted in the graph on the right (N = 3). All signals were normalized to the control. Error bars represent the standard deviation.
- Disaggregation analysis of HttExon1Q48 fibrils by a sedimentation analysis using the CyPet signal as readout for the moieties of the supernatant and pellet fraction. All data were normalized to the control (absence of chaperones). The chaperone mixtures that were analyzed are indicated on the x‐axis (N = 5). Error bars represent the standard deviation.
- TEM analysis of the interaction of individual chaperones with HttExon1Q48 fibrils by immunostaining. HttExon1Q48 fibrils were incubated for 1 h with the individual chaperones, and the interaction of the chaperones was analyzed by immunostaining using the respective antibodies; left: DNJ‐13, middle: HSP‐1, and right: HSP‐110. Scale bars: 50 nm. The red arrows mark the positive immunogold labeling.
- In vivo colocalization of DNJ‐13, HSP‐1, and HSP‐110 with Htt513Q128‐YFP. Htt513Q128‐YFP‐expressing nematodes were immunostained with the antibodies against DNJ‐13 (top row), HSP‐1 (middle row), and HSP‐110 (bottom row). Depicted are head regions of the nematode. Scale bars: 20 μm.
Suppression of HttExon1Q48 fibrilization is conserved in metazoan
For the subsequent studies, we employed the C. elegans orthologs of the three human chaperones HSP‐1 (Hsc70), HSP‐110 (Apg2), and DNJ‐13 (DNAJB1) as these proteins allow us to complement the in vitro data with in vivo analyses of suppression and disaggregation of HttQn in a living animal. This is of particular importance as Huntington's disease is a late onset neurodegenerative disease and the chaperone capacity to maintain Htt proteins soluble can be studied in an aging animal model such as C. elegans (Morley et al, 2002; Kirstein et al, 2015). The chaperome of C. elegans is of similar complexity as the human chaperone, yet has the advantage of encoding only one cytosolic HSP‐110 protein that allows depletion of disaggregase activity by RNAi‐mediated knockdown of a single gene (Table EV1; Nikolaidis & Nei, 2004; Rampelt et al, 2012; Brehme et al, 2014).
As observed for the human chaperones (Fig 1C), incubation of HttExon1Q48 with the individual nematode orthologous chaperones, HSP‐1 (Hsc70), HSP‐110 (Apg2), and DNJ‐13 (DNAJB1) alone, did not affect the aggregation kinetics (Fig 2A). However, when HSP‐1 and DNJ‐13 were added together to HttExon1Q48 monomers, we detected a strong delay and overall decrease in fibrilization. The additional presence of HSP‐110 led to a complete suppression of HttExon1Q48 fibrilization (Fig 2A) similar to the human proteins (Fig 1C). The suppression requires an excess of chaperones over HttExon1Q48 proteins and complete suppression could be observed at a HSP‐1:HttExon1Q48 (monomer) 3.5:1 ratio or higher and is thus more efficient compared to the human chaperones that require an excess of Hsc70:HttExon1Q48 of 7:1 (Figs 1C, and 2A and B). The optimal ratio between the chaperones HSP‐1:DNJ‐13:HSP‐110 is 2:1:1 (Fig 2B). Interestingly, sub‐stoichiometric chaperone concentrations of HSP‐1 and HSP‐110 can be tolerated if DNJ‐13 is present in excess (Fig 2B; compare orange with pink curve). TEM analysis revealed that in the presence of HSP‐1, HSP‐110, DNJ‐13, and ATP, no fibrils or any other larger assemblies can be detected, which confirms the data obtained with the FRET assay (Fig 2A and C). Next, we wanted to test if the three chaperones could also suppress the aggregation of HttExon1 harboring a longer polyQ stretch. For that, we analyzed the aggregation of HttExon1Q75 in the presence and absence of the three chaperones over a time course of 0, 5, and 24 h using a filter retardation assay as readout. Indeed, HSP‐1, DNJ‐13, and HSP‐110 could in addition to HttExon1Q48 also almost completely suppress the aggregation of HttExon1Q75 (Fig 2D).
Figure 2. Mechanistic insights into the chaperone‐mediated suppression of HttExon1Q48 fibrilization by nematode chaperones.
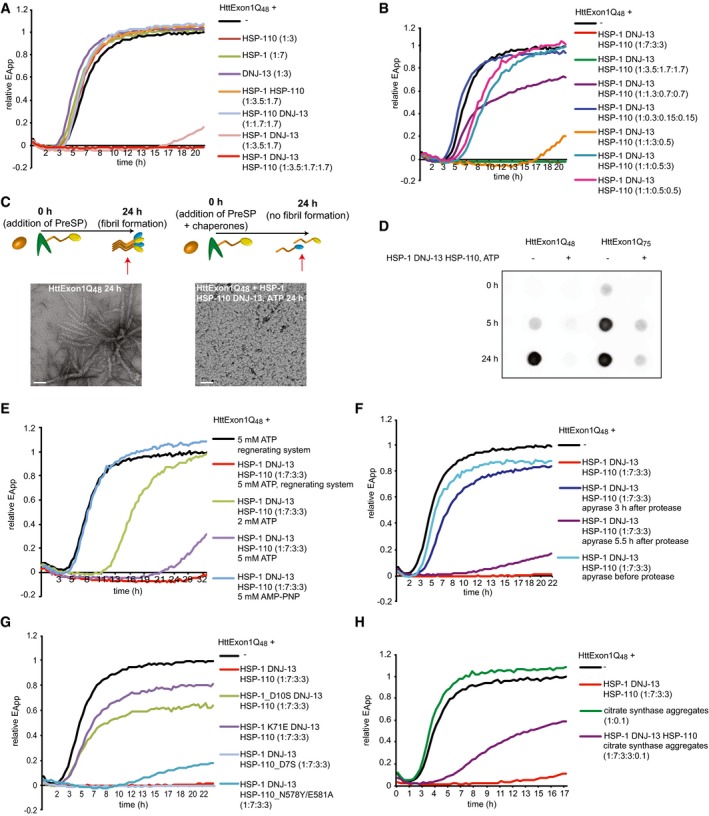
- FRET analysis of the suppression activity of individual nematode chaperones and chaperone complexes of the fibrilization of HttExon1Q48. HSP‐1, HSP‐110, and DNJ‐13 completely suppress the fibrilization analogous to the human orthologs (bright red curve; compare with Fig 1C).
- Analysis of various chaperone:HttExon1Q48 ratios and effect on suppression efficiency.
- TEM analysis of suppression of HttExon1Q48 fibrilization by HSP‐1, HSP‐110, and DNJ‐13 taken 24 h post‐PreSP treatment (right image; same as image depicted in Fig 1D). The control in the absence of chaperones is shown on the left. A scheme of the experimental outline is depicted above, and the red arrow refers to the time point of sample analysis. Scale bars: 100 nm.
- Analysis of chaperone‐mediated suppression of HttExon1Q48 (left) and HttExon1Q75 (right) by a filter retardation analysis using an Htt antibody. Time points of analysis are indicated on the left and the absence or presence of chaperones on top of the filters.
- Analysis of the effect of varying concentrations of ATP and the non‐hydrolyzable analog, AMP‐PNP on the chaperone‐mediated suppression of the fibril formation of HttExon1Q48.
- Addition of apyrase inhibits the suppression activity of the chaperones in a time‐dependent manner. Addition of apyrase before PreSP treatment (light blue), 3 h (dark blue), or 5.5 h (purple) after PreSP treatment affects the chaperone‐mediated suppression to a different extent.
- Single point mutations in HSP‐1 that diminish the ATPase activity, D10S (green curve), and K71E (purple), yet not in HSP‐110_D7S (light blue) negatively affect the suppression activity. The NEF mutant: HSP‐110_N578/E581A (turquoise) negatively affects the suppression activity of the chaperones.
- Analysis of chaperone‐mediated suppression of HttExon1Q48 fibrilization in the presence of citrate synthase (CS) aggregates. The addition of CS aggregates to the HttExon1Q48 proteins alone depicted in green does not affect the fibrilization kinetics of HttExon1Q48. Yet, the addition of CS to a sample containing HttExon1Q48 and HSP‐1, HSP‐110+ DNJ‐13 diminishes the suppression activity of the chaperones (purple curve). The sample containing the chaperone mixture with HttExon1Q48 is depicted in red.
Suppression of HttExon1Q48 requires ATP hydrolysis by HSP‐1 and the NEF activity of HSP‐110
The observation that HSP‐110 is required for a complete suppression argues for an ATPase cycle‐dependent chaperone activity to suppress the fibril formation of HttExon1Q48. Thus, we analyzed the suppression of HttExon1Q48 in the presence of either ATP or the non‐hydrolyzable ATP analog AMP‐PNP. AMP‐PNP binding locks Hsp70 in an open conformation with a high on and off rate for substrate binding yet prevents ATP‐hydrolysis reactions (Gao et al, 1994). Notably, AMP‐PNP did not support the suppression arguing for an ATP‐hydrolysis‐dependent mechanism (Fig 2E; light blue curve).
Next, we titrated the amount of ATP and used either 2 or 5 mM with an ATP regeneration system (PK and PEP) to replenish converted ATP (to ADP) back to ATP. The presence of 2 mM ATP supported the HSP‐1/HSP‐110/DNJ‐13‐mediated suppression of HttExon1Q48 for 11 h, and the addition of 5 mM for 24 h and the additional presence of the regeneration system extended the suppression period to 30 h (Fig 2E; compare green, purple and red curves). These findings indicate that chaperone‐mediated suppression of polyQ‐mediated Htt fibril formation requires the consumption of ATP.
We then analyzed the suppression activity in the presence of apyrase that hydrolyzes ATP to AMP and inorganic phosphate and thereby immediately depletes the ATP pool. Addition of apyrase before initiating the Htt fibrilization by adding PreSP immediately before adding the chaperones completely prevents any suppression activity (Fig 2F; light blue). Addition of apyrase 3 h after the treatment with PreSP almost completely abolished the suppression activity of the chaperones (Fig 2F; dark blue). This is the critical time point of the transition between the lag and the log phase of the fibrilization kinetics (Fig 2A). The addition of apyrase at a later time point (5 h), when the chaperones are probably completely bound to the HttExon1Q48 moiety and suppressed the fibrilization, however only delayed a regain of FRET efficiency and kept it at low levels (0.2 relative EApp; purple curve in Fig 2F). The availability of ATP is thus a time‐critical variable in the chaperone‐mediated suppression of Htt amyloid formation. To further analyze the ATP requirements, we created point mutations in HSP‐1 and HSP‐110 that abrogate or reduce ATP‐hydrolysis rates in the respective chaperone (Wilbanks et al, 1994; O'Brien et al, 1996). We confirmed the diminished ATPase activity in ATPase assays (Fig EV1G) and demonstrate that the point mutations do not affect the fold/secondary structure of the proteins as assessed by circular dichroism (CD) analysis (Fig EV1E and F). Interestingly, both point mutations of HSP‐1 (D10S and K71E) were severely impaired in the suppression of HttExon1Q48 fibril formation, whereas the ATPase mutant D7S of HSP‐110 did not affect the suppression of HttExon1Q48 amyloid formation (Fig 2G). Thus, we conclude that the ATP consumption is due to the ATPase activity of HSP‐1 and that the ATPase activity of HSP‐110 (Fig EV1G) does not contribute to the chaperone activity of the HSP‐1/HSP‐110/DNJ‐13 protein complex in suppressing Htt fibril formation. Mutating the nucleotide exchange factor (NEF) function of HSP‐110 (HSP‐110_N578Y/E581A) leads to an incomplete suppression that resembles the suppression of Htt fibrilization by HSP‐1 and DNJ‐13 alone (Fig 2A, light red and G, blue). Thus, the NEF activity of HSP‐110 is essential for the suppression of Htt fibrilization together with HSP‐1 and DNJ‐13.
Competition with other chaperone substrates reduces suppression efficiency
Our findings of the concentration‐dependent suppression of HttExon1Q48 fibril formation (Fig 2B) suggest that available cellular chaperone concentrations are critical and might become limiting under conditions that cause endogenous proteins to unfold or misfold such as aging or proteotoxic stress. To test chaperone competition in the in vitro FRET assay, we used aggregated citrate synthase (CS) as model chaperone substrate as the aggregates are of amorphous nature and therefore resemble protein aggregates formed in response to stress (Buchner et al, 1998). First, we established that the presence of CS aggregates does not interfere with the fibrilization of HttExon1Q48 (Fig 2H; green vs. black curve). Yet, the additional presence of CS aggregates in the sample containing the chaperone mixture showed that the chaperones were severely affected in the suppression of HttExon1Q48 fibrilization (Fig 2H; purple vs. red curve). These data suggest that indeed the chaperones are titrated away by the CS aggregates and become limiting to attend to the aggregation‐prone HttExon1Q48 protein moiety.
Hsc70 chaperone complexes are more potent in the suppression of HttExon1Q48 fibrilization than HSP‐70 chaperone complexes
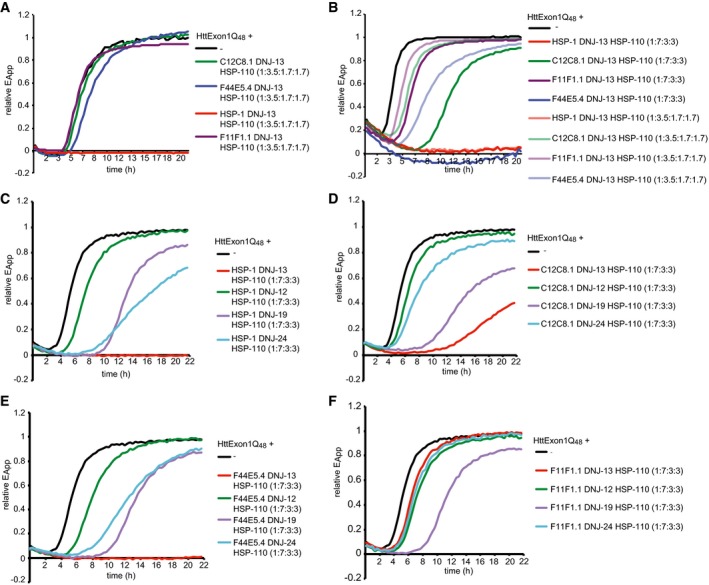
The genome of C. elegans harbors genes encoding for four HSP‐70, one HSP‐110, but 25 J‐proteins for expression in the cytosol alone (Table EV1). The high abundance of HSP‐70 proteins and in particular of J‐proteins poses the question as to which chaperones cooperate to support the suppression of HttExon1Q48 fibril formation. We first set out to test all three stress‐inducible HSP‐70 proteins in combination with HSP‐110 and DNJ‐13 in comparison with the constitutive Hsc70 (HSP‐1) protein. Surprisingly, we did not observe suppression activity of the stress‐inducible HSP‐70s that even remotely resemble the activity by the constitutive Hsc70 (HSP‐1; Fig 3A). We, however, detected a slight shift to the right for F44E5.4 (blue), suggesting a delay of fibril formation and wondered if higher chaperone concentrations could further delay or even suppress the HttExon1Q48 fibril formation. Upon doubling the chaperone concentrations (for all three chaperones) to achieve a ratio of HttExon1Q48:HSP‐70:DNJ‐13:HSP‐110 = 1:7:3:3, we could indeed observe a complete suppression of HttExon1Q48 fibril formation for the inducible HSP‐70 protein F44E5.4 together with HSP‐110 and DNJ‐13 (Fig 3B; compare light with dark blue curve). For the other two inducible HSP‐70s, C12C8.1 and F11F1.1, we could observe a pronounced shift of the FRET curves to the right, demonstrating a delay in the fibril formation with the higher chaperone concentration (Fig 3B; compare light with corresponding dark colored curves). Thus, the inducible HSP‐70s can promote the suppression of Htt fibrilization if they are provided in excess.
Figure 3. Constitutive Hsc70 is more potent than the inducible Hsp70s in the suppression of HttExon1Q48 fibrilization.
-
AFRET assay of varying HSP‐70 combinations. HSP‐110 and DNJ‐13 are kept constant in all samples and the addition of HSP‐1 (red) shows complete suppression, whereas in combination with C12C8.1 (green) or F11F1.1 (purple) no suppression occurs and only a slight delay of fibril formation in combination with F44E5.4 (blue).
-
BFRET assay using two different ratios between HttExon1Q48 and the chaperones. Chaperones were either used in the ratios as in Figs 1C and 2A (HttExon1Q48:HSP‐1/HSP‐70s:DNJ‐13:HSP‐110 = 1:3.5:1.7:1.7) and represented in light colors or used in double concentrations (1:7:3:3) represented in dark colors. HSP‐110 and DNJ‐13 in combination with HSP‐1 (red) with F44E5.4 (blue), C12C8.1 (green), and F11F1.1 (purple).
-
C–FFRET analysis of HttExon1Q48 fibrilization with varying J‐protein combinations of HSP‐1 (C), C12C8.1 (D), F44E5.4 (E), and F11F1.1 (F) with HSP‐110. Additions of J‐proteins are depicted in all graphs as follows: DNJ‐13 (red), DNJ‐24 (light blue), DNJ‐19 (purple), and DNJ‐12 (green).
Preference for a specific J‐protein partner by HSP‐70s
As demonstrated in Fig 2B, the J‐protein is the limiting chaperone in the suppression of HttExon1Q48 fibrilization. We thus wondered which J‐protein is the preferred cochaperone for each of the HSP‐70s in supporting the suppression of HttExon1Q48 fibrilization. To address this question, we systematically analyzed combinations of the HSP‐70 proteins HSP‐1, F44E5.4, C12C8.1, and F11F1.1 with members of the class A (DNJ‐12 and DNJ‐19 that represent all cytosolic class A J‐proteins) and two class B (DNJ‐13 and DNJ‐24) J‐proteins. C. elegans encodes for only one HSP‐110 protein in the cytosol, which was thus kept constant in all experiments. Interestingly, each HSP‐70 protein displays a preference for its cooperation with a J‐protein in the suppression assay (Fig 3C–F). The proteins HSP‐1 and HSP‐110 together with DNJ‐13 completely suppressed HttExon1Q48 fibril formation. However, HSP‐1 and HSP‐110 together with DNJ‐24, DNJ‐19, or DNJ‐12 could only delay fibril formation (Fig 3C). The stress‐inducible F44E5.4 protein is the only other HSP‐70 that, together with DNJ‐13 and HSP‐110, can fully suppress HttExon1Q48 fibril formation (Fig 3E). Interestingly, the preference of the HSP‐70s for a partner J‐protein in the suppression of Htt amyloid formation differs among the HSP‐70s. For instance, whereas DNJ‐13 is the preferred J‐protein for HSP‐1, F44E5.4, and C12C8.1, it does not seem to support F11F1.1 in its chaperone activity to affect HttExon1Q48 fibrilization (Fig 3C–F). We wondered if the basis for the preferred J‐protein partner for each of the HSP‐70s is attributed to the induction of the ATPase activity by the different J‐proteins. The ATPase activity of all HSP‐70s is induced by any of the tested J‐proteins in vitro (Fig EV1H). We analyzed various combinations and observed no major differences of the stimulation of the ATP‐hydrolysis rate of the HSP‐70s by the J‐proteins DNJ‐12, DNJ‐13, DNJ‐19, or DNJ‐24 (Fig EV1H). The ATPase activity is further stimulated by the presence of HSP‐110. To exclude that the ATPase activity of HSP‐110 itself accounts for the increase in ATP hydrolysis, we analyzed the basal ATPase activity of HSP‐110 and upon addition of the J‐proteins. However, we observed only a slight induction of the very low basal ATPase activity of HSP‐110 (Fig EV1G and data not shown). Notably, we did not observe a stimulation of the HSP‐70 ATP‐hydrolysis rate in the presence of the Htt fibrils (data not shown). Importantly, although all tested J‐proteins can stimulate the ATPase activity of all HSP‐70s, the rates differ substantially. The steady state ATP‐hydrolysis rate of HSP‐1, HSP‐110, and any J‐protein is with 200 pmol ATP/μM HSP‐1/min on average twice as high as those of the stress‐inducible HSP‐70s in combination with a J‐protein and HSP‐110. (Fig EV1H). This difference in ATP hydrolysis might account for the observed variations in the HttExon1Q48 suppression efficiencies (Fig 3A and B). Taken together, the composition of chaperone complexes that can suppress Htt amyloid formation is very variable and also stress‐inducible HSP‐70s can, if provided in excess and with a specific J‐protein partner, suppress the fibrilization of Htt.
Suppression of HttExon1Q48 fibrilization in the presence of seeds
Previously, it was shown that fragments of Htt fibrils can act as seeds and nucleate the fibrilization of still monomeric Htt proteins and thereby accelerate their aggregation (Scherzinger et al, 1999; Bhattacharyya et al, 2005). We also observed this phenomenon by spiking the FRET assay at time point zero with a small volume (10% v/v) of a 24 h fibril sample that was sonicated beforehand in order to break the fibrils and to create seeding‐competent Htt moieties. The addition of the seeds accelerated the fibrilization to the point that the lag phase was almost non‐existent (Fig 4A; compare blue with black curve). Next, we tested whether the chaperone mixtures could still suppress the Htt fibril formation in the presence of seeds. Indeed, the chaperones could still potently suppress the fibrilization for about 20 h followed by only a slight increase in FRET over a time course of 32 h (EΔApp increase of < 0.1; Fig 4A). TEM analysis confirms this observation. In the presence of seeds, but absence of chaperones, we can detect HttExon1Q48 fibrils whose morphology differs from the fibrils generated without seeds (compare Figs 4A and 1D). In the presence of the chaperone mixture, no fibrils could be detected after 24 h. Some smaller structures were visible, which might account for the weak FRET signal. Taken together, the chaperones can successfully suppress the activity of seeds in promoting HttExon1Q48 fibrilization (Fig 4A and B).
A distinct chaperone complex disaggregates HttExon1Q48 fibrils
We employed the seeding assay to test whether chaperone‐treated samples could still seed the fibrilization of HttExon1Q48 proteins. Incubation of HttExon1Q48 seeds with HSP‐1, HSP‐110, and DNJ‐13 for 5 h abrogated their seeding capacity (Fig 4C). One explanation for this observation is a disaggregation of the Htt seeds by the chaperone mixture that consequently diminishes the seeding competence. Analogous to the data obtained with the human chaperones, we could also observe disaggregation of HttExon1Q48 fibrils by the nematode chaperones: HSP‐1, DNJ‐13, and HSP‐110. TEM analysis showed that an incubation of the chaperone mixture and ATP with the fibrils resulted in resolubilization of the HttExon1Q48 aggregates (Fig 4D). We then confirmed the TEM data by filter retardation analysis for the human and nematode chaperone mixtures (Fig 4E) and sedimentation analysis analogous to the assay with the human chaperones depicted in Fig 1F. We normalized the disaggregation activities (supernatant to pellet ratios) to the control sample that did not contain chaperones. The ratios of supernatant to pellet significantly increased for the chaperone complex HSP‐1, HSP‐110, and DNJ‐13 in the presence of ATP (Fig EV1I). We then compared the disaggregation activities of various chaperone mixtures to HSP‐1, HSP‐110, and DNJ‐13. As depicted in Fig 4F, the inducible HSP‐70s, C12C8.1, F44E5.4, and F11F1.1, together with HSP‐110 and DNJ‐13, exhibited weaker disaggregation activities. Notably, both type A J‐proteins (DNJ‐12 and DNJ‐19) were less active than DNJ‐13 in the Htt disaggregation with HSP‐1 and HSP‐110 (Fig 4F). We then tested the contribution of the ATPase activity of HSP‐1 and HSP‐110 by employing the point mutations that abrogate or reduce their ATPase activity (Fig EV1G). Both HSP‐1 ATPase mutants displayed a reduced disaggregation activity. Notably, the disaggregation activity of the HSP‐110 ATPase mutant HSP‐110_D7S is reduced to a similar extend as the ATPase mutants of HSP‐1, suggesting that the ATPase activity of HSP‐110 is also required for efficient disaggregation. Mutation of the NEF activity of HSP‐110 reduces the disaggregation activity even further (Fig 4F), which is in agreement with previous data on the role of HSP‐110 in the disaggregation of amorphous luciferase aggregates (Rampelt et al, 2012). We then analyzed whether the chaperones could also disaggregate HttExon1Q75 fibrils. As depicted in Fig EV2E, no disaggregation could be observed within a time frame of 12 h indicating that the fibrils formed by the longer polyQ stretch are more inert for a chaperone‐mediated remodeling.
Figure EV2. Controls for in vitro and in vivo immunostaining Caenorhabditis elegans models of Htt513Q15/Q128‐YFP and quantification of chaperones.
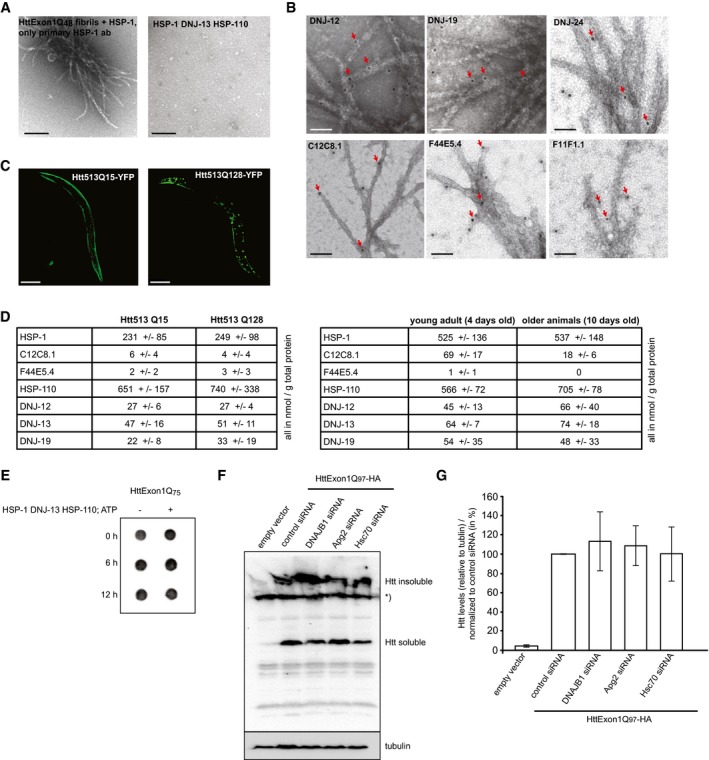
- On the left: TEM analysis of a control of HttExon1Q48 fibrils incubated with HSP‐1 and only the primary antibody against HSP‐1. On the right: TEM analysis of only the chaperones HSP‐1, DNJ‐13, and HSP‐110. Scale bars: 200 nm.
- Immunostaining of chaperones with HttExon1Q48 fibrils for DNJ‐12, DNJ‐19, DNJ‐24, C12C8.1, F44E5.4, and F11F1.1. Scale bars: 50 nm. The red arrows mark the positive immunogold labeling.
- Fluorescence images of nematode lines that were used in this study for the analysis of chaperone expression (Fig 5B and C): Htt513Q15‐YFP (HttQ15) and Htt513Q128‐YFP (HttQ128). Scale bars: 200 μm.
- Tables depict the quantification of the chaperone concentrations in Htt513Q15‐YFP vs. Htt513Q128‐YFP (top) and wild‐type nematodes of 4‐day‐old (young adults) vs. 10‐day‐old animals (bottom). Protein levels are depicted as nmol/g total protein. Data show an average of three independent analyses. Error ranges represent the standard deviation.
- Filter retardation analysis of the disaggregation analysis of HttExon1Q75 aggregates by HSP‐1, DNJ‐13, and HSP‐110 using an Htt antibody. The time course of the experiment is depicted on the left. No difference in the aggregated state of HttExon1Q75 can be observed in the chaperone‐containing sample (right lane vs. left lane).
- Western blot analysis of the soluble and insoluble moiety of HttExon1Q97 of HEK293T cells upon siRNA‐mediated depletion of DNAJB1, Apg2, and Hsc70. The migration of the insoluble and soluble HttExon1Q97 protein is indicated on the right. An asterisk indicates a non‐specific signal that also appears in the non‐transfected HEK393T cells (left lane).
- Quantification of the overall HttExon1Q97 levels (soluble + insoluble) of (F). The intensities were normalized to tubulin and represent an average of 3 independent experiments. Error bars represent the standard deviation.
Taken together, the constitutive Hsc70 (HSP‐1) protein together with HSP‐110 and the type B J‐protein DNJ‐13 constitutes the most active disaggregase for the resolubilization of Htt fibrils. Disaggregation of Htt fibrils requires ATPase activity of Hsc70 (HSP‐1) and HSP‐110 as well as the NEF activity of HSP‐110.
J‐proteins and HSP‐70s both bind to Htt fibrils
We then wondered which chaperone might interact directly with the Htt fibrils and which requires recruitment by another chaperone for the disaggregation reaction. To address this question, we generated HttExon1Q48 fibrils and incubated them with the individual chaperones for 1 h and then performed immunogold labeling using antibodies against DNJ‐13, HSP‐1, or HSP‐110 that were generated in this study. In the samples containing Htt fibrils and chaperones, immunogold staining was only detected in the presence of both, primary and secondary, antibodies (Figs 4G and EV2A). Interestingly, DNJ‐13 was only detected on the fibrils. HSP‐1 was mainly detected on the fibrils, but a few gold particles were also detected outside of the fibrils. Notably, HSP‐110 did not at all bind to the fibrils (Fig 4G). From these results, we conclude that DNJ‐13 and to a lesser extent also HSP‐1 can bind to Htt fibrils and are probably also recruiting HSP‐110 to these structures. These observations are in agreement with previous data on the interaction of chaperones with α‐synuclein fibrils (Gao et al, 2015).
Next, we wanted to analyze the association of the chaperones that constitute the active chaperone complex with the Htt aggregates in vivo by immunostaining of nematodes expressing aggregation‐prone HttpolyQ proteins. For that, we used a nematode model that expresses Htt513Q128‐YFP in muscle cells that shows a very robust aggregation phenotype (Fig EV2C). Immunostaining, using the respective antibodies against DNJ‐13, HSP‐1, and HSP‐110, showed clear colocalization for all chaperones with the HttpolyQ aggregates (Fig 4H). These data demonstrate that all three chaperones interact in vivo with Htt aggregates and confirm our previous observation of the association of the human orthologous chaperones with HttExon1Q97 aggregates (Fig 1H).
Interestingly, although only the chaperone complex HSP‐1, HSP‐110, and DNJ‐13 can disaggregate HttExon1Q48 fibrils, all studied J‐proteins and HSP‐70s can bind in vitro to the HttExon1Q48 fibrils (Fig EV2B). Thus, the ability to recognize amyloid proteins is not sufficient to resolubilize preformed fibrils.
Knockdown of hsp‐1, hsp‐110, and dnj‐13 results in enhanced polyQ aggregation in multiple C. elegans models
Next, we set out to analyze the contribution of the chaperones in maintaining the solubility of polyQ proteins in vivo. For that, we employed four different C. elegans polyQ models that differ in the protein context (flanking regions) of the polyQ stretch and the length of the polyQ stretch (Morley et al, 2002; Christie et al, 2014). We tested the effects of the RNAi‐mediated knockdown of the chaperones that showed the strongest effect in suppression and disaggregation activities in vitro: hsp‐1, hsp‐110, and dnj‐13 in C. elegans lines that express Q35‐YFP, Htt513Q15‐YFP, or the disease‐relevant C‐terminal domain of ataxin‐3 with either 45 or 63 glutamine residues (AT3CTQ45‐YFP and AT3CTQ63‐YFP) in the body wall muscle. Importantly, depletion of these chaperones results in all models in an increase in aggregation (Fig 5A). Notably, the Htt513Q15‐YFP model does not show any aggregation under the control conditions as the polyQ length is below the aggregation and pathogenic threshold especially given the rather long flanking region (Havel et al, 2009). However, depletion of hsp‐1, hsp‐110, and dnj‐13 leads to formation of protein aggregates in this model. These findings suggest that the chaperones are actively involved in maintaining the solubility of the Htt513Q15‐YFP proteins. From this in vivo analysis, we conclude that hsp‐1, dnj‐13, and hsp‐110 are crucial chaperones to cope with the aggregation propensity of polyQ proteins in nematodes.
Figure 5. Depletion of chaperones leads to enhanced aggregation of Qn, HttQn and ATC3Qn in vivo .
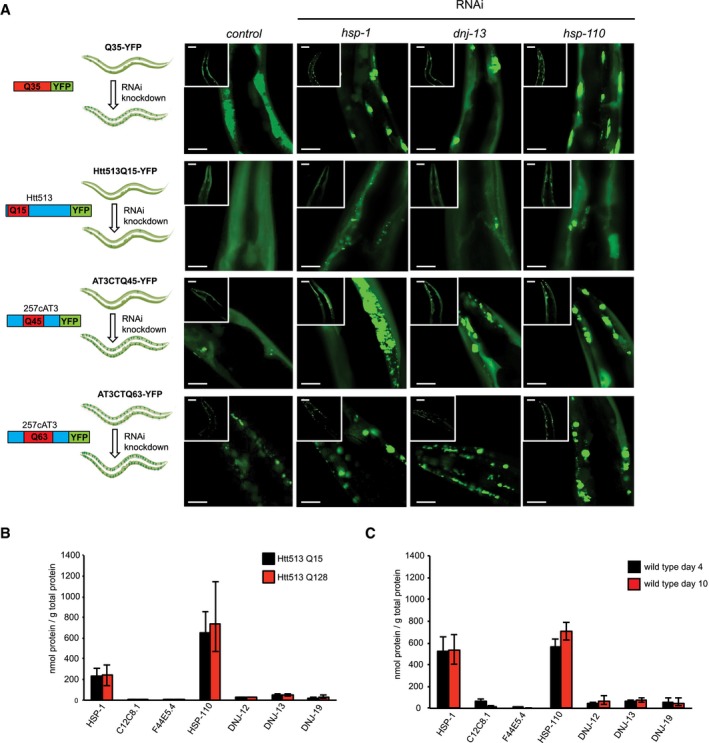
- RNAi‐mediated knockdown of hsp‐1, dnj‐13, hsp‐110, and control (empty RNAi vector L4440) in Caenorhabditis elegans polyQ models. first row: Q35‐YFP, second row: Htt513Q15‐YFP, third row: ATC3Q45‐YFP, and fourth row: ATC3Q63‐YFP. Twenty animals per condition were analyzed. Representative images of the head regions are shown for each knockdown. Scale bars: 50 μm.
- Analysis of protein levels of HSP‐70s (HSP‐1, C12C8.1, and F44E5.4), HSP‐110 and J‐Proteins (DNJ‐12, DNJ‐13, and DNJ‐19) in 4‐day‐old animals expressing Htt513Q15‐YFP (black) or Htt513Q128‐YFP (red). Depicted is the average of three independent analyses. Error bars represent the standard deviation.
- Analysis of protein levels of DNJ‐12, DNJ‐19, DNJ‐13, HSP‐1, C12C8.1, and HSP‐110 in young adults (4‐day‐old nematodes, black) and old (10‐day‐old, red) nematodes. We do not have an explanation for the higher HSP‐1 protein levels in the wild‐type N2 animals compared to the Htt513Q15/128‐expressing animals (Fig 5B). Depicted is the average of three independent analyses with error bars representing the standard deviation.
HttpolyQ aggregation does not lead to an induction of chaperone levels
The knockdown data suggest a vital role of the specific chaperones HSP‐1, HSP‐110, and DNJ‐13 in the maintenance of the solubility of all polyQ proteins. Although it has been shown that the expression of HSF‐1, the master regulator of the heat‐shock response, is not activated in HttQ91‐expressing mammalian cells (Bersuker et al, 2013), we wondered whether specific chaperones are induced in response to polyQ expression in the nematode. For such an analysis, we quantified the protein levels of a selected set of chaperones: three cytosolic HSP‐70s (HSP‐1, F44E5.4, and C12C8.1), HSP‐110, and the J‐proteins DNJ‐12, DNJ‐13, and DNJ‐19 in young adult (4‐day‐old) animals expressing soluble Htt513Q15 and highly aggregation‐prone Htt513Q128 proteins. Importantly, we observed no significant induction for either of the investigated chaperones (Figs 5B and EV2D).
Chaperone levels do not change with age
Huntington's disease is a late age of onset disease (Lipe & Bird, 2009). Thus, we wondered how much the chaperone levels change with the progression of aging. We quantified the same selected set of chaperones as before in young (4‐day‐old) and old wild‐type animals (10‐day‐old). Notably, the protein levels of the J‐proteins, DNJ‐12, DNJ‐13, and DNJ‐19, as well as of the HSP‐70s, HSP‐1, and C12C8.1, and of HSP‐110 do not significantly change with aging (Figs 5C and EV2D).
Knockdown of DNAJB1 and Apg2 leads to Htt aggregation in neural progenitor cells (NPCs) derived from a HD patient
To validate our observations in a clinically relevant model, we employed neural progenitor cells (NPCs) derived from induced pluripotent stem cells (iPSCs) that were generated from a HD patient carrying a polyQ stretch of 44 residues within the huntingtin protein (HttQ44; patient CH4). The derived NPC line, defined as NICH4, showed the expression of the correct NPC‐specific markers at the protein and mRNA levels (Fig 6A and B). The neural induction was slightly less efficient in HD NPCs compared to control NPCs (Fig 6B), which is in agreement with recent findings (Kirstein et al, 2017). NICH4 cells were then transfected with siRNAs directed against transcripts encoding the human chaperones Hsc70, DNAJB1 (J‐protein), and Apg2 (Hsp110).
Figure 6. Depletion of chaperones leads to an increase in Htt aggregation in NPCs and overexpression of DNAJB1 ameliorates HttExon1Q97 aggregation in HEK 293T cells.
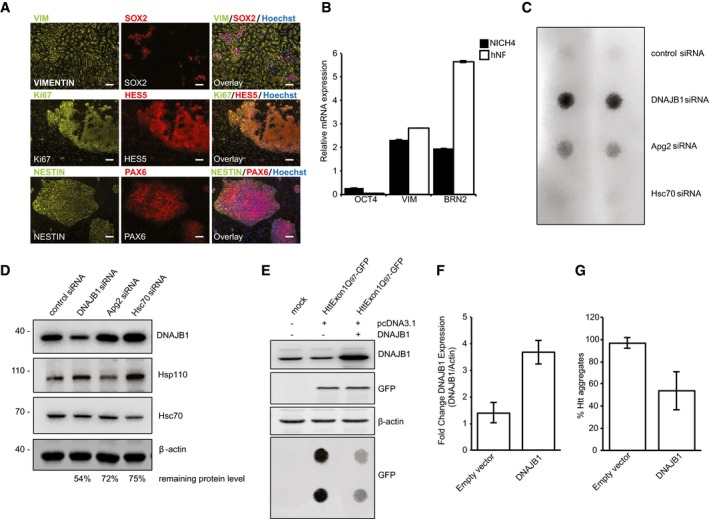
- Characterization of NICH4. The neural progenitor cell (NPC) line NICH4 was differentiated from HD patient‐derived iPSCs. NICH4 exhibit typical NPC morphology and grew as cellular monolayer on Matrigel‐coated dishes. NICH4 expressed the NPC‐specific protein markers VIMENTIN (VIM), SOX2, HES5, NESTIN, and PAX6, and the proliferation marker Ki67. Scale bars: 100 μm.
- Quantitative real‐time PCR (qPCR) confirmed the transcriptional down‐regulation of the pluripotency marker OCT4 and the up‐regulation of NPC‐specific markers VIMENTIN (VIM) and BRN2 in NICH4 HD NPCs compared to undifferentiated H9 hESCs, in a similar fashion as the control line hNP1 (purchased from Aruna Biomedicals). Control NPCs showed increased BRN2 expression indicative of a slightly more efficient neural induction compared to HD NPCs. Error bars represent the standard deviation (N = 3).
- Filter retardation assay for the analysis of the aggregation propensity of endogenous Htt in NPCs (NICH4) upon siRNA‐mediated knockdown of DNAJB1, Apg2 (Hsp110), Hsc70, and the control (non‐targeting siRNA). The filter trap shows duplet spots for each condition.
- Western blot depicts the knockdown efficiency of the siRNA‐mediated knockdown of the chaperones in the NICH4 cells. The protein levels of the chaperones normalized to the control and β‐actin levels are depicted below the blot.
- Western blot and filter retardation analysis of the aggregation propensity of HttExon1Q97 upon overexpression of DNAJB1. The protein levels of DNAJB1 are depicted in the top blot, and overexpression of DNAJB1 (right column) does not affect the HttExon1Q97 levels (GFP signal of middle blot). The filter trap assay (bottom blot) depicts the aggregation propensity of HttExon1Q97 upon overexpression of DNAJB1 and is analyzed in duplets.
- Quantification of the overexpression of DNAJB1 of the Western blot shown in (E). Error bars represent the standard deviation (N = 3).
- Quantification of the aggregation propensity of HttExon1Q97 upon overexpression of DNAJB1 of the filter retardation analysis depicted in (E). Error bars represent the standard deviation (N = 3).
We used a filter retardation assay to monitor the aggregation propensity of endogenous Htt. Under control conditions, we could only detect a weak signal for Htt on filter membranes (Fig 6C), indicating that the protein is not aggregated. Accordingly, although NPCs derived from HD patients have been found to exhibit bioenergetic abnormalities, Htt aggregation phenotypes have yet to be reported (Consortium, 2012; Kirstein et al, 2017). Importantly, however, upon siRNA‐mediated knockdown of DNAJB1 and Apg2, we could detect pronounced aggregation of Htt (Fig 6C). This is the first demonstration of aggregation of the endogenous Htt protein with an expanded polyQ stretch in HD patient‐derived neural cells. This observation confirms the in vitro data of the suppression of aggregation and disaggregation of Htt protein by these chaperones. Surprisingly, depletion of Hsc70 did not result in an increased aggregation of Htt (Fig 6C). The remaining protein levels of the chaperones upon knockdown were still between 54 and 75% of the control with Hsc70 displaying the highest remaining level (Fig 6D). Moreover, other members of the Hsp70 family could also substitute the constitutive Hsc70, as observed in vitro (Fig 3B). Nevertheless, a reduction in protein levels of DNAJB1 and Apg2 clearly affects the aggregation propensity of endogenous HttQ44. These findings are in complete agreement with the RNAi‐mediated chaperone knockdown experiments in nematode polyQ models (Fig 5). To rule out that RNAi‐mediated knockdown of chaperones could simply result in an increase in the overall levels of Htt by, for example, inhibiting targeting to the proteasome and thereby enhancing their aggregation propensity, we analyzed the HttExon1Q97 levels in HEK293T cells upon siRNA treatment (Fig EV2E). We observed a shift of HttExon1Q97 from the soluble to the insoluble fraction in particular upon depletion of DNAJB1 as expected from our previous observations (Figs EV2F, 5A and 6C). Importantly, however, we did not detect changes in the overall levels of HttExon1Q97 upon knockdown of the chaperones (Fig EV2F and G).
Overexpression of DNAJB1 in mammalian cell culture reduces HttExon1Q97 aggregation
Finally, we wanted to test if we could rescue the aggregation of Htt by overexpression of chaperones. For that, we chose to analyze HEK293T cells expressing HttExon1Q97‐GFP, which show robust aggregation under control conditions and enable us to analyze a potential rescue effect upon overexpression of a chaperone. We chose to test the effect of overexpression of DNAJB1 based on our previous findings: (i) siRNA‐mediated depletion of DNAJB1 showed the strongest effect on the aggregation propensity of endogenous HttQ44 of the patient‐derived NPCs (Fig 6C), (ii) the J‐protein directly interacts with HttExon1Q48 fibrils (Fig 4G), and (iii) the J‐protein is the chaperone whose concentration is most critical for the suppression of Htt fibril formation (Fig 2B). Overexpression of DNAJB1 in the HttExon1Q97‐GFP‐expressing HEK 293T cells did indeed reduce the aggregation of Htt by ~50% as judged by a filter retardation assay. This finding demonstrates that the overexpression of a single and in vivo probably limiting chaperone can ameliorate Htt protein aggregation (Fig 6E–G).
Discussion
In this study, we demonstrate for the first time a complete suppression of amyloid formation of HttExon1Q48, a near complete suppression of HttExon1Q75 aggregation and disaggregation of preformed amyloid HttExon1Q48 fibrils. The suppression and disaggregation activities are mediated by distinct chaperone complexes, which are composed of members of the Hsp70, Hsp110, and J‐protein families. We could demonstrate the suppression of HttExon1Qn fibrilization in vitro by employing a novel FRET fibrillization assay and complementary TEM and filter retardation analyses using purified human and C. elegans chaperones. Analysis of the kinetics of the FRET curves suggests that the chaperones suppress the fibrilization of HttExon1Q48 by primary and secondary nucleation events as well as by inhibiting the elongation process (Arosio et al, 2014). We could further establish that the same chaperone composition can resolubilize preformed HttExon1Q48 fibrils. Both chaperone activities are ATP dependent. We could demonstrate that the suppression of HttExon1Q48 fibrilization requires the ATPase activity of HSP‐1 (Hsc70), but not of HSP‐110. Yet the NEF activity of HSP‐110 was essential to suppress amyloid formation. The suppression of fibrilization is therefore not mediated by a single ATPase cycle to, for example, initiate substrate engagement by the chaperones, but requires constant ATPase cycles and suggests a binding‐release model of action. Notably, disaggregation requires the ATPase activities of both, HSP‐1 (Hsc70) and HSP‐110, as well as the NEF activity of HSP‐110. Thus, the mechanism differs substantially from the suppression of fibrilization activity.
Interestingly, the constitutive Hsc70 (HSP‐1), HSP‐110, and the type B J‐protein DNJ‐13 showed the strongest suppression of Htt fibrilization. However, the stress‐inducible HSP‐70s could substitute for Hsc70, yet require higher chaperone:Htt ratios. Notably, all HSP‐70s exhibit varying efficiencies in the suppression of Htt fibrilization depending on the partner J‐protein.
The basal ATPase rates of the inducible Hsp70s are with the exception of F11F1.1 similar to the rate of the constitutive HSP‐1 (30 pmol ATP/μM/min). Although each of the Hsp70s is induced by any analyzed J‐protein in vitro, the final ATP‐hydrolysis rates are about 50% of the one of the activated constitutive HSP‐1 (up to 200 pmol ATP/μM/min) that can rely on the energy of twice as much ATP for its remodeling activities to suppress Htt fibrilization. This is in agreement with our observation that doubling the amount of the chaperone complexes harboring the inducible Hsp70s can boost their activities in the suppression of Htt fibrilization activities and matches those of HSP‐1 (Fig 3B).
Disaggregation of Htt fibrils is mediated by Hsc70/HSP‐1, Apg2/HSP‐110, and DNAJB1/DNJ‐13—the very same chaperone complex that exhibits the highest efficiency for the suppression of Htt fibrilization. We observed a decreased disaggregation by a type A J‐protein (e.g., DNJ‐12) together with HSP‐1 and HSP‐110, which is in agreement with the observations made for the depolymerization of α‐synuclein fibrils (Gao et al, 2015). Notably, we did also not detect a synergistic activity when mixed‐class J‐proteins were provided for either suppression or disaggregation of Htt fibrils, which was also not observed for the disaggregation of α‐synuclein fibrils (Gao et al, 2015). The resolubilization of amyloid fibrils thus only requires the action of a single type B J‐protein as opposed to amorphous aggregates such as luciferase or MDH (Nillegoda et al, 2015; Kirstein et al, 2017). Perhaps the association and required remodeling activities differ substantially between structured amyloid fibrils and amorphous aggregates (Scior et al, 2016). Interestingly, the preference for a type B J‐protein is not based on the substrate recognition as we could detect binding of the HttExon1Q48 fibrils for DNJ‐13 (type B) as well as for both type A J‐proteins DNJ‐12 and DNJ‐19. The disaggregation activities of the inducible HSP‐70s are reduced compared to the constitutive HSP‐1 despite their ability to bind to HttExon1Q48 fibrils.
We could confirm our in vitro data on the chaperone‐mediated suppression and disaggregation of Htt fibrils by employing in vivo nematode models that express polyQ (Qn) proteins with different flanking regions and a varying degree of polyQ expansion (Fig 5A and B). Moreover, using patient‐derived neural progenitor cells, we could demonstrate a sharp increase in the aggregation of the endogenous Htt protein (Q44) upon knockdown of DNAJB1 (DNJ‐13 ortholog) and Apg2 (HSP‐110; Fig 6C and D). Consequently, overexpression of DNAJB1 in HEK 293T cells expressing the highly aggregation‐prone HttExon1Q97 significantly reduced the aggregation (Fig 6E–G). Thus, the induction of a single chaperone can combat the aggregation propensity of Htt. Our observations that the concentration of the J‐protein appears to be the most critical of all three chaperones in the in vitro suppression assay, its strong interaction with the Htt fibrils together with the in vivo data where a depletion of the J‐protein provoked the strongest aggregation effect in C. elegans Qn models and patient‐derived NPCs as well as the rescue properties upon overexpression, suggest that the J‐protein is a very attractive therapeutic target to suppress and resolubilize Htt fibrils.
We could demonstrate that an excess of chaperones is required to fully suppress the formation of amyloid fibrils. This poses the question of the in vivo chaperone concentration and their capacity in particular with the progression of aging as HD is a late age of onset disease (Lipe & Bird, 2009). Surprisingly, we observed that the protein levels of a subset of chaperones we analyzed in vitro and in vivo do not significantly change with aging or upon expression of polyQ proteins (Fig 5B and C). This observation is in agreement with a previously published proteome study of young adults and aged nematodes (Liang et al, 2014). Yet, it is well established that misfolded and aggregated proteins accumulate with the progression of aging (David, 2012). In addition, the suppression and disaggregation reactions consume substantial amounts of ATP. ATP levels decline with aging and might become a limiting factor for the activity of the chaperones and in turn lead to more aggregation (Navarro et al, 2002; Miyoshi et al, 2006; Simsek‐Duran et al, 2013). Moreover, molecular chaperones are involved in numerous cellular processes and might simply be overwhelmed with the increasing load of misfolded proteins in aged animals (Balchin et al, 2016; Scior et al, 2016). We could mimic such a scenario by adding aggregated citrate synthase to the in vitro HttExon1Q48 suppression assay and could indeed show that the efficiency of the chaperones to suppress fibril formation of Htt is impaired in the presence of additional chaperone substrates. In line with that, protein aggregates, which accumulate in response to proteotoxic conditions or with aging, sequester chaperones that are consequently depleted from the soluble proteome and thus the available chaperone pool (Kirstein‐Miles et al, 2013).
Htt protein levels have been measured in various cell types and tissues, and the concentration of Htt was on average 171 nmol/g total protein in postmortem cortex homogenates of HD patients (Macdonald et al, 2014). We quantified the protein levels of a selected set of chaperones in this study. The concentration of HSP‐1 (Hsc70) in C. elegans is about 250 nmol/g total protein in nematodes expressing Htt513Q128. Although the quantifications were obtained from two very different biological samples, it nevertheless might provide a rough estimate that Hsc70 is only present in a ~1.5‐fold excess over Htt in the brain homogenate. Given that Hsc70 has numerous roles in the maintenance of cellular proteostasis, the effective chaperone concentration that could suppress Htt fibrilization is probably limiting, especially given that a minimum of 3.5‐fold excess of Hsc70 is required for a complete suppression. Although we cannot exclude that other J‐proteins apart from DNJ‐13 (DNAJB1) contribute to the suppression and disaggregation of Htt fibrils, the concentration of the J‐protein DNJ‐13 is sub‐stoichiometric compared to the Htt moiety. In fact, all three analyzed J‐proteins are present in similar and thus sub‐stoichiometric amounts in comparison with Htt. J‐proteins can act also independently of Hsc70 as has been demonstrated for DNAJB6. DNAJB6 can suppress the fibrillization of Htt via a S/T‐rich region within the chaperone (Kakkar et al, 2016). Disaggregation of Htt fibrils, however, requires a chaperone complex composed of Hsc70, Hsp110, and a J‐protein. Transient interaction of soluble oligomeric HttpolyQ species was recently reported for the J‐proteins: DNAJA1, DNAJA2, DNAJB6, and DNAJB12 (Kim et al, 2016). Whether these J‐proteins directly interact with HttpolyQ or are a part of a protein complex is not known yet, but suggests the formation of very dynamic chaperone complexes that attend to HttpolyQ proteins to maintain their solubility.
Further studies are required to gain more mechanistic insight into the mode of action of the chaperone‐mediated suppression of Htt fibrilization and disaggregation of these amyloid fibrils. Do Hsp70, Hsp110, and the J‐protein form a physical complex at any time of their course of action or do they bind and act sequentially? Our data suggest that the J‐protein probably initiates the binding to the substrate and recruits Hsp70. It is not known yet whether the J‐protein dissociates upon activation of the ATPase activity of Hsp70. Hsp110 could interact with Hsp70 in its ADP‐bound form in its role as NEF to complete the ATPase cycle. We could not detect an interaction of HSP‐110 alone with the HttExon1Q48 fibrils, yet we could demonstrate an interaction of HSP‐110 with Htt513Q128 aggregates in vivo. We thus hypothesize that HSP‐110 is recruited to the Htt aggregates by Hsc70 or the J‐protein. An interaction between the J‐protein and HSP‐110 is possible as we also observed a slight induction of the ATPase activity of HSP‐110 by a J‐protein. A clamping‐and‐walking model of disaggregation by Hsp70‐Hsp110 was recently proposed and the role of the J‐proteins is here limited to initial substrate recognition and stimulation of the ATPase of Hsp70 and Hsp110 (Mattoo et al, 2013). Our observation that the ATPase activity of HSP‐110 was required for sufficient disaggregation and the high abundance of HSP‐110, whose protein levels exceed those of Hsc70 in vivo argues for a more central role of HSP‐110 in chaperone activities besides its described role as NEF.
Materials and Methods
Plasmid cloning and protein purification
Please see Appendix.
CD spectra of HSP‐1 and HSP‐110 variants
The mutagenized proteins were prepared as described, concentrated in centrifugal filters [Amicon Ultra‐0.5 Centrifugal Filter Devices, 10 kDa MWCO (Merck Millipore, Germany)] to a volume of no more than 100 μl and diluted with CD buffer (10 mM sodium phosphate, 100 mM NaF, pH 7.4) to a volume of 500 μl. This process was repeated eight times to ensure the buffer was exchanged, after which samples were centrifuged at 100,000 g for 1 h. CD spectra were obtained in a Jasco J‐720 spectropolarimeter (Jasco, Gross‐Umstadt, Germany) with 10 accumulations. HSP‐1 samples were diluted to 1 mg/ml and HSP‐110 samples to 0.2 mg/ml (as determined by Bradford assay) to be analyzed at a path length of 1 mm (volume: 200 μl). Cuvettes [Quartz Suprasil cuvettes (Hellma Analytics, Germany)] were kept at 20°C under a stream of N2 during measurements. The scanning speed was set to 100 nm/min with a response time of 1 s and a bandwidth of 1 nm. Photomultiplier voltage was monitored during measurements, which were constricted to wavelengths where 800 V were not surpassed.
Nematode antibodies
Polyclonal antibodies against HSP‐1, C12C8.1, DNJ‐12, DNJ‐13, DNJ‐19, and HSP‐110 were raised in rabbits by immunization with the full‐length protein (HSP‐1, C12C8.1, DNJ‐12, DNJ‐13, DNJ‐19) or a C‐terminal fragment for HSP‐110 (beginning at amino acid 687), respectively (Charles River, France; and Pineda, Germany). The polyclonal antibody against F44E5.4 was raised in a guinea pig by immunization with the full‐length F44E5.4 protein (Pineda, Germany).
ATPase assay
The ATPase rate of Hsp70 chaperones was determined by the malachite green assay according to Rauch and Gestwicki (2014) using 0.5 μM of Hsp70s, 0.25 μM J‐proteins, and 0.25 μM HSP‐110 as well as for the human orthologs (Hsc70, DNAJB1 and Apg2). The reactions were performed in low salt buffer (30 mM Tris–HCl, pH 7.4, 100 mM K‐acetate, 5 mM MgCl2, 1 mM β‐mercaptoethanol, 10% glycerol) for 2.5 h at 20°C for C. elegans chaperones and at 30°C for human chaperones.
FRET assay
Purified GST‐HttExon1Q48/23‐CyPet and GST‐HttExon1Q48/23‐YPet were diluted in aggregation buffer (30 mM HEPES‐KOH pH 7.4, 150 mM KCl, 5 mM MgCl2, 1 mM DTT) at an equimolar ratio to yield a final concentration of 1.5 μM (0.75 μM each). If not stated otherwise, 5 mM ATP and an ATP regeneration system composed of 3 mM phosphoenolpyruvate (PEP) and pyruvate kinase (Sigma) were added to the reaction. The aggregation was initiated with 14 U PreSP (Roche) per nmol Htt. To monitor prevention of aggregation, the chaperones were added prior to addition of PreSP. The reactions were transferred to a black 384‐well plate. For each experiment, triplicates were measured and mean value is shown. Fluorescence signals were measured every 20 min with a Tecan F200 fluorescence plate reader at 20°C for up to 48 h. CyPet donor fluorescence was measured at excitation (Ex): 430 nm/emission (Em): 485 nm; YPet acceptor fluorescence at Ex: 485 nm/Em: 530 nm; the FRET channel (DA) was recorded at Ex: 430 nm/Em: 530 nm. Raw signals were processed by subtracting the fluorescence intensities of unlabeled HttExon1Q48/23 in all channels. Signals in the FRET channel were corrected for donor bleed‐through (cD) and acceptor cross excitation (cA) using donor and acceptor only samples to obtain the sensitized emission. Finally, sensitized emission was normalized to the acceptor signals (Jiang & Sorkin, 2002). In brief, the FRET efficiency EApp was calculated as follows: E = (DA‐cDxDD‐cAxAA)/AA with DD = donor channel signal and AA = acceptor channel signal.
Citrate synthase (CS) aggregates were prepared by diluting CS to 10 μM in aggregation buffer (30 mM HEPES pH 7.4, 150 mM KCl, 5 mM MgCl2, 1 mM DTT) and subsequent heating at 50°C for 10 min. Final concentration of aggregates in the FRET assay was 0.15 μM.
EM sample preparation
Details for EM sample preparation are provided in the Appendix. At the indicated time points, samples were flash‐frozen in liquid nitrogen and then deposited on a carbon‐coated formvar copper grid. After 45 s, the sample droplet was blotted with filter paper and negatively stained with 2% uranyl acetate in water. Samples were imaged using a Tecnai F20 (200 keV) transmission electron microscope. For immunogold labeling, fibrils were first formed for 24 h and subsequently incubated with the respective chaperone for 30 min at 20°C and then flash‐frozen in liquid nitrogen. The grids were incubated with the samples on drops of washing buffer, primary and secondary antibodies prior to negative staining.
Suppression of fibrilization and disaggregation by filter retardation analysis
Please see Appendix.
Disaggregation via sedimentation analysis
GST‐HttExon1Q48‐CyPet protein was incubated with 14 U PreSP (Roche) per nmol Htt for 24 h at 20°C to allow cleavage of GST domain and subsequent fibril formation. Afterward, the fibrils were collected by centrifugation at 50,000 g for 40 min and resuspended by sonication (2 s 50% duty power level 4) in aggregation buffer (30 mM HEPES‐KOH pH 7.4, 150 mM KCl, 5 mM MgCl2, 1 mM DTT) to result in a final concentration of 1.5 μM fibrils. The chaperones were added in the following concentrations: 20 μM HSP‐1, 10 μM DNJ‐13, and 10 μM HSP‐110. For the human chaperones, we used: 30 μM Hsc70, 15 μM DNAJB1, 15 μM Apg2. Disaggregation reaction was initiated by addition of 5 mM ATP as well as a regenerative system (3 mM PEP + pyruvate kinase) and performed at 20°C for nematode and 30°C for human chaperones, respectively. Samples were harvested at the indicated time points and directly centrifuged at 20,000 g for 30 min at 4°C. To determine the amount of soluble protein, the fluorescence of the supernatant as well as of the pellet was measured in the Tecan F200 plate reader (excitation: 430 nm; emission 485 nm) in triplicates.
Quantification of in vivo chaperone concentration by Western blotting
Please see Appendix.
Nematode strains, maintenance, and RNAi
Please see Appendix.
Fluorescence microscopy
The aggregation propensities of Q35‐YFP, AT3CQ45, AT3CQ63, and Htt513Q15 were analyzed on day 5 of life. Animals were subjected to RNAi treatment from the first larval stage on and maintained on RNAi plates throughout the experiment. For imaging, nematodes were mounted onto 2% agarose (Sigma) pads on glass slides and immobilized with 2 mM Levamisole (Sigma). Images were taken on a LSM780 confocal microscope at 20× and 63× magnification. The Q35‐YFP‐expressing nematodes were analyzed as whole nematode for quantification of the aggregates, and an image was taken of the head region of the animal; 20 animals were analyzed for each condition. Immunostaining of nematodes was performed as described before (Kirstein‐Miles et al, 2013).
Cell culture and transfection
Please see Appendix.
iPSC and NPC generation and validation
CH4 fibroblasts were obtained from the skin biopsy of a HD patient (male, age 25–38, Q length 44Q). CH4 fibroblasts were transfected with episomal plasmids containing seven transcription factors (OCT4, SOX2, KLF4, c‐MYC, NANOG, LIN28, and SVLT) using Amaxa Cell Line Nucleofector Kit R (Lonza) to generate induced pluripotent stem cells (iPSCs), as previously described (Lorenz et al, 2017). Full characterization of the derived iPSC line demonstrated the successful achievement of pluripotency (Mlody, Bukowiecki, et al, in preparation). Human embryonic stem cell (hESC) line H9 (WA09) was purchased from WiCell and employed according to the German law (license to Dr. Prigione). Control NPCs, differentiated from the hESC line H9 using a traditional rosette‐based approach, were purchased from Aruna (hNP1, Aruna Biomedicals, Georgia, USA). Neural induction (NI) NPCs were derived from iPSCs following a small molecule‐mediated protocol (Lorenz et al, 2017). Briefly, iPSCs were split and plated onto feeder‐free Matrigel‐coated plates in DMEM/F12 medium. The next day, the cells were cultured in NI medium [Neurobasal:DMEM/F12 (1:1), N2 (1×), B27 (1×), hLIF (10 ng/ml), CHIR99021 (4 μM, Cayman Chemical), SB431542 (3 μM, SelleckChem), BSA (0.05%), pen/strep, MycoZap, and L‐glutamine]. Compound E (0.1 μM Calbiochem) was added to the NI medium for the first week. Afterward, only NI medium was employed. The obtained line, named as NICH4, was maintained on Matrigel‐coated plates and split by scraping with a cell spatula at 80–100% confluence at ratios of 1:2 to 1:5. All cultures were normally kept in a humidified atmosphere of 5% CO2 at 37°C under atmospheric oxygen condition and were regularly monitored against mycoplasma contamination.
Immunostaining of NPCs
Cells were fixed with 4% paraformaldehyde (Science Services) for 20 min at RT, washed two times with PBS, and permeabilized using a blocking solution containing 10% FBS and 1% Triton X‐100 in PBS and 1% Tween 20 (all Sigma‐Aldrich) for 1 h at RT. Primary antibodies were incubated for at least 1 h at RT in the blocking solution and included VIMENTIN (1:300; V6630, Sigma), SOX2 (1:100, sc‐17320, Santa Cruz Biotechnology), Ki67 (1:50, DakoCytomation), HES5 (1:50, sc‐25395, Santa Cruz Biotechnology), NESTIN (1:200, MAB5326, Millipore), and PAX6 (1:200, 901301, BioLegend). Following washing, the corresponding secondary antibodies were applied (Alexa Fluor, 1:300, Invitrogen, Life Technologies). Counterstaining of cell nuclei was achieved by incubation with 2 μg/ml Hoechst 33342 (Thermofisher, MA, USA) in PBS for 10 min at RT. All images were acquired using the Olympus IX70 microscope (Olympus, Hamburg, Germany) and further processed with Adobe Photoshop CS 6 (Adobe, Munich, Germany).
Quantitative real‐time PCR of NPCs
Gene expression analysis was performed by quantitative real‐time PCR (qPCR) using SYBR Green PCR Master Mix and the ViiA™ 7 Real‐Time PCR System (Applied Biosystems). For each target gene, cDNA samples and negative controls were run as technical triplicates using the 384‐Well Optical Reaction Plates (Applied Biosystems). Relative transcript level of each gene was calculated according to the ΔΔC T method (Livak & Schmittgen, 2001). The data, normalized to the housekeeping gene ACTB and referred to the undifferentiated H9 hESC line, are presented in the figure as −ΔΔC T values. The sequences of the oligonucleotides can be found in the Appendix.
Western blot analysis and filter trap assay of cell culture samples
Please see Appendix.
Author contributions
AS, KA, JK, MI, KJ, MLP, and BM performed experiments. AS, KA, JK, MI, KJ, MLP, BM, and AP analyzed data. JP, AP, and BM contributed reagents and technological know‐how. AP, AA, and EEW established the FRET assay for the HttExon1Q48‐YPet/CyPet fibrilization. Requests for those reagents should be sent to EEW. JK, AS, and AP designed experiments. JK wrote the manuscript. DM performed EM analysis.
Conflict of interest
The authors declare that they have no conflict of interest.
Supporting information
Appendix
Expanded View Figures PDF
Table EV1
Review Process File
Acknowledgements
We acknowledge B. Bukau (ZMBH‐DKFZ Alliance Heidelberg) for the overexpression plasmids for the human chaperones Hsc70, Apg2, and DNAJB1, Elise Kikis (University of the South, USA) for providing us with the non‐integrated Htt513Q15‐YFP and Htt513Q128‐YFP nematode lines, Svea Hohensee, Martina Ringling, and Franziska Wiedemann for technical support, Ellen Malovrh, Marc Bohlmann, and Ashley Zheng are acknowledged for their assistance with some protein assays and Raul Bukowiecki for initial iPSC generation. We acknowledge funding from the DFG (NeuroCure EXC257, SFB740, SPP1623 to JK), DFG (NeuroCure EXC257 PhD fellowship to MLP), Daimler & Benz Stipend (to AS), AXA Research Fund (to KJ), Berlin Institute of Health and Gender Equality Funds (to BM), and the Bundesministerium für Bildung und Forschung (e:Bio young investigator grant AZ.031A318 to AP), the Berlin Institute of Health Collaborative Research Grant (no. 1.1.2.a.3 “Elucidating the proteostasis network to control Alzheimer's disease”) funded by the German Federal Ministry for Education and Research (BMBF), the Helmholtz Validation Fund (grant no. HVF‐0013 “Enabling Technologies for Drug Discovery against Protein Misfolding Diseases”) funded by the Helmholtz Association, Germany (to E.E.W.).
The EMBO Journal (2018) 37: 282–299
Contributor Information
Erich E Wanker, Email: ewanker@mdc-berlin.de.
Janine Kirstein, Email: kirstein@fmp-berlin.de.
References
- Arosio P, Vendruscolo M, Dobson CM, Knowles TP (2014) Chemical kinetics for drug discovery to combat protein aggregation diseases. Trends Pharmacol Sci 35: 127–135 [DOI] [PubMed] [Google Scholar]
- Balch WE, Morimoto RI, Dillin A, Kelly JW (2008) Adapting proteostasis for disease intervention. Science 319: 916–919 [DOI] [PubMed] [Google Scholar]
- Balchin D, Hayer‐Hartl M, Hartl FU (2016) In vivo aspects of protein folding and quality control. Science 353: aac4354 [DOI] [PubMed] [Google Scholar]
- Bersuker K, Hipp MS, Calamini B, Morimoto RI, Kopito RR (2013) Heat shock response activation exacerbates inclusion body formation in a cellular model of Huntington disease. J Biol Chem 288: 23633–23638 [DOI] [PMC free article] [PubMed] [Google Scholar]
- Bhattacharyya AM, Thakur AK, Wetzel R (2005) polyglutamine aggregation nucleation: thermodynamics of a highly unfavorable protein folding reaction. Proc Natl Acad Sci USA 102: 15400–15405 [DOI] [PMC free article] [PubMed] [Google Scholar]
- Brehme M, Voisine C, Rolland T, Wachi S, Soper JH, Zhu Y, Orton K, Villella A, Garza D, Vidal M, Ge H, Morimoto RI (2014) A chaperome subnetwork safeguards proteostasis in aging and neurodegenerative disease. Cell Rep 9: 1135–1150 [DOI] [PMC free article] [PubMed] [Google Scholar]
- Buchner J, Grallert H, Jakob U (1998) Analysis of chaperone function using citrate synthase as nonnative substrate protein. Methods Enzymol 290: 323–338 [DOI] [PubMed] [Google Scholar]
- Chan HY, Warrick JM, Gray‐Board GL, Paulson HL, Bonini NM (2000) Mechanisms of chaperone suppression of polyglutamine disease: selectivity, synergy and modulation of protein solubility in Drosophila . Hum Mol Genet 9: 2811–2820 [DOI] [PubMed] [Google Scholar]
- Christie NT, Lee AL, Fay HG, Gray AA, Kikis EA (2014) Novel polyglutamine model uncouples proteotoxicity from aging. PLoS One 9: e96835 [DOI] [PMC free article] [PubMed] [Google Scholar]
- Cicchetti F, Soulet D, Freeman TB (2011) Neuronal degeneration in striatal transplants and Huntington's disease: potential mechanisms and clinical implications. Brain 134: 641–652 [DOI] [PubMed] [Google Scholar]
- Consortium HDi (2012) Induced pluripotent stem cells from patients with Huntington's disease show CAG‐repeat‐expansion‐associated phenotypes. Cell Stem Cell 11: 264–278 [DOI] [PMC free article] [PubMed] [Google Scholar]
- David DC (2012) Aging and the aggregating proteome. Front Genet 3: 247 [DOI] [PMC free article] [PubMed] [Google Scholar]
- Gao B, Greene L, Eisenberg E (1994) Characterization of nucleotide‐free uncoating ATPase and its binding to ATP, ADP, and ATP analogues. Biochemistry 33: 2048–2054 [DOI] [PubMed] [Google Scholar]
- Gao X, Carroni M, Nussbaum‐Krammer C, Mogk A, Nillegoda NB, Szlachcic A, Guilbride DL, Saibil HR, Mayer MP, Bukau B (2015) Human Hsp70 disaggregase reverses Parkinson's‐linked alpha‐synuclein amyloid fibrils. Mol Cell 59: 781–793 [DOI] [PMC free article] [PubMed] [Google Scholar]
- Gusella JF, MacDonald ME (2000) Molecular genetics: unmasking polyglutamine triggers in neurodegenerative disease. Nat Rev Neurosci 1: 109–115 [DOI] [PubMed] [Google Scholar]
- Havel LS, Li S, Li XJ (2009) Nuclear accumulation of polyglutamine disease proteins and neuropathology. Mol Brain 2: 21 [DOI] [PMC free article] [PubMed] [Google Scholar]
- Hipp MS, Patel CN, Bersuker K, Riley BE, Kaiser SE, Shaler TA, Brandeis M, Kopito RR (2012) Indirect inhibition of 26S proteasome activity in a cellular model of Huntington's disease. J Cell Biol 196: 573–587 [DOI] [PMC free article] [PubMed] [Google Scholar]
- Hoffner G, Soues S, Djian P (2007) Aggregation of expanded huntingtin in the brains of patients with Huntington disease. Prion 1: 26–31 [DOI] [PMC free article] [PubMed] [Google Scholar]
- Jiang X, Sorkin A (2002) Coordinated traffic of Grb2 and Ras during epidermal growth factor receptor endocytosis visualized in living cells. Mol Biol Cell 13: 1522–1535 [DOI] [PMC free article] [PubMed] [Google Scholar]
- Kakkar V, Mansson C, de Mattos EP, Bergink S, van der Zwaag M, van Waarde MA, Kloosterhuis NJ, Melki R, van Cruchten RT, Al‐Karadaghi S, Arosio P, Dobson CM, Knowles TP, Bates GP, van Deursen JM, Linse S, van de Sluis B, Emanuelsson C, Kampinga HH (2016) The S/T‐rich motif in the DNAJB6 chaperone delays polyglutamine aggregation and the onset of disease in a mouse model. Mol Cell 62: 272–283 [DOI] [PubMed] [Google Scholar]
- Kim YE, Hosp F, Frottin F, Ge H, Mann M, Hayer‐Hartl M, Hartl FU (2016) Soluble oligomers of PolyQ‐expanded Huntingtin target a multiplicity of key cellular factors. Mol Cell 63: 951–964 [DOI] [PubMed] [Google Scholar]
- Kirstein J, Morito D, Kakihana T, Sugihara M, Minnen A, Hipp MS, Nussbaum‐Krammer C, Kasturi P, Hartl FU, Nagata K, Morimoto RI (2015) Proteotoxic stress and ageing triggers the loss of redox homeostasis across cellular compartments. EMBO J 34: 2334–2349 [DOI] [PMC free article] [PubMed] [Google Scholar]
- Kirstein J, Arnsburg K, Scior A, Szlachcic A, Guilbride DL, Morimoto RI, Bukau B, Nillegoda NB (2017) In vivo properties of the disaggregase function of J‐proteins and Hsc70 in Caenorhabditis elegans stress and aging. Aging Cell 16: 1414–1424 [DOI] [PMC free article] [PubMed] [Google Scholar]
- Kirstein‐Miles J, Scior A, Deuerling E, Morimoto RI (2013) The nascent polypeptide‐associated complex is a key regulator of proteostasis. EMBO J 32: 1451–1468 [DOI] [PMC free article] [PubMed] [Google Scholar]
- Kuo Y, Ren S, Lao U, Edgar BA, Wang T (2013) Suppression of polyglutamine protein toxicity by co‐expression of a heat‐shock protein 40 and a heat‐shock protein 110. Cell Death Dis 4: e833 [DOI] [PMC free article] [PubMed] [Google Scholar]
- Liang V, Ullrich M, Lam H, Chew YL, Banister S, Song X, Zaw T, Kassiou M, Gotz J, Nicholas HR (2014) Altered proteostasis in aging and heat shock response in C. elegans revealed by analysis of the global and de novo synthesized proteome. Cell Mol Life Sci 71: 3339–3361 [DOI] [PMC free article] [PubMed] [Google Scholar]
- Lipe H, Bird T (2009) Late onset Huntington Disease: clinical and genetic characteristics of 34 cases. J Neurol Sci 276: 159–162 [DOI] [PMC free article] [PubMed] [Google Scholar]
- Livak KJ, Schmittgen TD (2001) Analysis of relative gene expression data using real‐time quantitative PCR and the 2(‐Delta Delta C(T)) Method. Methods 25: 402–408 [DOI] [PubMed] [Google Scholar]
- Lorenz C, Lesimple P, Bukowiecki R, Zink A, Inak G, Mlody B, Singh M, Semtner M, Mah N, Aure K, Leong M, Zabiegalov O, Lyras EM, Pfiffer V, Fauler B, Eichhorst J, Wiesner B, Huebner N, Priller J, Mielke T et al (2017) Human iPSC‐derived neural progenitors are an effective drug discovery model for neurological mtDNA disorders. Cell Stem Cell 20: 659–674 e659 [DOI] [PubMed] [Google Scholar]
- Macdonald D, Tessari MA, Boogaard I, Smith M, Pulli K, Szynol A, Albertus F, Lamers MB, Dijkstra S, Kordt D, Reindl W, Herrmann F, McAllister G, Fischer DF, Munoz‐Sanjuan I (2014) Quantification assays for total and polyglutamine‐expanded huntingtin proteins. PLoS One 9: e96854 [DOI] [PMC free article] [PubMed] [Google Scholar]
- Mattoo RU, Sharma SK, Priya S, Finka A, Goloubinoff P (2013) Hsp110 is a bona fide chaperone using ATP to unfold stable misfolded polypeptides and reciprocally collaborate with Hsp70 to solubilize protein aggregates. J Biol Chem 288: 21399–21411 [DOI] [PMC free article] [PubMed] [Google Scholar]
- Miyoshi N, Oubrahim H, Chock PB, Stadtman ER (2006) Age‐dependent cell death and the role of ATP in hydrogen peroxide‐induced apoptosis and necrosis. Proc Natl Acad Sci USA 103: 1727–1731 [DOI] [PMC free article] [PubMed] [Google Scholar]
- Monsellier E, Redeker V, Ruiz‐Arlandis G, Bousset L, Melki R (2015) Molecular interaction between the chaperone Hsc70 and the N‐terminal flank of huntingtin exon 1 modulates aggregation. J Biol Chem 290: 2560–2576 [DOI] [PMC free article] [PubMed] [Google Scholar]
- Morley JF, Brignull HR, Weyers JJ, Morimoto RI (2002) The threshold for polyglutamine‐expansion protein aggregation and cellular toxicity is dynamic and influenced by aging in Caenorhabditis elegans . Proc Natl Acad Sci USA 99: 10417–10422 [DOI] [PMC free article] [PubMed] [Google Scholar]
- Muchowski PJ, Schaffar G, Sittler A, Wanker EE, Hayer‐Hartl MK, Hartl FU (2000) Hsp70 and hsp40 chaperones can inhibit self‐assembly of polyglutamine proteins into amyloid‐like fibrils. Proc Natl Acad Sci USA 97: 7841–7846 [DOI] [PMC free article] [PubMed] [Google Scholar]
- Navarro A, Sanchez Del Pino MJ, Gomez C, Peralta JL, Boveris A (2002) Behavioral dysfunction, brain oxidative stress, and impaired mitochondrial electron transfer in aging mice. Am J Physiol Regul Integr Comp Physiol 282: R985–R992 [DOI] [PubMed] [Google Scholar]
- Nguyen AW, Daugherty PS (2005) Evolutionary optimization of fluorescent proteins for intracellular FRET. Nat Biotechnol 23: 355–360 [DOI] [PubMed] [Google Scholar]
- Nikolaidis N, Nei M (2004) Concerted and nonconcerted evolution of the Hsp70 gene superfamily in two sibling species of nematodes. Mol Biol Evol 21: 498–505 [DOI] [PubMed] [Google Scholar]
- Nillegoda NB, Kirstein J, Szlachcic A, Berynskyy M, Stank A, Stengel F, Arnsburg K, Gao X, Scior A, Aebersold R, Guilbride DL, Wade RC, Morimoto RI, Mayer MP, Bukau B (2015) Crucial HSP70 co‐chaperone complex unlocks metazoan protein disaggregation. Nature 524: 247–251 [DOI] [PMC free article] [PubMed] [Google Scholar]
- O'Brien MC, Flaherty KM, McKay DB (1996) Lysine 71 of the chaperone protein Hsc70 is essential for ATP hydrolysis. J Biol Chem 271: 15874–15878 [DOI] [PubMed] [Google Scholar]
- Olzscha H, Schermann SM, Woerner AC, Pinkert S, Hecht MH, Tartaglia GG, Vendruscolo M, Hayer‐Hartl M, Hartl FU, Vabulas RM (2011) Amyloid‐like aggregates sequester numerous metastable proteins with essential cellular functions. Cell 144: 67–78 [DOI] [PubMed] [Google Scholar]
- Rampelt H, Kirstein‐Miles J, Nillegoda NB, Chi K, Scholz SR, Morimoto RI, Bukau B (2012) Metazoan Hsp70 machines use Hsp110 to power protein disaggregation. EMBO J 31: 4221–4235 [DOI] [PMC free article] [PubMed] [Google Scholar]
- Rauch JN, Gestwicki JE (2014) Binding of human nucleotide exchange factors to heat shock protein 70 (Hsp70) generates functionally distinct complexes in vitro . J Biol Chem 289: 1402–1414 [DOI] [PMC free article] [PubMed] [Google Scholar]
- Scherzinger E, Sittler A, Schweiger K, Heiser V, Lurz R, Hasenbank R, Bates GP, Lehrach H, Wanker EE (1999) Self‐assembly of polyglutamine‐containing huntingtin fragments into amyloid‐like fibrils: implications for Huntington's disease pathology. Proc Natl Acad Sci USA 96: 4604–4609 [DOI] [PMC free article] [PubMed] [Google Scholar]
- Scior A, Juenemann K, Kirstein J (2016) Cellular strategies to cope with protein aggregation. Essays Biochem 60: 153–161 [DOI] [PubMed] [Google Scholar]
- Simsek‐Duran F, Li F, Ford W, Swanson RJ, Jones HW Jr, Castora FJ (2013) Age‐associated metabolic and morphologic changes in mitochondria of individual mouse and hamster oocytes. PLoS One 8: e64955 [DOI] [PMC free article] [PubMed] [Google Scholar]
- Tam S, Geller R, Spiess C, Frydman J (2006) The chaperonin TRiC controls polyglutamine aggregation and toxicity through subunit‐specific interactions. Nat Cell Biol 8: 1155–1162 [DOI] [PMC free article] [PubMed] [Google Scholar]
- Wetzel R (2012) Physical chemistry of polyglutamine: intriguing tales of a monotonous sequence. J Mol Biol 421: 466–490 [DOI] [PMC free article] [PubMed] [Google Scholar]
- Wilbanks SM, DeLuca‐Flaherty C, McKay DB (1994) Structural basis of the 70‐kilodalton heat shock cognate protein ATP hydrolytic activity. I. Kinetic analyses of active site mutants. J Biol Chem 269: 12893–12898 [PubMed] [Google Scholar]
Associated Data
This section collects any data citations, data availability statements, or supplementary materials included in this article.
Supplementary Materials
Appendix
Expanded View Figures PDF
Table EV1
Review Process File