Abstract
TP63 is required to maintain stem cell pluripotency and suppresses the metastatic potential of cancer cells through multiple mechanisms. These functions are differentially regulated by individual isoforms, necessitating a deeper understanding of how the distinct transcriptional programs controlled by these isoforms affect cancer progression and outcomes. In this study, we conducted a pan-cancer analysis of The Cancer Genome Atlas (TCGA) to identify transcriptional networks regulated by TAp63 and ΔNp63 using transcriptomes derived from epidermal cells of TAp63−/− and ΔNp63−/− mice. Analysis of 17 cancer developmental and 27 cancer progression signatures revealed a consistent tumor suppressive pattern for TAp63. In contrast, we identified pleiotropic roles for ΔNp63 in tumor development and found that its regulation of Lef1 was crucial for its oncogenic role. ΔNp63 performed a distinctive role as suppressor of tumor progression by cooperating with TAp63 to modulate key biological pathways, principally cell cycle regulation, extra cellular matrix remodeling, epithelial-to-mesenchymal transition, and the enrichment of pluripotent stem cells. Importantly, these TAp63 and ΔNp63 signatures prognosticated progression and survival, even within specific stages, in bladder and renal carcinomas as well as low-grade gliomas. These data describe a novel approach for understanding transcriptional activities of TP63 isoforms across a large number of cancer types, potentially enabling identification of patient subsets most likely to benefit from therapies predicated on manipulating specific TP63 isoforms.
Keywords: The Cancer Genome Atlas, TAp63, ΔNp63, pluripotency, stem cells, extracellular matrix, epithelial mesenchymal transition, survival, staging
INTRODUCTION
TP53, TP63 and TP73 family of genes transcriptionally regulate genomic programs to induce apoptosis, cell cycle arrest, senescence, metabolic reprogramming and stem cell maintenance(1–8). Manipulating specific isoforms of Tp63 and Tp73 is an effective approach to induce regression in Tp53-deficient and mutant tumors(9). Although Tp63 and Tp73 roles in cancer have been described(4,5,7,9,10), the transcriptional roles of TP63 and TP73 in tumor development and progression have been perplexing due to their variable expression in tissues, their complex interaction with each other and with TP53, and the lack of adequate antibodies to distinguish between their isoforms(3).
TP63 is of particular interest due to its high expression in epithelial tissues(11,12), its clinical use as a diagnostic marker (13–15), and its role in stem cell maintenance, tumor suppression, and metastasis (3,6,8,12,16). Further, its two isoforms, TAp63 and ΔNp63, exert various modulatory roles in stem cell maintenance, cancer metastasis, and miRNA biogenesis(6–9). Yet, the broad tissue specific roles of the genes regulated by TAp63 and ΔNp63 in cancer development and progression remain to be deciphered and are important for the proper interpretation of its use as a clinical diagnostic marker.
In this study, we identified the connection between the activity of TP63 isoforms in stem cell maintenance and in regulatory networks that control cancer development and progression. By applying integrative model for TAp63 and ΔNp63 signatures from mice into The Cancer Genome Atlas (TCGA) derived signatures, we found that TAp63 transcriptional activity is lost in 13 cancer development signatures, indicative of a tumor suppressor pattern, while ΔNp63 activity is pleiotropic in cancer development. TAp63 and ΔNp63 exerted tumor suppressor activity in 4 cancers via modulation of stem cell, extracellular matrix (ECM), epithelial to mesenchymal transition (EMT) and cell cycle pathways. Interestingly, we found that the ability of ΔNp63 to transcriptionally regulate Lef1 dictates its tumor suppressor or oncogenic activity. These signatures are not only predictive of survival across stages, but can stratify patients within the same stage into different survival groups. These findings can be exploited by further classifying patients into groups that can benefit from TP63-isoform targeted therapy (9).
MATERIALS AND METHODS
Bioinformatics analysis
The primary and processed data for 9578 tumor and 730 normal samples were downloaded from The Cancer Genome Atlas website between July 2014 and February 2015. We aligned all TCGA sequencing data to Genome Reference Consortium Human Reference 38 (hg38) in order to identify all genes and TP63 isoforms (α, β, γ for TAp63 and ΔNp63). TAp63 signatures were derived from epidermal cells P1 TAp63−/− and wildtype mice at embryonic day 18.5 (6). For ΔNp63 murine gene signature, we used previously published transcriptome profiles (8). For putative tumor suppressor role of the TAp63 or ΔNp63 we identified genes that were significantly changing and in the same direction in both TAp63−/− (or ΔNp63−/−) and the corresponding tumor signature. For oncogenic roles, an inverse approach was taken. PCSS was identified separately for each gene signature and for each role (eg. tumor suppressor or oncogene) using association of gene scores and survival that conforms with the predicted function. The highest-ranking genes were then combined to establish a robust PCSS. Z-scores were used for all activity scoring then ranked by the highest and lowest 25th percentile quartiles. We utilized BP, KEGG and Reactome compendiums for pathway analysis. All studies were approved by the Institutional Review Board. All patient studies were conducted in accordance with the U.S. Common Rule ethical guidelines.
In vitro assays
MCF10CA1D.cl1 breast cancer cell linem Human lung squamous cell carcinoma HCC95 cell line, and Human kidney clear cell carcinoma Caki-1 cell line were cultured in corresponding media. For western blot analysis, blots were probed with anti-ΔNp63 (619002, Biolegend), Lef1 (2230S, Cell Signaling), Myc-tag (9B11, Cell Signaling) and Flag-tag (A8592, Sigma) overnight at 4°C. Actin (A5441, Sigma) was used as loading control. For real-time PCR analysis, total RNA was isolated using miRNeasy Mini Kit and cDNA synthesized using SuperScript First-Strand Synthesis System (Invitrogen) and followed by qRT-PCR ran in triplicates using Taqman Universal PCR Master Mix (Applied Biosystems). Taqman probes included: human Lef1 (Hs01547250_m1) and human GAPDH (Hs03929097_g1) as internal controls. Ct values were normalized to GAPDH. For siRNA assays, 40 nM of siLef1 (SASI_Hs02_00349169 and SASI_Hs01_00151600, Sigma) was transfected into 0.5×10⁶ cells on 6-cm dishes using Lipofectamine RNAi Max (Invitrogen). 1μg of plasmids was transfected into 0.5×10⁶ cells using X-tremeGENE HP DNA transfection reagent. pcDNA3.1-DYK-Lef1 and pcDNA3.1-DYK-empty plasmids were obtained from Genscript. ΔNp63α ORF was cloned into pcDNA3.1-Myc-empty plasmid. Cells were collected 48 hours post-transfection. Cells were stained with Click-iT EdU microplate assay (Invitrogen) and proliferation quantification was done using Celigo and Incucyte. For CFU assays, colonies were stained with 0.005% crystal violet for 1 hour.
RESULTS
Gene Set Enrichment Analysis (GSEA) and signature activity reveal pleiotropic roles of TAp63 and ΔNp63 in tumor development and progression
We generated TAp63 and ΔNp63 RNA signatures from primary TAp63−/− (Supplementary File 1) and ΔNp63−/− (8) mouse epidermal keratinocytes. We then analyzed TP63 isoform transcriptomes across TCGA tumors. Because stem cell maintenance in epithelial tissues is intimately tied with tumorigenesis, our approach integrates pathways in normal stem cell biology and cancer.
We derived tumor development signatures by comparing the expression profile of tumors to normal tissues. Tumor progression signatures were derived by comparing expression profile of high stage/grade tumors to low stage/grade tumors (Supplementary File 2). We characterized TP63 isoforms transcriptomes in cancer development and progression by employing the GSEA algorithm (17) in 17 tumor development and 27 tumor progression signatures. Identification of putative tumor suppressor and oncogene activities of TP63 isoforms in cancer development and progression was based on significance, directionality, and enrichment concordance. Specifically, when both upregulated and downregulated cancer signature genes are significantly enriched in concordant direction (positive normalized enrichment scores (NES) for upregulated genes, and negative NES for downregulated genes) in TAp63−/− or ΔNp63−/− signatures, this suggests a concordance with the TAp63 or ΔNp63-deficient genotypes, thus a potential tumor suppressor activity. Alternatively, discordant enrichment in TAp63−/− or ΔNp63−/− signatures suggests a predominant wildtype phenotype, and hence a potentially corresponding oncogenic activity. We then identified TP63 isoforms-derived signatures to measure corresponding transcriptional activity among patients and across stages, and to assess for survival (Fig. 1a).
Figure 1. TAp63 and ΔNp63 have tissue-dependent activity in tumor development.
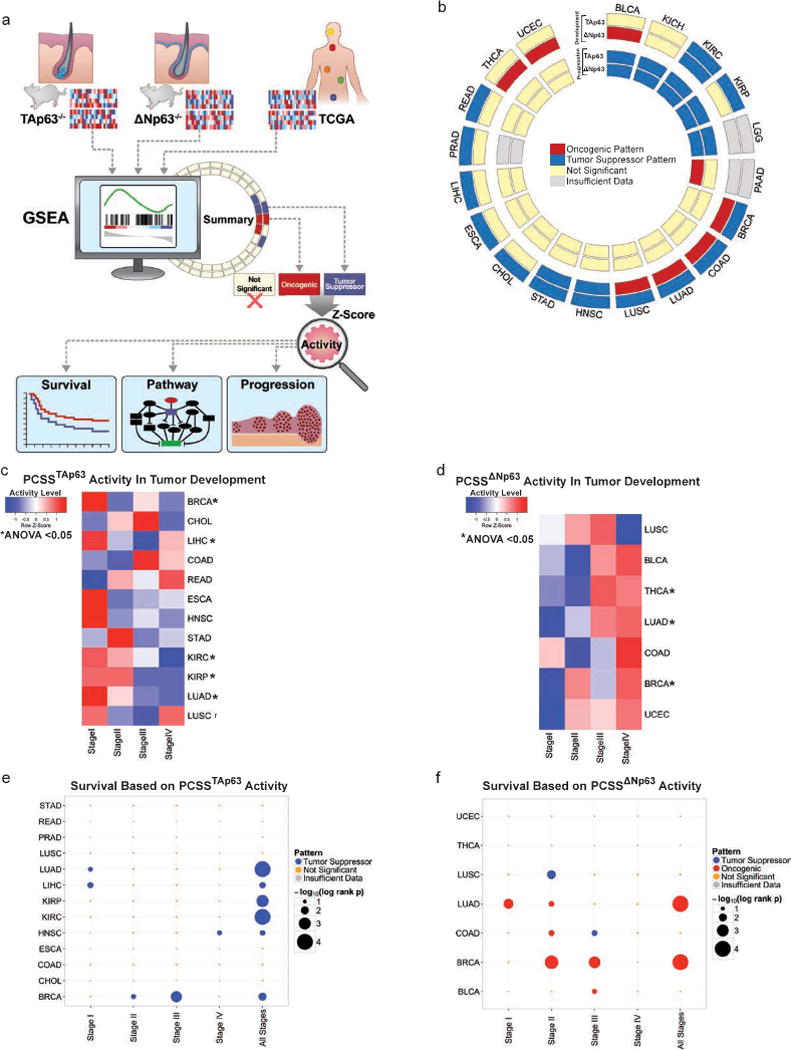
a, Working model for identification of transcriptional networks enriched in TCGA tumors b, Summary of GSEA concordant findings across in cancer development and cancer progression signatures. c, Heatmap of the activity of PCSSTAp63 across different stages of tumorigenesis. d, Heatmap of the activity of PCSSΔNp63 across different stages of tumorigenesis. e, Dot plot of the survival analysis of different tumors with respect to PCSSTAp63 activity. f, Dot plot of the survival analysis of different tumors with respect to PCSSΔNp63 activity.
TAp63 consistently exhibited a tumor suppressor pattern in 13 cancer development signatures, while ΔNp63 exhibited a pleiotropic role in tumorigenesis: oncogenic pattern in 7 signatures and a tumor suppressive pattern in 3 cancer development signatures (q<0.0001 for all) (Fig. 1b, Supplementary Table 1).
TAp63 and ΔNp63 signatures predict patient survival
To enable pan-cancer clinical assessment applications informed by TAp63 and ΔNp63 transcriptional activities, we refined TAp63 tumor suppressive and ΔNp63 oncogenic signatures (Supplementary File 3.1–3.2) based on a survival-predictive model dubbed Pan Cancer Survival Signature (PCSSTAp63 and PCSSΔNp63, respectively). PCSSTAp63 activity significantly decreased across various Stages I to IV cancers including breast (BRCA), kidney clear cell (KIRC), and kidney papillary (KIRP), lung adenocarcinoma (LUAD), and lung squamous cell (LUSC) carcinoma (ANOVA<0.0001–0.032) exhibiting a tumor suppressor pattern (Fig. 1c). However, PCSSΔNp63 activity increased significantly from Stage I to IV in BRCA and LUAD (ANOVA<0.0001) patterning an oncogenic role (Fig. 1d). Patients with increased activity of PCSSTAp63 and PCSSΔNp63 had significantly better and worse overall survival, respectively, within stages and across all patients (p<0.0001–0.038) (Fig. 1e–f). Corresponding enriched pathways are summarized in Supplementary Figure 1a–b and File 3.3–3.4.
ΔNp63 activates an oncogenic program through transcriptional regulation of its downstream target, Lef1
To explore the functional pleiotropic role of ΔNp63, we first manipulated ΔNp63 expression in breast and LUAD cell lines, where we found ΔNp63 to be oncogenic. Knockdown of ΔNp63 in MCF10-CA1D breast cancer cells, where ΔNp63 is overexpressed (Supplementary Fig. 2a), reduced proliferation and soft agar colony formation (Fig. 2a–d, and Supplementary Fig. 2b). In HCC95 LUAD cells, where ΔNp63 is overexpressed (Supplementary Fig. 2a), knockdown of ΔNp63 decreased soft agar colony formation but not proliferation (Fig. 2e–h, and Supplementary Fig. 2b). To assess tumor suppressor activities of ΔNp63, we overexpressed ΔNp63α in Caki-1 human renal cancer cells (Supplementary Fig. 2b), where we found ΔNp63 as tumor suppressive (Fig. 1b) and while we did not observe significant differences in proliferation (Fig. 2i–j), the number of colonies decreased by 2-fold compared to control (Fig. 2k–l). These data further support that ΔNp63 plays a pleiotropic role depending on tissue of origin.
Figure 2. ΔNp63 plays a pleiotropic role as a tumor suppressor or oncogene.
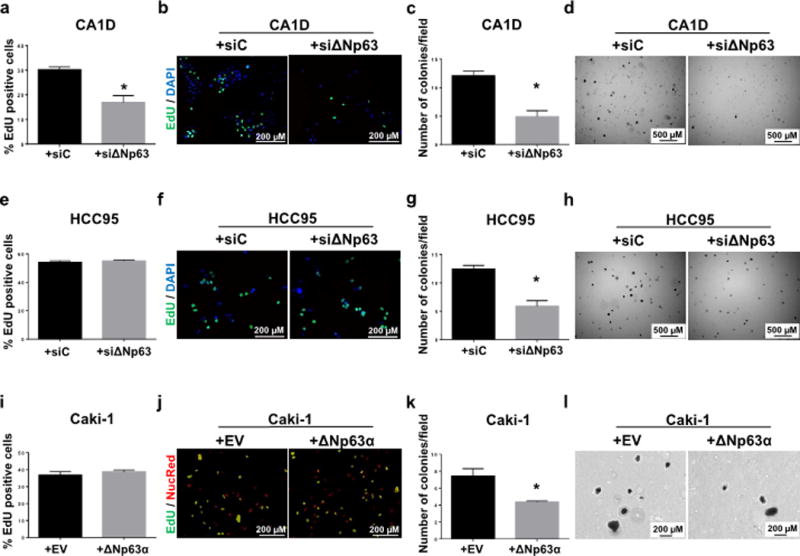
a–b, e–f,i–j, Quantification and fluorescence representative images of EdU (green) incorporation MCF10-CA1D (a–b), HCC95 (e–f) and Caki-1 (i–j) cell lines. c–d, g–h, k–l, Quantification and bright field representative images of anchorage-independent colony formation of MCF10-CA1D (c–d), HCC95 (g–h) and Caki-1 (k–l) cell lines in soft agar assay (per 10× field). Data are mean ± SD, n = 3. Asterisks indicate statistical significance, p < 0.005 versus siRNA scramble control (siC) or empty vector (EV), two-tailed t test.
To identify the pleiotropic mechanism exerted by ΔNp63 in tumorigenesis, we overlapped previously published human ΔNp63 Chip-Seq data (18) with our TCGA derived signatures, which revealed enrichment for EMT genes. Next, we conducted hypergeometric analysis to identify transcription factors that regulate these EMT genes and overlap ΔNp63 keratinocyte signatures. We identified Lef1 targets (INHBA, USP2, COL5A1, BMP1, PMEPA1) to be highly significant (p=0.0009). To assess whether the oncogenic role of ΔNp63 functions through Lef1, we assessed Lef1 mRNA expression in MCF10-CA1D and HCC95 cell lines after ΔNp63 knockdown. Lef1 expression decreased (Fig. 3a–b) indicating that Lef1 is downstream of ΔNp63. We then knocked down Lef1 in both MCF10-CA1D and HCC95 cell lines (Fig. 3c), and measured soft agar colony growth. Similarly to the results where ΔNp63 was knocked down, the Lef1 knockdown reduced MCF10-CA1D and HCC95 colony formation (Fig. 3d–g). In addition, overexpressing Lef1 in ΔNp63-knocked down cells (Supplementary Fig. 3a) significantly increased MCF10-CA1D and HCC95 colony formation (Fig. 3h–k), and MCF10-CA1D cell proliferation (Supplementary Fig. 3b–c), but not HCC95 proliferation (Supplementary Fig. 3d–e). Together, these data demonstrated that ΔNp63 functions as an oncogene via regulating Lef1. Importantly, the ΔNp63-overexpressing Caki-1 cells had increased Lef1 mRNA and protein expression (Supplementary Fig. 4a–b), which further confirmed that ΔNp63 regulates Lef1 expression. To assess whether the tumor suppressive role of ΔNp63 functions through Lef1, we overexpressed Lef1 in Caki-1 cells, and noted a non-statistically significant decrease in soft agar colony formation (Supplementary Fig. 4c–e). When Lef1 was knocked down in Caki-1 cells where we overexpressed ΔNp63 (Supplementary Fig. 4f), no significant difference was noted with respect to cell proliferation and colony formation (Supplementary Fig. 4g–j), suggesting the involvement of other factors in addition to Lef1 in the tumor suppressor roles of ΔNp63. Hence, ΔNp63 regulation of Lef1 dictates its oncogenic roles in different tissues while the tumor suppressor pathways of ΔNp63 are still not identified.
Figure 3. Lef1 is downstream of ΔNp63 and dictates the function of ΔNp63 as a tumor suppressor or oncogene.
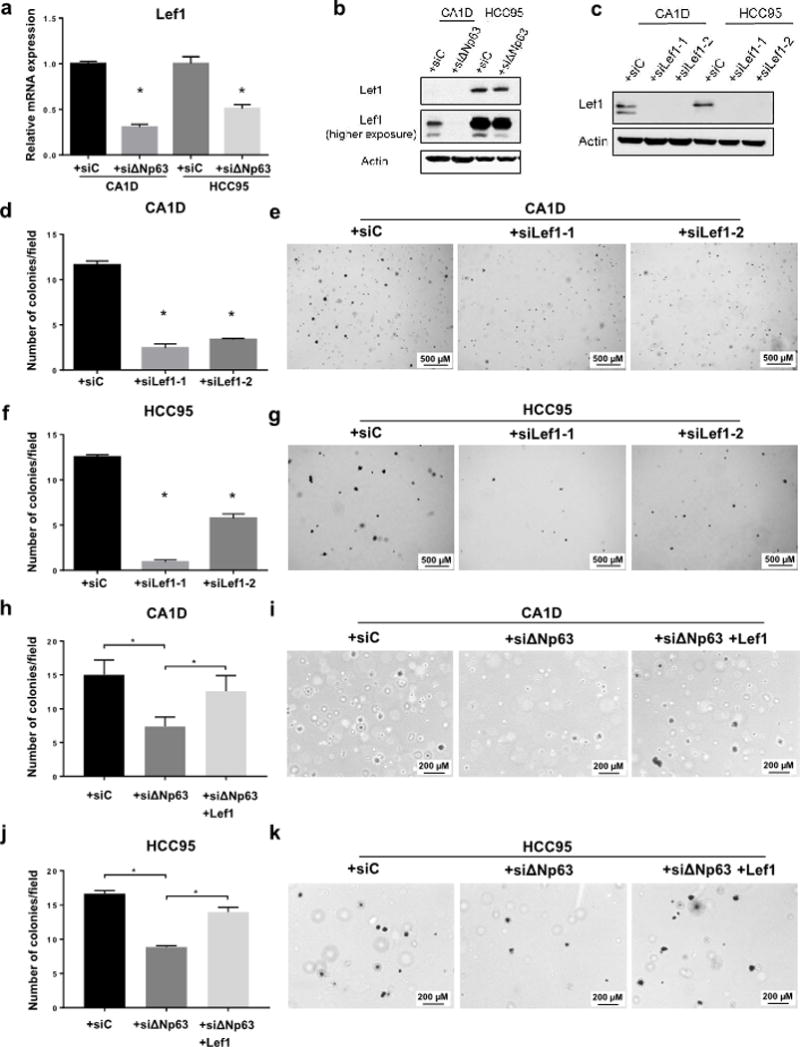
a, qRT-PCR for Lef1 in MCF10-CA1D and HCC95 cells expressing either siC or siΔNp63. Asterisks indicate statistical significance, p < 0.005 versus siC, two-tailed t test. b–c, Western blot analysis for: Lef1 expression in MCF10-CA1D and HCC95 cells expressing either siC or siΔNp63 (b) or in MCF10-CA1D and HCC95 cells treated with siC, siLef1-1 or siLef1-2 (c). Actin was used as a loading control. d–k, Quantification and bright field representative images of anchorage-independent colony formation of indicated cell lines in soft agar assay (per 10× field). Data are mean ± SD, n = 3. Asterisks indicate statistical significance, p < 0.005 versus siC or siΔNp63, two-tailed t test.
TAp63- and ΔNp63-regulated transcriptional activities are lost in higher stages and can predict survival of BLCA, KIRC, KIRP and LGG
GSEA analysis revealed a suppressive role for both TAp63 and ΔNp63 in the progression of 4 tumors: bladder cancer (BLCA), KIRC, KIRP and low grade glioma (LGG) (Fig. 4a). To explore the role of TP63 isoforms in tumor progression, we first identified TAp63- and ΔNp63-regulated genes that were enriched in cancer progression signatures and the corresponding isoform signature, hereafter dubbed TAp63BLCA, ΔNp63BLCA, TAp63KIRC, ΔNp63KIRC, TAp63KIRP, ΔNp63KIRP, TAp63LGG and ΔNp63LGG (Supplementary File 4.1–4.2 and Supplementary Figure 5a–b).
Figure 4. Tumor suppressor activity of TAp63 and ΔNp63 in cancer progression.
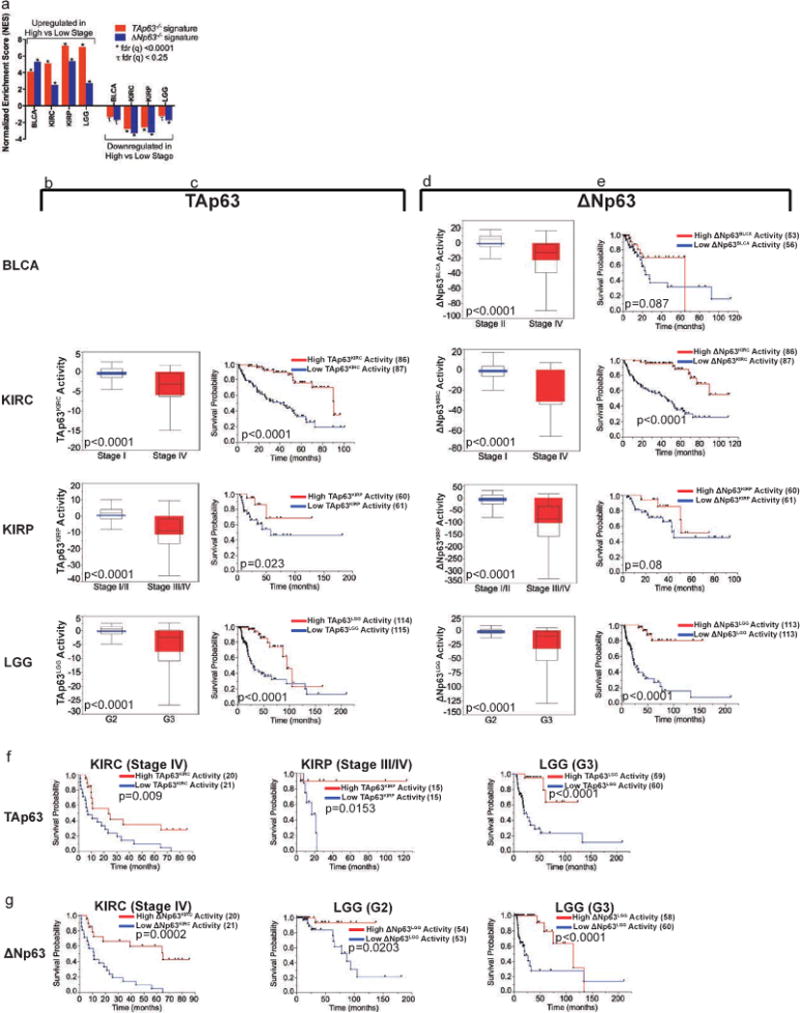
a, Normalized enrichment score (NES) of upregulated and downregulated cancer progression signatures in TAp63−/− and ΔNp63−/− signatures. b, Activity score of TAp63KIRC, TAp63KIRP and TAp63LGG in corresponding cancer patients at high and low grade/stages. c, Kaplan-Meier survival of kidney clear cell (KIRC), kidney papillary (KIRP) and low grade glioma (LGG) patients with respect to the corresponding TAp63 signature activity. d, Activity score of ΔNp63BLCA, ΔNp63KIRC, ΔNp63KIRP and ΔNp63LGG in corresponding cancer patients at high and low grade/stages. e, Kaplan-Meier survival of bladder cancer (BLCA), KIRC, KIRP and LGG patients with respect to the corresponding ΔNp63 signature activity. f, Kaplan-Meier survival within Stage IV KIRC, Stage III/IV KIRP and Grade (G) 3 LGG with respect to TAp63KIRC, TAp63KIRP and TAp63LGG activities. g, Kaplan-Meier survival within Stage IV KIRC, and G2 and G3 LGG patients with respect to ΔNp63KIRC and ΔNp63LGG activities, respectively. Number of cases in each survival group is listed between parenthesis where indicated.
We found that high grade/stage KIRC, KIRP and LGG tumors had significantly lower activities of their corresponding TAp63-driven signatures compared to low grade/stage tumors (p<0.0001) (Fig. 4b). KIRC (p<0.0001), KIRP (p=0.023) and LGG (p<0.0001) patients with higher corresponding TAp63 activity had significantly better survival than patients with lower corresponding TAp63 activity (Fig. 4c). Similarly, high grade/stage BLCA, KIRC, KIRP and LGG tumors had significantly lower activities of their corresponding ΔNp63-driven signatures compared to low grade/stage tumors (p<0.0001) (Fig. 4d), and KIRC (p<0.0001) and LGG (p<0.0001) patients with higher corresponding ΔNp63 activities had better survival (Fig. 4e). These data suggest that higher grade/stage tumors lose TAp63 and ΔNp63 activities when progressing. Association between activity and survival was also evident within the same grade/stage of tumors (Fig. 4f and 4g). This is of particular importance as it suggests that there is significant heterogeneity in the activity of ΔNp63 within high stages of KIRC, KIRP and LGG that may warrant different therapy. TAp63BLCA consisted of 1 gene only (COL8A1) and was not assessed.
We then used independent cohorts to validate our findings. With respect to TAp63, high grade (19) and stage (20) KIRC, high stage KIRP (21) and high grade LGG (22) tumors had significantly lower corresponding TAp63-signature activities (Fig. 5a and Supplementary Figure 6a). Also, KIRP patients (21) with higher TAp63KIRP activity had significantly better survival than KIRP patients with lower TAp63KIRP activity (Fig. 5b). Similarly, high stage BLCA (23), high grade (19) and stage (20) KIRC, high stage KIRP (21), and high grade LGG (22) patients had significantly lower corresponding ΔNp63-signature activities (Fig. 5c and Supplementary Figure 6b). These findings also translated into significantly better survival for BLCA and KIRP patients with higher corresponding ΔNp63-signature activities (Fig. 5d). These findings indicate that TAp63 and ΔNp63 derived signatures can predict survival across cancers and within specific stages in different cohorts and can identify patients with better survival among advanced tumors. Further, the large number of genes and pathways identified can be exploited in the clinic to identify therapies that could target these downstream effectors and can explain the heterogeneity in responding to certain treatments.
Figure 5. Validation of TAp63 and ΔNp63 in independent cohorts.
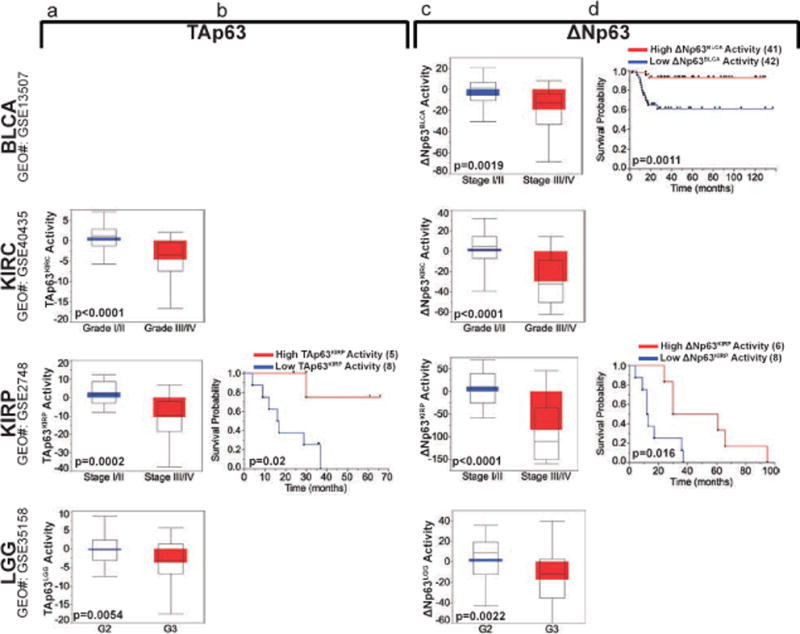
a, Validation of corresponding TAp63 activities in independent cohorts of kidney clear cell (KIRC), kidney papillary (KIRP) and low grade glioma (LGG). b, Survival of KIRP in independent cohorts with respect to TAp63KIRP activity. c, Validation of corresponding ΔNp63 activities in independent cohorts of bladder cancer (BLCA), KIRC, KIRP and LGG. d, Survival of BLCA and KIRP in independent cohorts with respect to ΔNp63BLCA and ΔNp63KIRP activities, respectively. Number of cases in each group is listed between parenthesis where indicated.
Patient prognosis correlates with expression profiles of TAp63 and ΔNp63 regulated signatures
We conducted unsupervised hierarchal clustering on BLCA, KIRC, KIRP and LGG patients with respect to corresponding TP63 isoform signatures. We identified multiple clusters (C) corresponding to TAp63 and ΔNp63 derived signatures (Fig. 6a–b). The corresponding activity and survival pattern was significantly different across the clusters identified in all cancers (Fig. 6c–d). Specifically, patients with the highest TAp63 and ΔNp63 activity had significantly better survival than the other clusters (Fig. 6e–f). These findings provide strong evidence of distinct TAp63 and ΔNp63 transcriptome profiles that identify distinct groups of patients within cancers and can predict their survival. This is of major significance given tumor heterogeneity and the difficulty of identifying patients with different prognosis within the same stage or group.
Figure 6. Expression profiles of TAp63 and ΔNp63 regulated signatures in identify different groups of BLCA, KIRC, KIRP and LGG patients with different prognosis.
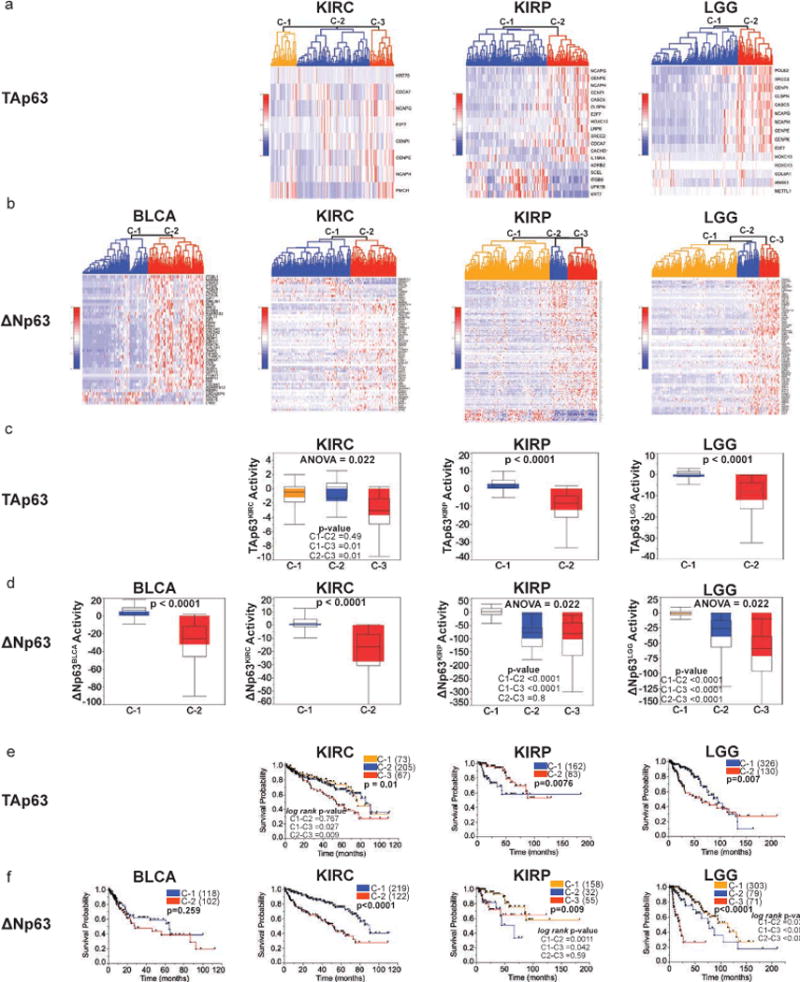
a–b, Unsupervised hierarchal clustering of bladder cancer (BLCA), kidney clear cell (KIRC), kidney papillary (KIRP) and low grade glioma (LGG) patients based on expression profile of corresponding (a) TAp63 and (b) ΔNp63 signatures. c–d, Activity score of (c) TAp63KIRC, TAp63KIRP and TAp63LGG and (d) ΔNp63BLCA, ΔNp63KIRC, ΔNp63KIRP and ΔNp63LGG in corresponding cancer patients of different clusters. e–f, Kaplan-Meier survival of different clusters of BLCA, KIRC, KIRP and LGG patients with respect to corresponding (e) TAp63 and (f) ΔNp63 expression profile. Number of cases in each survival group is listed between parenthesis where indicated.
Cell cycle activity, pluripotency potential, EMT and ECM remodeling in high stage tumors modulated by TAp63 and ΔNp63 signatures
Cell cycle, sister chromatid/chromosome and organelle regulatory pathways were the most highly enriched pathways in TAp63 signatures (Supplementary Figure 7a and Supplementary File 4.3). For ΔNp63-derived signatures, there were 2 genes (CTHRC1 and COL5A1 both are major ECM constituents) and 14 pathways that were common among ΔNp63BLCA, ΔNp63KIRC, ΔNp63KIRP and ΔNp63LGG (Supplementary File 4.4). The highest enrichments in ΔNp63 signatures were developmental and ECM remodeling pathways (Supplementary Figure 7b) which were of significant interest as these were indicative of stem cell pluripotency, EMT, and metastatic mechanisms. Because TAp63 and ΔNp63 were both acting as suppressors of tumor progression in the same cancers, we investigated whether these roles are exerted via common or distinct transcriptome networks. Interestingly, there were few overlapping genes regulated by corresponding TAp63 and ΔNp63 signatures in KIRC, BLCA, LGG and KIRP progression (Supplementary Figure 7c–f).
CTHRC1 and COL5A1 are ΔNp63-regulated genes common to BLCA, KIRC, KIRP and LGG progression signatures. In addition to the ECM remodeling role of CTHRC1 and COL5A1, COL5A1 is also highly expressed in known stem cell signatures. Hence, we investigated whether the ΔNp63 activity of these two genes, hereafter dubbed ΔNp63CTHRC1/COL5A1, could predict staging and survival. In addition to the ECM remodeling role of CTHRC1 and COL5A1, COL5A1 is also highly expressed in known stem cell signatures (24). We found significantly lower ΔNp63CTHRC1/COL5A1 activity in the higher grade/stage of BLCA, KIRC, KIRP and LGG (p<0.0001 for all) (Supplementary Figure 8a). Further, KIRC (p=0.0009), KIRP (0.0086) and LGG (p=0.0241) patients with higher activity of ΔNp63CTHRC1/COL5A1 had significantly better survival than patients with lower activity (Supplementary Figure 8b). We then assessed whether single gene expression profile of COL5A1 and CTHRC1 correlates with survival in BLCA, KIRC, KIRP and LGG tumors. Interestingly, patients with higher expression of COL5A1 or CTHRC1 almost consistently had worst prognosis (p< 0.05) (Supplementary Figure 9a–b). These findings show that a ΔNp63-regulated signature driven by 2 genes that are known to modulate ECM and stem cell pluripotency can predict progression and survival of patients.
We then investigated whether previously published stem cell signatures were enriched in high grade/stage tumors and ΔNp63−/− keratinocytes. GSEA analyses identified a significant enrichment of cancer invasive and primary stem cells(25,26), mouse and human embryonic stem cell signatures(24,27), and Nanog, Oct4 and Sox2 (NOS) targets(27) in high grade/stage tumors and ΔNp63−/− epidermal cells signatures (Fig. 7a). Similarly, there was significant enrichment of primary tumor and metastatic ECM signatures(28) in high stage/grade and ΔNp63−/− epidermal cell signatures (Fig. 7b). We found a significant enrichment of EMT in ΔNp63−/− keratinocytes and progression signatures of BLCA, KIRC and KIRP (Fig. 7c), which is interesting given the role of TP63 isoforms in stem cell maintenance.
Figure 7. Enrichment of pluripotency, ECM and EMT in ΔNp63 driven progression signatures, and cooperation between TAp63 and ΔNp63 to suppress progression.
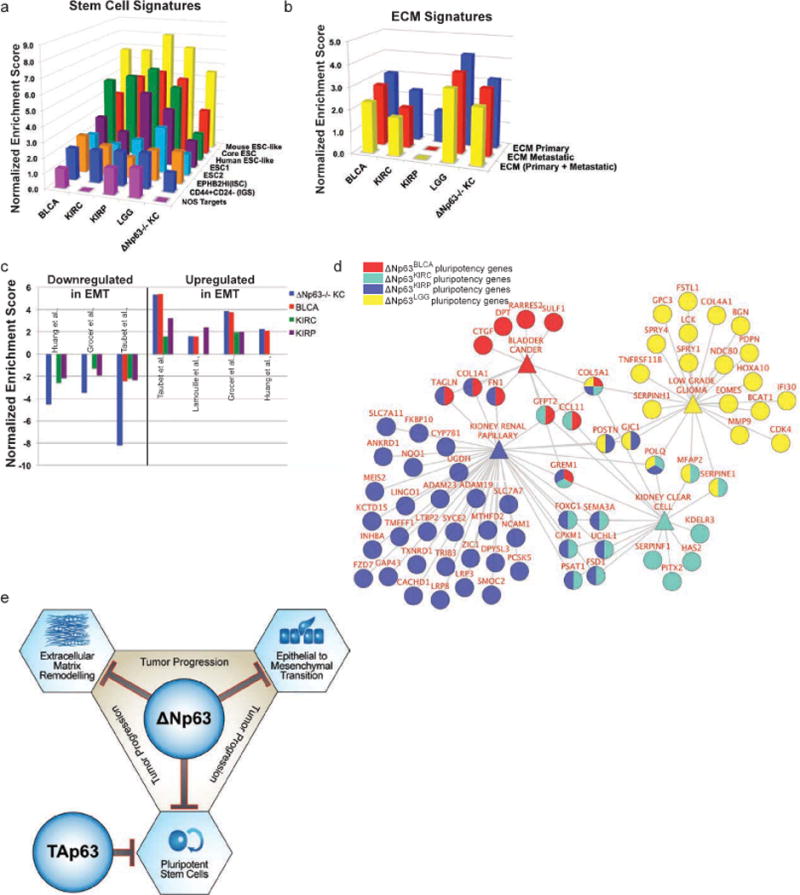
a–c, Normalized enrichment scores (NES) of bladder cancer (BLCA), kidney clear cell (KIRC), kidney papillary (KIRP) and low grade glioma (LGG) progression and ΔNp3−/− signatures in (a) known stem cells and pluripotency, (b) ECM and (c) EMT signatures. d, ClueGO diagram representing enrichment for pluripotency genes in ΔNp63 driven signatures of BLCA, KIRC, KIRP and LGG. e, Suggested model of cooperativity between TAp63 and ΔNp63 to suppress tumor progression via modulation of EMT, ECM, pluripotency and cell cycle activity.
To identify specific ΔNp63-regulated genes that promote stem cell pluripotency in cancer progression, we compared ΔNp63BLCA, ΔNp63KIRP, ΔNp63KIRC and ΔNp63LGG signatures to the known stem cell signatures that were enriched in our progression cancer model shown in Figure 7a(24–27). We found 11, 17, 43, and 23 ΔNp63-regulated stem cell pluripotency genes to be upregulated in ΔNp63BLCA, ΔNp63KIRP, ΔNp63KIRC and ΔNp63LGG and at least one previously published stem cell signature, respectively (Fig. 7d). We also identified overlapping genes between the different signatures (Fig. 7d). Interestingly, one stem cell pluripotency gene COL5A1 is regulated by ΔNp63, common to all of ΔNp63BLCA, ΔNp63KIRP, ΔNp63KIRC and ΔNp63LGG signatures, and is also a major ECM remodeling factor; we showed it to be a major predictor of staging and survival when combined with CTHRC1. To note, the role of ΔNp63 in pluripotency in the different tumors is exerted via a large network of genes as evident from the little overlap among the stem cell pluripotency genes of ΔNp63BLCA, ΔNp63KIRP, ΔNp63KIRC and ΔNp63LGG. The suppressive activity of ΔNp63 in tumor progression is consistent with previous reports indicating that ΔNp63 serves to promote differentiation of epithelial tissues and that loss of ΔNp63 leads to pluripotency(8,29). The progression of these tumors entails loss of TAp63 and ΔNp63 activities, which leads to increased stem cell pluripotency, ECM remodeling, and EMT via ΔNp63, and disruption of normal cell cycle regulation by TAp63, which ultimately leads to progression and metastasis (Fig. 7e). These findings identify patients within different stages that could benefit from treatments that specifically target these pathways.
DISCUSSION
In this study, we conducted a pan-cancer analysis using TCGA and informed by unique transcriptome profiles of TP63 isoforms, TAp63 and ΔNp63. These unique transcriptome profiles were generated from TAp63−/− and ΔNp63−/− epidermal cells exhibiting profound phenotypes in epithelial stem cell maintenance and renewal, and thus, allowed for an assessment of p63 isoform-driven stem cell biology in cancer development and progression (Fig 1a)(6,8,12,29). TP63 alterations have been previously implicated in many cancer(30–33) and is frequently used as a diagnostic marker(34,35). Our mechanistic understanding and the clinical significance of the underlying mechanisms of TP63 isoforms in tumor suppression and oncogenesis are still poorly defined. Here, we found that while TAp63 activity follows a suppressive pattern in tumor development and progression, the activity of ΔNp63 was pleiotropic in cancer development. Importantly, we identified Lef1 as a major downstream target of ΔNp63 that mediates the switch between the tumor suppressive and oncogenic activities of ΔNp63 in a tissue specific manner. The ΔNp63-Lef1 axis seems to be crucial for its role as an oncogene while the underlying factors that dictate its role as a tumor suppressor gene remain to be elucidated. Importantly, we found no evidence that TAp63 regulates Lef1 neither in our genomic analysis nor via chromatin immunoprecipitation assay (ChiP) (Napoli and Flores, unpublished data).
This study constitutes the largest analysis from TCGA platform in terms of number of cancers analyzed and in light of important epidermal stem cell and cancer regulators, TAp63 and ΔNp63, and their transcriptional networks. We unveiled TAp63 and ΔNp63 driven signatures that can predict tumor development, progression, and patient survival. Although ΔNp63 was previously thought to act primarily an oncogene, ΔNp63 has more recently been found to be lost during tumor progression and proposed to be able to suppress metastasis(36,37). Our results demonstrate that ΔNp63 plays a dual role as a tumor suppressor or oncogene in cancer development. Its regulation of Lef1 is crucial for its oncogenic roles. In addition, ΔNp63 acts as a suppressor of tumor progression. Using integrative bioinformatics analyses, we identified TAp63-driven and ΔNp63-driven transcriptional networks that can predict survival and tumor progression within and across cancer stages. Our findings identify patient populations that may benefit from targeting TAp63 and ΔNp63 pathways in order to improve their survival. Further, the TAp63 and ΔNp63 signatures establish an expression profile that can identify different clusters of patients with differential potential to express stem cell pluripotency, ECM and EMT markers that can confer resistance to treatment.
Supplementary Material
Acknowledgments
E.R. Flores was supported by a grant from NCI (R01CA160394 and R35CA197452), CPRIT (RP140271 and RP150094), NCI-Cancer Center Core Grant (CA-16672) (University of Texas M.D. Anderson Cancer Center), the Hildegardo E. and Olga M. Flores Foundation, and the Mel Klein Foundation. E.R. Flores is an NCI Outstanding Investigator, a Moffitt Distinguished Scholar, a scholar of the Leukemia and Lymphoma Society, the Rita Allen Foundation and the V Foundation for Cancer Research. C. Coarfa was partially supported by an Alkek Center for Molecular Discovery Pilot grant, and by the Cancer Prevention & Research Institute grants (RP120092 (Texas Proteomics & Metabolomics Core Facility), RP170295, RP170005). K.Y. Tsai was supported by a grant from NCI (R01CA194617 and R01CA194062). H.A. Abbas was supported by an Odyssey Fellowship at University of Texas M D Anderson Cancer Center.
Footnotes
Competing financial interests: All authors declare no competing financial interests.
References
- 1.Chang CJ, Chao CH, Xia W, Yang JY, Xiong Y, Li CW, et al. p53 regulates epithelial-mesenchymal transition and stem cell properties through modulating miRNAs. Nature cell biology. 2011;13:317–23. doi: 10.1038/ncb2173. [DOI] [PMC free article] [PubMed] [Google Scholar]
- 2.Lane DP. Cancer. p53, guardian of the genome. Nature. 1992;358:15–6. doi: 10.1038/358015a0. [DOI] [PubMed] [Google Scholar]
- 3.Su X, Chakravarti D, Flores ER. p63 steps into the limelight: crucial roles in the suppression of tumorigenesis and metastasis. Nature reviews Cancer. 2013;13:136–43. doi: 10.1038/nrc3446. [DOI] [PMC free article] [PubMed] [Google Scholar]
- 4.Flores ER, Tsai KY, Crowley D, Sengupta S, Yang A, McKeon F, et al. p63 and p73 are required for p53-dependent apoptosis in response to DNA damage. Nature. 2002;416:560–4. doi: 10.1038/416560a. [DOI] [PubMed] [Google Scholar]
- 5.Flores ER, Sengupta S, Miller JB, Newman JJ, Bronson R, Crowley D, et al. Tumor predisposition in mice mutant for p63 and p73: evidence for broader tumor suppressor functions for the p53 family. Cancer cell. 2005;7:363–73. doi: 10.1016/j.ccr.2005.02.019. [DOI] [PubMed] [Google Scholar]
- 6.Su X, Paris M, Gi YJ, Tsai KY, Cho MS, Lin YL, et al. TAp63 prevents premature aging by promoting adult stem cell maintenance. Cell stem cell. 2009;5:64–75. doi: 10.1016/j.stem.2009.04.003. [DOI] [PMC free article] [PubMed] [Google Scholar]
- 7.Su X, Chakravarti D, Cho MS, Liu L, Gi YJ, Lin YL, et al. TAp63 suppresses metastasis through coordinate regulation of Dicer and miRNAs. Nature. 2010;467:986–90. doi: 10.1038/nature09459. [DOI] [PMC free article] [PubMed] [Google Scholar]
- 8.Chakravarti D, Su X, Cho MS, Bui NH, Coarfa C, Venkatanarayan A, et al. Induced multipotency in adult keratinocytes through down-regulation of DeltaNp63 or DGCR8. Proceedings of the National Academy of Sciences of the United States of America. 2014;111:E572–81. doi: 10.1073/pnas.1319743111. [DOI] [PMC free article] [PubMed] [Google Scholar]
- 9.Venkatanarayan A, Raulji P, Norton W, Chakravarti D, Coarfa C, Su X, et al. IAPP-driven metabolic reprogramming induces regression of p53-deficient tumours in vivo. Nature. 2015;517:626–30. doi: 10.1038/nature13910. [DOI] [PMC free article] [PubMed] [Google Scholar]
- 10.Tomasini R, Tsuchihara K, Wilhelm M, Fujitani M, Rufini A, Cheung CC, et al. TAp73 knockout shows genomic instability with infertility and tumor suppressor functions. Genes & development. 2008;22:2677–91. doi: 10.1101/gad.1695308. [DOI] [PMC free article] [PubMed] [Google Scholar]
- 11.Mills AA, Zheng B, Wang XJ, Vogel H, Roop DR, Bradley A. p63 is a p53 homologue required for limb and epidermal morphogenesis. Nature. 1999;398:708–13. doi: 10.1038/19531. [DOI] [PubMed] [Google Scholar]
- 12.Yang A, Schweitzer R, Sun D, Kaghad M, Walker N, Bronson RT, et al. p63 is essential for regenerative proliferation in limb, craniofacial and epithelial development. Nature. 1999;398:714–8. doi: 10.1038/19539. [DOI] [PubMed] [Google Scholar]
- 13.Abd Raboh NM, Hakim SA. Diagnostic role of DOG1 and p63 immunohistochemistry in salivary gland carcinomas. Int J Clin Exp Pathol. 2015;8:9214–22. [PMC free article] [PubMed] [Google Scholar]
- 14.Kiselyov A, Bunimovich-Mendrazitsky S, Startsev V. Key Signaling Pathways in the Muscle-Invasive Bladder Carcinoma: Clinical Markers for Disease Modeling and Optimized Treatment. Int J Cancer. 2015 doi: 10.1002/ijc.29918. [DOI] [PubMed] [Google Scholar]
- 15.Ma Y, Fan M, Dai L, Kang X, Liu Y, Sun Y, et al. Expression of p63 and CK5/6 in early-stage lung squamous cell carcinoma is not only an early diagnostic indicator but also correlates with a good prognosis. Thorac Cancer. 2015;6:288–95. doi: 10.1111/1759-7714.12181. [DOI] [PMC free article] [PubMed] [Google Scholar]
- 16.Senoo M, Pinto F, Crum CP, McKeon F. p63 Is essential for the proliferative potential of stem cells in stratified epithelia. Cell. 2007;129:523–36. doi: 10.1016/j.cell.2007.02.045. [DOI] [PubMed] [Google Scholar]
- 17.Subramanian A, Tamayo P, Mootha VK, Mukherjee S, Ebert BL, Gillette MA, et al. Gene set enrichment analysis: a knowledge-based approach for interpreting genome-wide expression profiles. Proceedings of the National Academy of Sciences of the United States of America. 2005;102:15545–50. doi: 10.1073/pnas.0506580102. [DOI] [PMC free article] [PubMed] [Google Scholar]
- 18.McDade SS, Henry AE, Pivato GP, Kozarewa I, Mitsopoulos C, Fenwick K, et al. Genome-wide analysis of p63 binding sites identifies AP-2 factors as co-regulators of epidermal differentiation. Nucleic Acids Res. 2012;40:7190–206. doi: 10.1093/nar/gks389. [DOI] [PMC free article] [PubMed] [Google Scholar]
- 19.Wozniak MB, Le Calvez-Kelm F, Abedi-Ardekani B, Byrnes G, Durand G, Carreira C, et al. Integrative genome-wide gene expression profiling of clear cell renal cell carcinoma in Czech Republic and in the United States. PloS one. 2013;8:e57886. doi: 10.1371/journal.pone.0057886. [DOI] [PMC free article] [PubMed] [Google Scholar]
- 20.Pena-Llopis S, Vega-Rubin-de-Celis S, Liao A, Leng N, Pavia-Jimenez A, Wang S, et al. BAP1 loss defines a new class of renal cell carcinoma. Nature genetics. 2012;44:751–9. doi: 10.1038/ng.2323. [DOI] [PMC free article] [PubMed] [Google Scholar]
- 21.Yang XJ, Tan MH, Kim HL, Ditlev JA, Betten MW, Png CE, et al. A molecular classification of papillary renal cell carcinoma. Cancer research. 2005;65:5628–37. doi: 10.1158/0008-5472.CAN-05-0533. [DOI] [PubMed] [Google Scholar]
- 22.Gorovets D, Kannan K, Shen R, Kastenhuber ER, Islamdoust N, Campos C, et al. IDH mutation and neuroglial developmental features define clinically distinct subclasses of lower grade diffuse astrocytic glioma. Clinical cancer research : an official journal of the American Association for Cancer Research. 2012;18:2490–501. doi: 10.1158/1078-0432.CCR-11-2977. [DOI] [PubMed] [Google Scholar]
- 23.Kim WJ, Kim EJ, Kim SK, Kim YJ, Ha YS, Jeong P, et al. Predictive value of progression-related gene classifier in primary non-muscle invasive bladder cancer. Molecular cancer. 2010;9:3. doi: 10.1186/1476-4598-9-3. [DOI] [PMC free article] [PubMed] [Google Scholar]
- 24.Wong DJ, Liu H, Ridky TW, Cassarino D, Segal E, Chang HY. Module map of stem cell genes guides creation of epithelial cancer stem cells. Cell stem cell. 2008;2:333–44. doi: 10.1016/j.stem.2008.02.009. [DOI] [PMC free article] [PubMed] [Google Scholar]
- 25.Merlos-Suarez A, Barriga FM, Jung P, Iglesias M, Cespedes MV, Rossell D, et al. The intestinal stem cell signature identifies colorectal cancer stem cells and predicts disease relapse. Cell stem cell. 2011;8:511–24. doi: 10.1016/j.stem.2011.02.020. [DOI] [PubMed] [Google Scholar]
- 26.Liu R, Wang X, Chen GY, Dalerba P, Gurney A, Hoey T, et al. The prognostic role of a gene signature from tumorigenic breast-cancer cells. The New England journal of medicine. 2007;356:217–26. doi: 10.1056/NEJMoa063994. [DOI] [PubMed] [Google Scholar]
- 27.Ben-Porath I, Thomson MW, Carey VJ, Ge R, Bell GW, Regev A, et al. An embryonic stem cell-like gene expression signature in poorly differentiated aggressive human tumors. Nature genetics. 2008;40:499–507. doi: 10.1038/ng.127. [DOI] [PMC free article] [PubMed] [Google Scholar]
- 28.Naba A, Clauser KR, Whittaker CA, Carr SA, Tanabe KK, Hynes RO. Extracellular matrix signatures of human primary metastatic colon cancers and their metastases to liver. BMC cancer. 2014;14:518. doi: 10.1186/1471-2407-14-518. [DOI] [PMC free article] [PubMed] [Google Scholar]
- 29.Chakrabarti R, Wei Y, Hwang J, Hang X, Andres Blanco M, Choudhury A, et al. DeltaNp63 promotes stem cell activity in mammary gland development and basal-like breast cancer by enhancing Fzd7 expression and Wnt signalling. Nature cell biology. 2014;16:1004–15. 1–13. doi: 10.1038/ncb3040. [DOI] [PMC free article] [PubMed] [Google Scholar]
- 30.Hoadley KA, Yau C, Wolf DM, Cherniack AD, Tamborero D, Ng S, et al. Multiplatform analysis of 12 cancer types reveals molecular classification within and across tissues of origin. Cell. 2014;158:929–44. doi: 10.1016/j.cell.2014.06.049. [DOI] [PMC free article] [PubMed] [Google Scholar]
- 31.Cancer Genome Atlas Research N. Comprehensive genomic characterization of squamous cell lung cancers. Nature. 2012;489:519–25. doi: 10.1038/nature11404. [DOI] [PMC free article] [PubMed] [Google Scholar]
- 32.Cancer Genome Atlas N. Comprehensive molecular characterization of human colon and rectal cancer. Nature. 2012;487:330–7. doi: 10.1038/nature11252. [DOI] [PMC free article] [PubMed] [Google Scholar]
- 33.Cancer Genome Atlas N. Comprehensive genomic characterization of head and neck squamous cell carcinomas. Nature. 2015;517:576–82. doi: 10.1038/nature14129. [DOI] [PMC free article] [PubMed] [Google Scholar]
- 34.Orzol P, Holcakova J, Nekulova M, Nenutil R, Vojtesek B, Coates PJ. The diverse oncogenic and tumour suppressor roles of p63 and p73 in cancer: a review by cancer site. Histology and histopathology. 2015;30:503–21. doi: 10.14670/HH-30.503. [DOI] [PubMed] [Google Scholar]
- 35.Sethi I, Romano RA, Gluck C, Smalley K, Vojtesek B, Buck MJ, et al. A global analysis of the complex landscape of isoforms and regulatory networks of p63 in human cells and tissues. BMC Genomics. 2015;16:584. doi: 10.1186/s12864-015-1793-9. [DOI] [PMC free article] [PubMed] [Google Scholar]
- 36.Adorno M, Cordenonsi M, Montagner M, Dupont S, Wong C, Hann B, et al. A Mutant-p53/Smad complex opposes p63 to empower TGFbeta-induced metastasis. Cell. 2009;137:87–98. doi: 10.1016/j.cell.2009.01.039. [DOI] [PubMed] [Google Scholar]
- 37.Barbieri CE, Tang LJ, Brown KA, Pietenpol JA. Loss of p63 leads to increased cell migration and up-regulation of genes involved in invasion and metastasis. Cancer research. 2006;66:7589–97. doi: 10.1158/0008-5472.CAN-06-2020. [DOI] [PubMed] [Google Scholar]
Associated Data
This section collects any data citations, data availability statements, or supplementary materials included in this article.


