

Summary
The white adipose tissue bridges body organs and plays a fundamental role in host metabolism. To what extent the adipose tissue also contributes to immune surveillance and long-term protective defense remains largely unknown. Here, we showed that at steady state, the white adipose tissue contained abundant memory lymphocyte populations. Following infection, the adipose tissue accumulated large numbers of pathogen-specific memory T cells, including tissue-resident cells. Memory T cells in the adipose tissue expressed a distinct metabolic profile and adipose tissue from previously infected mice was sufficient to protect uninfected mice from lethal pathogen challenge. Induction of recall responses within the adipose tissue was associated with the collapse of lipid metabolism in favor of antimicrobial responses. Our results indicate that white adipose tissue may represent a reservoir of memory T cells that provides potent and rapid effector memory responses, positioning this compartment as a potential major contributor of immunological memory.
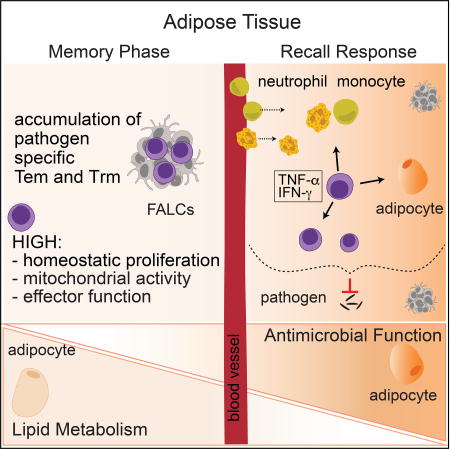
Graphical abstract
Introduction
The white adipose tissue (WAT) physically connects all organs to lymphoid structures and serves as a scaffold for the lymphatic and blood vasculature. This compartment also plays a major role in whole-body energy homeostasis (Rosen and Spiegelman, 2014). Recent lines of investigation revealed that metabolic control is tightly entwined with the immune system (Odegaard and Chawla, 2013, 2015). Within the adipose tissue (AT), a complex cellular network of immune and stromal cells constantly recognizes and responds to environmental signals in order to regulate metabolism (Brestoff and Artis, 2015). Recent work has elaborated on this crosstalk in the context of both chronic inflammation and metabolic disorders (Brestoff and Artis, 2015; DiSpirito and Mathis, 2015). However, the role and properties of the adipose immune network at homeostasis and in orchestrating antimicrobial immune responses remain poorly understood.
In invertebrates, the AT plays a central role in antimicrobial immunity. In insects, the fat body is the largest organ of the hemocoel and is a primary site of the response to microbial infection via production of antimicrobial peptides (Azeez et al., 2014). Emerging lines of observation support the idea that this function may also be relevant to vertebrate organisms. For example, in mice, subcutaneous adipocytes can produce antimicrobial peptides following acute infection, thereby promoting innate immunity to Staphylococcus aureus (Zhang et al., 2015). The AT is also a known source of cytokines and chemokines involved in the induction and/or coordination of host defenses (Ouchi et al., 2011). Previous work revealed that memory T cells are present in the AT (Masopust et al., 2001). Within this compartment, lymphocytes are predominantly localized within organized structures referred to as fat associated lymphoid clusters (FALCs) or milky spots (in the omentum), which can rapidly expand in response to local inflammatory cues (Moro et al., 2010; Rangel-Moreno et al., 2009). Within these structures, B cells can respond to antigenic challenge (Benezech et al., 2015). Notably, the omentum, a specialized visceral AT, is a site of protective IgM and IgA production (Jones et al., 2015; Okabe and Medzhitov, 2014; Rangel-Moreno et al., 2009). Further, inflammation of the pleural or peritoneal cavity rapidly activates FALCs within the adjacent AT, leading to local secretion of IgM (Benezech et al., 2015; Jackson-Jones et al., 2016). The AT also harbors distinct subsets of dendritic cells (Fonseca et al., 2015; Sundara Rajan and Longhi, 2016). However, while observations linking the AT and immune network are emerging, whether the AT can sustain long-term immunity to infections and the potential impact of those responses for AT physiology remains unclear. Based on the strategic positioning of the adipose compartment at the interface between peripheral tissues and immune inductive sites, we postulated that the AT would play an important role as an immunological shield.
Here, we uncover the WAT as a major hub for memory T cells endowed with potent proliferative, effector, and protective potential. Furthermore, this work also demonstrates that the induction of AT memory responses results in the remodeling of AT physiology, including that of the adipocytes themselves, and that a trade-off occurs in favor of the induction of antimicrobial responses at the expense of lipid metabolism. Together, our results propose that the WAT may represent a unique immune compartment that simultaneously allows for long-term maintenance and rapid reactivation of memory T cells.
Results
The adipose tissue is enriched in memory T cells
The extent to which the WAT has a direct role in immune surveillance and long-term protective defenses remains largely unknown. To address this possibility, we first characterized T cells within distinct white adipose depots, namely two visceral adipose tissues (mesenteric adipose tissue (mAT) and gonadal adipose tissue (gAT)), and the subcutaneous adipose tissue (scAT). Intravenous in vivo labeling of circulating cells (Anderson et al., 2014) confirmed that >95% of the hematopoietic compartment recovered following perfusion and tissue dissociation was contained within the AT (Figure S1A). At steady state, T cells comprised a sizeable proportion (~5–10%) of the hematopoietic compartment in all adipose sites tested (Figure S1B). As previously described, the WAT is home to T helper 2 (Th2) cells (expressing transcription factor GATA-3 and cytokines IL-5 and IL-13), as well as Foxp3+ T regulatory (Treg) cells (Figure S1CDE) (Brestoff and Artis, 2015; Feuerer et al., 2009b). A high frequency of CD4+ T cells residing within the WAT expressed a T helper 1 (Th1) (expressing the transcription factor T-bet and cytokines IFN-γ and/or TNF-α) or T helper 17 (Th17) (expressing the cytokine IL-17) effector profile (Figure 1ABC, S1CDE) (Feuerer et al., 2009a; Zuniga et al., 2010). Further, a dominant fraction of the CD8+ T cells in the WATs expressed T-bet and had the potential to produce the cytokines IFN-γ and/or TNF-α (Figure 1ABC, S1D) (Feuerer et al., 2009a; Zuniga et al., 2010).
Figure 1. The white adipose tissue is home to diverse populations of memory T cells.

(A–E) ATs from naïve C57BL/6 mice were analyzed by flow cytometry. (A) Representative plots of transcription factor expression or cytokine production by CD8+ or CD4+ T cells from the mAT after PMA/ionomycin restimulation with BFA. (B) Numbers of CD8+ T cells and non-Treg CD4+ T cells from the mAT producing the indicated cytokine. (C) Frequencies of IFN-γ- and TNF-α-producing CD8+ and CD4+ T cells after PMA/ionomycin restimulation with BFA isolated from gAT, scAT, and mAT. (D) CD8+ (top) and CD4+ (bottom) T cells isolated from the mAT. Left: representative plots of CD44 and CD62L expression, Right: representative histograms of CD69 expression on CD44+CD62L− (red) or CD44−CD62L+ (blue) T cells. (E) Numbers of central memory (Tcm: CD44+CD62L+), effector memory (Tem: CD44+CD62L−CD69−) and resident memory (Trm: CD44+CD62L−CD69+) CD8+ and CD4+ T cells per gram of gAT, scAT, and mAT. (F) Conjoined pairs of naïve CD45.1 and CD45.2 congenic C57BL/6 mice were analyzed 6 weeks after parabiosis surgery to quantify the origin of CD8+ (left) and CD4+ (right) memory T cell subsets (described in (E)) in the spleen (Spl), mLN, siLP, and mAT. The percentage of cells originating from host (black bars) or donor (white bars) animals is shown. nd not detected. (G–K) mAT isolated from healthy rhesus macaques was analyzed by flow cytometry. (G) Representative plot (gated on CD3+CD8+ T cells) indicating the gating strategy for naïve (CD95−CD28lo), central memory or stem cell memory (Tcm/scm) (CD95+CD28+), and Tem/rm (CD95+CD28−) T cells. (H) Representative plots showing CD8+ (left) and CD4+ (right) naïve, Tcm/scm, and Tem/rm T cells. (I) Representative histograms of CD69 expression on CD8+ (left) and CD4+ (right) naïve (shaded) and Tem/rm T cells (blue). (J) Frequencies of CD8+ (left) and CD4+ (right) memory T cell subsets from (HI). (K) Representative plots (gated on CD3+ T cells) from concatenation of all samples, showing cytokine production by T cell subsets. Numbers in representative plots indicate mean±SD. In all bar graphs, error bars represent standard deviation. Data are representative of at least 2 experiments with at least 4 mice, 3 pairs of parabiotic animals, or a total of 3 rhesus macaques. See Figure S1.
Consistent with the high effector potential of AT-associated lymphocytes, >60% of mAT T cells expressed the marker of antigen-experience, CD44, and the majority of those were negative for CD62L, a phenotype characteristic of effector memory (Tem) and resident memory (Trm) T cell populations (Figure 1D, S1F). Approximately half of CD44+CD62L− CD8+ and CD4+ T cells expressed CD69, supporting the idea that a large fraction of T cells found within the mAT may be tissue-resident memory T cells, with the remaining cells expressing a Tem phenotype (Figure 1DE). The AT also contained a population of CD8+ T cells with a phenotype compatible with central memory (Tcm) cells (Figure 1DE, S1F), a population found predominantly in secondary lymphoid organs. The 3 memory subsets were also found in other WATs analyzed, supporting the idea of a preferential tropism for memory T cells across the white adipose compartment (Figure 1E).
Trm cells occupy numerous tissue sites without recirculating and are endowed with local protective function (Mueller and Mackay, 2016; Schenkel and Masopust, 2014). We next assessed whether the CD44+CD62L−CD69+ T cell population in the mAT were bona fide Trm cells. To this end, we performed parabiosis experiments, which distinguish between resident and recirculating cell populations (Klonowski et al., 2004). Congenically distinct naïve mice were conjoined for 6 weeks and the origin of T cell populations was assessed based on differential congenic marker expression. As previously demonstrated (Klonowski et al., 2004; Schenkel et al., 2014; Schenkel et al., 2013), all detectable T cell subsets reached equilibrium in secondary lymphoid organs (mLN, spleen), with the exception of CD4+ T cells with a Trm phenotype and Foxp3+ Treg cells, which exhibited a slight bias towards host origin (Figure 1F, Figure S1G). As previously described within the small intestine lamina propria (siLP) (Skon et al., 2013), CD8+ T cells with a Trm phenotype (CD44+, CD62L− and CD69+) were non-recirculating, though the CD4+ T cells with a Trm phenotype reached an equilibrium comparable to the spleen and mesenteric lymph nodes (mLN), suggesting that (as in the skin) these cells were not resident in the siLP at homeostasis (Figure 1F) (Collins et al., 2016). Similarly, within the mAT, T cells expressing a Trm phenotype were predominantly (~80–90%) host-derived and, as such, bona fide Trm cells (Figure 1F). Within the mAT, the majority of Trm cells expressed integrin CD11a, lymphocyte antigen 6 complex (Ly-6C), CD122 (IL-2/IL15Rβ), chemokine receptor CCR9, CD127 (IL-7Rα) and CD4+ Trm cells also expressed integrin α4β7 (Figure S1H). Both CD4+ and CD8+ Trm cells were coinhibitory receptor KLRG1− (Mackay et al., 2013), chemokine receptor CCR7lo, and, in agreement with previous observations showing variable levels of the integrin αE (CD103) across tissues (Steinert et al., 2015), mAT Trm cells did not express CD103 (Figure S1HI). Thus, the AT contained all three major subsets of memory T cells, including a population of Trm cells.
We next assessed the extent to which constitutive accumulation of memory T cells could be a general feature of AT across species. In non-human primates (Macaca mulatta), CD28 and CD95 can distinguish between naïve and antigen-experienced T cell populations (Figure 1G) (Lugli et al., 2013; Pitcher et al., 2002). Within antigen-experienced populations (CD95+), CD28 expression can be used to discriminate the fraction containing central memory and/or stem cell memory (Tcm/scm) T cells from effector memory and/or tissue-resident memory (Tem/rm) T cells (Figure 1G) (Lugli et al., 2013; Pitcher et al., 2002). According to this strategy, the mAT was enriched in both Tcm/scm and Tem/rm CD8+ T cells compared to naïve T cells, with the CD4+ T cell compartment mostly comprised of Tcm/scm (Figure 1H). CD69 expression has also been associated with Trm cells in primates (Pichyangkul et al., 2015). Within the CD8+ Tem/rm populations, the vast majority of cells expressed CD69, suggesting that these were Trm cells (Figure 1IJ). Further, most T cells within all memory subsets isolated from the AT had the potential to produce type 1 cytokines, with >50% of memory CD8+ T cells and >20% of memory CD4+ T cells expressing both IFN-γ and TNF-α (Figure 1K, S1J). These observations supported the idea that the accumulation of memory T cell populations with type 1 effector potential was also characteristic of primate AT. Thus, in both rodents and primates, the WAT represents a constitutive niche for memory T cells.
Memory T cells accumulate in the mAT following mucosal infections
We next assessed whether the AT can be a site for the accumulation of pathogen-specific T cells. Oral infection with the protozoan parasite, Toxoplasma gondii, leads to a transient acute infection, followed by parasite persistence at defined sites (not the WAT) (Figure S2A) (Cohen and Denkers, 2015). During the chronic phase of infection, the frequency and number of IFN-γ-producing CD8+ and CD4+ T cells were increased within the mAT compared to naïve mice (Figure 2A). T. gondii-specific memory T cells were detected within the mAT at a higher frequency than in the siLP (Figure 2B) and a higher proportion had the potential to produce IFN-γ within the mAT (as assessed by both percentage and MFI) compared to cells from the siLP (Figure 2CD, S2BC).
Figure 2. Pathogen-specific immune responses occur in the mAT.

(A–D) C57BL/6 mice were orally infected with T. gondii. 6 weeks post-infection, T cell populations were evaluated by flow cytometry. (A) Number of IFN-γ+ CD8+ (left) and IFN-γ+ CD4+ (right) T cells from the mAT post PMA/ionomycin activation with BFA. (Student’s t test) (B) Representative plots show T. gondii-specific CD8+ (left) and CD4+ (right) T cells. (C) Representative plots of IFN-γ production by CD44+tgd057:Kb+ CD8+ T cells (left) and TGME49:I-Ab+ CD4+ T cells (right) after PMA/ionomycin stimulation with BFA in the indicated organ. (D) The mean fluorescence intensity (MFI) of IFN-γ+ tgd057:Kb+ CD8+ T cells (left) and IFN-γ+ TGME49:I-Ab+ CD4+ T cells (right) from (C). (E–G) C57Bl/6 mice were orally infected with Yptb WT. At the indicated time points post-infection, T cells were analyzed by flow cytometry. (E) Representative plots of YopE:Kb+ CD8+ T cells in the indicated organs at 15 days post-infection. (F) Time course of the numbers of CD44+YopE:Kb+CD8+ T cells in the mLN, siLP, and mAT. (G) Frequencies of Tcm, Tem, and Trm cells within YopE:Kb+CD8+ T cells in the mAT 31 days post-infection. (H–J) C57BL/6 mice were orally infected with Yptb WT or Yptb ΔyopM. At the indicated time points post-infection, T cell populations were analyzed by flow cytometry. (H) Representative plots of YopE:Kb+CD8+ T cells from the mLN or mAT 31 days post-infection. (I) Numbers of CD44+YopE:Kb+CD8+ T cells from the mAT 31 days post-infection. (J) Representative plots of YopE:Kb+ CD8+ T cells from the mAT and gAT >4 weeks post-infection with Yptb ΔyopM. (K) Representative plots of tgd057:Kb+ CD8+ T cells (left) and TGME49:I-Ab+ CD4+ T cells (right) from the gAT and mAT of mice >6 weeks post oral T. gondii infection. (L) Pairs consisting of one naïve and one previously infected (>4 weeks post Yptb ΔyopM infection) congenic C57BL/6 mouse were conjoined and analyzed 6 weeks after parabiosis surgery. The number of YopE:Kb+ CD8+ T cells isolated from the indicated organs of the naive (white bars) or previously infected (black bars) mouse in the pair was calculated. (One way Anova adjusted for multiple comparisons). Numbers in representative plots indicate mean±SD. Error bars in all bar graphs represent standard deviation. Data are representative of at least 2 experiments with at least 3 mice per group or 3 pairs of parabiotic animals. ns not significant, *p<0.05, ****p<0.0001. See Figure S2.
We next employed a model of acute infection that is not associated with microbial persistence. In mice, oral infection with the gram-negative bacterial pathogen Yersinia pseudotuberculosis (32777) produces a transient systemic infection, and bacteria are cleared by 21 days post-infection (Fonseca et al., 2015). The T cell response can be monitored using a tetramer reagent (YopE:Kb+) against an epitope from the secreted effector protein YopE, YopE69–77 (Zhang et al., 2014). YopE69–77-specific responses were first observed within the mLN and the siLP and were only detectable within the mAT 6 days post-infection (Figure S2D), supporting the idea that the mAT is unlikely to be a major site of T cell priming. By 15 days post-infection, YopE69–77-specific T cells represented nearly half of mAT CD8+ T cells and following contraction, these cells were maintained at a stable level for at least 4 months in all sites analyzed (Figure 2EF). After bacterial clearance, all 3 memory T cell subsets (Tcm, Tem, Trm) were found within the YopE69–77-specific CD8+ T cell population, with ~40% of these cells within the mAT expressing a Trm phenotype (Figure 2G).
To assess the functional relevance of memory T cells within the mAT in a manner uncoupled from long-term immunological defects (Fonseca et al., 2015), we utilized a mutant strain of Y. pseudotuberculosis that does not cause mesenteric lymphadenopathy (Figure S2E) (Viboud and Bliska, 2005). YopM-deficient Y. pseudotuberculosis (Yptb ΔyopM) elicited a robust YopE69–77-specific CD8+ T cell response, with a phenotype comparable to that observed with the WT strain, including the CD8+ Trm cell population, and maintenance of antigen-specific CD8+ T cells was not associated with bacterial persistence (Figure 2HI, S2FGHI). Yersinia and Toxoplasma-specific CD8+ T cells were also found within other WATs at a number comparable to the number found in the entire siLP (Figure 2JK, Figure S2HI).
We next performed parabiosis between naïve mice and mice that were previously infected with Yptb ΔyopM bacteria >4 weeks prior to joining. This revealed that AT YopE69–77-specific T cells were predominantly tissue resident and thus were Trm cells (Figure 2L). Therefore, the WAT represents an important reservoir of pathogen-specific memory T cells, including Trm cells.
Adipose tissue memory T cells have distinct attributes compared to memory T cells at other tissue sites
We next explored the possibility that the AT could imprint distinct properties on memory T cells. Gene expression in memory T cells from the siLP, mAT, and spleen was assessed in mice previously infected with Yptb ΔyopM. Only 44 genes with a ≥2 fold difference between CD8+ Trm and Tem cells within the mAT were identified, supporting the idea that both subsetsare strongly imprinted by the WAT (Figure 3A). On the other hand, >500 genes were expressed at ≥2 fold higher levels in mAT memory cells than their counterparts at other sites (Figure 3A). Pathway analysis revealed enhanced metabolic and effector functionalities in memory T cells from the AT compared to the siLP or spleen (Figure 3B and Figure S3ABC). When compared with memory T cells at other sites, mAT Trm and Tem cells had differences in their expression of genes from pathways related to T cell activation and differentiation, cytokine secretion, lipid biosynthesis/efflux, and cell cycle (Figure 3B and Figure S3ABC).
Figure 3. Adipose tissue memory T cells have distinct tissue-specific functional attributes.

(A–B) Mice were orally infected with Yptb ΔyopM. >4 weeks post-infection, Tem and Trm memory CD8+ T cells were sorted for gene expression analysis by RNA-Seq. (A) Numbers of genes with a ≥2 fold increase (red) or decrease (blue) in expression levels between the indicated populations. (B) Pathway analysis was performed and gene pathways were organized into clusters, represented here as clustergrams showing gene pathways differentially regulated between Trm cells in the siLP and mAT. (C–G) Mice infected with Yptb ΔyopM were analyzed at >4 weeks post-infection. (C) Ki67 expression by Tem and Trm YopE:Kb+CD8+ T cells was determined by flow cytometric analysis. Left hand plots show YopE:Kb+ expression on CD8+ T cells. Center plots show CD69 expression on YopE:Kb+CD8+ cells. Right hand plots show Ki67 expression on Tem and Trm cells. Bar graphs show frequencies of Ki67+YopE:Kb+CD8+ Tem (left) and Trm (right) cells. (D) Representative Vybrant DyeCycle Violet staining of YopE:Kb+CD44+CD8+ T cells from the siLP (blue), spleen (green), and mAT (red). Bar graphs show the percentage of YopE:Kb+CD44+CD8+ Tem and Trm cells in the indicated cell cycle stages in the siLP (left), spleen (center), and mAT (right). (E) >4 weeks post-infection with the Yptb ΔyopM, mice received BrdU for 12 days. The percentage of BrdU+YopE:Kb+CD44+ CD8+ T cells found in the intraepithelial lymphocytes (IEL), lungs, salivary gland (SG), siLP, liver, mAT, and gAT is quantified in the bar graph. (F) >4 weeks post-infection, cells from the siLP, spleen, and mAT were incubated with Bodipy FL C16. Representative histogram indicates Bodipy uptake in YopE:Kb+CD8+ Trm cells (red) or YopE:Kb+CD8+ Tem cells (blue) from the siLP (open) and mAT (shaded). Bar graphs show the quantification of the bodipy MFI. (Student’s t test). (G) >4 weeks post-infection, cells from the siLP, spleen, and mAT were incubated with Mitotracker Deep Red. Representative histograms indicate Mitotracker Deep Red staining in YopE:Kb+CD8+ Trm cells (red) or YopE:Kb+CD8+ Tem cells (blue) from the siLP (open histogram) and mAT (shaded histograms). Bar graphs show the quantification of the Mitotracker Deep Red MFI. Numbers in representative plots indicate mean±SD. Error bars in all graphs represent mean±SD. Data are representative of at least 2 experiments with ≥3 mice per group. One way Anova adjusted for multiple comparisons. **p<0.01, ****p<0.0001 See Figure S3.
YopE69–77-specific Tem and Trm cells in the mAT expressed higher levels of Ki67 than in the siLP or mLN and cell cycle analysis revealed that the majority of YopE69–77-specific Tem and Trm cells in the mAT of previously infected mice were in the S, G2, or M stages of the cell cycle, indicating that they have entered the replicative phase (Figure 3CD). In contrast, spleen and siLP YopE69–77-specific Tem and Trm were primarily in G0/G1 phases (Figure 3D). BrdU incorporation at the memory stage indicated that YopE69–77-specific memory T cells in the mAT were indeed more proliferative than in other tissues (Figure 3E and Figure S3D). Thus, memory cells found in the WAT displayed enhanced levels of homeostatic proliferation.
Lipid uptake and mitochondrial staining assays were performed to assess whether AT Tem and Trm cells were metabolically distinct from those in other organs. When incubated directly ex vivo with the fluorescently-labeled long-chain fatty acid palmitate (Bodipy FL C16), YopE69–77-specific Tem and Trm cells from the AT had higher rates of lipid uptake than those from the spleen or siLP (Figure 3F). Further, active mitochondrial respiration (Zhou et al., 2011) was significantly elevated in AT YopE69–77-specific Tem and Trm cells (Figure 3G). In these assays, Tem and Trm cells had comparable proliferative potential, rates of lipid uptake and mitochondrial respiration (Figure 3CDEFG, S3D).
Thus, the dominant accumulation of memory T cell populations within the AT, coupled with their high proliferative and metabolic activity, supported the idea that the AT may represent an optimal environment to support memory T cell longevity and function.
Adipose tissue T cells can protect against secondary infection
We next tested whether pathogen-specific T cells within the mAT can efficiently respond to secondary challenge and the impact of this response on WAT physiology. In the context of secondary exposure to Y. pseudotuberculosis, CD8+ T cells play an important protective role (Bergman et al., 2009). At day 6 post-primary or secondary challenge infection, FALC numbers were significantly increased in the mAT compared to primary infection with CD8+ T cells increased within the FALCS and throughout the whole tissue (Figure 4ABC). YopE69–77-specific T cells were also significantly increased within the AT post-reinfection, compared to primary infection (Figure 4D).
Figure 4. Recall responses occur within the adipose tissue and adipose memory T cells can protect against infection.

(A–D) Mice were either naïve, 6 days post-infection with Yptb (Yptb WT 6 days), >4 weeks post-infection with Yptb ΔyopM (Yptb ΔyopM), or >4 weeks post-infection with Yptb ΔyopM followed by challenge with Yptb for 6 days (Yptb ΔyopM + Yptb WT) before imaging or isolation of cells for flow cytometry. (A) Representative images of the entire mAT from actin-DsRed reporter mice are shown. White arrows indicate FALCs. (B) Number of FALCs per mAT represented as fold change over the number of FALCs per naïve mAT. (C) mATs from CD11c–YFP reporter mice were stained for CD8 and LYVE-1 and imaged by confocal microscopy. CD8, CD11c, and LYVE-1 staining (top) or CD8+ T cells alone (bottom) in areas of the mAT with (left) or without (right) FALCs are shown. (D) Numbers of CD44+YopE:Kb+CD8+ T cells from mAT. (E) Pooled mAT, scAT and gAT isolated from either naïve donors or donors >4 weeks post-infection with Yptb ΔyopM were subcutaneously transplanted into Rag1−/− mice. Rag1−/− mice receiving ATs from previously infected mice were either left untreated or injected with anti-CD4 and anti-CD8 depleting antibodies. 2 weeks post surgery, animals were challenged i.v. with 200 CFU of Yptb WT. Data are representative of at least 2 experiments with ≥5 mice per group. Error bars in all bar graphs represent standard deviation. Statistical comparisons in (B) and (D) were performed using one way Anova adjusted for multiple comparisons. Statistical comparisons in (E) were performed using Log-rank (Mantel Cox) test. ns not significant, *p<0.05, **p<0.01, ****p<0.0001. See Figure S4.
As ATs interface with all organs, assessing the role of this compartment independently of adjacent tissues or lymphoid structures remains technically challenging. Thus, we employed an AT transplant approach, in which WATs from naïve or previously Yptb ΔyopM-infected mice were transferred into naïve Rag1−/− recipients (Figure S4A). Mice were then challenged i.v. with a lethal dose of Y. pseudotuberculosis. Following challenge, T cells were redeployed from the transplanted tissue and observed at other tissue sites (data not shown). Mice transplanted with AT from previously infected mice were significantly protected from mortality compared to mice transplanted with AT from naïve donors and protection was lost following T cell depletion (Figure 4E). Together, these results supported the idea that the AT containing memory T cells was sufficient to confer protection against a lethal challenge.
Memory T cells from the adipose tissue have enhanced effector potential
We next assessed the quality and kinetics of recall responses within the AT. Mice that had previously cleared the infection were subsequently challenged i.v. with YopE69–77 peptide. This approach enabled a controlled in vivo comparison of the impact of memory CD8+ T cell recall between compartments. As early as one hour post peptide injection, a response from YopE69–77-specific CD8+ T cells was detectable within the mAT and siLP, as assessed by a significant increase in CD69 MFI (Figure 5A). However, Ki67 expression by YopE69–77-specific CD8+ T cells remained significantly higher in the mAT than in the siLP (Figure S5A). Furthermore, as assessed by direct ex vivo staining, the majority of YopE69–77-specific CD8+ T cells from the mAT co-expressed IFN-γ and TNF-α by one hour post peptide injection in contrast to YopE69–77-specific CD8+ T cells from the siLP, which produced only IFN-γ (Figure 5B). Similarly, within 1 hour post injection of T. gondii-derived peptide, T cells from the AT of previously infected mice also co-expressed IFN-γ and TNF-α, while siLP T cells did not, indicating that the enhanced response to secondary challenge within the AT was conserved across infectious models (Figure 5C and Figure S5BC). Due to TCR downregulation following peptide encounter (Valitutti et al., 1995), tracking tetramer+ cells was no longer possible at 4 hours post-challenge (Figure S5DE). Thus, the AT contained a highly reactive population of memory T cells, endowed with rapid and enhanced effector potential.
Figure 5. Recall responses in the adipose tissue are enhanced.

(A–B) >4 weeks post-infection with Yptb ΔyopM, mice were injected i.v. with YopE69–77 peptide or vehicle control (ctrl.) and evaluated by flow cytometry 1 hour post-injection. (A) Representative histogram shows expression of CD69 on YopE:Kb+CD8+ T cells after vehicle control (dotted line) or peptide (gray shading) injection (left) and MFI of CD69 in the indicated organs after the indicated treatment is quantified (right). (B) Representative plots show IFN-γ and TNF-α production by YopE:Kb+CD8+ T cells 1 hour after vehicle control (left) or peptide (right) injection in the indicated organs. Frequencies of IFN-γ+ TNF-α+ YopE:Kb+ CD8+ T cells in the indicated organs are shown in the bar graph. (C) Mice were infected orally with a fluorescent reporter strain of T. gondii. 6 weeks post-infection, mice were injected i.v. with MHC-I and MHC-II peptides or vehicle control and analyzed by flow cytometry 1 hour post injection. Representative plots show IFN-γ and TNF-α in CD44+CD8+ T cells in the indicated organ. Bar graphs show the frequencies of IFN-γ+TNF-α+ cells within the CD44+ CD8+ T cells. (D–E) >4 weeks post-infection with Yptb ΔyopM, mice were injected i.v. with YopE69-77 peptide or an equal volume of vehicle control and evaluated by flow cytometry at 1 and 4 hours post-injection. (D) Representative plots show neutrophils in the indicated organs (gated on live CD45+TCRβ−Siglec F−NK1.1−B220− cells) 4 hours after injection. Bar graph shows frequency of neutrophils at 1 and 4 hours post-injection in the siLP and mAT. (E) Representative plots show monocytes (gated on live CD45+TCR-β−Siglec F−NK1.1−B220−CD11b+Ly-6G−CD64+CCR2+ cells) 4 hours after injection in the indicated organs. Bar graph shows the frequency of monocytes at 1 and 4 hours post-injection in the siLP and mAT. Numbers in representative plots indicate mean±SD. Error bars in all bar graphs represent standard deviation and statistics are calculated using one way Anova adjusted for multiple comparisons. Data are representative of at least 2 experiments with 2–6 mice per group. ns not significant, *p<0.05, **p<0.01, ***p<0.001, ****p<0.0001. See Figure S5.
Consistent with previous reports on Trm cell reactivation within tissues (Schenkel et al., 2013), recall of YopE69–77-specific CD8+ T cells had a potent effect on chemokine gene expression by the WAT 4 hours post peptide challenge (Figure S5F). As early as 4 hours post-secondary challenge, the AT exhibited a broad response to antigen challenge, upregulating numerous genes involved in antimicrobial defenses, including type I and II interferon-induced gene signatures (Figure S5G). Innate cell assessment revealed a strong influx of monocytes and neutrophils by 4 hours, which remained elevated up to 24 hours post-challenge (Figure 5DE, Figure S5H). Thus, as previously shown for Trm cells at other sites (Ariotti et al., 2014; Schenkel et al., 2014; Schenkel et al., 2013), antigen-specific recall responses within the AT were associated with tissue-wide effector responses.
Adipose tissue response to T cell recall
The homeostatic function of the AT is to regulate lipid homeostasis by storing and releasing free fatty acids and modulating energy balance. Recall of memory T cells led to distinct changes in gene expression at 4 and 18 hours post peptide injection (Figure S6A). Pathway analysis on genes downregulated 18 hours post peptide injection revealed that the majority of highly downregulated Gene Ontology (GO) pathways were metabolic pathways, with a profound reduction in gene expression of lipid metabolic pathways, including lipid biosynthetic processes, thioester, triglyceride, and neutral lipid metabolic processes, and cholesterol and long-chain fatty-acyl-CoA metabolic processes (Figure 6AB). Indeed, compared to vehicle control, peptide re-challenge resulted in a modest but significant reduction in serum levels of adiponectin and cholesterol within 4 hours (Figure 6CD). Thus, a recall response against a single antigen was sufficient to alter levels of defined circulating lipids. We also found a significant downregulation of genes involved in lipid synthesis by the adipocytes themselves, including Fasn, Acaca, and Dgat2 (Figure 6E). Adipocytes also upregulated interferon-inducible antimicrobial genes, including Gbp4, Gbp11, and Ifi47, but no changes were observed in Pparg expression, supporting the idea that adipocyte cell identity was maintained (Figure 6F and S6B). To assess the intrinsic ability of the AT to respond to local T cell recall independently of potential systemic effects of T cells at other sites, we used an ex vivo explant system. mAT from mice that had been infected >4 weeks prior with Yptb ΔyopM (and therefore had cleared the infection) was co-cultured with peptide or vehicle control for 48 hours. Peptide stimulation of memory T cells within the mAT explant led to the upregulation of antimicrobial genes, as well as downregulation of genes involved in lipid synthesis in the AT, including Dgat2, Fasn, and Acaca (Figure 6G). These changes in gene expression were also linked to alterations in the functionality of the mAT, with a significant downregulation in the ability of the mAT to release glycerol (Figure 6H). Thus, in the context of memory responses, the physiology of the AT (and of the adipocytes themselves) was profoundly remodeled and our results suggest that a trade-off occured in which antimicrobial responses were elevated at the expense of lipid metabolism. Together, our results demonstrate that the AT is a dominant reservoir of memory T cells with high homeostatic proliferation and effector potential and that recall of T cells within the AT had tissue intrinsic consequences for both antimicrobial defense and tissue metabolism.
Figure 6. Recall response in the adipose tissue is associated with a reduction in lipid metabolism.

(A–B) >4 weeks post-infection with Yptb ΔyopM, mice were injected i.v. with YopE69–77 peptide or control vehicle. At 18 hours post-injection, the total mAT was isolated for microarray analysis. (A) Pathway analysis was performed using Enrichr and graphed based on enrichment score (Log10 (adjusted p value)). (B) Diagonal plot with red dots representing genes from the 2 most significantly enriched lipid metabolic pathways (GO: 0046460 and GO: 0006368) from (A) that were downregulated ≥2 fold (with an adjusted p value <0.05) after peptide injection compared to control. (C–D) >4 weeks post-infection with the Yptb ΔyopM, mice were injected i.v. with YopE69–77 peptide or control vehicle and analyzed 4 hours post-injection. (C) Relative concentration of adiponectin in serum. (D) Relative concentration of cholesterol in serum. (E–F) Relative gene expression determined by RT-qPCR on adipocytes isolated from mAT of mice >4 weeks post infection with Yptb ΔyopM at 18 hours post-injection. (G–H) >4 weeks post-infection with Yptb ΔyopM, the mAT was cultured with YopE69–77 peptide or control vehicle and AT and culture supernatants were analyzed after 48 hours. (G) Relative gene expression was evaluated from the indicated genes. (H) Levels of free glycerol were measured in culture supernatants. Error bars in all graphs represent standard deviation. Data are representative of at least 5 experiments with 2–7 mice per group. ns not significant *p<0.05, **p<0.01, ***p<0.001, ****p<0.0001. See Figure S6.
Discussion
In recent years, previous work has uncovered the cross talk between the adipose compartment and the immune system in the context of both chronic inflammation and metabolic disorders (DiSpirito and Mathis, 2015). However, the physiological function of the AT immune system, independent of metabolic control and syndromes, remains virtually unknown. Here, we uncovered a role for the AT as both a constitutive hub for memory T cells and a direct site of potent memory responses. Our work also demonstrated that the activation of immune recall responses specifically within the AT could result in a dramatic switch from homeostatic AT metabolic functions in favor of antimicrobial defense.
A growing body of literature reveals that the AT represents a potential reservoir for numerous pathogens, including HIV, Trypanosoma sp., Mycobacterium tuberculosis or Plasmodium sp. (Chun et al., 2015; Couturier et al., 2015; Damouche et al., 2015; Ferreira et al., 2011; Franke-Fayard et al., 2005; Neyrolles et al., 2006; Teixeira et al., 2015; Trindade et al., 2016). Even when pathogens do not directly target the AT, presumably nearly all microbes or microbial-derived antigens can, at least transiently, access this compartment. Indeed, previous studies show that larger, contractile lymphatics, like those in the mAT, are permeable to soluble antigens and inflammation leads to leakage from the lymphatic vessels (Aldrich and Sevick-Muraca, 2013; Cromer et al., 2014; Fonseca et al., 2015; Scallan et al., 2013; Scallan and Huxley, 2010; Sundara Rajan and Longhi, 2016). Thus, lymphatic drainage from infected tissues may be coupled with antigen or microbial entrapment within the surrounding AT. The WAT also provides a physical connection between all organs and their associated lymphoid structures, a property that may reinforce its function as a dominant immune shield.
Immunological memory is one of the cardinal features of the adaptive immune system and is required for host fitness and survival in the face of pathogen re-encounter. Here, we revealed the AT as a reservoir of memory T cells. While immunity, particularly type 2 immunity, has been extensively explored in this compartment (Odegaard and Chawla, 2015), we found that the WAT was home to memory T cell populations in both mice and non-human primates, many of which were endowed with a type 1 effector potential. We found that this tissue contained all major subsets of memory T cells including Tcm, Tem, and Trm cells at steady state and following infection, with a dominant accumulation of Trm cells. Trm cells, a recently described lymphocyte population that occupies tissues without recirculating, have been particularly well characterized at barrier sites, such as the skin and gut (Mueller and Mackay, 2016). Because Trm cells occupy frontline sites of infection, these cells have been shown to provide a first line of defense against microbes re-encountered at body surfaces (Jiang et al., 2012). This property is highly relevant to the adipose compartment that bridges infected tissue and lymphoid structures. We also observed the systemic distribution of Tcm, Tem, and Trm subsets of memory T cells in all WATs examined, a tissue that cumulatively represents 15% of healthy mammals. Thus, our present work uncovered a potential dominant reservoir of memory cells.
Evidence supporting a developmental link between metabolism and immunity can be found in lower organisms, in which immune and metabolic responses are controlled by the same organ, the fat body. Our present work supports the idea that in higher organisms, the AT remains tightly entwined with protective immunity. Our present observation also provides a rationale for some recent findings about the metabolic requirements for memory T cell survival. Long-lived memory T cells have more mitochondrial reserve (spare respiratory capacity) and predominately utilize mitochondrial fatty acid oxidation (FAO) for persistence and their ability to robustly respond to antigen stimulation (Buck et al., 2015; O’Sullivan et al., 2014; van der Windt et al., 2012; van der Windt et al., 2013). Circulating memory T cells preferentially use de novo fatty acid synthesis to fuel FAO and glycerol import by memory T cells is required for T cell longevity (Cui et al., 2015; O’Sullivan et al., 2014). A recent report also showed that skin Trm survival required exogenous lipid uptake and metabolism (Pan et al., 2017). We also found that memory T cells within the WAT had increased fatty acid uptake and elevated mitochondrial function, supporting the idea that memory T cells within the AT are likely undergoing more FAO than memory T cells at other sites. Both fatty acids and glycerol represent major products of adipose cell metabolism, thus we could speculate that the AT may offer the ideal metabolic milieu for immunological memory maintenance.
In addition to their numeric advantage, pathogen-specific CD8+ Trm and Tem cells within the AT were characterized by a high proliferative capacity at steady state compared to antigen-specific Trm cells found at other sites. Further, these cells had a broad and rapid response to antigen re-encounter. The extent to which the unique metabolic environment of the AT contributes to enhanced homeostatic proliferation and rapid effector responses remains to be addressed. A target of these responses was the adipocytes themselves, which upregulated genes linked to antimicrobial defense, in line with a report showing that subcutaneous adipocytes can produce antimicrobial peptides in response to infectious challenge (Zhang et al., 2015). Thus, the AT and the adipocytes are direct targets of immune memory responses and may contribute to the chain reaction of innate responses triggered by memory responses.
Immune defense is subject to trade-off with other energy demanding processes. The AT constitutively regulates glucose and lipid homeostasis by storing and releasing free fatty acids and modulating energy balance via the secretion of adipokines (Stern et al., 2016). We found that the abrupt shift toward antimicrobial defenses came at the cost of the physiological metabolic function of this tissue, including within the adipocytes themselves. At the tissue level, all pathways linked to lipid metabolism, including biosynthetic and metabolic lipid processes, were profoundly suppressed post-recall. This contrasts with what is currently understood in the context of inflammation, a setting associated with enhanced lipolysis of adipocytes (DiSpirito and Mathis, 2015; O’Neill et al., 2016). However, in the context of memory responses, a transient shut down of lipid metabolism in favor of antimicrobial function may be a strategy to rapidly control invasive microbes. Understanding the physiological consequences of cyclic alteration of AT metabolism remains to be addressed.
Together, our results propose that the WAT may represent an early warning system that allows for long-term maintenance and rapid reactivation of memory T cells. Physical coupling of energy storage with the preservation of immunological memory may represent an important host survival strategy for optimal maintenance of the memory pool and host defense during periods of food deprivation. A better understanding of the partnership between the AT and immunological memory may help us to design optimal strategies to induce and maintain protective responses.
Experimental Procedures
CONTACT FOR REAGENT AND RESOURCE SHARING
Further information and requests for resources and reagents should be directed to the Lead Contact, Dr. Yasmine Belkaid (YBelkaid@niaid.nih.gov).
EXPERIMENTAL MODEL AND SUBJECT DETAILS
Animals
C57BL/6NTac mice were purchased from Taconic Farms. Tg(CAG-DsRed*MST)1Nagy/J (DsRed reporter) mice were purchased from the Jackson Laboratory. B6.SJL-Ptprca/BoyAiTac (CD45.1), B6.SJL-Cd45a(Ly5a)Nai-[KO]RAG1 (Rag KO) and C57BL/6-[Tg]CD11c(Itgax):EYFP (CD11c–eYFP reporter) mice were obtained through the NIAID-Taconic exchange program. Age-matched mice between 6– 24 weeks old were used. Non-human primates were housed at the NIH animal center. All procedures were carried out under Ketamine anesthesia by trained personnel under the supervision of veterinary staff and all efforts were made to ameliorate the welfare and to minimize animal suffering in accordance with the “Weatherall report for the use of non-human primates” recommendations under animal protocol LPD26. Animals were housed in adjoining individual primate cages allowing social interactions, under controlled conditions of humidity, temperature and light (12-hour light/12-hour dark cycles). Food and water were available ad libitum. Animals were monitored twice daily and fed commercial monkey chow, treats and fruit twice daily by trained personnel. All animals were bred and maintained under specific pathogen-free conditions at an American Association for the Accreditation of Laboratory Animal Care accredited animal facility at the NIAID and housed in accordance with the procedures outlined in the Guide for the Care and Use of Laboratory Animals under an animal study protocol approved by the NIAID Animal Care and Use Committee.
Infection and injection
Infection with WT or mutant Y. pseudotuberculosis (32777) strains was performed on mice fasted for 12 hours by oral gavage with 1 × 10⁷ CFU from overnight bacterial culture grown shaking in 2XYT media at 25°C overnight as previously described (Fonseca et al., 2015). Bacterial burden (CFU) in the spleen, mAT or gAT after infection with Yptb ΔyopM was determined by serial plating of the indicated organ on tryptic soy agar plates after extraction, mincing, and grinding of the indicated organ under sterile conditions. Colonies were counted after 48 hours at room temperature and CFU/organ was calculated. Bacterial burden from feces was measured by qPCR as previously described (Fonseca et al., 2015). Briefly, DNA was extracted from feces by phenol/chloroform extraction and Y. pseudotuberculosis burden was determined by measurement of the YscF gene against known standards. Primers: YscF-Forward 5’-ATGAGTAACTTCTCTGGATTTACG-3’ and YscF-Reverse 5’-TTATGGGAACTTCTGTAGGATG-3’. For Toxoplasma gondii infection with the ME-49 C1 strain, cysts were isolated from the brains of chronically infected mice by sequential needle passage homogenization and recipient mice were given cysts by oral gavage. Peptide injections were performed intravenously with 100µg YopE69–77 peptide (Genscript) or 100µg Tgd_05759–66 and TGME49_012300605–619 peptides (Genscript) or equal volume of control vehicle (DMSO). Anti-CD45 i.v. labeling was performed by i.v. injection of AF-780-labeled anti-CD45. 3 minutes later, mAT was isolated, with or without perfusion of the mouse before extraction.
METHOD DETAILS
Isolation of cells
Cells were isolated from spleen, mLN, IEL, and siLP as previously described (Sun et al., 2007). Other organs were processed for cell isolation using previously described methods. Briefly, cell isolation from lungs was performed by extracting and mincing the lungs before digestion for 20 minutes at 37°C with Collagenase IV (2mg/ml) (Sigma) and DNAse (1mg/ml) (Sigma) and filtration through a 70µm filter. For cell extraction from the liver and salivary glands, organs were minced and digested in Collagenase IV (1mg/ml)(Sigma) and DNAse I (0.5mg/ml)(Sigma) for 60 minutes at 37°C with agitation, and then filtered through 70µm filters. Isolation of cells from different adipose tissues (mAT, scAT, gAT) was performed as previously described (Fonseca et al., 2015). Briefly, AT was removed, weighed, and chopped in digestion media containing DMEM with 1% low fatty acid BSA, 50mM HEPES, Liberase TL (0.05mg/mL)(Roche) and DNase I (0.25mg/mL)(Sigma) and incubated for 25 minutes at 37°C with agitation. The tissue was then filtered through 70µm. For some samples stained for cytokine production, cells were stimulated with phorbol myristate acetate (50ng/ml), ionomycin (1µM), and BD GolgiPlug (1µl/ml) at 37° for 2.5 hours before staining for flow cytometry. Isolation of cells from the mAT of rhesus macaques was performed similarly to isolation from murine mAT. Subsequently, cells were frozen in FBS with 10% DMSO until stimulation with phorbol myristate acetate (5ng/ml) and ionomycin (1µM) with BD GolgiPlug (1µl/ml) overnight at 37°C before staining.
Microscopy
Confocal microscopy was performed as previously as described (Benezech et al., 2015), by fixing whole mAT tissue in 4% PFA for 1 hour, followed by 30 minutes of permeabilization in 1% Triton X, before staining at room temperature for 1 hour to overnight with primary antibodies and then 30 minutes at room temperature with secondary antibodies. Images were acquired on a Leica Sp8 inverted 5 channel confocal microscope. Whole mAT images were acquired on a Leica M205 stereomicroscope. Images were analyzed using Imaris Bitplane software.
Microarray Gene Expression Analysis
For microarray of total tissue homogenate, mAT was isolated from naïve or Yptb ΔyopM infected memory (>4 weeks) mice challenged with either peptide or vehicle control intravenously for 4 or 18 hours before tissue extraction. Tissue was stored at −80°C in RNAlater until extraction. Briefly, tissues were lysed in Trizol using bead disruption and RNA was extracted using phenol/chloroform extraction followed by the miRNeasy kit (Qiagen) according to the manufacturer’s instructions. Pathway analysis was performed using Enrichr (http://amp.pharm.mssm.edu/Enrichr/) based on all genes down regulated between vehicle treated and 18 hour peptide injected samples. Redundant gene lists obtained from the GO term database on the Enrichr site were collapsed. The top 10 GO pathways are shown based on enrichment score (log10 (adjusted p value)) and top 2 are used for the diagonal plot.
RNA extraction, cDNA synthesis and qPCR
Adipocytes were obtained from upper phase after centrifugation of Liberase-digested mAT, washed in HBSS, and placed in Trizol. For tissue or cellular samples, samples were processed as described above and resuspended in Trizol. Total RNA extraction was performed with RNeasy mini kit (Qiagen). DNase-treated total RNA (100ng) was reverse transcribed into cDNA with Omniscript RT kit (Qiagen) following manufacturer’s instructions. qPCR was performed using the iQ SYBR Green Supermix (Life Technologies) on a Quantstudio 6 Flex Real-Time PCR (Life Technologies) using the following primers (Quantitect® primer assay, Qiagen): Acaca (QT00258419), Dgat2 (QT00134477), Fasn (QT00149240), Gbp4 (QT00174608), Gbp11 (QT01255142), Ifi47 (QT00116935), Pparg (QT00100296), Hprt (QT00166768).
Flow cytometry
Cells were surface stained with the indicated antibodies for 20–30 minutes at 4°C. For intracellular staining, cells were fixed for 30 minutes with the eBioscience Fixation/Permeabilization kit as described by the manufacturer and stained intracellularly as recommended for at least 1 hour. Antibodies for flow cytometry were purchased from BD Biosciences, Biolegend, or eBioscience. Antibodies used were conjugated to FITC, AF488, PE, PCP5.5, PCP710, PeCy7, AF700, AF780, Pacific Blue, BV605, BV785, BV510, ef450, APC, ef647, Pe Texas Red, PE-ef594, or PE Dazzle. DAPI or Live/Dead fixable stain (Life Technologies) was used to identify dead cells in all experiments. The following antibody clones were used for staining of murine cells: CD4 (RM4–5), CD8β (H35-17.2), T-bet (4B10), GATA-3 (L50–823), Foxp3 (FJK-16S), IFN-γ (XMG1.2), IL-17A (17B7), IL-5 (TRFK5), IL-13 (13A), TNF-α (MP6-XT22), CD103 (2E7), CD11b (M1/70), CD45 (30-F11), CD45.1 (A20), CD69 (H1.2F3), CD127 (A7R34), Ki67 (SolA15), CD45.2 (104), CD90.2 (30-H12), TCRβ (H57–597), CD62L (MEL-14), CD44 (IM7), Ly-6G (IA8), Ly-6C (HK1.5), MHC-II (M5/114.15.2), CCR2(FAB5538P), Siglec F (E50–2440), NK1.1 (PK136), γδTCR (GL3), CD3 (17A2), CD11c (N418), B220 (RA3–6B2), KLRG1 (2F1), CD11a (M17/4), CD122 (TMb1), α4β7 (DATK32), CCR9 (CW1.2), CCR7 (4B12). The following antibody clones were used for staining of non-human primate cells: CD103 (HML-1), CD28 (CD28.2), CD3 (SP34-2), CD4 (OKT4), CD69 (FN50), CD8 (SK1), CD95 (DX2), IFN-γ (B27), IL-13 (JES10-5A2), TNF-α (MAb11). Flow cytometric data was acquired on a LSR II or LSR Fortessa (BD Biosciences) and analyzed using Flowjo software (Treestar).
Parabiosis
Parabiosis was performed as described elsewhere (Wright et al., 2001). Briefly, mice were sedated and longitudinal incisions were made from the elbow to the knee joint of each mouse. Excess skin was removed and mice were joined at the joints. The skin of the two animals was then connected and sutured together. Animals were kept on antibiotics for 2 weeks and remained conjoined for 4–8 weeks before analysis. For experiments where previously infected mice were included in the pairs, mice were infected for 4–8 weeks with Y. pseudotuberculosis ΔyopM prior to the surgical procedure to allow the mice to clear the pathogen and reach the memory phase.
Cell cycle and proliferation analysis
For cell cycle stage analysis, cells were isolated from the indicated organs and surface stained for flow cytometry as described above, before staining with Vybrant DyeCycle Violet (eBioscience) according to manufacturer’s instructions. For cell proliferation analysis, mice were injected with 1mg BrdU (Thermo Fisher or BD Biosciences) i.p. daily for 12 days. Organs were processed and cells were surface stained for flow cytometry as described above. Using the FITC BrdU Flow kit (BD Biosciences), cells were permeabilized with Cytofix/Cytoperm, washed with Perm Wash, and permeabilized a second time in Cytofix/Cytoperm Plus, and treated with DNAse I (1mg/ml) (Sigma Aldrich) for 1 hour at 37°C before staining with anti-BrdU (BD Biosciences).
MitoTracker staining
Cells were isolated as described above and surface stained for flow cytometry. Cells were then stained with MitoTracker Deep Red (Thermo Fisher) as per manufacturer’s instructions.
Fatty acid uptake
After cell isolation and surface staining as described above, ex vivo fatty acid uptake was assessed by incubating cells at 37°C for 30 minutes with 0.2µg/ml Bodipy FL C16 (Life Technologies).
RNASeq
Effector (TEM: CD44+CD62L−CD69−) and resident (TRM: CD44+CD62L− CD69+) memory CD8+ T cells were sorted from the siLP, spleen, and mAT of mice infected with Yptb ΔyopM by oral gavage >4 weeks before FACS sorting. Cells were pooled to reach at least 5000 cells per sample. RNA was extracted using the Arcturus PicoPure RNA Isolation kit (Thermo Fisher) as described by the manufacturer. Ultra-low input mRNA-seq libraries were created, pooled, and sequenced on NexSeq flowcells using NextSeq High v2 chemistry, 75 base pair paired-end reads. Sequencing yields were 101–147 million pass filtered reads and the percentage of Q30 bases was above 87% for all samples. The reads from the Illumina NextSeq sequencer in fastq format were verified for quality control using the FastQC software package version 0.11.5. The low-quality segments of the read were trimmed with the tool Trimmomatic (Bolger et al., 2014) using: seed mismatches:3, palindrome clip threshold:50, simple clip threshold:10, sliding window:4, required quality:20, minimum length after trimming: 40 and maximum read length to error rate of 50:0.8. The quality filtered reads were aligned to mouse genome GRCM38 using RSEM package (Li and Dewey, 2011) using default parameters and using STAR aligner (Dobin et al., 2013). The expected RSEM counts were rounded to the nearest integer value and the transcripts with zero counts across all the samples were filtered out. The transcripts with little or no variance across the samples were also deemed uninformative and therefore eliminated. Normalization of the data and differential expression analysis was performed using the DEseq pipeline (Anders and Huber, 2010). The effect of confounded variables was nullified using the SVA package (Leek and Storey, 2007) before differential expression analysis. Differential expression analysis of the TRM cell samples with TEM samples was performed. Differential expression analysis among the TRM cell samples from various tissues was also performed. The differentially expressed genes were evaluated for their functional significance using KEGG based pathway analysis, Gene Ontology term enrichment using the domain biological processes, and the tool clusterProfiler (Yu et al., 2012). Obtained GO pathways were then clustered together based on shared genes using custom R package. In short, a Spearman correlation matrix between the pathways was calculated and a network was constructed using Bonferroni corrected p<0.01 and a correlation coefficient r>0.3 between the nodes (pathways) as a cutoff. Resultant network was further visualized and analyzed in Cytoscape 3.4.0 using ClusterOne plugin (Nepusz et al., 2012) with default values to obtain a list of clusters of correlated pathways. Average value of the ratios of the positively or negatively regulated genes in all pathways for all significant (q<0.01) clusters were calculated and adjusted based on total number of number of the genes that were up- or down-regulated.
Adipose tissue explant cultures
Mice were perfused and AT was removed and cultured for 48 hours as previously described (Gericke et al., 2015). Briefly, the AT was minced and cultured with YopE69–77 peptide (20µg/ml) or equal volume of vehicle (DMSO) in supplemented RPMI (1% insulin-transferrin-selenium mixture (Sigma Aldrich), 1% FBS, and penicillin/streptomycin (Corning)) in a 6 well plate at 37°C with 5% CO2 for 48 hours. Supernatants were removed for analysis using the Free Glycerol Determination kit (Sigma). Samples were then washed and stored in Trizol at −80°C for RNA extraction as described above.
Determination of serum levels of adiponectin and cholesterol
Levels of adiponectin were determined in serum using the mouse adiponectin/Acrp30 ELISA duoset (R&D systems) following the manufacturer’s instructions. Levels of cholesterol in serum were determined using the Infinity Cholesterol Liquid Stable Reagent as directed by the manufacturer (Thermo Scientific).
Adipose tissue transplantation
AT transplantation was performed as has been previously described (Gavrilova et al., 2000). Briefly, congenic donor mice were perfused and AT was isolated, LNs were removed, and tissue was kept in cold PBS until transfer. Recipient mice were sedated, a 1cm long incision was made in the abdominal skin, and the AT was transferred into the subcutaneous space. The incision was closed by suture and mice received trimethoprim-sulfamethoxazole in the drinking water for 7 days. Mice were then given antibiotic-free water for 7 additional days before infectious challenge as described in the relevant figures. For CD4+ and CD8+ T cell depletion, mice were given 0.25mg of anti-CD4 (GK1.1) or anti-CD8 (2.43) depleting antibodies (BioXcell) by intraperitoneal injection every 2–3 days. Survival was assessed daily.
QUANTIFICATION AND STATISTICAL ANALYSIS
Statistical analysis
Data are presented as the mean ± standard deviation. Group sizes were selected based on preliminary experiments. Statistical significance was determined using two tailed-unpaired Student’s t test or Anova adjusted for multiple comparisons. All statistical analysis was performed using the Prism software (Graphpad). Statistical significance is indicated as ns not significiant, *p<0.05, **p<0.01, ***p<0.001, ****p<0.0001.
DATA AND SOFTWARE AVAILABILITY
The microarray data sets have been deposited in GEO under ID codes GSE104955. The RNA-Seq data sets have been deposited in BioProject under ID code BioProject ID: PRJNA414132.
| REAGENT or RESOURCE | SOURCE | IDENTIFIER |
|---|---|---|
| Antibodies | ||
| Anti-mouse α4β7 (DATK32) | eBioscience | Cat# 12-5887-82 |
| Anti-mouse B220 (RA3-6B2) | BD Biosciences | Cat# 562290 |
| Anti-mouse CCR2(FAB5538P) | R&D Systems | Cat# FAB5538P |
| Anti-mouse CCR7 (4B12) | Biolegend | Cat# 120107 |
| Anti-mouse CCR9 (CW1.2) | eBioscience | Cat# 12-1991-82 |
| Anti-mouse CD3 (17A2) | eBioscience | Cat# 47-0032-82 |
| Anti-mouse CD4 (RM4-5) | Biolegend | Cat# 100548 |
| Anti-mouse CD8β (H35–17.2) | eBioscience | Cat# 25-0083-82 |
| Anti-mouse CD11a (M17/4) | eBioscience | Cat# 12-0111-82 |
| Anti-mouse CD11b (M1/70) | BD Biosciences | Cat# 563015 |
| Anti-mouse CD11c (N418) | Biolegend | Cat# 117336 |
| Anti-mouse CD44 (IM7) | eBioscience | Cat# 25-0441-82 |
| Anti-mouse CD45 (30-F11) | eBioscience | Cat# 47-0451-82 |
| Anti-mouse CD45.1 (A20) | Biolegend | Cat# 110737 |
| Anti-mouse CD45.2 (104) | Biolegend | Cat# 109837 |
| Anti-mouse CD62L (MEL-14) | eBioscience | Cat# 11-0621-85 |
| Anti-mouse CD69 (H1.2F3) | eBioscience | Cat# 12-0691-83 |
| Anti-mouse CD90.2 (30-H12) | Biolegend | Cat# 105331 |
| Anti-mouse CD103 (2E7) | eBioscience | Cat# 46-1031-82 |
| Anti-mouse CD122 (TMb1) | eBioscience | Cat# 46-1222-82 |
| Anti-mouse CD127 (A7R34) | Biolegend | Cat# 135025 |
| Anti-mouse Foxp3 (FJK-16S) | eBioscience | Cat# 17-5773-82 |
| Anti-mouse γδTCR (GL3) | BD Biosciences | Cat# 563532 |
| Anti-mouse GATA-3 (L50-823) | BD Biosciences | Cat# 563349 |
| Anti-mouse IFN-γ (XMG1.2) | eBioscience | Cat# 48-7311-82 |
| Anti-mouse IL-5 (TRFK5) | Fisher Scientific | Cat# 554395 |
| Anti-mouse IL-13 (13A) | eBioscience | Cat# 53-7133-82 |
| Anti-mouse IL-17A (17B7) | Biolegend | Cat# 506910 |
| Anti-mouse Ki67 (SolA15) | eBioscience | Cat# 48-5698-82 |
| Anti-mouse KLRG1 (2F1) | eBioscience | Cat# 12-5893-82 |
| Anti-mouse Ly-6C (HK1.5) | Biolegend | Cat# 128035 |
| Anti-mouse Ly-6G (IA8) | BD Biosciences | Cat# 562700 |
| Anti-mouse MHC-II (M5/114.15.2) | eBioscience | Cat# 56-5321-82 |
| Anti-mouse NK1.1 (PK136) | BD Biosciences | Cat# 562864 |
| Anti-mouse Siglec F (E50-2440) | BD Biosciences | Cat# 562757 |
| Anti-mouse T-bet (4B10) | Biolegend | Cat# 644816 |
| Anti-mouse TCRβ (H57–597) | eBioscience | Cat# 47-5961-82 |
| Anti-mouse TNF-α (MP6-XT22) | BD Biosciences | Cat# 558000 |
| Anti-human CD3 (SP34-2) | BD Biosciences | Cat# 558124 |
| Anti-human CD4 (OKT4) | eBioscience | Cat# 93-0048-42 |
| Anti-human CD8 (SK1) | eBioscience | Cat# 46-0087-42 |
| Anti-human CD28 (CD28.2) | Beckman Coulter | Cat# 6607111 |
| Anti-human CD69 (FN50) | BD Biosciences | Cat# 557745 |
| Anti-human CD95 (DX2) | Biolegend | Cat# 305610 |
| Anti-human CD103 (HML-1) | Beckman Coulter | Cat# IM 1856 |
| Anti-human IFN-γ (B27) | BD Biosciences | Cat# 561024 |
| Anti-human IL-13 (JES10-5A2) | BD Biosciences | Cat# 554571 |
| Anti-human TNF-α (MAb11) | eBiosciences | Cat# 25-7349-82 |
| Anti-mouse CD4 (GK1.1) (depletion) | BioXcell | Cat# BE0003-1 |
| Anti-mouse CD8α (2.43) (depletion) | BioXcell | Cat# BE0061 |
| Bacterial and Virus Strains | ||
| Yersinia pseudotuberculosis (32777) | Laboratory of I.E.B. | N/A |
| Toxoplasma gondii (ME-49 C1) | Laboratory of Michael Grigg | N/A |
| Biological Samples | ||
| Chemicals, Peptides, and Recombinant Proteins | ||
| Bodipy FL C16 | Life Technologies | Cat# D-3821 |
| BrdU | Thermo Fisher or BD Biosciences | Cat# B23151 or 550891 |
| Collagenase IV | Sigma | Cat# C5138-1G |
| DNase I | Sigma | Cat# DN25-5G |
| Liberase TL | Roche | Cat# 5401020001 |
| Tgd_05759–66 | Genscript | N/A |
| TGME49_012300605–619 | Genscript | N/A |
| YopE69–77 peptide | Genscript | N/A |
| Critical Commercial Assays | ||
| Mouse adiponectin/Acrp30 ELISA duoset | R&D systems | Cat# DY1119 |
| Arcturus PicoPure RNA Isolation kit | Thermo Fisher | Cat# KIT0204 |
| FITC BrdU Flow kit | BD Biosciences | Cat# 557891 |
| Fixation/Permeabilization | eBioscience | Cat# 00-5523-00 |
| Free Glycerol Determination kit | Sigma | Cat# FG0100 |
| Infinity Cholesterol Liquid Stable Reagent | Thermo Scientific | Cat# TR13421 |
| iQ SYBR Green Supermix | Life Technologies | Cat# 4368702 |
| Live/Dead fixable stain | Life Technologies | Cat# L23105 |
| miRNeasy kit | Qiagen | Cat# 217084 |
| MitoTracker Deep Red | Thermo Fisher | Cat# M22426 |
| Omniscript RT kit | Qiagen | Cat# 205111 |
| RNeasy mini kit | Qiagen | Cat# 74106 |
| Vybrant DyeCycle Violet | eBioscience | Cat# V35003 |
| Deposited Data | ||
| Raw RNA-Seq data | This paper | BioProject ID: PRJNA414132 |
| Raw microarray data | This paper | GEO: GSE104955 |
| Experimental Models: Cell Lines | ||
| Experimental Models: Organisms/Strains | ||
| Mouse: C57BL/6 | Taconic Farms | Mouse strain: B6 |
| Mouse: Tg(CAG-DsRed*MST)1Nagy/J (DsRed reporter) | Jackson Laboratory | Mouse strain: Jax005441 |
| Mouse: B6.SJL-Ptprca/BoyAiTac (CD45.1) | Taconic Farms – NIAID exchange | Mouse strain: Tac8478 |
| Mouse: C57BL/6-[Tg]CD11c(Itgax):EYFP (CD11c–eYFP reporter) | Taconic Farms – NIAID exchange | Mouse strain: Tac307 |
| B6.SJL-Cd45a(Ly5a)Nai-[KO]RAG1 (Rag KO) | Taconic Farms – NIAID exchange | Mouse strain: Tac165 |
| Non-human primate: Macaca mulatta | Laboratory of J.M.B. | N/A |
| Oligonucleotides | ||
| 5’-ATGAGTAACTTCTCTGGATTTACG-3’ | IDT | Primer; YscF-Forward |
| 5’-TTATGGGAACTTCTGTAGGATG-3’ | IDT | Primer: YscF-Reverse |
| Acaca | Qiagen | Cat#: QT00258419 |
| Dgat2 | Qiagen | Cat#: QT00134477 |
| Fasn | Qiagen | Cat#: QT00149240 |
| Gbp4 | Qiagen | Cat#: QT00174608 |
| Gbp11 | Qiagen | Cat#: QT01255142 |
| Ifi47 | Qiagen | Cat#: QT00116935 |
| Pparg | Qiagen | Cat#: QT00100296 |
| Hprt | Qiagen | Cat#: QT00166768 |
| Recombinant DNA | ||
| Software and Algorithms | ||
| clusterProfiler | Yu et al., 2012 | N/A |
| Cytoscape 3.4.0 | Nepusz et al., 2012 | N/A |
| DEseq pipeline | Anders and Huber, 2010 | N/A |
| Enrichr | http://amp.pharm.mssm.edu/Enrichr/ | N/A |
| FastQC software package version 0.11.5 | Babraham Bioinformatics | N/A |
| Flowjo software | Treestar | N/A |
| Imaris software | Bitplane | N/A |
| Prism software | Graphpad | N/A |
| STAR aligner | Dobin et al., 2013 | N/A |
| Trimmomatic | Bolger et al., 2014 | N/A |
| Other | ||
| REAGENT or RESOURCE | SOURCE | IDENTIFIER |
| Antibodies | ||
| Anti-mouse α4β7 (DATK32) | eBioscience | 12-5887-82 |
| Anti-mouse B220 (RA3-6B2) | BD Biosciences | 562290 |
| Anti-mouse CCR2(FAB5538P) | R&D Systems | FAB5538P |
| Anti-mouse CCR7 (4B12) | Biolegend | 120107 |
| Anti-mouse CCR9 (CW1.2) | eBioscience | 12-1991-82 |
| Anti-mouse CD3 (17A2) | eBioscience | 47-0032-82 |
| Anti-mouse CD4 (RM4-5) | Biolegend | 100548 |
| Anti-mouse CD8β (H35-17.2) | eBioscience | 25-0083-82 |
| Anti-mouse CD11a (M17/4) | eBioscience | 12-0111-82 |
| Anti-mouse CD11b (M1/70) | BD Biosciences | 563015 |
| Anti-mouse CD11c (N418) | Biolegend | 117336 |
| Anti-mouse CD44 (IM7) | eBioscience | 25-0441-82 |
| Anti-mouse CD45 (30-F11) | eBioscience | 47-0451-82 |
| Anti-mouse CD45.1 (A20) | Biolegend | 110737 |
| Anti-mouse CD45.2 (104) | Biolegend | 109837 |
| Anti-mouse CD62L (MEL-14) | eBioscience | 11-0621-85 |
| Anti-mouse CD69 (H1.2F3) | eBioscience | 12-0691-83 |
| Anti-mouse CD90.2 (30-H12) | Biolegend | 105331 |
| Anti-mouse CD103 (2E7) | eBioscience | 46-1031-82 |
| Anti-mouse CD122 (TMb1) | eBioscience | 46-1222-82 |
| Anti-mouse CD127 (A7R34) | Biolegend | 135025 |
| Anti-mouse Foxp3 (FJK-16S) | eBioscience | 17-5773-82 |
| Anti-mouse γδTCR (GL3) | BD Biosciences | 563532 |
| Anti-mouse GATA-3 (L50-823) | BD Biosciences | 563349 |
| Anti-mouse IFN-γ (XMG1.2) | eBioscience | 48-7311-82 |
| Anti-mouse IL-5 (TRFK5) | Fisher Scientific | 554395 |
| Anti-mouse IL-13 (13A) | eBioscience | 53-7133-82 |
| Anti-mouse IL-17A (17B7) | Biolegend | 506910 |
| Anti-mouse Ki67 (SolA15) | eBioscience | 48-5698-82 |
| Anti-mouse KLRG1 (2F1) | eBioscience | 12-5893-82 |
| Anti-mouse Ly-6C (HK1.5) | Biolegend | 128035 |
| Anti-mouse Ly-6G (IA8) | BD Biosciences | 562700 |
| Anti-mouse MHC-II (M5/114.15.2) | eBioscience | 56-5321-82 |
| Anti-mouse NK1.1 (PK136) | BD Biosciences | 562864 |
| Anti-mouse Siglec F (E50-2440) | BD Biosciences | 562757 |
| Anti-mouse T-bet (4B10) | Biolegend | 644816 |
| Anti-mouse TCRβ (H57–597) | eBioscience | 47-5961-82 |
| Anti-mouse TNF-αD(MP6-XT22) | BD Biosciences | 558000 |
| Anti-human CD3 (SP34-2) | BD Biosciences | 558124 |
| Anti-human CD4 (OKT4) | eBioscience | 93-0048-42 |
| Anti-human CD8 (SK1) | eBioscience | 46-0087-42 |
| Anti-human CD28 (CD28.2) | Beckman Coulter | 6607111 |
| Anti-human CD69 (FN50) | BD Biosciences | 557745 |
| Anti-human CD95 (DX2) | Biolegend | 305610 |
| Anti-human CD103 (HML-1) | Beckman Coulter | IM 1856 |
| Anti-human IFN-γ (B27) | BD Biosciences | 561024 |
| Anti-human IL-13 (JES10-5A2) | BD Biosciences | 554571 |
| Anti-human TNF-α (MAb11) | eBiosciences | 25-7349-82 |
| Anti-mouse CD4 (GK1.1) (depletion) | BioXcell | BE0003-1 |
| Anti-mouse CD8α (2.43) (depletion) | BioXcell | BE0061 |
| Bacterial and Virus Strains | ||
| Yersinia pseudotuberculosis (32777) | Laboratory of I.E.B. | N/A |
| Toxoplasma gondii (ME-49 C1) | Laboratory of Michael Grigg | N/A |
| Biological Samples | ||
| Chemicals, Peptides, and Recombinant Proteins | ||
| Bodipy FL C16 | Life Technologies | D-3821 |
| BrdU | Thermo Fisher or BD Biosciences | B23151 or 550891 |
| Collagenase IV | Sigma | C5138-1G |
| DNase I | Sigma | DN25-5G |
| Liberase TL | Roche | 5401020001 |
| Tgd_05759–66 | Genscript | N/A |
| TGME49_012300605–619 | Genscript | N/A |
| YopE69–77 peptide | Genscript | N/A |
| Critical Commercial Assays | ||
| Mouse adiponectin/Acrp30 ELISA duoset | R&D systems | DY1119 |
| Arcturus PicoPure RNA Isolation kit | Thermo Fisher | KIT0204 |
| FITC BrdU Flow kit | BD Biosciences | 557891 |
| Fixation/Permeabilization | eBioscience | 00-5523-00 |
| Free Glycerol Determination kit | Sigma | FG0100 |
| Infinity Cholesterol Liquid Stable Reagent | Thermo Scientific | TR13421 |
| iQ SYBR Green Supermix | Life Technologies | 4368702 |
| Live/Dead fixable stain | Life Technologies | L23105 |
| miRNeasy kit | Qiagen | 217084 |
| MitoTracker Deep Red | Thermo Fisher | M22426 |
| Omniscript RT kit | Qiagen | 205111 |
| RNeasy mini kit | Qiagen | 74106 |
| Vybrant DyeCycle Violet | eBioscience | V35003 |
| Deposited Data | ||
| Raw RNA-Seq data | This paper | BioProject ID: PRJNA414132 |
| Raw microarray data | This paper | GEO: GSE104955 |
| Experimental Models: Cell Lines | ||
| Experimental Models: Organisms/Strains | ||
| Mouse: C57BL/6 | Taconic Farms | B6 |
| Mouse: Tg(CAG-DsRed*MST)1Nagy/J (DsRed reporter) | Jackson Laboratory | 005441 |
| Mouse: B6.SJL-Ptprca/BoyAiTac (CD45.1) | Taconic Farms – NIAID exchange | Tac8478 |
| Mouse: C57BL/6-[Tg]CD11c(Itgax):EYFP (CD11c–eYFP reporter) | Taconic Farms – NIAID exchange | Tac307 |
| B6.SJL-Cd45a(Ly5a)Nai-[KO]RAG1 (Rag KO) | Taconic Farms – NIAID exchange | Tac165 |
| Non-human primate: Macaca mulatta | Laboratory of J.M.B. | N/A |
| Oligonucleotides | ||
| 5’-ATGAGTAACTTCTCTGGATTTACG-3’ | IDT | YscF-Forward |
| 5’-TTATGGGAACTTCTGTAGGATG-3’ | IDT | YscF-Reverse |
| Acaca | Qiagen | QT00258419 |
| Dgat2 | Qiagen | QT00134477 |
| Fasn | Qiagen | QT00149240 |
| Gbp4 | Qiagen | QT00174608 |
| Gbp11 | Qiagen | QT01255142 |
| Ifi47 | Qiagen | QT00116935 |
| Pparg | Qiagen | QT00100296 |
| Hprt | Qiagen | QT00166768 |
| Recombinant DNA | ||
| Software and Algorithms | ||
| clusterProfiler | Yu et al., 2012 | N/A |
| Cytoscape 3.4.0 | Nepusz et al., 2012 | N/A |
| DEseq pipeline | Anders and Huber, 2010 | N/A |
| Enrichr | http://amp.pharm.mssm.edu/Enrichr/ | N/A |
| FastQC software package version 0.11.5 | Babraham Bioinformatics | N/A |
| Flowjo software | Treestar | N/A |
| Imaris software | Bitplane | N/A |
| Prism software | Graphpad | N/A |
| STAR aligner | Dobin et al., 2013 | N/A |
| Trimmomatic | Bolger et al., 2014 | N/A |
| Other | ||
Supplementary Material
Acknowledgments
This work was supported by the Division of Intramural Research of the National Institute of Allergy and Infectious Diseases (NIAID), National Institutes of Health and National Institutes of Health grant: R01AI099222 (J.B.B), the Helen Hay Whitney Foundation (A.G.Z), the PEW Latin American fellowship from the Pew Charitable Trusts (V.A-O),. and the long term EMBO fellowship (S.T.). We thank the NIAID animal facility; the NIAID Flow Cytometry facility; O. Schwartz and the NIAID Biological Imaging facility, the NIH Tetramer Facility, and K. Beacht, J. Legrand, N. Bubunenko, D. Sun, R. Winkler-Pickett, S.Q. Lee-Lin and J. Davis for technical assistance. We thank the members of the Belkaid laboratory for critical reading of the manuscript and helpful discussions.
Footnotes
Publisher's Disclaimer: This is a PDF file of an unedited manuscript that has been accepted for publication. As a service to our customers we are providing this early version of the manuscript. The manuscript will undergo copyediting, typesetting, and review of the resulting proof before it is published in its final citable form. Please note that during the production process errors may be discovered which could affect the content, and all legal disclaimers that apply to the journal pertain.
Author Contributions
S.H., A.G.Z., and Y.B. designed the studies and wrote the manuscript. S.H. and A.G.Z. performed experiments and analyzed the data. N.C., O.J.H., S.T., and V.A-O. performed experiments and provided valuable guidance. A.L.B., A.D., and J.S. performed microarray and/or RNA-Seq analysis. D.M.F. provided intellectual expertise. M.S. performed whole tissue mount imaging studies. N.B. assisted with manuscript preparation. J.B.B. and I.E.B. provided Y. pseudotuberculosis strains and guidance to establish the model. J.M.B. provided primate tissues and guidance.
The authors declare no competing financial interests.
References
- Aldrich MB, Sevick-Muraca EM. Cytokines are systemic effectors of lymphatic function in acute inflammation. Cytokine. 2013;64:362–369. doi: 10.1016/j.cyto.2013.05.015. [DOI] [PMC free article] [PubMed] [Google Scholar]
- Anders S, Huber W. Differential expression analysis for sequence count data. Genome Biol. 2010;11:R106. doi: 10.1186/gb-2010-11-10-r106. [DOI] [PMC free article] [PubMed] [Google Scholar]
- Anderson KG, Mayer-Barber K, Sung H, Beura L, James BR, Taylor JJ, Qunaj L, Griffith TS, Vezys V, Barber DL, Masopust D. Intravascular staining for discrimination of vascular and tissue leukocytes. Nat Protoc. 2014;9:209–222. doi: 10.1038/nprot.2014.005. [DOI] [PMC free article] [PubMed] [Google Scholar]
- Ariotti S, Hogenbirk MA, Dijkgraaf FE, Visser LL, Hoekstra ME, Song JY, Jacobs H, Haanen JB, Schumacher TN. T cell memory. Skin-resident memory CD8(+) T cells trigger a state of tissue-wide pathogen alert. Science. 2014;346:101–105. doi: 10.1126/science.1254803. [DOI] [PubMed] [Google Scholar]
- Azeez OI, Meintjes R, Chamunorwa JP. Fat body, fat pad and adipose tissues in invertebrates and vertebrates: the nexus. Lipids Health Dis. 2014;13:71. doi: 10.1186/1476-511X-13-71. [DOI] [PMC free article] [PubMed] [Google Scholar]
- Benezech C, Luu NT, Walker JA, Kruglov AA, Loo Y, Nakamura K, Zhang Y, Nayar S, Jones LH, Flores-Langarica A, et al. Inflammation-induced formation of fat-associated lymphoid clusters. Nat Immunol. 2015;16:819–828. doi: 10.1038/ni.3215. [DOI] [PMC free article] [PubMed] [Google Scholar]
- Bergman MA, Loomis WP, Mecsas J, Starnbach MN, Isberg RR. CD8(+) T cells restrict Yersinia pseudotuberculosis infection: bypass of anti-phagocytosis by targeting antigen-presenting cells. PLoS Pathog. 2009;5:e1000573. doi: 10.1371/journal.ppat.1000573. [DOI] [PMC free article] [PubMed] [Google Scholar]
- Bolger AM, Lohse M, Usadel B. Trimmomatic: a flexible trimmer for Illumina sequence data. Bioinformatics. 2014;30:2114–2120. doi: 10.1093/bioinformatics/btu170. [DOI] [PMC free article] [PubMed] [Google Scholar]
- Brestoff JR, Artis D. Immune regulation of metabolic homeostasis in health and disease. Cell. 2015;161:146–160. doi: 10.1016/j.cell.2015.02.022. [DOI] [PMC free article] [PubMed] [Google Scholar]
- Buck MD, O’Sullivan D, Pearce EL. T cell metabolism drives immunity. J Exp Med. 2015;212:1345–1360. doi: 10.1084/jem.20151159. [DOI] [PMC free article] [PubMed] [Google Scholar]
- Chun TW, Moir S, Fauci AS. HIV reservoirs as obstacles and opportunities for an HIV cure. Nat Immunol. 2015;16:584–589. doi: 10.1038/ni.3152. [DOI] [PubMed] [Google Scholar]
- Cohen SB, Denkers EY. The gut mucosal immune response to Toxoplasma gondii. Parasite Immunol. 2015;37:108–117. doi: 10.1111/pim.12164. [DOI] [PubMed] [Google Scholar]
- Collins N, Jiang X, Zaid A, Macleod BL, Li J, Park CO, Haque A, Bedoui S, Heath WR, Mueller SN, et al. Skin CD4(+) memory T cells exhibit combined cluster-mediated retention and equilibration with the circulation. Nat Commun. 2016;7:11514. doi: 10.1038/ncomms11514. [DOI] [PMC free article] [PubMed] [Google Scholar]
- Couturier J, Suliburk JW, Brown JM, Luke DJ, Agarwal N, Yu X, Nguyen C, Iyer D, Kozinetz CA, Overbeek PA, et al. Human adipose tissue as a reservoir for memory CD4+ T cells and HIV. AIDS. 2015;29:667–674. doi: 10.1097/QAD.0000000000000599. [DOI] [PMC free article] [PubMed] [Google Scholar]
- Cromer WE, Zawieja SD, Tharakan B, Childs EW, Newell MK, Zawieja DC. The effects of inflammatory cytokines on lymphatic endothelial barrier function. Angiogenesis. 2014;17:395–406. doi: 10.1007/s10456-013-9393-2. [DOI] [PMC free article] [PubMed] [Google Scholar]
- Cui G, Staron MM, Gray SM, Ho PC, Amezquita RA, Wu J, Kaech SM. IL-7-Induced Glycerol Transport and TAG Synthesis Promotes Memory CD8+ T Cell Longevity. Cell. 2015;161:750–761. doi: 10.1016/j.cell.2015.03.021. [DOI] [PMC free article] [PubMed] [Google Scholar]
- Damouche A, Lazure T, Avettand-Fenoel V, Huot N, Dejucq-Rainsford N, Satie AP, Melard A, David L, Gommet C, Ghosn J, et al. Adipose Tissue Is a Neglected Viral Reservoir and an Inflammatory Site during Chronic HIV and SIV Infection. PLoS Pathog. 2015;11:e1005153. doi: 10.1371/journal.ppat.1005153. [DOI] [PMC free article] [PubMed] [Google Scholar]
- DiSpirito JR, Mathis D. Immunological contributions to adipose tissue homeostasis. Semin Immunol. 2015;27:315–321. doi: 10.1016/j.smim.2015.10.005. [DOI] [PMC free article] [PubMed] [Google Scholar]
- Dobin A, Davis CA, Schlesinger F, Drenkow J, Zaleski C, Jha S, Batut P, Chaisson M, Gingeras TR. STAR: ultrafast universal RNA-seq aligner. Bioinformatics. 2013;29:15–21. doi: 10.1093/bioinformatics/bts635. [DOI] [PMC free article] [PubMed] [Google Scholar]
- Ferreira AV, Segatto M, Menezes Z, Macedo AM, Gelape C, de Oliveira Andrade L, Nagajyothi F, Scherer PE, Teixeira MM, Tanowitz HB. Evidence for Trypanosoma cruzi in adipose tissue in human chronic Chagas disease. Microbes Infect. 2011;13:1002–1005. doi: 10.1016/j.micinf.2011.06.002. [DOI] [PMC free article] [PubMed] [Google Scholar]
- Feuerer M, Herrero L, Cipolletta D, Naaz A, Wong J, Nayer A, Lee J, Goldfine AB, Benoist C, Shoelson S, Mathis D. Lean, but not obese, fat is enriched for a unique population of regulatory T cells that affect metabolic parameters. Nat Med. 2009a;15:930–939. doi: 10.1038/nm.2002. [DOI] [PMC free article] [PubMed] [Google Scholar]
- Feuerer M, Hill JA, Mathis D, Benoist C. Foxp3+ regulatory T cells: differentiation, specification, subphenotypes. Nat Immunol. 2009b;10:689–695. doi: 10.1038/ni.1760. [DOI] [PubMed] [Google Scholar]
- Fonseca DM, Hand TW, Han SJ, Gerner MY, Glatman Zaretsky A, Byrd AL, Harrison OJ, Ortiz AM, Quinones M, Trinchieri G, et al. Microbiota-Dependent Sequelae of Acute Infection Compromise Tissue-Specific Immunity. Cell. 2015;163:354–366. doi: 10.1016/j.cell.2015.08.030. [DOI] [PMC free article] [PubMed] [Google Scholar]
- Franke-Fayard B, Janse CJ, Cunha-Rodrigues M, Ramesar J, Buscher P, Que I, Lowik C, Voshol PJ, den Boer MA, van Duinen SG, et al. Murine malaria parasite sequestration: CD36 is the major receptor, but cerebral pathology is unlinked to sequestration. Proc Natl Acad Sci U S A. 2005;102:11468–11473. doi: 10.1073/pnas.0503386102. [DOI] [PMC free article] [PubMed] [Google Scholar]
- Gavrilova O, Marcus-Samuels B, Graham D, Kim JK, Shulman GI, Castle AL, Vinson C, Eckhaus M, Reitman ML. Surgical implantation of adipose tissue reverses diabetes in lipoatrophic mice. J Clin Invest. 2000;105:271–278. doi: 10.1172/JCI7901. [DOI] [PMC free article] [PubMed] [Google Scholar]
- Gericke M, Weyer U, Braune J, Bechmann I, Eilers J. A method for long-term live imaging of tissue macrophages in adipose tissue explants. Am J Physiol Endocrinol Metab. 2015;308:E1023–1033. doi: 10.1152/ajpendo.00075.2015. [DOI] [PubMed] [Google Scholar]
- Jackson-Jones LH, Duncan SM, Magalhaes MS, Campbell SM, Maizels RM, McSorley HJ, Allen JE, Benezech C. Fat-associated lymphoid clusters control local IgM secretion during pleural infection and lung inflammation. Nat Commun. 2016;7:12651. doi: 10.1038/ncomms12651. [DOI] [PMC free article] [PubMed] [Google Scholar]
- Jiang X, Clark RA, Liu L, Wagers AJ, Fuhlbrigge RC, Kupper TS. Skin infection generates non-migratory memory CD8+ T(RM) cells providing global skin immunity. Nature. 2012;483:227–231. doi: 10.1038/nature10851. [DOI] [PMC free article] [PubMed] [Google Scholar]
- Jones DD, Racine R, Wittmer ST, Harston L, Papillion AM, Dishaw LM, Randall TD, Woodland DL, Winslow GM. The omentum is a site of protective IgM production during intracellular bacterial infection. Infect Immun. 2015;83:2139–2147. doi: 10.1128/IAI.00295-15. [DOI] [PMC free article] [PubMed] [Google Scholar]
- Klonowski KD, Williams KJ, Marzo AL, Blair DA, Lingenheld EG, Lefrancois L. Dynamics of blood-borne CD8 memory T cell migration in vivo. Immunity. 2004;20:551–562. doi: 10.1016/s1074-7613(04)00103-7. [DOI] [PubMed] [Google Scholar]
- Leek JT, Storey JD. Capturing heterogeneity in gene expression studies by surrogate variable analysis. PLoS Genet. 2007;3:1724–1735. doi: 10.1371/journal.pgen.0030161. [DOI] [PMC free article] [PubMed] [Google Scholar]
- Li B, Dewey CN. RSEM: accurate transcript quantification from RNA-Seq data with or without a reference genome. BMC Bioinformatics. 2011;12:323. doi: 10.1186/1471-2105-12-323. [DOI] [PMC free article] [PubMed] [Google Scholar]
- Lugli E, Dominguez MH, Gattinoni L, Chattopadhyay PK, Bolton DL, Song K, Klatt NR, Brenchley JM, Vaccari M, Gostick E, et al. Superior T memory stem cell persistence supports long-lived T cell memory. J Clin Invest. 2013;123:594–599. doi: 10.1172/JCI66327. [DOI] [PMC free article] [PubMed] [Google Scholar]
- Mackay LK, Rahimpour A, Ma JZ, Collins N, Stock AT, Hafon ML, Vega-Ramos J, Lauzurica P, Mueller SN, Stefanovic T, et al. The developmental pathway for CD103(+)CD8+ tissue-resident memory T cells of skin. Nat Immunol. 2013;14:1294–1301. doi: 10.1038/ni.2744. [DOI] [PubMed] [Google Scholar]
- Masopust D, Vezys V, Marzo AL, Lefrancois L. Preferential localization of effector memory cells in nonlymphoid tissue. Science. 2001;291:2413–2417. doi: 10.1126/science.1058867. [DOI] [PubMed] [Google Scholar]
- Moro K, Yamada T, Tanabe M, Takeuchi T, Ikawa T, Kawamoto H, Furusawa J, Ohtani M, Fujii H, Koyasu S. Innate production of T(H)2 cytokines by adipose tissue-associated c-Kit(+)Sca-1(+) lymphoid cells. Nature. 2010;463:540–544. doi: 10.1038/nature08636. [DOI] [PubMed] [Google Scholar]
- Mueller SN, Mackay LK. Tissue-resident memory T cells: local specialists in immune defence. Nat Rev Immunol. 2016;16:79–89. doi: 10.1038/nri.2015.3. [DOI] [PubMed] [Google Scholar]
- Nepusz T, Yu H, Paccanaro A. Detecting overlapping protein complexes in protein-protein interaction networks. Nat Methods. 2012;9:471–472. doi: 10.1038/nmeth.1938. [DOI] [PMC free article] [PubMed] [Google Scholar]
- Neyrolles O, Hernandez-Pando R, Pietri-Rouxel F, Fornes P, Tailleux L, Barrios Payan JA, Pivert E, Bordat Y, Aguilar D, Prevost MC, et al. Is adipose tissue a place for Mycobacterium tuberculosis persistence? PLoS One. 2006;1:e43. doi: 10.1371/journal.pone.0000043. [DOI] [PMC free article] [PubMed] [Google Scholar]
- O’Neill LA, Kishton RJ, Rathmell J. A guide to immunometabolism for immunologists. Nat Rev Immunol. 2016;16:553–565. doi: 10.1038/nri.2016.70. [DOI] [PMC free article] [PubMed] [Google Scholar]
- O’Sullivan D, van der Windt GJ, Huang SC, Curtis JD, Chang CH, Buck MD, Qiu J, Smith AM, Lam WY, DiPlato LM, et al. Memory CD8(+) T cells use cell-intrinsic lipolysis to support the metabolic programming necessary for development. Immunity. 2014;41:75–88. doi: 10.1016/j.immuni.2014.06.005. [DOI] [PMC free article] [PubMed] [Google Scholar]
- Odegaard JI, Chawla A. The immune system as a sensor of the metabolic state. Immunity. 2013;38:644–654. doi: 10.1016/j.immuni.2013.04.001. [DOI] [PMC free article] [PubMed] [Google Scholar]
- Odegaard JI, Chawla A. Type 2 responses at the interface between immunity and fat metabolism. Curr Opin Immunol. 2015;36:67–72. doi: 10.1016/j.coi.2015.07.003. [DOI] [PMC free article] [PubMed] [Google Scholar]
- Okabe Y, Medzhitov R. Tissue-specific signals control reversible program of localization and functional polarization of macrophages. Cell. 2014;157:832–844. doi: 10.1016/j.cell.2014.04.016. [DOI] [PMC free article] [PubMed] [Google Scholar]
- Ouchi N, Parker JL, Lugus JJ, Walsh K. Adipokines in inflammation and metabolic disease. Nat Rev Immunol. 2011;11:85–97. doi: 10.1038/nri2921. [DOI] [PMC free article] [PubMed] [Google Scholar]
- Pan Y, Tian T, Park CO, Lofftus SY, Mei S, Liu X, Luo C, O’Malley JT, Gehad A, Teague JE, et al. Survival of tissue-resident memory T cells requires exogenous lipid uptake and metabolism. Nature. 2017;543:252–256. doi: 10.1038/nature21379. [DOI] [PMC free article] [PubMed] [Google Scholar]
- Pichyangkul S, Yongvanitchit K, Limsalakpetch A, Kum-Arb U, Im-Erbsin R, Boonnak K, Thitithayanont A, Jongkaewwattana A, Wiboon-ut S, Mongkolsirichaikul D, et al. Tissue Distribution of Memory T and B Cells in Rhesus Monkeys following Influenza A Infection. J Immunol. 2015;195:4378–4386. doi: 10.4049/jimmunol.1501702. [DOI] [PMC free article] [PubMed] [Google Scholar]
- Pitcher CJ, Hagen SI, Walker JM, Lum R, Mitchell BL, Maino VC, Axthelm MK, Picker LJ. Development and homeostasis of T cell memory in rhesus macaque. J Immunol. 2002;168:29–43. doi: 10.4049/jimmunol.168.1.29. [DOI] [PubMed] [Google Scholar]
- Rangel-Moreno J, Moyron-Quiroz JE, Carragher DM, Kusser K, Hartson L, Moquin A, Randall TD. Omental milky spots develop in the absence of lymphoid tissue-inducer cells and support B and T cell responses to peritoneal antigens. Immunity. 2009;30:731–743. doi: 10.1016/j.immuni.2009.03.014. [DOI] [PMC free article] [PubMed] [Google Scholar]
- Rosen ED, Spiegelman BM. What we talk about when we talk about fat. Cell. 2014;156:20–44. doi: 10.1016/j.cell.2013.12.012. [DOI] [PMC free article] [PubMed] [Google Scholar]
- Scallan JP, Davis MJ, Huxley VH. Permeability and contractile responses of collecting lymphatic vessels elicited by atrial and brain natriuretic peptides. The Journal of physiology. 2013;591:5071–5081. doi: 10.1113/jphysiol.2013.260042. [DOI] [PMC free article] [PubMed] [Google Scholar]
- Scallan JP, Huxley VH. In vivo determination of collecting lymphatic vessel permeability to albumin: a role for lymphatics in exchange. The Journal of physiology. 2010;588:243–254. doi: 10.1113/jphysiol.2009.179622. [DOI] [PMC free article] [PubMed] [Google Scholar]
- Schenkel JM, Fraser KA, Beura LK, Pauken KE, Vezys V, Masopust D. T cell memory. Resident memory CD8 T cells trigger protective innate and adaptive immune responses. Science. 2014;346:98–101. doi: 10.1126/science.1254536. [DOI] [PMC free article] [PubMed] [Google Scholar]
- Schenkel JM, Fraser KA, Vezys V, Masopust D. Sensing and alarm function of resident memory CD8(+) T cells. Nat Immunol. 2013;14:509–513. doi: 10.1038/ni.2568. [DOI] [PMC free article] [PubMed] [Google Scholar]
- Schenkel JM, Masopust D. Tissue-resident memory T cells. Immunity. 2014;41:886–897. doi: 10.1016/j.immuni.2014.12.007. [DOI] [PMC free article] [PubMed] [Google Scholar]
- Skon CN, Lee JY, Anderson KG, Masopust D, Hogquist KA, Jameson SC. Transcriptional downregulation of S1pr1 is required for the establishment of resident memory CD8+ T cells. Nat Immunol. 2013;14:1285–1293. doi: 10.1038/ni.2745. [DOI] [PMC free article] [PubMed] [Google Scholar]
- Steinert EM, Schenkel JM, Fraser KA, Beura LK, Manlove LS, Igyarto BZ, Southern PJ, Masopust D. Quantifying Memory CD8 T Cells Reveals Regionalization of Immunosurveillance. Cell. 2015;161:737–749. doi: 10.1016/j.cell.2015.03.031. [DOI] [PMC free article] [PubMed] [Google Scholar]
- Stern JH, Rutkowski JM, Scherer PE. Adiponectin, Leptin, and Fatty Acids in the Maintenance of Metabolic Homeostasis through Adipose Tissue Crosstalk. Cell Metab. 2016;23:770–784. doi: 10.1016/j.cmet.2016.04.011. [DOI] [PMC free article] [PubMed] [Google Scholar]
- Sun CM, Hall JA, Blank RB, Bouladoux N, Oukka M, Mora JR, Belkaid Y. Small intestine lamina propria dendritic cells promote de novo generation of Foxp3 T reg cells via retinoic acid. J Exp Med. 2007;204:1775–1785. doi: 10.1084/jem.20070602. [DOI] [PMC free article] [PubMed] [Google Scholar]
- Sundara Rajan S, Longhi MP. Dendritic cells and adipose tissue. Immunology. 2016;149:353–361. doi: 10.1111/imm.12653. [DOI] [PMC free article] [PubMed] [Google Scholar]
- Teixeira L, Moreira J, Melo J, Bezerra F, Marques RM, Ferreirinha P, Correia A, Monteiro MP, Ferreira PG, Vilanova M. Immune response in the adipose tissue of lean mice infected with the protozoan parasite Neospora caninum. Immunology. 2015;145:242–257. doi: 10.1111/imm.12440. [DOI] [PMC free article] [PubMed] [Google Scholar]
- Trindade S, Rijo-Ferreira F, Carvalho T, Pinto-Neves D, Guegan F, Aresta-Branco F, Bento F, Young SA, Pinto A, Van Den Abbeele J, et al. Trypanosoma brucei Parasites Occupy and Functionally Adapt to the Adipose Tissue in Mice. Cell Host Microbe. 2016;19:837–848. doi: 10.1016/j.chom.2016.05.002. [DOI] [PMC free article] [PubMed] [Google Scholar]
- Valitutti S, Muller S, Cella M, Padovan E, Lanzavecchia A. Serial triggering of many T-cell receptors by a few peptide-MHC complexes. Nature. 1995;375:148–151. doi: 10.1038/375148a0. [DOI] [PubMed] [Google Scholar]
- van der Windt GJ, Everts B, Chang CH, Curtis JD, Freitas TC, Amiel E, Pearce EJ, Pearce EL. Mitochondrial respiratory capacity is a critical regulator of CD8+ T cell memory development. Immunity. 2012;36:68–78. doi: 10.1016/j.immuni.2011.12.007. [DOI] [PMC free article] [PubMed] [Google Scholar]
- van der Windt GJ, O’Sullivan D, Everts B, Huang SC, Buck MD, Curtis JD, Chang CH, Smith AM, Ai T, Faubert B, et al. CD8 memory T cells have a bioenergetic advantage that underlies their rapid recall ability. Proc Natl Acad Sci U S A. 2013;110:14336–14341. doi: 10.1073/pnas.1221740110. [DOI] [PMC free article] [PubMed] [Google Scholar]
- Viboud GI, Bliska JB. Yersinia outer proteins: role in modulation of host cell signaling responses and pathogenesis. Annu Rev Microbiol. 2005;59:69–89. doi: 10.1146/annurev.micro.59.030804.121320. [DOI] [PubMed] [Google Scholar]
- Wright DE, Wagers AJ, Gulati AP, Johnson FL, Weissman IL. Physiological migration of hematopoietic stem and progenitor cells. Science. 2001;294:1933–1936. doi: 10.1126/science.1064081. [DOI] [PubMed] [Google Scholar]
- Yu G, Wang LG, Han Y, He QY. clusterProfiler: an R package for comparing biological themes among gene clusters. OMICS. 2012;16:284–287. doi: 10.1089/omi.2011.0118. [DOI] [PMC free article] [PubMed] [Google Scholar]
- Zhang LJ, Guerrero-Juarez CF, Hata T, Bapat SP, Ramos R, Plikus MV, Gallo RL. Innate immunity. Dermal adipocytes protect against invasive Staphylococcus aureus skin infection. Science. 2015;347:67–71. doi: 10.1126/science.1260972. [DOI] [PMC free article] [PubMed] [Google Scholar]
- Zhang Y, Mena P, Romanov G, Bliska JB. Effector CD8+ T cells are generated in response to an immunodominant epitope in type III effector YopE during primary Yersinia pseudotuberculosis infection. Infect Immun. 2014;82:3033–3044. doi: 10.1128/IAI.01687-14. [DOI] [PMC free article] [PubMed] [Google Scholar]
- Zhou R, Yazdi AS, Menu P, Tschopp J. A role for mitochondria in NLRP3 inflammasome activation. Nature. 2011;469:221–225. doi: 10.1038/nature09663. [DOI] [PubMed] [Google Scholar]
- Zuniga LA, Shen WJ, Joyce-Shaikh B, Pyatnova EA, Richards AG, Thom C, Andrade SM, Cua DJ, Kraemer FB, Butcher EC. IL-17 regulates adipogenesis, glucose homeostasis, and obesity. J Immunol. 185:6947–6959. doi: 10.4049/jimmunol.1001269. [DOI] [PMC free article] [PubMed] [Google Scholar]
Associated Data
This section collects any data citations, data availability statements, or supplementary materials included in this article.