Abstract
Polymodal K2P (KCNK) thermo- and mechanosensitive TREK1 potassium channels, generate ‘leak’ currents that regulate neuronal excitability, respond to lipids, temperature, and mechanical stretch, and influence pain, temperature perception, and anesthetic responses1–3. These dimeric voltage-gated ion channel (VGIC) superfamily members have a unique topology comprising two pore forming regions per subunit4–6. Contrasting other potassium channels, K2Ps use a selectivity filter ‘C-type’ gate7–10 as the principal gating site. Despite recent advances3,11,12, K2Ps suffer from a poor pharmacologic profile limiting mechanistic and biological studies. Here, we describe a new small molecule TREK activator class that directly stimulates the C-type gate by acting as molecular wedges that restrict interdomain interface movement behind the selectivity filter. Structures of K2P2.1(TREK-1) alone with two selective K2P2.1(TREK-1) and K2P10.1(TREK-2) activators, an N-aryl-sulfonamide, ML335, and a thiophene-carboxamide, ML402, define a cryptic binding pocket unlike other ion channel small molecule binding sites and, together with functional studies, identify a cation-π interaction that controls selectivity. Together, our data unveil a previously unknown, druggable K2P site that stabilizes the C-type gate ‘leak mode’ and provide direct evidence for K2P selectivity filter gating.
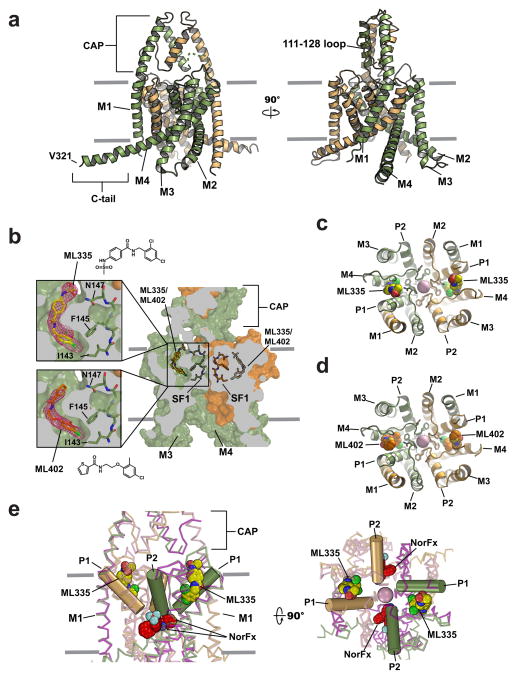
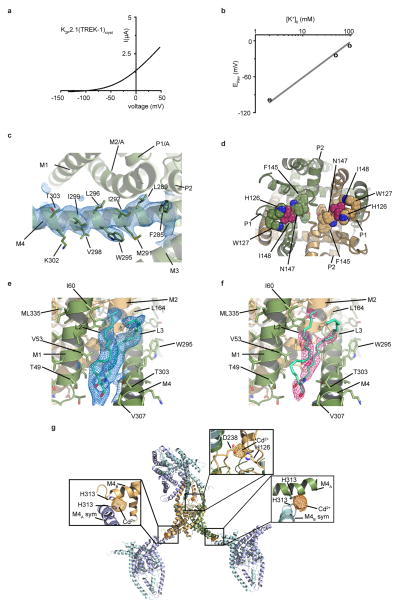
K2P2.1(TREK-1)cryst (Extended Data Fig. 1a,b) crystallized alone and with activators, ML335 (N- [(2,4-dichlorophenyl)methyl]-4-(methanesulfonamido) benzamide) and ML402 (N- [2- (4-chloro-2-methylphenoxy)ethyl]thiophene-2-carboxamide), and diffracted X-rays to 3.1 Å, 3.0 Å and 2.8 Å, respectively (Extended Data Table 1) enabling structure determination (Extended Data Fig. 1c). K2P2.1(TREK-1)cryst has a domain-swapped M1 helix, extracellular CAP domain, and an unimpeded aqueous path between the intracellular side and selectivity filter, similar to prior TREK subfamily structures6,13–15 (Fig. 1a). Features absent in prior K2P structures include a C-terminal tail (C-tail) five helical turns longer than in K2P10.1(TREK-2)6, Trp295-Val321 (Fig. 1a, Extended Data Fig. 1c), the 111-128 loop connecting the P1 pore helix and CAP bearing the extracellular pH sensor, His12616,17 (Fig. 1a, Extended Data Fig. 1d), and a set of bound lipids (Extended Data Fig. 1e,f).
Figure 1. K2P2.1(TREK-1) structures.
a, K2P2.1(TREK-1)cryst cartoon (smudge and light orange) smudge subunit extracellular cap domain (CAP), M1–M4 transmembrane helices, C-tail, and V321 are labeled. b, K2P modulator pocket cutaway. Cutouts display ML335 and ML402 Fo-Fc densities (3.0σ). ML335, ML402, and Selectivity Filter 1 (SF1) are sticks. c, and d, Extracellular views excluding the CAP domain of c, ML335 and d, ML402 binding sites. ML335 and ML402 are space filling. Selectivity filter sidechains are sticks. e, Wire representation comparing K2P2.1(TREK-1):ML335 (smudge and light orange) and K2P10.1(TREK-2):norfluoxetine6 (light pink and magenta) binding sites. K2P2.1(TREK-1) P1 and P2 are cylinders. ML335 (yellow) and norfluoxetine (NorFx) (red) are space filling. In all panels select residues and channel elements are indicated, and where present, grey lines indicate the membrane.
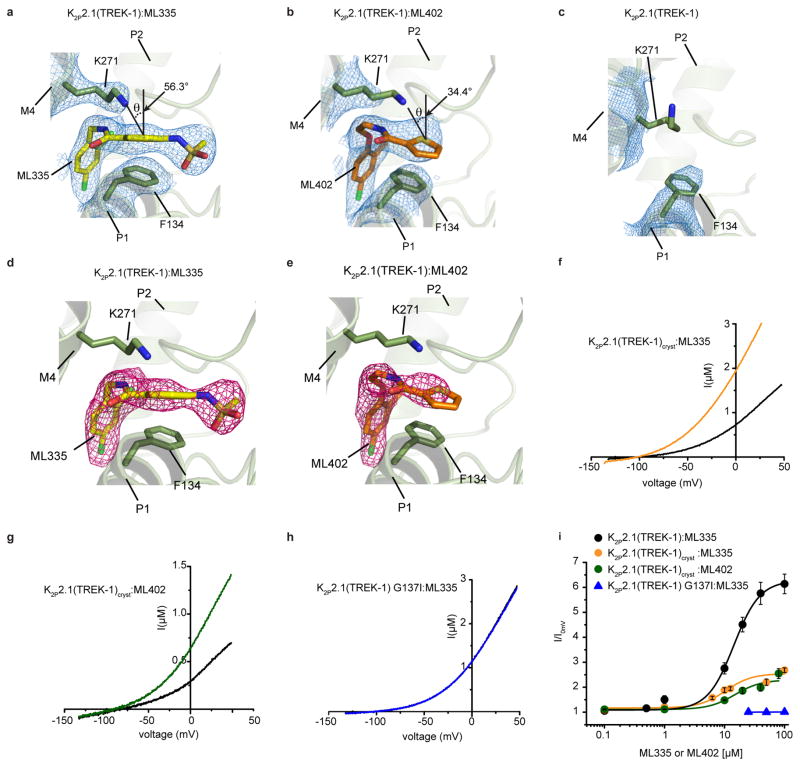
Structures of the ML335 and ML402 complexes revealed unambiguous density for two activators per channel (Fig. 1b, Extended Data Fig. 2a–e) occupying an L-shaped pocket behind the selectivity filter formed by the P1 pore helix and M4 transmembrane helix intrasubunit interface (Fig. 1c,d). Importantly, contrasting the activated mutant, K2P2.1(TREK-1) G137I7, K2P2.1(TREK-1)cryst responds to both ML335 and ML402 (Extended Data Fig. 2f–i). The ML335/ML402 binding pocket differs from the TREK antagonist norfluoxetine6 binding site (Fig. 1e) and is dissimilar to other VGIC superfamily pore domain antagonist sites18,19 (Extended Data Fig. 3). Thus, the ML335/ML402 site, dubbed the ‘K2P modulator pocket’, establishes a novel point for VGIC superfamily small molecule modulation.
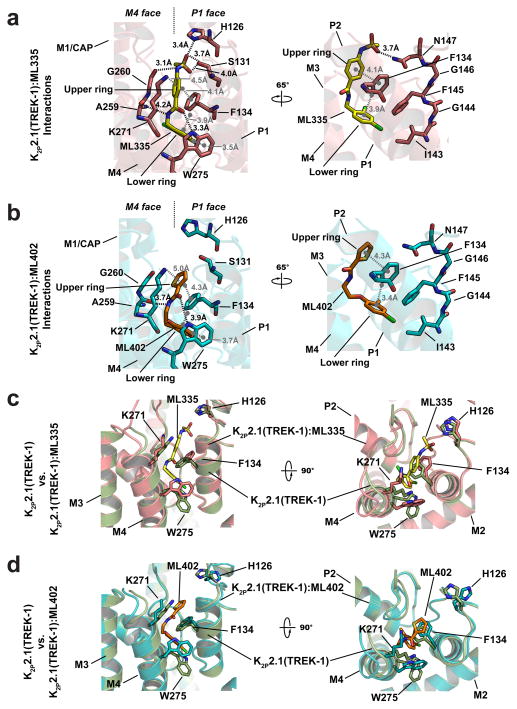
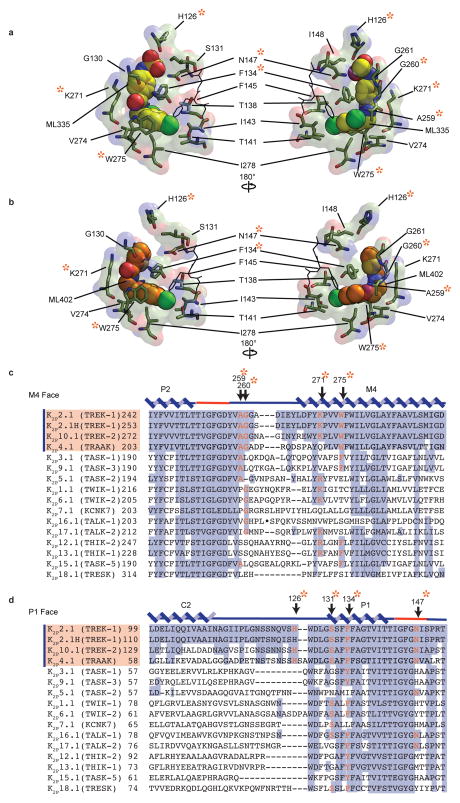
The K2P modulator pocket comprises a ‘P1 face’ and an ‘M4 face’ that form a common set of hydrogen bonds, π-π, and cation-π20 interactions with ML335 and ML402 (Fig. 2a,b Extended Data Fig. 4a,b). Both compounds adopt an L-shaped conformation enabling their ‘upper ring’ (ML335 N-aryl sulfonamide and ML402 thiophene) and ‘lower ring’ (ML335 dicholoro-benzyl and ML402 aryl ether) to engage the P1 helix residue Phe134 through face-face and edge-face interactions, respectively (Fig. 2a,b). On the M4 face, the upper and lower rings make a cation-π interaction with Lys271 and edge-face interaction with Trp275, respectively (Fig. 2, Extended Data Fig 2a,b, and 4a,b). The amide groups of both compounds also make hydrogen bonds with the Ala259 carbonyl on the loop connecting the second selectivity filter. The ML335 sulfonamide forms additional interactions with the Gly260 carbonyl on the same loop, the P1 face Ser131 hydroxyl, the 111-128 loop His126 imidazole nitrogen, and Asn147 on the first selectivity filter (Fig. 2a, Extended Data Fig 4a).
Figure 2. K2P2.1(TREK-1) activator interactions.
Cartoon diagram of a, K2P2.1(TREK-1):ML335 and b, K2P2.1(TREK-1):ML402 interactions. Electrostatic and hydrogen bond interactions are black. Cation-π and π-π interactions are grey. c, and d, comparison of K2P2.1(TREK-1) (smudge) with c, K2P2.1(TREK-1):ML335 (deep salmon) and d, K2P2.1(TREK-1):ML402 (cyan).
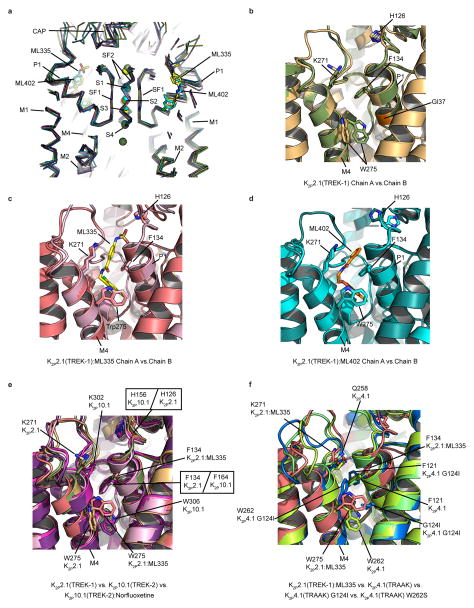
The K2P modulator pocket constitutes a cryptic binding site requiring conformational changes centered around Phe134, Lys271, and Trp275 (Fig. 2c,d, Extended Data Video V1). Without activators, Phe134 and the M4 helix N-terminal end occlude the pocket. These elements move towards the selectivity filter and away from the P1 helix, respectively, to allow access. Lys271 and Trp275 are mobile in the unliganded structure (Extended Data Fig. 5a and 6b), change conformation to form modulator interactions, and together with Phe134 have reduced bound state mobility (Extended Data Fig. 5a–c, and Table 2a). Hence, both compounds act as wedges driven into the selectivity filter supporting structure, a mode reminiscent of other channel modulators21,22. Notably, the K2P modulator pocket includes GOF mutation sites, Gly137 and Trp275, affecting all TREK subfamily members7,8,15,23 (Extended Data Fig. 6b). Together, these observations indicate that the P1/M4 interface is a hub for conformational changes causing TREK subfamily activation and that P1/M4 interface stabilization is central to ML335 and ML402 action.
K2P activator pocket residues that contact the compounds are identical among TREK subfamily members, except for the Lys271 cation-π interaction, and diverge in other K2P subtypes (Extended Data Fig. 4c,d). Comparison with K2P10.1(TREK-2)6 and K2P4.1(TRAAK)4,13–15 (Extended Data Fig. 6a, Table 2b) reveals no selectivity filter conformation differences. This structural similarity supports the idea that ML335 and ML402 influence selectivity filter dynamics, similar to inferences from structural studies of P1/M4 interface GOF mutants15. There are notable differences in the first two M4 helical turns of the K2P modulator pocket and the conformations of the Phe134 and Trp275 equivalent positions among TREK subfamily structures (Extended Data Fig. 6b–f). Given the varied conformations of these residues in the absence of activators and mobility changes between the unliganded and liganded structures (Extended Data Fig. 5), the main action of the activator appears to be to limit the conformations sampled by P1/M4 interface elements.
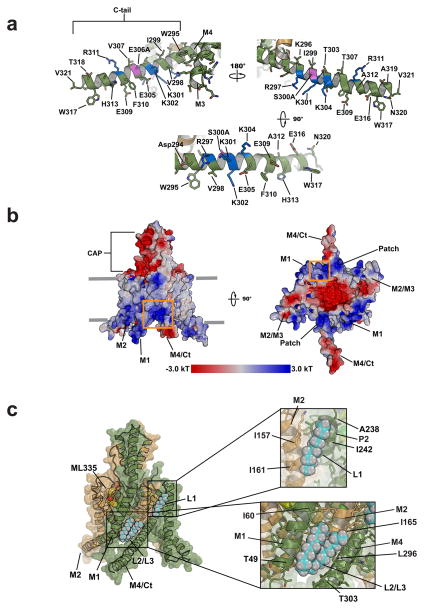
The K2P2.1(TREK-1) C-tail senses phospholipid24,25, phosphorylation26,27, temperature7,28, and pressure27 gating commands and forms a continuous helix with M4 (Fig. 3a). Prior TREK subfamily structures uncovered varied M4 conformations spanning extremes termed ‘up’ and ‘down’4,6,13–15. Proposals that the ‘up’14, ‘down’15, or both conformations are active 6,23, have been advanced. In all K2P2.1(TREK-1) structures, M4 is ‘up’ (Fig. 1a) and the selectivity filter sites S1–S4 are occupied by potassium ions (Extended Data Fig. 6a). Because both C-tails make lattice contacts (Extended Data Fig. 1g) that can influence M413,15, the K2P2.1(TREK-1) structures cannot directly address the controversy regarding M4 status. Nevertheless, the activator-bound selectivity filter is compatible with the ‘up’ M4 conformation.
Figure 3. K2P2.1(TREK-1) C-tail and lipid binding sites.
a, K2P2.1(TREK-1) C-tail. Positively charged residues are blue. S300A and E306A, a site having slight distortion from helical geometry, are magenta. b, K2P2.1(TREK-1) Electrostatic surface potential. Orange box highlights M1/M2/M4 junction. Cytoplasmic view (left) indicates C-tail positively charged patch. c, Lipids L1, L2, and L3 (cyan and white) shown as space filling. ML335 (yellow) is indicated. Insets show lipid binding pocket details.
The C-tail has two faces, an electropositive patch comprising four residues implicated in PIP2 modulation (Arg297, Lys301, Lys302, and Lys304)24,25, and a face housing the intracellular proton sensor site, Glu30629, and inhibitory phosphorylation site, Ser30026 (Fig. 3a,b). The channel electrostatic profile shows a second positively charged region at the M1/M2/M4 junction (Fig. 3b) suggesting that the resultant interhelical groove may be a phospholipid binding site.
All three K2P2.1(TREK-1) structures revealed tubular densities at locations different from previous K2P lipid binding sites4,6,14,15, denoted as lipids L1, L2, and L3 (Fig. 3c, Extended Data Fig. 1e,f). L1 resides at the M2/P2 intersubunit junction (Fig. 3c). L2 and L3 are part of a single phospholipid (Extended Data Fig. 1e,f) and sit in the groove formed by the positively charged M1/M2/M4 intersubunit junction (Fig. 3b and c, Extended Data Fig. 1e,f). The L2/L3 site seems to be a prime point for modulatory lipids, as the positively charged residues that affect PIP2 responses24,25 are on the helical face opposite to L2/L3 and M4 conformational changes could affect how these residues interact with regulatory lipid headgroups.
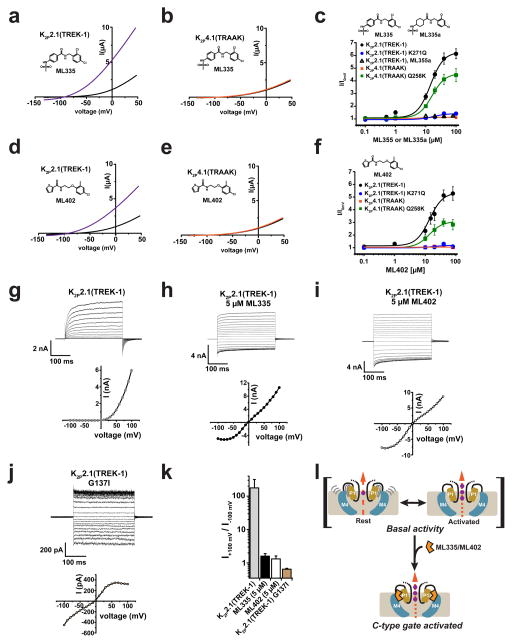
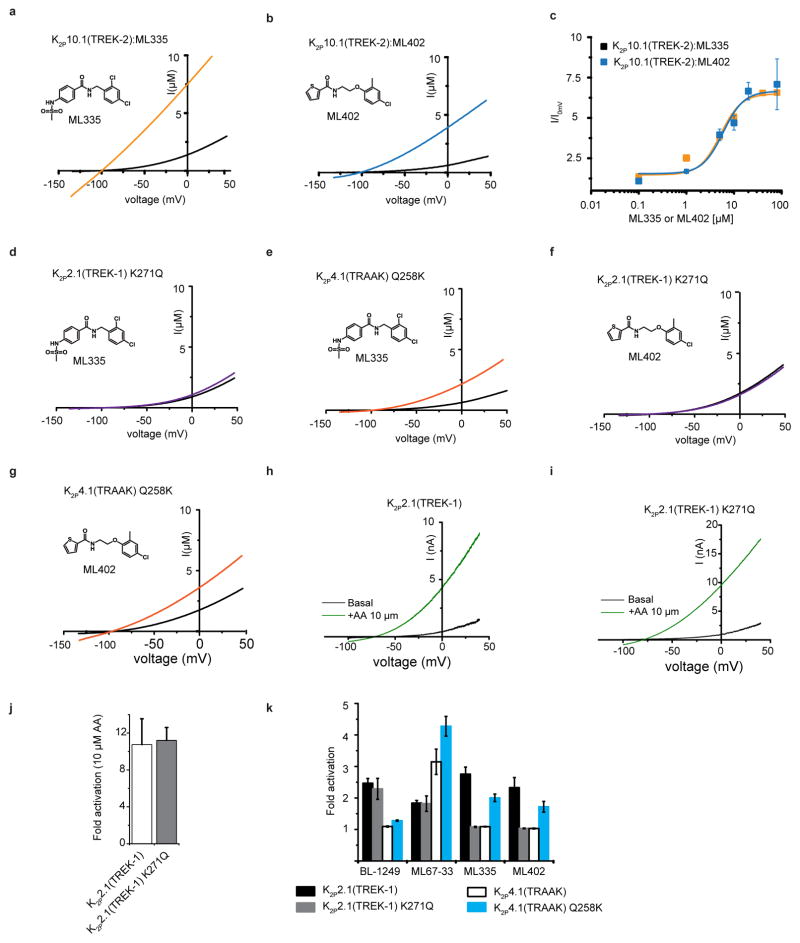
Xenopus oocyte two electrode voltage-clamp measurements show that ML335 and ML402 activate K2P2.1(TREK-1) and K2P10.1(TREK-2) but not K2P4.1(TRAAK) (14.3 ± 2.7 μM, K2P2.1(TREK-1):ML335; 13.7± 7.0 μM, K2P2.1(TREK-1):ML402; 5.2 ± 0.5 μM, K2P10.1(TREK-2):ML335; and 5.9 ± 1.6 μM, K2P10.1(TREK-2):ML402) (Fig. 4a–f, Extended Data Fig. 7a–c). The K2P modulator pocket has a single difference among TREK subfamily members at the cation-π interaction position, K2P2.1(TREK-1) Lys271 (Extended Data Fig. 4c), which is also a lysine in K2P10.1(TREK-2) but a glutamine in K2P4.1(TRAAK). Hence, we asked whether this residue controlled the selective actions of ML335 and ML402. Swapping the Lys271 equivalent between K2P2.1(TREK-1) and K2P4.1(TRAAK) resulted in a clear phenotype reversal for ML335 and M402 activation (Fig. 4c and f, Extended Data Fig. 7d–g). K2P2.1(TREK-1) K271Q was insensitive to ML335 and ML402, whereas K2P4.1(TRAAK) Q258K responded to both with a similar EC50 to K2P2.1(TREK-1) (14.3 ± 2.7 μM, K2P2.1(TREK-1):ML335; 16.2 ± 3.0 μM, K2P4.1(TRAAK) Q258K:ML335; 13.7± 7.0 μM, K2P2.1(TREK-1):ML402; 13.6 ± 1.5 μM, K2P4.1(TRAAK) Q258K:ML402) but with a lower magnitude response than K2P2.1(TREK-1). Notably, the effects of TREK subfamily activators arachidonic acid (AA)27,30, BL-124931,32, and ML67-3311 were unchanged (Extended Data Fig. 7h–k). To probe the cation-π interaction further, we synthesized a ML335 congener, ML335a, in which the aromatic upper ring was replaced with an aliphatic ring (Fig. 4c). ML335a had no effect on K2P2.1(TREK-1) (Fig. 4c), supporting the importance of the cation-π interaction. Together, these data identify the Lys271 cation-π interaction as the origin of ML335/ML402 subtype selectivity and establish that this interaction is essential for activation.
Figure 4. K2P2.1(TREK-1) activator function.
Exemplar current traces for a, K2P2.1(TREK-1) (black) with 20 μM ML335 (purple). b, K2P4.1(TRAAK) (black) with 50 μM ML335 (orange). c, ML335 dose response curves for K2P2.1(TREK-1) (black), EC50=14.3 ± 2.7 μM (n≥5); K2P2.1(TREK-1) K271Q (blue filled circles); K2P4.1(TRAAK) (orange); K2P4.1(TRAAK) Q258K (green) EC50=16.2 ± 3.0 μM (n≥4); and ML335a: K2P2.1(TREK-1) (black open triangles). Exemplar current traces for d, K2P2.1(TREK-1) (black) with 20 μM ML402 (purple). e, K2P4.1(TRAAK) (black) with 50 μM ML335 (orange). f, ML402 dose response curves for K2P2.1(TREK-1) (black), EC50=13.7 ± 7.0 μM (n≥3); K2P2.1(TREK-1) K271Q (blue); K2P2.1(TREK-1) (blue); K2P4.1(TRAAK) (orange); K2P4.1(TRAAK) Q258K (green) EC50=13.6 ± 1.5 μM (n≥3). g–j, Exemplar current traces and voltage-current relationships for indicated K2Ps in HEK293 inside-out patches in 150 mM K+[out]/150 mM Rb+[in] for g, K2P2.1(TREK-1), h, K2P2.1(TREK-1) with 5 μM ML335, I, K2P2.1(TREK-1) with 5 μM ML402, and j, K2P2.1(TREK-1) G137I. k, Rectification coefficients (I+100mV/I–100mV) from recordings (n≥3) made in ‘g–j’. l, TREK activation model. Grey lines indicate mobile P1 (tan) and M4 (blue). C-type activators (orange), stabilize the selectivity filter and channel ‘leak mode’. Potassium ions are purple. Gap in arrows indicates current flow intensity. Membrane is grey.
The principal K2P channel gating site is the selectivity filter ‘C-type’ gate7–10. This gate is highly sensitive to permeant ions8,16,17 and is thought to function via ‘flux gating’ whereby outward, but not inward, ion flow stabilizes the active conformation9. Physiological K2P2.1(TREK-1) activators, such as AA, PIP2, and intracellular acidification, shift the channel from outward rectifier mode to an ohmic ‘leak mode’9. Because K2P modulator pocket contains architectural elements that support the selectivity and GOF mutant sites that activate the C-type gate7,8,15, we asked whether P1/M4 interface structural changes caused by ML335, ML402, or GOF mutation impact C-type gate function.
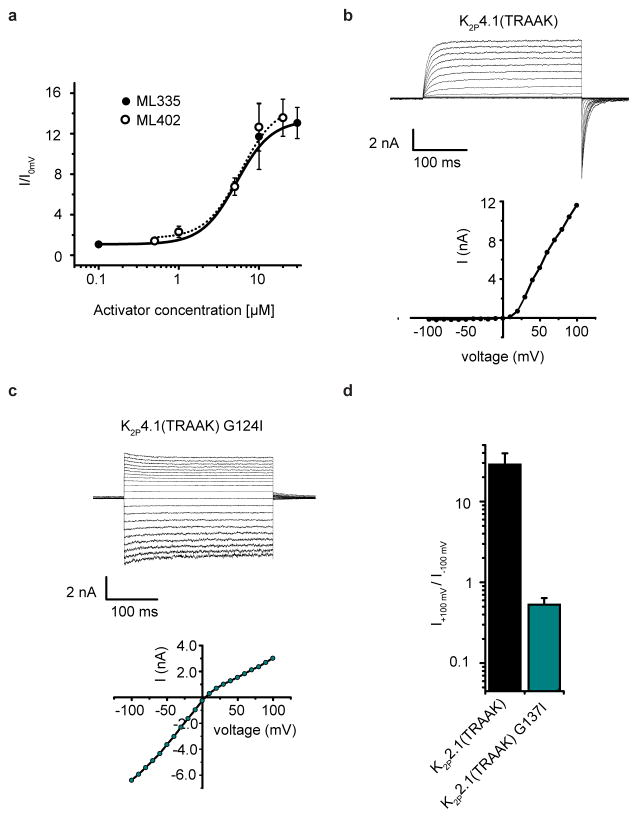
Measurement of K2P2.1(TREK-1) in inside-out patches under conditions that potentiate flux-dependent C-type gate activation (150 mM K+[out] versus 150 mM Rb+[in])9 showed the expected outward rectification (Fig. 4g and k). ML335 and ML402 activate K2P2.1(TREK-1) in HEK293 cells similar to their effects in Xenopus oocytes (5.2 ± 0.8 μM and 5.9 ± 1.6 μM for ML335 and ML402, respectively (n≥3)) (Fig. 4g–i, Extended Data Fig. 8a). Compound application essentially eliminated flux-dependent outward rectification (Fig. 4h,i, and k) yielding a rectification coefficient (I+100mV/I-100mV) of ~1. This outcome matches physiological activator effects9 and establishes that ML335 and ML402 activate the C-type gate. The K2P4.1(TRAAK) GOF mutation G124I reshapes the K2P modulator pocket through structural consequences similar to ML335/ML402, namely an outward M4 movement and repositioning of the K2P2.1(TREK-1) Phe134 equivalent residue15 (Extended Data Fig. 6f). K2P2.1(TREK-1) G137I and K2P4.1(TRAAK) G124I7,15 caused a similar mode shift and rectification coefficient change to ML335 and ML402 (Fig. 4j and k, Extended Data Fig. 8b–d) establishing that K2P modulator pocket manipulation by ML335/ML402 binding or mutation directly activates the selectivity filter C-type gate. Together with the compound binding induced mobility reduction of the P1/M4 interface (Extended Data Fig. 5) and lack of K2P selectivity filter structural differences (Extended Data Fig. 6a), our findings strongly support the idea that direct C-type gate activators stimulate function by reducing the dynamics of the selectivity filter and surrounding structure.
The roles of TREK channels in ischemia, pain, analgesia, and anesthetic responses1 suggests that TREK activators could provide new avenues for neuroprotection and pain control. Many natural TREK regulators are thought to act on the C-tail7,24–29 and influence the C-type gate through M4 6–8,15,23 whose movement is targeted by the antagonist norfluoextine6,23. In this regard, ML335 and ML402 represent a new K2P modulator class, as they function by binding directly to a pocket at the heart of the channel active site, the C-type gate, rather than influencing the C-tail or M4.
The K2P modulator pocket defines the first VGIC superfamily pore domain small molecule activator site and differs from antagonist sites occupying lateral fenestrations below the selectivity filter6,18 (Fig. 1e, Extended Data Fig. 3a). Voltage-gated calcium channel antagonists, amlodipine and nifedipine19, act at an interface similar to the K2P modulator pocket, but at a pore domain outer rim site normally occupied by lipids19 (Extended Data Fig. 3b). Notably, all of these small molecule sites are found at interfaces that are thought to move during gating6,18,19, highlighting the potential of channel intersubunit interfaces as small molecule control sites.
Our findings provide a structural basis for understanding K2P C-type gate activation. The K2P modulator pocket in unliganded K2P2.1(TREK-1) displays mobility in key elements that is reduced upon activator engagement (Fig. 4l, Extended Data Figs. 5, 6b–d, and Video V1). Notably, the K2P modulator pocket M4 helix N-terminal end, an important site for channel activation8 and conduit for transmitting C-tail sensor domain cues to the C-type gate7,8, adopts a similar position in the ML335 and ML402 K2P2.1(TREK-1) complexes and in K2P4.1(TRAAK) G124I (Extended Data Fig. 6f). As the remainder of M4 is ‘up’ for the K2P2.1(TREK-1) activator complexes, but ‘down’ for K2P4.1(TRAAK) G124I, the data support the idea that M4 position is not the sole determinant of channel state23. The importance of changes in P1/M4 interface dynamics explain how M4 can affect channel function and allow the ‘up’ or ‘down’ conformations to activate the channel23, as both states could limit the mobility of the P1/M4 interface. Such plasticity may be important for enabling TREK subfamily polymodal modulation. Our findings indicate that under basal conditions, K2P2.1(TREK-1) equilibrates between a resting state having a mobile P1/M4 interface and an activated state in which the mobility of this site is limited. ML335 and ML402 directly stabilize the C-type gate by acting like molecular wedges that reduce P1/M4 interface dynamics (Fig. 4l, Extended Data Fig. 5 and Table 2a) and cause the filter to enter the ‘leak mode’ (Fig. 4h, i), bypassing modulation mechanisms that may involve other channel regions. The K2P modulator pocket properties revealed by our studies raise the possibility that natural processes or native signaling molecules may also target this site.
Opening the cryptic K2P modulator pocket requires small movements of few residues, similar to soluble protein cryptic modulator sites33. K2P modulator pocket diversity (Extended Data Fig. 4c,d), the P1/M4 interface susceptibility to GOF mutations7,8, and demonstration that a single residue therein can define modulator selectivity suggests that this site may be amenable for K2P subtype-selective pharmacology development. As the fundamental pocket architecture is conserved in the VGIC superfamily, similar modulatory mechanisms may exist in other superfamily members where selectivity filter based gating is central. Thus, this site should provide a fertile target for channel modulator discovery.
Methods
No statistical methods were used to predetermine sample size. No randomization or blinding was used.
Construct screening
A set of mutants and deletion constructs of mouse K2P2.1(TREK-1)1 bearing a C-terminal TEV protease cleavage site and GFP were expressed from a pcDNA3.1 in HEK293 cells and screened for expression level and peak quality using Fluorescence-detection Size Exclusion Chromatography (FSEC)39–41. These efforts identified a construct, hereafter called K2P2.1(TREK-1)cryst, encompassing residues 21-322 and bearing the following mutations: K84R, Q85E, T86K, I88L, A89R, Q90A, A92P, N95S, S96D, T97Q, N119A, S300A, E306A. The first nine mutations are located on the surface of the CAP domain and greatly increased expression. N119A targets a putative glycosylation site. S300A and E306A are previously studied mutants7 that improved the biochemical properties of the purified protein. The reduced response of K2P2.1 (TREK-1)cryst to ML335 and ML402 likely results from partial activation of the channel in a cellular context due to the incorporation of the E306A mutation7,29 and is compatible with the model proposed in Fig. 4l in which basal activity is increased by E306A but can nevertheless be shifted to the C-type gate activated state by activator binding and C-type gate stabilization.
Protein Expression
K2P2.1(TREK-1)cryst bearing a C-terminal green fluorescent protein (GFP) and His10 tag was expressed from a previously described P. pastoris pPICZ vector4. Plasmids were linearized with PmeI and transformed into P. pastoris SMD1163H by electroporation. Multi-integration recombinants were selected by plating transformants onto Yeast Extract Peptone Dextrose Sorbitol (YPDS) plates having increasing concentrations of zeocin (1–4 mg ml−1). Expression levels of individual transformants were evaluated by FSEC as previously described15.
Large-scale expression was carried out in a 7L Bioreactor (Labfors5, Infors HT). First, a 250 ml starting culture was grown in buffered minimal medium (2x YNB, 1% Glycerol, 0.4 mg L−1 biotin, 100 mM potassium phosphate, pH 6.0) in shaker flasks for two days at 29°C. Cells were pelleted by centrifugation (3000 x g, 10’, 20°C) and used to inoculate the bioreactor. Cells were grown in minimal medium (4% glycerol, 0.93 g L−1 CaSO4.2H2O, 18.2 g L−1 K2SO4, 14.9 g L−1 MgSO4.7H2O, 9 g L−1 (NH4)2SO4, 25g L−1 Na+ hexametaphosphate, 4.25ml L−1 PTM1 trace metals stock solution prepared accordingly to standard Invitrogen protocol) until the glycerol in the fermenter was completely metabolized marked by a spike in pO2 (~24 hours). Fed-batch phase was then initiated by adding a solution of 50% glycerol and 12ml L−1 of trace metals at 15%–30% of full pump speed until the wet cell mass reached ~250 g L−1 (~24 hours). pO2 was measured continuously and kept at a minimum of 30%. Feed rate was automatically regulated accordingly. pH was maintained at 5.0 by the addition of a 30% ammonium hydroxide solution.
After the fed-batch phase was completed, cells were then starved to deplete glycerol by stopping the feeder pump until a pO2 spike appeared. After starvation, the temperature was set to 27°C, and the induction was initiated with addition of methanol in three steps: (1) Initially, the methanol concentration was kept at 0.1% for 2 h in order to adapt the cells. (2) Methanol concentration was then increased to 0.3% for 3h, and (3) methanol was then increased to 0.5% and expression continued for ~48–60 hours. Cells were then pelleted by centrifugation (6000 x g,1h, 4°C), snap frozen in liquid nitrogen, and stored at −80°C.
Protein Purification
In a typical preparation, 50 g of cells were broken by cryo-milling (Retsch model MM400) in liquid nitrogen (5 x 3 min, 25 Hz). All subsequent purification was carried out at 4° C. Cell powder was added at a ratio of 1g cell powder:3ml lysis buffer (200 mM KCl, 21 mM OGNG [Octyl Glucose Neopentyl Glycol, Anatrace], 30 mM HTG [n-heptyl-β-D-thioglucopyranoside, Anatrace], 0.1% CHS, 0.1 mg mL−1 DNAse 1 mM PMSF, 100 mM Tris-Cl, pH 8.2). Membranes were extracted for 3 hours with gentle stirring followed by centrifugation at (100000 x g, 45’ at 4°C).
Solubilized proteins were purified by affinity chromatography using batch purification. Anti-GFP nanobodies were conjugated with CNBr Sepharose beads (GE Healthcare, #17-0430-02) according to reference 42. The resin was added to the cleared supernatant at a ratio of 1 ml of resin per 10 g of cell powder and incubated at 4°C for 3h with gentle shaking. Resin was collected into a column and washed with 10 column volumes (CV) of buffer A (200 mM KCl, 10 mM OGNG, 15 mM HTG, 0.018% CHS, 50 mM Tris-Cl, pH8.0) followed by a second wash step using 10 CV of buffer B containing (200 mM KCl, 5 mM OGNG, 15 mM HTG, 0.018% CHS, 50 mM Tris-Cl, pH8.0). The resin was then washed with additional 10 CV of buffer C (200 mM KCl, 3.85 mM OGNG, 15 mM HTG, 0.0156% CHS, 50 mM Tris-Cl, pH 8.0). On column cleavage of the affinity tag was achieved by incubating the resin with buffer C supplemented to contain 350 mM KCl, 1 mM EDTA, and 3C protease43 at ratio of 50:1 resin volume:protease volume. The resin was incubated overnight at 4°C. Cleaved sample was collected and the resin washed with 2 CV of SEC buffer (200 mM KCl, 2.1 mM OGNG, 15 mM HTG, 0.012% CHS, 20 mM Tris-Cl, pH 8.0). Purified sample was concentrated and applied to a Superdex 200 column equilibrated in SEC buffer.
Crystallization and Refinement
Purified K2P2.1(TREK-1)cryst was concentrated to 6 mg ml−1 by centrifugation (Amicon® Ultra-15, 50 kDa molecular mass cutoff; Millipore) and crystallized by hanging-drop vapor diffusion at 4°C using a mixture of 0.2 μl of protein and 0.1 μl of precipitant over 100 μl of reservoir containing 20–25% PEG400, 200 mM KCl, 100 mM HEPES pH 8.0, 1 mM CdCl2. Crystals appeared in 12 hours and grew to full size (200μm-300μm) in about a week. Crystals were cryoprotected with buffer D (200 mM KCl, 0.2% OGNG, 15 mM HTG, 0.02% CHS, 100 mM HEPES pH 8.0,1 mM CdCl2) with 5% step increase of PEG400 up to a final concentration of 38% and flash frozen in liquid nitrogen.
K2P2.1(TREK-1)cryst ML335 and ML402 complex crystals grew in the same conditions as K2P2.1(TREK-1)cryst, but the protein was incubated for at least 1h with 2.5mM of activator before setting the crystal plates. ML335 and ML402 are insoluble in aqueous solutions, so they were dissolved in 100% DMSO at a concentration of 500 mM. Then each compound was diluted 1:100 in SEC buffer to 5 mM concentration, giving a milky solution. This solution was mixed 1:1 to K2P2.1(TREK-1)cryst previously concentrated to 12 mg ml−1. The K2P2.1(TREK-1)crys /ML402 mixture resulted in a clear solution, while the mixture with ML335 was slightly milky. The samples were briefly centrifuged in a table top centrifuge (10.000 x g) to remove any insoluble material before setting the crystal plates.
Datasets for K2P2.1(TREK-1), K2P2.1(TREK-1):ML335, and K2P2.1(TREK-1):ML402 were collected at 100 K using synchrotron radiation at ALS Beamline 8.3.1 Berkeley, CA and APS GM/CAT beamline 23-IDB/D Chicago, IL using wavelengths of 1.1159Å and 1.0332Å, respectively, processed with XDS44, scaled and merged with Aimless45. Final resolution cutoff was 3.1Å and 3.0 Å and 2.8 Å for K2P2.1(TREK-1)cryst, K2P2.1(TREK-1)cryst:ML335, and K2P2.1(TREK-1)cryst:ML402, respectively, using the CC1/2 criterion46,47. Structures were solved by molecular replacement using the K2P4.1(TRAAK) G124I structure (PDB 4RUE)15 as search model. Several cycles of manual rebuilding, using COOT48, and refinement using REFMAC549 and PHENIX50 were carried out to improve the electron density map. Two-fold local medium NCS restraints were employed during refinement for residues 28-103, 110-158 and 194-260.
K2P2.1(TREK-1), K2P2.1(TREK-1):ML335, and K2P2.1(TREK-1):ML402 structures have, respectively, 95.2%/0.4%, 92.0%/0.5% and 95.7%/0.4% residues in favored regions/outliers of the Ramachandran plot as assessed by Molprobity51.
Electrophysiology
Patch-clamp electrophysiology
mouse K2P2.1(TREK-1), human K2P4.1(TRAAK), and mutants were expressed from a previously described pIRES2-EGFP vector8,11 in HEK 293T cells (ATTC). 70% confluent cells were transfected (in 35 mm diameter wells) with LipofectAMINE™ 2000 (Invitrogen, Carlsbad, CA, USA) for 6 hours, and plated onto coverslips coated with Matrigel (BD Biosciences, San Diego, CA, USA).
Effects of ML335, ML402, and arachidonic acid on K2P2.1(TREK-1) current at 0 mV were measured by whole cell patch-clamp experiments 24 hours after transfection. Acquisition and analysis were performed using pCLAMP9 and an Axopatch 200B amplifier (Molecular Devices, Sunnyvale, CA, USA). Pipette resistance ranged from 1 to 1.5 MΩ. Pipette solution contained the following, in millimolar: 145, KCl; 3, MgCl2; 5, EGTA and 20, HEPES (pH 7.2 with KOH). Bath solution contained the following, in millimolar: 145, NaCl; 5, KCl; 1, CaCl2; 3, MgCl2; 20, HEPES (pH 7.4 with NaOH). K2P2 (TREK-1) currents were elicited by a 1 second ramp from –100 to +50 mV from a –80 mV holding potential. After stabilization of the basal current, ML335 and ML402 were perfused at 200 ml hr−1 until potentiation was stably reached.
Voltage-dependent activation of K2P2.1(TREK-1) was recorded on excised patches in inside-out configuration (50kHz sampling) in the absence and presence of 5 μM ML335 or ML402. Pipette solution contained the following, in millimolar: 150 KCl; 3.6 CaCl2; 10 HEPES (pH 7.4 with KOH). Bath solution contained the following, in millimolar: 150 RbCl; 2 EGTA and 10 HEPES (pH 7.4 with RbOH), and was continuously perfused at 200 ml hr−1 during the experiment. TREK-1 currents were elicited by a voltage step protocol from −100mV to +100mV, from a –80 mV holding potential (or −10mV for K2P2.1(TREK-1) G137I and K2P4.1(TRAAK) G124I in presence of the compounds after exposing the patch to the compound for 30 s at −80 mV). Data were analyzed using Clampfit 9 and Origin 7.
Two Electrode Voltage Clamp Electrophysiology
Two electrode voltage clamp recordings were performed on defolliculated stage V–VI Xenopus laevis oocytes 24–48 h after microinjection with 0.15–5 ng cRNA. Oocytes were impaled with borosilicate recording microelectrodes (0.3–3.0MΩ resistance) backfilled with 3M KCl. Recording solution (96 mM NaCl, 2 mM KCl, 1.8 mM CaCl2, and 2.0 mM MgCl2, buffered with 5 mM HEPES, pH 7.4) was perfused at a rate of 3 ml min−1.
Currents were evoked from a −80mV holding potential followed by a 300 ms ramp from −150 mV to +50 mV. Data were acquired using a GeneClamp 500B amplifier (MDS Analytical Technologies) controlled by pClamp software (Molecular Devices), and digitized at 1 kHz using Digidata 1332A digitizer (MDS Analytical Technologies).
Dose-response experiments were carried by first preparing a DMSO stock solution of each activator at a concentration of 100 mM. Due to the low solubility of the compounds the highest tested concentrations in recording solution were 100 μM and 80 μM for ML335 and ML402, respectively (final concentration of DMSO was 0.2%). Other concentrations were prepared by serial dilutions of the 100 μM solution in recording buffer supplemented with 0.1% DMSO.
Xenopus oocytes were collected incompliance with ethical regulations specified by the UCSF Institutional Animal Care and Use Committee protocol AN129690.
Synthetic chemistry
Detailed descriptions of synthesis routes and characterization of ML335, ML335a, and ML402 are found in the supplementary material.
Extended Data
Extended Data Figure 1. K2P2.1(TREK-1)cryst function and structure.
a, Exemplar recording from K2P2.1(TREK-1)cryst expressed in Xenopus oocytes. Current was elicited from a −80mV holding potential followed by a 500 ms ramp from −150 mV to +50 mV. b, K2P2.1(TREK-1)cryst potassium selectivity recorded in Xenopus oocytes in K+/N-methyl-D-glucamine solutions (98.0 mM total) at pHo= 7.4. Data represent mean ± SEM (n= 4). Dashed gray line represents Nernst equation Erev=RT/F*log([K+]o/[K+]i), where R and F have their usual thermodynamic meanings, z is equal to 1, and T=23°C, assuming [K+]I = 108.6 mM34. c, Exemplar 2Fo-Fc electron density (1.0 σ) for the C-tail region of K2P2.1(TREK-1)cryst. Select residues and channel elements are indicated. d, Extracellular view of K2P2.1(TREK-1)cryst showing environment of His126 and Ile148 (raspberry). Select residues are labeled. The extracellular proton sensor His12616,17 is supported by a highly conserved residue, Trp127, and contacts a gain-of-function (GOF) mutant site, Ile1488, that interacts with the selectivity filter residue Asn147. This network of physical interactions indicates how changes at His12616,17 or Ile1488 could affect the C-type gate. e, and f, Exemplar L2/L3 lipid electron density for K2P2.1(TREK-1):ML335. e, 2Fo-Fc, (blue, 1.0 σ) and f, Fo-Fc, (hotpink, 3.0 σ). Chains are colored smudge and light orange. Channel elements and select residues are labeled. g, Crystal lattice packing for K2P2.1(TREK-1)cryst showing that the C-tail makes lattice interactions stabilized by a cadmium ion coordinated between His313 of adjacent symmetry mates. Asymmetric unit is colored smudge (chain A) and light orange (chain B). Symmetry related channels are shown in slate (chain A) and cyan (chain B). Insets show the anomalous difference map (5.0σ) and locations of Cd2+ ions and their ligands.
Extended Data Figure 2. K2P2.1(TREK-1)cryst modulator binding pocket densities and K2P2.1(TREK-1)cryst functional properties.
a–e, Exemplar electron densities for the modulator binding pockets. a–c, 2Fo-Fc densities (blue) for a, K2P2.1(TREK-1):ML335 (1.5 σ), b, K2P2.1(TREK-1):ML402 (1.0 σ), and c, K2P 2.1(TREK-1) (1.0 σ). Offset angle for the cation-π interactions for Lys271:ML335 and Lys271:ML402 is shown and adopts an oblique geometry common to cation-π interactions35,36. d, and e, Fo-Fc densities (hotpink, 3.0 σ) for d, K2P2.1(TREK-1):ML335 and e, K2P2.1(TREK-1):ML402. Final models are shown in all panels and select residues are shown and labeled. f–h, Exemplar current traces for f, K2P2.1 (TREK-1)cryst (black) with 40 μM ML335 (yellow orange), g, K2P2.1 (TREK-1)cryst (black) with 80 μM ML402 (green), and h, K2P2.1 (TREK-1) G137I (black) with 80 μM ML335 (blue). i, Dose response curves for K2P2.1(TREK-1):ML335 (black), EC50=14.3 ± 2.7 μM (n≥5); K2P2.1 (TREK-1)cryst:ML335, EC50 = 10.5 ± 2.7 μM (n≥3) (yellow orange) K2P2.1 (TREK-1)cryst:ML402, EC50 = 14.9 ± 1.6 μM (n≥3); and K2P2.1(TREK-1) G137I:ML335 (blue ).
Extended Data Figure 3. Comparison of K2P modulator and VGIC antagonist sites.
a, Superposition of the K2P2.1(TREK-1):ML335 complex (smudge and light orange) with the BacNaV ‘pore-only’ NaVMs structure18 (magenta and warm pink). Bromine site (Br) from labeled sodium channel antagonists is shown as a firebrick sphere. b, Superposition of the pore domains of the K2P2.1(TREK-1):ML335 complex (smudge and light orange) with the pore domain of the BacNaV CaVAb (5KMD) bound to the inhibitor amlodipine (AMLOD)19, a site normally occupied by lipid19,37. Select residues of the K2P modulator pocket are shown as sticks and are labeled. CaVAb subunits are colored cyan, marine, slate, and dark blue. ML335 (yellow) and amlodipine (cyan) are shown in space filling representation.
Extended Data Figure 4. K2P modulator pocket structure and conservation.
Details of a, ML335, and b, ML402 interactions with K2P2.1(TREK-1). c and d, Representative K2P channel sequence comparisons for the c, M4 face and d, P1 face. Purple bar and orange shading on sequence identifiers denotes the thermo- and mechanosensitive K2P2.1(TREK-1) subfamily. Protein secondary structure is marked above the sequences. Selectivity filter region is in red. Residues involved in direct interactions with ML335 and ML402 are orange and marked with an orange asterisk. Conserved positions are highlighted. K2P2.1(TREK-1) is the mouse protein used for this study. K2P2.1H(TREK-1) is the human homolog. All other K2P sequences are human origin. Sequences and identifiers are as follows: K2P2.1(TREK-1) NP_034737.2; K2P2.1H(TREK-1), NP_001017424.1; K2P10.1(TREK-2), NP_612190.1; K2P4.1(TRAAK), NP_001304019.1; K2P3.1(TASK-1), NP_002237.1; K2P9.1(TASK-3), NP_001269463.1; K2P5.1(TASK-2), NP_003731.1; K2P1.1(TWIK-1), NP_002236.103812.2; K2P6.1(TWIK-2), NP_004823.1; K2P7.1(KCNK7), AAI03812.2; K2P16.1(TALK-1), NP_001128577.1; K2P17.1(TALK-2), NP_113648.2; K2P12.1(THIK-2), NP_071338.1; K2P12.1(THIK-1), NP_071337.2; K2P15.1(TASK-5), NP_071753.2; and K2P18.1(TRESK), NP_862823.1. ‘●’ in K2P16.1(TALK-1) sequence in ‘c’ denotes the following, non-conserved sequence that was removed to avoid a long alignment gap: NFITPSGLLPSQEPFQTPHGKPESQQIP.
Extended Data Figure 5. K2P structure comparisons.
K2P modulator pocket views colored by B-factor for a, K2P2.1(TREK-1), b, K2P2.1(TREK-1):ML335, and c, K2P2.1(TREK-1):ML402. Bars show B-factor scale.
Extended Data Figure 6. K2P structure comparisons.
a, Backbone atom superposition of K2P2.1(TREK-1) (smudge, up), K2P2.1(TREK-1):ML335 (yellow, up), K2P2.1(TREK-1):ML402 (cyan, up), K2P10.1(TREK-2) (4BW5) (pink, up)6, K2P10.1(TREK-2) (4XDJ) (magenta, down)6, K2P10.1(TREK-2):Norfluoxetine (4XDK)(violet purple, down)6, K2P4.1(TRAAK) (4I9W) (limon, up)13, K2P4.1(TRAAK) G124I (4RUE) (marine, down)15, and K2P4.1(TRAAK) W262S (4RUF) (lime, down)15. ‘up’ or ‘down’ denotes M4 conformation. Selectivity filter ions for K2P2.1(TREK-1) (smudge), K2P2.1(TREK-1):ML335 (yellow), and K2P2.1(TREK-1):ML402 (cyan) are shown as spheres. ML335 and ML402 are shown in sticks. Select channel elements are labeled. b–e, Superposition showing b, K2P2.1(TREK-1) chain A (smudge) and chain B (light orange). Sites of GOF mutations, G137I (orange)7, and Trp2758, are indicated. c, K2P2.1(TREK-1):ML335 chain A (pink) and chain B (deep salmon), d, K2P2.1(TREK-1):ML402 chain A (cyan) and chain B (deep teal). e, K2P2.1(TREK-1) chain A (smudge) and chain B (light orange), K2P10.1(TREK-2) (4BW5) (pink)6, K2P10.1(TREK-2) (4XDJ) (magenta)6, K2P10.1(TREK-2):Norfluoxetine (4XDK)(violet purple)6. f, K2P2.1(TREK-1):ML335 (deep salmon), K2P4.1(TRAAK) (4I9W) (limon)13, K2P4.1(TRAAK) G124I (4RUE) (marine)15, K2P4.1(TRAAK) W262S (4RUF) (lime)15. G124I from K2P4.1(TRAAK) G124I15 is shown in sticks. In b–f, Phe134, His126, Lys271, Trp275, their equivalents in K2P10.1(TREK-2), K2P4.1(TRAAK), and K2P4.1(TRAAK) G124I, are shown in sticks. ML335, ‘c’, and ML402, ‘d’, are shown as sticks.
Extended Data Figure 7. K2P activator responses.
Exemplar current traces for a, K2P10.1(TREK-2) (black) with 20 μM ML335 (yellow orange) and b, K2P10.1(TREK-2) (black) with 20 μM ML402 (cyan). c, Dose response curves for K2P10.1(TREK-2) with ML335 (EC50 = 5.2 ± 0.5 μM (n>3)) (yellow orange) and ML402 (EC50 = 5.9 ± 1.6 μM (n≥4)(cyan). Exemplar current traces for d, K2P2.1(TREK-1) K271Q (black) and with 20 μM ML335 (purple). e, K2P4.1(TREK-1) Q258K (black) and with 50 μM ML335 (orange). f, K2P2.1(TREK-1) K271Q (black) and with 50 μM ML402 (purple). g, K2P4.1(TREK-1) Q258K (black) and with 50 μM ML402 (orange). Currents were evoked from Xenopus oocytes expressing the indicated channels from a −80 mV holding potential followed by a 500 ms ramp from −150 mV to +50 mV. Compound structures are shown. h, and i, Exemplar current traces for HEK293 cell inside-out patches expressing h, K2P2.1(TREK-1) and i, K2P2.1(TREK-1) K271Q to stimulation by 10 μM arachidonic acid (AA) (green). j, Current potentiation measured in HEK cells at 0 mV in response to 10μM AA for K2P2.1(TREK-1) (n=5) and K2P2.1(TREK-1) K271Q (n=4). k, Current potentiation measured in Xenopus oocytes at 0 mV for K2P4.1(TRAAK) (white), K2P2.1(TREK-1) (black), K2P4.1(TRAAK) Q258K (cyan) and K2P2.1(TREK-1) K271Q (gray) in response to 10 μM BL-1249, 30 μM ML67-33, and 20 μM ML335. For all experiments (n≥4). Data are mean ± SEM.
Extended Data Figure 8. K2P channel patch clamp recordings.
a, Dose response for K2P2.1(TREK-1) to ML335 (black circles) and ML402 (open circles) measured in HEK293 cells by whole cell patch clamp. EC50 values are 5.2 ± 0.8 μM and 5.9 ± 1.6 μM for ML335 and ML402, respectively (n≥3). b, and c, Representative current traces and voltage-current relationship from HEK293 inside-out patches for expressing b, K2P4.1(TRAAK) and c, K2P4.1(TRAAK) G124I elicited by a 350 ms-voltage step protocol from −100 mV to +100 mV in 150 mM K+[out]/150 mM Rb+[in]. d, Rectification coefficients (I+100mV/I-100mV) calculated from n≥3 current recordings obtained from the same conditions in ‘b’ and ‘c’.
Extended data Table 1.
Data collection and refinement statistics
| K2p2.1 (TREK-1) (5VK5) | K2p2.1 (TREK-1): ML335 (5VKN) | K2p2.1 (TREK-1):ML402 (5VKP) | |
|---|---|---|---|
| Data collection | |||
| Space group | P212121 | P212121 | P212121 |
| Cell dimensions | |||
| a, b, c (Å) | 66.72/120.42/126.44 | 67.07/119.39/128.18 | 67.09/119.56/127.21 |
| α, β, γ (°) | 90.0/90.0/90.0 | 90.0/90.0/90.0 | 90.0/90.0/90.0 |
| Resolution (Å) | 87.2 – 3.10 (3.21 – 3.10) | 87.4 – 3.0 (3.11 – 3.0) | 87.1 – 2.8 (2.99 – 2.8) |
| Rsym (%) | 10.38 (>100%) | 23.7 (>100%) | 14.2 (>100%) |
| l/σ(l) | 13.35 (0.3) | 9.78 (0.66) | 11.13 (0.37) |
| CC1/2 | 0.999 (0.065) | 0.998 (0.171) | 0.999 (0.108) |
| Completeness (%) | 97.0 (100.0) | 97.0 (100.0) | 98.0 (100.0) |
| Redundancy | 6.0 (6.2) | 12.9 (13.3) | 12.8 (13.6) |
| Refinement | |||
| Resolution (Å) | 15.0 – 3.10 (3.21 – 3.10) | 15.0 – 3.0 (3.11 – 3.0) | 15.0 – 2.8 (2.99 – 2.8) |
| No. reflections | 18506 | 20686 | 25882 |
| Rwork/Rfree | 26.1/31.4 | 25.8/28.3 | 26.9/31.4 |
| No. atoms | |||
| Protein | 4289 | 4357 | 4328 |
| Ligand/ion | 74 | 200 | 174 |
| K+ | 6 | 6 | 6 |
| Cd2+ | 3 | 3 | 1 |
| Lipid | 65 | 191 | 167 |
| ML335 or ML402 | |||
| Water | 0 | 0 | 0 |
| B factors | |||
| Protein | 154.6 | 107.4 | 147.7 |
| Ligand/ion | 168.7 | 96.5 | 131.0 |
| Water | n/a | n/a | n/a |
| R.m.s. deviations | |||
| Bond lengths (Å) | 0.002 | 0.006 | 0.002 |
| Bond angles (°) | 0.480 | 0.685 | 0.483 |
Values in parentheses are for highest-resolution shell.
each dataset was derived from a single crystal
Extended data Table 2.
K2P2.1(TREK-1) B-factor and structure comparisions a, B-factor comparisons. Selectivity filter residue B-factors are below the average channel core B-factor in both the K2P2.1(TREK-1) and modulator bound structures. Modulator pocket residue B-factors drop relative to the average B-factor in both the ML335 and ML402 complexes, indicating that modulator binding reduces the mobility of these residues. The structures are determined in ~200 mM potassium, a concentration that is expected to stabilize the conformation of the selectivity filter (cf. Ref. 38) and that could mask mobility changes. Average B-factor is calculated using the channel core elements on both chains: M1 (residues 47-65), P1 through common part of M2 (residues 127-188), common part of M3 through common part M4 (residues 210-300). The selectivity filter was included in the calculation. Blue and red values are >10% below or above the average B-factor, respectively. b, K2P channel structure comparisons. RMSDs are calculated using the following K2P2.1(TREK-1) (5VK5) Chain A and Chain B elements: (ΔCAP, ΔM4) M1 through CAP (residues 47-69), P1 through common part of M4 (residues 127-281). Channel core (ΔCAP, ΔM2, ΔM4) M1 (residues 47-65), P1 through common part of M2 (residues 127-188), common part of M3 through common part M4 (residues 210-300). The selectivity filter was included in the calculation. For the non-domain-swapped K2P4.1(TRAAK)(3UM7), residues 47-69 of chain A were compared to equivalent chain B residues.
| Extended Data Table 2a | B-factor comparisons for K2P2.1(TREK-1) and modulator complexes
| ||||
|---|---|---|---|---|
| Location | Residue | B-factor (Å2) | ||
|
| ||||
| K2P2.1(TREK-1) | K2P2.1(TREK-1):ML335 | K2P2.1(TREK-1):ML402 | ||
| Selectivity filter | Gly144 | 108.6 | 63.0 | 92.7 |
| Phe145 | 109.7 | 64.7 | 98.4 | |
| Gly146 | 118.5 | 76.5 | 127.4 | |
|
| ||||
| Modulator pocket | Phe134 | 139.3 | 74.0 | 104.1 |
| Lys271 | 181.9 | 83.0 | 116.1 | |
| Trp275 | 156.5 | 69.9 | 103.2 | |
|
| ||||
| Channel core | 132.4 | 83.5 | 118.8 | |
| Extended Data Table 2b. Structural comparisons with K2p2.1 (TREK-1)
| |||
|---|---|---|---|
| PDB code | K2p | Cα RMSD (Å) (ΔCAP, ΔM4) |
Cα RMSD(Å) Channel core (ΔCAP, ΔM2, ΔM4) |
| 5VKN | K2p 2.1(TREK-1):ML335 | 0.443 | 0.388 |
| 5VKP | K2p 2.1(TREK-1):ML402 | 0.462 | 0.426 |
| 4XDK | K2p 10.1 (TREK-2):Norfluoxetine | 1.976 | 1.317 |
| 4BW5 | K2p 10.1(TREK-2):M4 up | 1.054 | 0.918 |
| 4XDJ | K2p 10.1(TREK-2):M4 down | 1.790 | 1.331 |
| 419W | K2p 4.1(TRAAK) | 1.176 | 1.141 |
| 3UM7 | K2p 4.1(TRAAK) (no domain swap) | 1.468 | 1.390 |
| 4RUF | K2p 4.1(TRAAK) W262S | 1.351 | 1.288 |
| 4RUE | K2p 4.1(TRAAK) G124I | 1.466 | 1.490 |
| 4WFF | K2p 4.1(TRAAK) M4 down | 1.155 | 1.217 |
| 4WFE | K2p 4.1(TRAAK) M4 up | 1.149 | 1.023 |
Supplementary Material
Extended Data Video V1 Morph between the K2P2.1(TREK-1) and K2P2.1(TREK-1):ML335 structures. K2P2.1(TREK-1) subunit chains are colored orange and smudge. ML335 is shown in yellow sticks. Residues His126, Phe134, Asn147, Lys271, and Trp275 from the orange subunit are shown as sticks.
Acknowledgments
We thank K. Brejc, S. Capponi, M. Grabe, L. Jan, for comments, and A. Renslo for comments and synthesis advice. This work was supported by grants R01-MH093603 to D.L.M., and to M.L. and C.A. from the American Heart Association.
Footnotes
Competing financial interests statement
M.L. C.A. K.A.C, C.B., and D.L.M. declare no financial interests.
T.M and Y.S. are employees of Ono Pharmaceutical, Co. Ltd.
Extended Data Material
Methods, along with Extended data figures and tables are found in the Extended Data material document.
Data deposition statement
K2P2.1(TREK-1), 5VK5; K2P2.1(TREK-1):ML335, 5VKN; and K2P2.1(TREK-1):ML402, 5VKP coordinates and structure factors are available at the RCSB.
Author contributions
M.L., C.A. C.B. and D.L.M. conceived the study and designed the experiments. T.M. and Y.S. conceived and ran thallium flux assays. M.L. and C.A. performed experiments. M.L. and K.A.C. expressed and purified proteins. M.L. performed crystallization and structure determination. M.L. and C.A. performed electrophysiological experiments and analyzed the data. C.B. designed synthetic routes, synthesized, and purified the compounds. D.L.M analyzed data and provided guidance and support. M.L., C.A., and D.L.M. wrote the paper.
References
- 1.Feliciangeli S, Chatelain FC, Bichet D, Lesage F. The family of K channels: salient structural and functional properties. J Physiol. 2014 doi: 10.1113/jphysiol.2014.287268. [DOI] [PMC free article] [PubMed] [Google Scholar]
- 2.Devilliers M, et al. Activation of TREK-1 by morphine results in analgesia without adverse side effects. Nat Commun. 2013;4:2941. doi: 10.1038/ncomms3941. [DOI] [PubMed] [Google Scholar]
- 3.Vivier D, et al. Development of the first Two-Pore Domain Potassium Channel TREK-1 (TWIK-Related K+ Channel 1)-selective agonist possessing in vivo anti-nociceptive activity. Journal of medicinal chemistry. 2017 doi: 10.1021/acs.jmedchem.6b01285. [DOI] [PubMed] [Google Scholar]
- 4.Brohawn SG, del Marmol J, MacKinnon R. Crystal structure of the human K2P TRAAK, a lipid- and mechano-sensitive K+ ion channel. Science. 2012;335:436–441. doi: 10.1126/science.1213808. 335/6067/436 [pii] [DOI] [PMC free article] [PubMed] [Google Scholar]
- 5.Miller AN, Long SB. Crystal structure of the human two-pore domain potassium channel K2P1. Science. 2012;335:432–436. doi: 10.1126/science.1213274. 335/6067/432 [pii] [DOI] [PubMed] [Google Scholar]
- 6.Dong YY, et al. K2P channel gating mechanisms revealed by structures of TREK-2 and a complex with Prozac. Science. 2015;347:1256–1259. doi: 10.1126/science.1261512. [DOI] [PMC free article] [PubMed] [Google Scholar]
- 7.Bagriantsev SN, Clark KA, Minor DL., Jr Metabolic and thermal stimuli control K(2P)2.1 (TREK-1) through modular sensory and gating domains. EMBO J. 2012;31:3297–3308. doi: 10.1038/emboj.2012.171. [DOI] [PMC free article] [PubMed] [Google Scholar]
- 8.Bagriantsev SN, Peyronnet R, Clark KA, Honore E, Minor DL., Jr Multiple modalities converge on a common gate to control K2P channel function. EMBO J. 2011;30:3594–3606. doi: 10.1038/emboj.2011.230. emboj2011230 [pii] [DOI] [PMC free article] [PubMed] [Google Scholar]
- 9.Schewe M, et al. A Non-canonical Voltage-Sensing Mechanism Controls Gating in K2P K(+) Channels. Cell. 2016;164:937–949. doi: 10.1016/j.cell.2016.02.002. [DOI] [PMC free article] [PubMed] [Google Scholar]
- 10.Piechotta PL, et al. The pore structure and gating mechanism of K2P channels. EMBO J. 2011;30:3607–3619. doi: 10.1038/emboj.2011.268. emboj2011268 [pii] [DOI] [PMC free article] [PubMed] [Google Scholar]
- 11.Bagriantsev SN, et al. A high-throughput functional screen identifies small molecule regulators of temperature- and mechano-sensitive K2P channels. ACS chemical biology. 2013;8:1841–1851. doi: 10.1021/cb400289x. [DOI] [PMC free article] [PubMed] [Google Scholar]
- 12.Su ZW, Brown EC, Wang WW, MacKinnon R. Novel cell-free high-throughput screening method for pharmacological tools targeting K+ channels. P Natl Acad Sci USA. 2016;113:5748–5753. doi: 10.1073/pnas.1602815113. [DOI] [PMC free article] [PubMed] [Google Scholar]
- 13.Brohawn SG, Campbell EB, MacKinnon R. Domain-swapped chain connectivity and gated membrane access in a Fab-mediated crystal of the human TRAAK K+ channel. Proc Natl Acad Sci U S A. 2013;110:2129–2134. doi: 10.1073/pnas.1218950110. [DOI] [PMC free article] [PubMed] [Google Scholar]
- 14.Brohawn SG, Campbell EB, MacKinnon R. Physical mechanism for gating and mechanosensitivity of the human TRAAK K+ channel. Nature. 2014;516:126–130. doi: 10.1038/nature14013. [DOI] [PMC free article] [PubMed] [Google Scholar]
- 15.Lolicato M, Riegelhaupt PM, Arrigoni C, Clark KA, Minor DL., Jr Transmembrane helix straightening and buckling underlies activation of mechanosensitive and thermosensitive K(2P) channels. Neuron. 2014;84:1198–1212. doi: 10.1016/j.neuron.2014.11.017. [DOI] [PMC free article] [PubMed] [Google Scholar]
- 16.Cohen A, Ben-Abu Y, Hen S, Zilberberg N. A novel mechanism for human K2P2.1 channel gating. Facilitation of C-type gating by protonation of extracellular histidine residues. J Biol Chem. 2008;283:19448–19455. doi: 10.1074/jbc.M801273200. M801273200 [pii] [DOI] [PubMed] [Google Scholar]
- 17.Sandoz G, Douguet D, Chatelain F, Lazdunski M, Lesage F. Extracellular acidification exerts opposite actions on TREK1 and TREK2 potassium channels via a single conserved histidine residue. Proc Natl Acad Sci U S A. 2009;106:14628–14633. doi: 10.1073/pnas.0906267106. 0906267106 [pii] [DOI] [PMC free article] [PubMed] [Google Scholar]
- 18.Bagneris C, et al. Prokaryotic NavMs channel as a structural and functional model for eukaryotic sodium channel antagonism. Proc Natl Acad Sci U S A. 2014;111:8428–8433. doi: 10.1073/pnas.1406855111. [DOI] [PMC free article] [PubMed] [Google Scholar]
- 19.Tang L, et al. Structural basis for inhibition of a voltage-gated Ca2+ channel by Ca2+ antagonist drugs. Nature. 2016;537:117–121. doi: 10.1038/nature19102. [DOI] [PMC free article] [PubMed] [Google Scholar]
- 20.Kearney PC, et al. Molecular Recognition in Aqueous-Media - New Binding-Studies Provide Further Insights into the Cation-Pi Interaction and Related Phenomena. Journal of the American Chemical Society. 1993;115:9907–9919. doi: 10.1021/ja00075a006. [DOI] [Google Scholar]
- 21.Hibbs RE, Gouaux E. Principles of activation and permeation in an anion-selective Cys-loop receptor. Nature. 2011;474:54–60. doi: 10.1038/nature10139. [DOI] [PMC free article] [PubMed] [Google Scholar]
- 22.Yelshanskaya MV, et al. Structural Bases of Noncompetitive Inhibition of AMPA-Subtype Ionotropic Glutamate Receptors by Antiepileptic Drugs. Neuron. 2016;91:1305–1315. doi: 10.1016/j.neuron.2016.08.012. [DOI] [PMC free article] [PubMed] [Google Scholar]
- 23.McClenaghan C, et al. Polymodal activation of the TREK-2 K2P channel produces structurally distinct open states. J Gen Physiol. 2016;147:497–505. doi: 10.1085/jgp.201611601. [DOI] [PMC free article] [PubMed] [Google Scholar]
- 24.Chemin J, et al. A phospholipid sensor controls mechanogating of the K+ channel TREK-1. EMBO J. 2005;24:44–53. doi: 10.1038/sj.emboj.7600494. 7600494 [pii] [DOI] [PMC free article] [PubMed] [Google Scholar]
- 25.Chemin J, et al. Up- and down-regulation of the mechano-gated K(2P) channel TREK-1 by PIP (2) and other membrane phospholipids. Pflugers Arch. 2007;455:97–103. doi: 10.1007/s00424-007-0250-2. [DOI] [PubMed] [Google Scholar]
- 26.Murbartian J, Lei Q, Sando JJ, Bayliss DA. Sequential phosphorylation mediates receptor- and kinase-induced inhibition of TREK-1 background potassium channels. J Biol Chem. 2005;280:30175–30184. doi: 10.1074/jbc.M503862200. M503862200 [pii] [DOI] [PubMed] [Google Scholar]
- 27.Patel AJ, et al. A mammalian two pore domain mechano-gated S-like K+ channel. Embo J. 1998;17:4283–4290. doi: 10.1093/emboj/17.15.4283. [DOI] [PMC free article] [PubMed] [Google Scholar]
- 28.Maingret F, et al. TREK-1 is a heat-activated background K(+) channel. Embo J. 2000;19:2483–2491. doi: 10.1093/emboj/19.11.2483. [DOI] [PMC free article] [PubMed] [Google Scholar]
- 29.Honore E, Maingret F, Lazdunski M, Patel AJ. An intracellular proton sensor commands lipid- and mechano-gating of the K(+) channel TREK-1. EMBO J. 2002;21:2968–2976. doi: 10.1093/emboj/cdf288. [DOI] [PMC free article] [PubMed] [Google Scholar]
- 30.Fink M, et al. Cloning, functional expression and brain localization of a novel unconventional outward rectifier K+ channel. Embo J. 1996;15:6854–6862. [PMC free article] [PubMed] [Google Scholar]
- 31.Veale EL, et al. Influence of the N terminus on the biophysical properties and pharmacology of TREK1 potassium channels. Molecular pharmacology. 2014;85:671–681. doi: 10.1124/mol.113.091199. [DOI] [PubMed] [Google Scholar]
- 32.Tertyshnikova S, et al. BL-1249 [(5,6,7,8-tetrahydro-naphthalen-1-yl)-[2-(1H-tetrazol-5-yl)-phenyl]-amine]: a putative potassium channel opener with bladder-relaxant properties. The Journal of pharmacology and experimental therapeutics. 2005;313:250–259. doi: 10.1124/jpet.104.078592. [DOI] [PubMed] [Google Scholar]
- 33.Hardy JA, Wells JA. Searching for new allosteric sites in enzymes. Current opinion in structural biology. 2004;14:706–715. doi: 10.1016/j.sbi.2004.10.009. [DOI] [PubMed] [Google Scholar]
- 34.Guizouarn H, Gabillat N, Motais R, Borgese F. Multiple transport functions of a red blood cell anion exchanger, tAE1: its role in cell volume regulation. J Physiol. 2001;535:497–506. doi: 10.1111/j.1469-7793.2001.t01-1-00497.x. PHY_12115 [pii] [DOI] [PMC free article] [PubMed] [Google Scholar]
- 35.Rapp C, Goldberger E, Tishbi N, Kirshenbaum R. Cation-pi interactions of methylated ammonium ions: A quantum mechanical study. Proteins-Structure Function and Bioinformatics. 2014;82:1494–1502. doi: 10.1002/prot.24519. [DOI] [PMC free article] [PubMed] [Google Scholar]
- 36.Crowley PB, Golovin A. Cation-pi interactions in protein-protein interfaces. Proteins-Structure Function and Bioinformatics. 2005;59:231–239. doi: 10.1002/prot.20417. [DOI] [PubMed] [Google Scholar]
- 37.Payandeh J, Minor DL., Jr Bacterial Voltage-Gated Sodium Channels (BacNas) from the Soil, Sea, and Salt Lakes Enlighten Molecular Mechanisms of Electrical Signaling and Pharmacology in the Brain and Heart. Journal of molecular biology. 2014 doi: 10.1016/j.jmb.2014.08.010. [DOI] [PMC free article] [PubMed] [Google Scholar]
- 38.Zhou Y, Morais-Cabral JH, Kaufman A, MacKinnon R. Chemistry of ion coordination and hydration revealed by a K+ channel-Fab complex at 2.0 A resolution. Nature. 2001;414:43–48. doi: 10.1038/35102009. [DOI] [PubMed] [Google Scholar]
- 39.Kawate T, Gouaux E. Fluorescence-detection size-exclusion chromatography for precrystallization screening of integral membrane proteins. Structure. 2006;14:673–681. doi: 10.1016/j.str.2006.01.013. [DOI] [PubMed] [Google Scholar]
- 40.Drew D, et al. GFP-based optimization scheme for the overexpression and purification of eukaryotic membrane proteins in Saccharomyces cerevisiae. Nat Protoc. 2008;3:784–798. doi: 10.1038/nprot.2008.44. nprot.2008.44 [pii] [DOI] [PMC free article] [PubMed] [Google Scholar]
- 41.Newstead S, Kim H, von Heijne G, Iwata S, Drew D. High-throughput fluorescent-based optimization of eukaryotic membrane protein overexpression and purification in Saccharomyces cerevisiae. Proc Natl Acad Sci U S A. 2007;104:13936–13941. doi: 10.1073/pnas.0704546104. 0704546104 [pii] [DOI] [PMC free article] [PubMed] [Google Scholar]
- 42.Kirchhofer A, et al. Modulation of protein properties in living cells using nanobodies. Nature Structural & Molecular Biology. 2010;17:133-U162. doi: 10.1038/nsmb.1727. [DOI] [PubMed] [Google Scholar]
- 43.Shaya D, et al. Voltage-gated sodium channel (NaV) protein dissection creates a set of functional pore-only proteins. Proc Natl Acad Sci U S A. 2011;108:12313–12318. doi: 10.1073/pnas.1106811108. 1106811108 [pii] [DOI] [PMC free article] [PubMed] [Google Scholar]
- 44.Kabsch W, Xds Acta crystallographica. Section D, Biological crystallography. 2010;66:125–132. doi: 10.1107/S0907444909047337. [DOI] [PMC free article] [PubMed] [Google Scholar]
- 45.Evans PR, Murshudov GN. How good are my data and what is the resolution? Acta crystallographica. Section D, Biological crystallography. 2013;69:1204–1214. doi: 10.1107/S0907444913000061. [DOI] [PMC free article] [PubMed] [Google Scholar]
- 46.Diederichs K, Karplus PA. Better models by discarding data? Acta crystallographica. Section D, Biological crystallography. 2013;69:1215–1222. doi: 10.1107/S0907444913001121. [DOI] [PMC free article] [PubMed] [Google Scholar]
- 47.Karplus PA, Diederichs K. Linking crystallographic model and data quality. Science. 2012;336:1030–1033. doi: 10.1126/science.1218231. [DOI] [PMC free article] [PubMed] [Google Scholar]
- 48.Emsley P, Cowtan K. Coot: model-building tools for molecular graphics. Acta crystallographica Section D, Biological crystallography. 2004;60:2126–2132. doi: 10.1107/S0907444904019158. [DOI] [PubMed] [Google Scholar]
- 49.Collaborative Computational Project N. The CCP4 suite: Programs for protein crystallography. Acta crystallographica. Section D, Biological crystallography. 1994;50:760–763. doi: 10.1107/S0907444994003112. [DOI] [PubMed] [Google Scholar]
- 50.Adams PD, et al. PHENIX: a comprehensive Python-based system for macromolecular structure solution. Acta crystallographica. Section D, Biological crystallography. 2010;66:213–221. doi: 10.1107/S0907444909052925. [DOI] [PMC free article] [PubMed] [Google Scholar]
- 51.Chen VB, et al. MolProbity: all-atom structure validation for macromolecular crystallography. Acta crystallographica. Section D, Biological crystallography. 2010;66:12–21. doi: 10.1107/S0907444909042073. [DOI] [PMC free article] [PubMed] [Google Scholar]
- 52.Pascale R, et al. New N-(phenoxydecyl)phthalimide derivatives displaying potent inhibition activity towards alpha-glucosidase. Bioorg Med Chem. 2010;18:5903–5914. doi: 10.1016/j.bmc.2010.06.088. [DOI] [PubMed] [Google Scholar]
- 53.Eguchi Y, Sasaki F, Sugimoto A, Ebisawa H, Ishikawa M. Studies on Hypotensive Agents - Synthesis of 1-Substituted 3-(2-Chlorophenyl)-6-Ethoxycarbonyl-5,7-Dimethyl-2,4(1h,3h)-Quinazolinediones. Chem Pharm Bull. 1991;39:1753–1759. doi: 10.1248/cpb.39.1753. [DOI] [PubMed] [Google Scholar]
Associated Data
This section collects any data citations, data availability statements, or supplementary materials included in this article.
Supplementary Materials
Extended Data Video V1 Morph between the K2P2.1(TREK-1) and K2P2.1(TREK-1):ML335 structures. K2P2.1(TREK-1) subunit chains are colored orange and smudge. ML335 is shown in yellow sticks. Residues His126, Phe134, Asn147, Lys271, and Trp275 from the orange subunit are shown as sticks.


