Abstract
The maturation of Ras GTPases, and ~200 other cellular CaaX proteins, involves three enzymatic steps: addition of a farnesyl or geranylgeranyl prenyl lipid to the cysteine (C) in the C-terminal CaaX motif, proteolytic cleavage of the aaX residues, and methylation of the exposed prenylcysteine residue at its terminal carboxylate1. This final step is catalyzed by isoprenylcysteine carboxyl methyltransferase (ICMT), a eukaryotic-specific integral membrane enzyme of the endoplasmic reticulum (ER)2. ICMT is the only cellular enzyme known to methylate prenylcysteine substrates; methylation is important for their biological functions, including the membrane localisations and subsequent activities of Ras1, prelamin A3, and Rab4. ICMT inhibition has potential for combating progeria3 and cancer5–8. Here we present an X-ray structure of ICMT, at 2.3 Å resolution, in complex with its cofactor, an ordered lipid molecule and a monobody inhibitor. The active site spans cytosolic and membrane-exposed regions, indicating distinct entry routes for its cytosolic methyl donor, S-adenosyl-L-methionine (AdoMet), and for prenylcysteine substrates, which are associated with the ER membrane. The structure suggests how ICMT overcomes the topographical challenge and unfavourable energetics of bringing two reactants that have different cellular localisations together in a membrane environment – a relatively uncharacterized, but defining feature of many integral membrane enzymes.
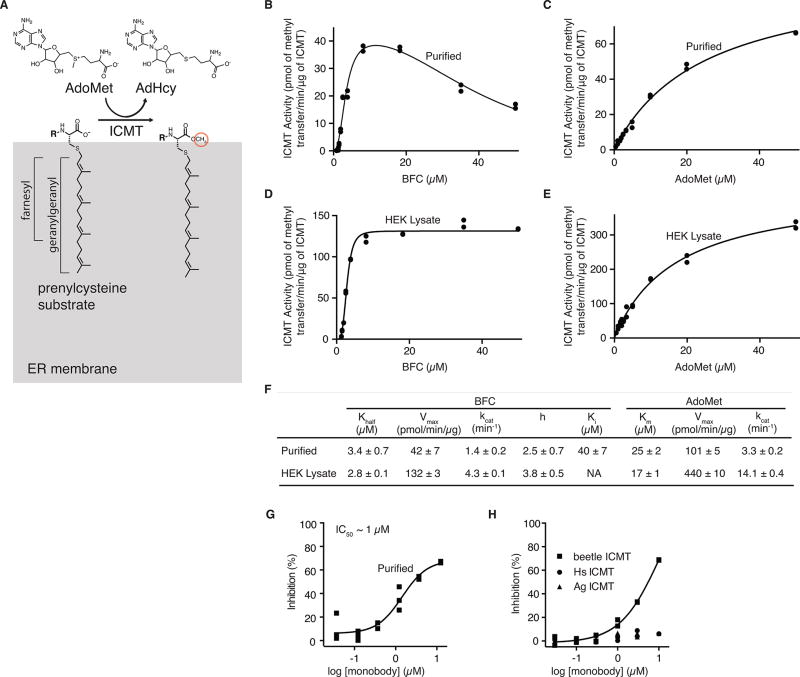
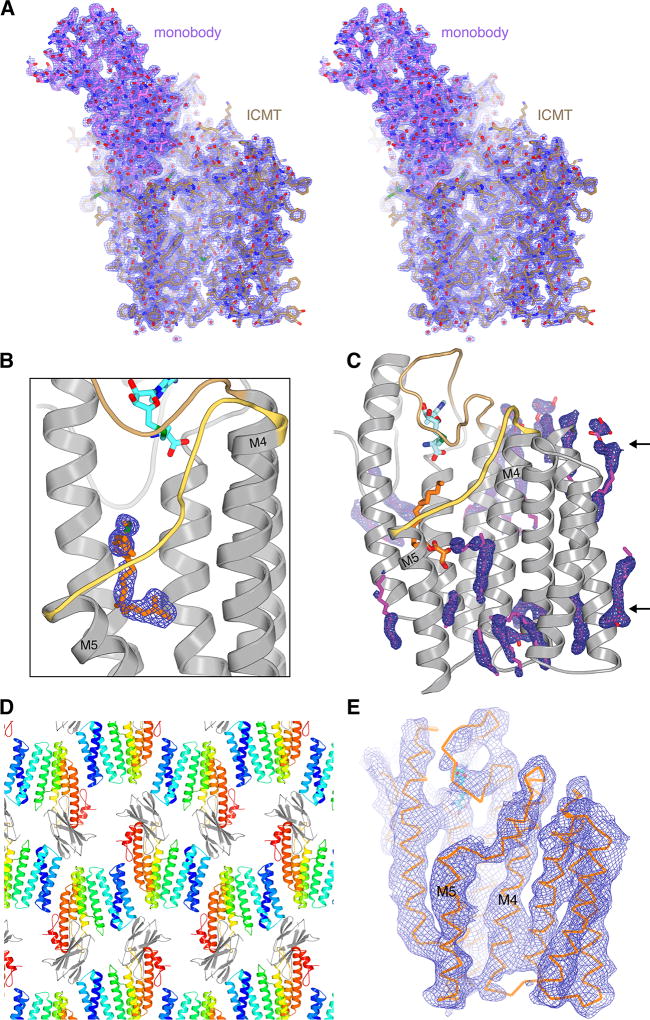
ICMT from the beetle Tribolium castaneum exhibited superior biochemical stability in detergent-containing solutions and was used for biochemical characterization and structure determination (Methods). Human and beetle ICMT share the same predicted topology9 and have 58% amino acid sequence identity within the region thought to contain the active site (amino acids 90–281) (Extended Data Fig. 1)10. Beetle ICMT demonstrated robust methylation of prenylcysteine substrates both in cellular membranes and in the purified form, and exhibited kinetic parameters similar to those of human ICMT (Extended Data Fig. 2)11,12. We engineered a synthetic ICMT-binding protein called a “monobody”, which is based on a randomized fibronectin protein domain, for use as a crystallisation chaperone13. The monobody is an inhibitor of ICMT (IC50 ~1 µM) with specificity for the beetle ortholog (Extended Data Fig. 2g,h). Crystals of purified ICMT-monobody complex were obtained in the lipidic cubic phase14 in the presence of the S-adenosyl-L-homocysteine (AdoHcy) cofactor and the prenylcysteine substrate N-acetyl-S-geranylgeranyl-L-cysteine (AGGC) (Extended Data Fig. 2a). Experimental phases yielded high-quality electron density maps that enabled placement of all amino acids of ICMT and the monobody (Extended Data Fig. 3a). The refined atomic coordinates have good stereochemistry and an Rfree value of 24.6% (Extended Data Table 1).
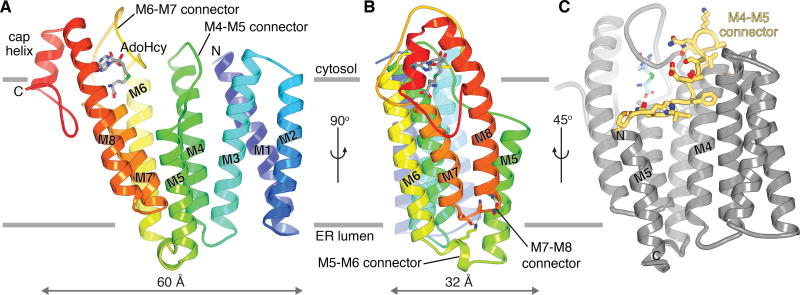
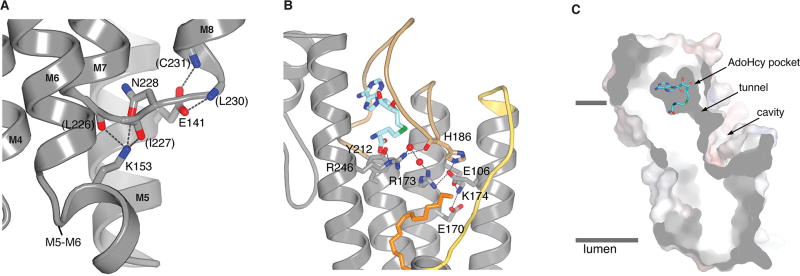
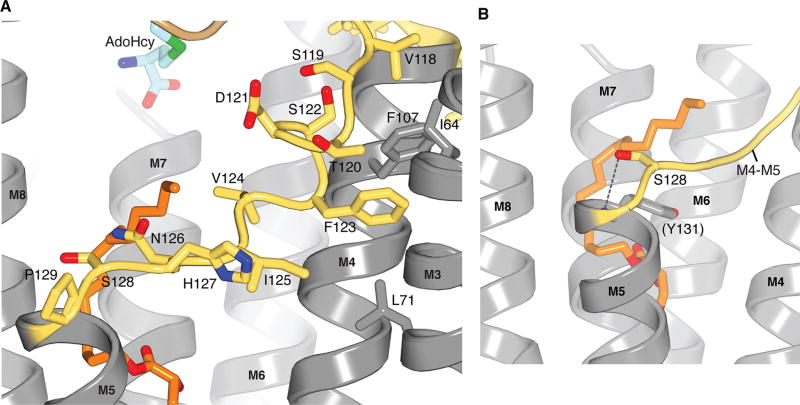
ICMT contains eight transmembrane α-helices (M1–M8) and would reside almost entirely within the ER membrane (Fig. 1a,b). The largest cytosolic region of the enzyme, which protrudes ~12 Å away from the membrane and encompasses the binding site for AdoHcy, is formed by an extension of M8 together with a structurally ordered connection between M6 and M7 (the M6–M7 connector) plus a short “cap” helix near the C-terminus. The short connection between M7 and M8 is notable in that it does not fully reach the luminal side but is stabilised within the transmembrane region by interactions made with the M5–M6 connector that lays beneath it (Fig. 1b and Extended Data Fig. 4a). Additionally, the M5 helix would not span the bilayer. Its N-terminus, capped by a hydrogen bond with Ser128, is positioned within the membrane region, ~10 Å from the cytosolic side (Extended Data Fig. 5b). Unusually, the M4 and M5 helices are connected by an extended segment (Pro115 – Pro129), ~25 Å long, that spans the length of the enzyme in that direction and traverses diagonally through the membrane (Fig. 1c and Extended Data Fig. 5a). The M1–M3 region, which is unique to ICMT enzymes from animals (Extended Data Fig. 1), makes extensive contacts with M4 and the M4–M5 connector. Helices M1, M2, and M3 are associated with one another and stabilised, in part, by GxxxG-like helical packing motifs between M1 and M3 (Extended Data Fig. 6a)15. The non-covalent association is strong enough that M1 and M2 remain associated with the core of the enzyme following proteolytic cleavage of the M2–M3 loop (Extended Data Fig. 6). Congruently, genetic deletion of M1 and M2 renders human ICMT inactive12.
Figure 1. Architecture of ICMT.
a, Ribbon representation with secondary structure elements coloured blue-to-red from the N- to the C-terminus. Horizontal bars indicate approximate boundaries of the ER membrane. b, Orthogonal view, showing interactions between the M5–M6 and M7–M8 connectors (sticks with hydrogen bonds drawn as dashed lines). c, View highlighting the location of the M4–M5 connector (yellow with drawn side chains).
The structure can be compared directly to a large body of functional data on ICMT9,10,12,16. Plotting residues that disrupt catalytic activity when mutated on the structure identifies the active site (Fig. 2a), the location of which had remained elusive due to the broad distribution of these residues throughout the primary sequence (Extended Data Fig. 1). In the cell, the active site would be primarily located within the cytosolic leaflet of the membrane and is contained within the portion of the enzyme spanning from M4 to the C-terminus (Fig. 2a). AdoHcy is encapsulated within a pocket that is formed by the M6–M7 connector, the cytosolic extension of M8, and the cap helix that secludes it from both the aqueous environment of the cytosol and from the lipid membrane (Fig. 2b,c). The release of AdoHcy, and the subsequent binding of AdoMet, may occur via hinged-displacement of the M6–M7 connector toward the bulk solution of the cytosol, in which there is a reservoir of micromolar concentrations of AdoMet. Gly181 and Ser193 are potential hinge points (Fig. 2c). The perfectly conserved residues Phe184, Tyr204, and Glu250 appear particularly important for positioning AdoHcy through direct contacts (Fig. 2c) and completely abolish activity when mutated to alanine (Extended Data Fig. 1)12,16. The active site could accommodate the methyl group of AdoMet in a slender “tunnel” (Fig. 2b, Extended Data Fig. 4c), suggesting that the observed conformation of AdoHcy is analogous to when the methyl donor is bound.
Figure 2. The active site.
a, Three-dimensional clustering of key residues identifies the active site. Residues that diminish specific activity by more than 95% when mutated (Extended Data Fig. 1)12 are drawn in magenta on a ribbon representation. Their high concentration within the dashed region demarcates the active site. b, The active site, depicted as a molecular surface within the ribbon representation. The AdoHcy pocket is cyan; the membrane-exposed cavity is orange. c, Interactions with AdoHcy (sticks with cyan carbon atoms). Dashed lines indicate hydrogen bonds. Water molecules are red spheres. Atom colouring is: nitrogen, blue; oxygen, red; and sulfur, green. The M6–M7 connector is tan. Arrows denote locations of Gly181 and Ser193; parentheses indicate hydrogen bonds with backbone atoms. An inset shows electron density for AdoHcy (simulated annealing omit Fo-Fc map, contoured at 3σ).
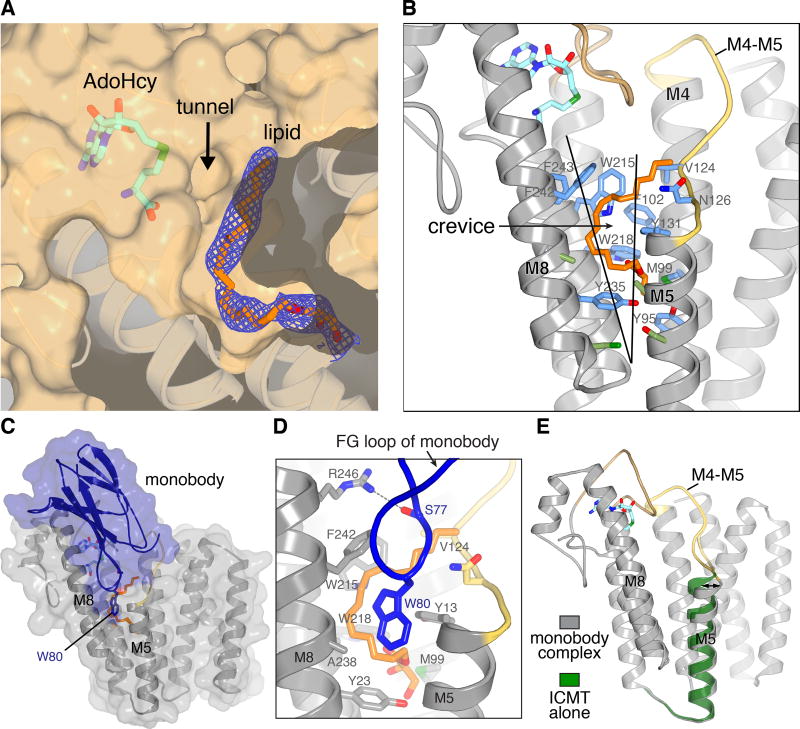
ICMT accommodates a breadth of protein substrates. This includes all prenylated (farnesylated and geranylgeranylated) and proteolytically processed CaaX proteins as well certain Rab GTPases that have two geranylgeranyl groups attached to the cysteine residues of their terminal CXC motif (C, cysteine; X, variable amino acid)1. The structure suggests that the prenyl moiety of the substrate binds within a deep cavity on the protein surface that extends from the cofactor pocket into the transmembrane region (Fig. 2b and 3a). Formed by regions of the M4, M5, M7, and M8 helices, this cavity is ~22 Å long and ~6 Å wide. Approximately two-thirds of the cavity would be exposed to the cytosolic leaflet of the lipid bilayer via a lateral crevice between helices M5 and M8 (Fig. 2b and 3b). A tube of electron density consistent with a lipid is present within the cavity (Fig. 3a). While the 20-carbon geranylgeranyl group of the AGGC substrate that was present during crystallization could account for the density, we cannot be sure of its identity and therefore modeled a monoolein lipid (Fig. 3a and Extended Data Fig. 3b). The cavity would also accommodate the 15-carbon farnesyl group. Like the binding site for the prenyl group in water-soluble enzymes such as farnesyltransferase17, the cavity is lined primarily by aromatic amino acids (Tyr95, Met99, Phe102, Val124, Asn126, Tyr131, Trp215, Trp218, Tyr235, Phe242, and Phe243) that dramatically reduce enzyme activity when mutated (Extended Data Fig. 1)12, in further support that it is the prenyl binding site. For doubly geranylgeranylated CXC proteins, the second prenyl group could be accommodated in the crevice between M5 and M8 and/or in the adjacent membrane while the C-terminal geranylgeranyl group occupies the active site.
Figure 3. Lipid-binding cavity and monobody complex.
a, The active site cavity containing a lipid molecule. Electron density (blue mesh, 2Fo-Fc map contoured at 1 σ) for a monoolein lipid (orange sticks) is shown on a cutaway view of the molecular surface (tan). The tunnel between AdoHcy (sticks) and the lipid-binding cavity is indicated. Helices below the surface are depicted as ribbons. b, The crevice and amino acids comprising the lipid-binding cavity. A portion of ICMT is depicted as ribbons with the M4–M5 connector coloured yellow and the M6–M7 connector coloured tan. The crevice between M5 and M8 is indicated by a wedge. Amino acids within van der Waals distances of the lipid are coloured blue; those that line the crevice are green c, Monobody complex. A semi-transparent representation of the molecular surface of the complex (ICMT, gray; monobody, blue) is shown surrounding ribbon representations. d, Close up view of the FG loop of the monobody (blue) interacting with ICMT (predominately grey). Trp80 and Ser77 of the monobody are shown as sticks. A hydrogen bond between Ser77 and Arg246 of ICMT is shown as a dashed line. The monoolein molecule (orange) and ICMT residues surrounding it are shown as sticks. e, Comparison of structures with and without the monobody (coloured as indicated). An arrow highlights the tilting of M5; otherwise the overall structures are indistinguishable.
The structure of a methyltransferase from the prokaryotic organism Methanosarcina acetivorans, which we refer to as MaMTase, highlights diversity within the integral membrane methyltransferase family (Extended Data Fig. 7)16. Sharing just 14% sequence identity with ICMT, MaMTase had previously been referred to as Ma-ICMT, but this nomenclature is misleading because the biological substrates of MaMTase are unknown, MaMTase cannot methylate prenylated peptide substrates16, and there are no known prenylated proteins in prokaryotes. Nevertheless, the binding site for AdoHcy is analogous (Extended Data Fig. 7) and the cofactor-binding domain, that is, the portion spanning from M6 of ICMT through the cap helix, shares a recognizable fold not only with regions of MaMTase but also with regions of a prokaryotic integral membrane sterol reductase that utilizes a nicotinamide adenine dinucleotide phosphate (NADP+) cofactor16,18. Evidently, this domain represents a structural motif for soluble cofactor binding to integral membrane enzymes (Extended Data Fig. 8). Other regions of the active site of ICMT have minimal similarity with MaMTase; the substrate-binding sites differ in size, amino acid composition, and membrane exposure (Fig. 3b, Extended Data Figures 7a and 8).
The monobody inhibitor of ICMT binds adjacent to the active site and interacts with portions of M5, M8, and the M6–M7 loop (Fig. 3c). The “FG loop” of the monobody, which is diversified in the combinatorial library13, dips into the membrane region and presents a tryptophan residue (Trp80) that occupies part of the crevice between M5 and M8 (Fig. 3d). It also contacts a portion of the modeled lipid. Although monobodies typically recognize native surfaces of their cognate proteins19, to evaluate whether the structure of ICMT was effected by the monobody, we determined a 4.0 Å resolution X-ray structure of ICMT without the monobody (Methods). The only discernable difference is a slight (~5°) tilting of M5, which could also be due to crystallization in detergent rather than lipidic cubic phase and/or a degree of inherent flexibility (Fig. 3e and Extended Data Fig. 3e; the overall RMSD for Cα atoms is 0.5 Å). The lengthy lipid-binding cavity and the crevice between M5 and M8 leading to it, hallmark features of the active site, are present without the monobody. The location of the monobody suggests that it would prevent prenylated substrates from reaching the active site and/or block product release. Hydrogen bonding between Ser77 of the monobody and Arg246 of ICMT may also contribute to its inhibitory function (Fig. 3d), as we predict that this residue coordinates the C-terminal carboxylate of the prenylcysteine. Although specific contacts between ICMT and cognate protein substrates are expected to be confined to their prenylcysteine moieties20–22, the positioning of the monobody adjacent to the active site and on the cytosolic side “above” the crevice between M5 and M8 may demarcate the approximate location of a protein substrate as its C-terminal prenylcysteine undergoes methylation (Fig. 3c and 4a). Hydrophobic molecules that bind in the crevice would be expected to inhibit the enzyme and this may be the mode of action of some existing ICMT inhibitors.
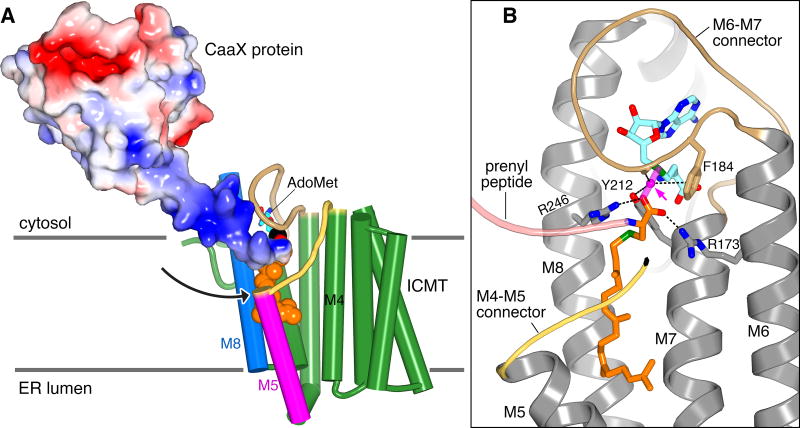
Figure 4. Substrate access and transition state models.
a, Substrate access in a hypothetical ternary complex. ICMT is depicted with cylindrical helices; AdoMet is modeled from AdoHcy. The binding of an ICMT substrate, in this case partially processed k-Ras4b (coloured molecular surface; PDB ID 5TAR) with attached geranylgeranyl group (orange spheres), is shown. An arrow denotes a plausible path for membrane-partitioned substrates to reach the active site through the crevice between M5 and M8. The hypervariable region of the substrate upstream of the CaaX motif is dark blue, indicating its basic charge in k-Ras4b. b, Transition state model. Translucent magenta sticks depict the scissile and nascent bonds, with the methyl group of AdoMet (cyan carbons) shown as a magenta sphere (arrowed). The C-terminal carboxylate of the prenylcysteine substrate (orange carbons) forms hydrogen bonds (dashes) with Arg173 and Arg246 that orient it for inline nucleophilic attack. The transition state is further stabilised by interactions (dashes) with the methyl group being transferred: a CH-O hydrogen bond with the side chain hydroxyl of Tyr212, a CH-O hydrogen bond with the backbone carbonyl oxygen of Asn185, and a CH-π interaction made with the aromatic face of Phe184. All of the amino acid side chains proposed to be involved in transition state stabilisation are perfectly conserved among ICMT enzymes. In the figure, the peptide portion of a hypothetical substrate is drawn as a pink ribbon, a portion of the M4–M5 connector is coloured yellow, and the enzyme is shown as gray ribbons with M1–M4 removed for clarity.
The protein substrates of ICMT are amphipathic; their prenyl group(s) partition into the ER membrane1 while their C-terminal carboxylate and variable protein portions are hydrophilic and exposed to the cytosol. The crevice between M5 and M8, which would be accessible to the hydrophobic core of the membrane and leads directly to the active site, provides a plausible route for prenyl entry by lateral diffusion (Fig. 4a). The positionings of the N-terminal end of M5 and M4–M5 connector create a hydrophilic depression within the membrane-embedded region of ICMT, and perhaps a concomitant depression in the proximal lipids of the bilayer (Extended Data Fig. 3c and Extended Data Fig. 9), that would accommodate the upstream peptide, as has been modeled for k-Ras4b (Fig. 4a). Suggestive of an important role, the M4–M5 connector is highly conserved and dramatically diminishes activity when mutated (Fig. 2a and Extended Data Fig. 1)12. Hydrophobic residues (Phe123, Val124, and Leu125) appear to anchor it in the membrane, while hydrophilic residues (Asn126, His127, and Ser128) give it amphipathic character (Extended Data Fig. 5a). The enzyme seemingly achieves substrate specificity by proper position, shape, proportion, and amphiphilicity of its active site.
Based on the structure of ICMT we constructed a model of a transition state (Fig. 4b). The negative-charged carboxylate of the prenylcysteine substrate, the nucleophile in the direct transfer mechanism, is coordinated and positioned for catalysis by two arginine residues, Arg173 (on M6) and Arg246 (on M8), which also provide specificity for the carboxylate. In the X-ray structure, Arg173 and Arg246 are stabilised by hydrogen bonding networks and two water molecules occupy the proposed location of the carboxylate (Extended Data Fig. 4b). Similar to other methyltransferases that use AdoMet as the methyl donor23, and supported by mutagenesis data (Extended Data Fig. 1)12, we predict that three unconventional hydrogen bonds involving carbon as the hydrogen bond donor are made with the methyl group of AdoMet to help stabilise the transition state (Fig. 4b).
A recent study indicates that ICMT has a synthetic lethal interaction with oncogenic Ras8, suggesting possible efficacy of ICMT inhibitors for Ras-driven cancer. ICMT inhibitors may also have utility in treating progeria, the pathology of which is attributed to the accumulation of a prenylated and methylated form of prelamin A at the nuclear envelope3,24. The structure would aid inhibitor development efforts. More generally, our study reveals the atomic structure of an intramembrane enzyme, a class of proteins for which a relatively small number of structures have been determined. Many enzymes that are embedded in biological membranes must facilitate the access of reactants that have drastically different physiochemical properties to a common active site and maintain them in close proximity for catalysis. The structure gives insight into how one enzyme accomplishes these complex tasks while maintaining specificity for its diverse substrates.
METHODS
Cloning, expression, and purification of ICMT
Tribolium castaneum (beetle) ICMT (UniProt accession D6WJ77) was selected as a candidate for protein purification and crystallization trials from among 76 eukaryotic ICMT orthologs that were evaluated using the fluorescence-detection size-exclusion chromatography (FSEC) pre-crystallization screening technique12,25. The cDNA (synthesized by Bio Basic) was ligated into the EcoRI and SalI restriction sites of the Pichia pastoris expression vector pPICZ-C (Invitrogen Life Technologies) and encodes of the full-length protein followed by a C-terminal antibody affinity tag (Ala-Ala-Glu-Gly-Glu-Glu-Phe) that is recognised by the anti-tubulin antibody YL1/226. For the crystals of ICMT alone, two point mutations of surface residues were introduced to improve crystallizability (G151A and E154A). Transformation into P. pastoris, expression, and cryo-lysis were performed as previously described27.
Lysed cells (40 g) were re-suspended in 200 ml of buffer containing 10 mM Tris-HCl, pH 7.5, 150 mM KCl, 2 mM tri(2-carboxyethyl)phosphine (TCEP) (Soltec Ventures; a 275 mM stock solution of TCEP was prepared in 1 M KOH to yield pH ~7.5), 2 mM CaCl2, 25 µM AdoHcy, 0.15 mg/mL deoxyribonuclease I (DNase I) (Sigma-Aldrich), 1:1000 dilution of Protease Inhibitor Cocktail Set III (EDTA free, CalBiochem), 1 mM benzamidine (Sigma-Aldrich), 0.5 mM 4-(2-aminoethyl) benzenesulfonyl fluoride hydrochloride (AEBSF) (Gold Biotechnology) and 1:1000 dilution of aprotinin (Sigma-Aldrich). Cell lysate was adjusted to pH 7.5 using 1 M KOH, 2 g decyl maltose neopentyl glycol (DMNG, Anatrace) was added to the cell lysate, and the mixture was stirred at room temperature for 45 min to extract ICMT from the membranes. The sample was then centrifuged at 43,000 g for 40 min at 12°C and the supernatant was filtered (0.22 µm polystyrene membrane (Millipore)). YL1/2 antibody (IgG, expressed from hybridoma cells and purified by ion exchange chromatrography using standard methods) was coupled to CNBr-activated Sepharose beads (GE Healthcare) according to the manufacturer’s protocol. Approximately 0.4 ml of YL1/2 antibody beads were added to the sample for each 1 g of P. pastoris cells and the mixture was rotated at room temperature for 1 h. Beads were collected on a column, washed with 4 column volumes of buffer containing 10 mM Tris-HCl, pH 7.5, 150 mM KCl, 2 mM TCEP, 2 mM CaCl2, 25 µM AdoHcy, 1 mM DMNG, and the protein was eluted with buffer containing 100 mM Tris-HCl, pH 7.5, 150 mM KCl, 2 mM TCEP, 2 mM CaCl2, 25 µM AdoHcy, 1 mM DMNG, and 5 mM Asp-Phe peptide (Sigma-Aldrich) or Glu-Glu-Phe peptide (Peptide 2.0).
ICMT-monobody co-crystallization in lipidic cubic phase
Following elution from the antibody affinity column, the protein was combined with the monobody (designated MB-15) in a 1:3 molar ratio (ICMT:monobody). The mixture was concentrated to 500 µl using a 30 kDa concentrator (Amicon Ultra, Millipore) and the ICMT-monobody complex was purified using a Superdex 200 increase size-exclusion column (GE Healthcare) in 10 mM Tris-HCl, pH 7.5, 150 mM KCl, 5 mM TCEP, 2 mM CaCl2, 25 µM AdoHcy, and 0.2 mM DMNG. The fractions corresponding to the ICMT-monobody complex and the free monobody were combined (to ensure an excess of monobody), 500 µM AdoHcy was added, and the sample was concentrated to ~10 mg/ml using a 100 kDa Vivaspin-2 concentrator (Satorius Stedim Biotech). Some of the excess monobody passed through the concentrator. Following concentration, 1 mM N-acetyl-S-geranylgeranyl-L-cysteine (AGGC, from a 100 mM stock in DMSO, Enzo Life Sciences) was added prior to crystallization.
The ICMT-monobody complex was combined with a mixture of 9.9 monoacylgylcerol (monoolein, Nu-Chek Prep, Inc.) at a ratio of 40/60% (v/v ICMT:monoolein) using a manual syringe mixer at 20°C following an established protocol14. A Gryphon LCP robot (Art Robbins Instruments) was used to dispense 50 nl mesophase drops onto 96-well glass sandwich plates (Marienfeld). The LCP boluses were overlaid with 800 nl precipitant solution. Drops were sealed with a glass coverslip, incubated at 20°C, and periodically imaged using a RockImager (Formulatrix). The precipitant solution for the best crystal consisted of 30% PEG 400, 100 mM NaCl, and 100 mM Na HEPES, pH 7.5. Crystals also grew in other salts, including 100 mM LiSO4 and 100 mM AmSO4. Crystals appeared after 1 day and reached ~30–60 µm in size within 2–3 days. To harvest the LCP crystals, the glass coverslip was scored using a glass cutter, the LCP bolus was overlaid with ~2 µl of additional precipitant solution, the crystals were harvested using MiTeGen MicroMounts, and they were plunged into liquid nitrogen.
Crystallization in detergent
ICMT was purified as described above except that 1 mg/ml total brain lipids (Avanti) were added to the purification buffers. The elution from the antibody affinity column was concentrated to 500 µl using a 50 kDa concentrator (Amicon Ultra; Millipore) and applied to a Superdex 200 Increase size exclusion column (GE Healthcare) that was equilibrated in 10 mM Tris-HCl, pH 7.5, 150 mM KCl, 5 mM TCEP, 2 mM CaCl2, 25 µM AdoHcy, 1 mM DMNG, and 0.02 mg/ml total brain lipids. Fractions containing ICMT were pooled, supplemented with 500 µM AdoHcy, and concentrated to 5–10 mg/ml using a 50 kDa concentrator (Vivaspin-2; Sartorius). ICMT crystals were obtained by vapor diffusion (using 300 nl of ICMT and 300 nl of crystallization solution and a Mosquito crystallization robot, TTP Labtech) over reservoirs containing 100 µl of precipitant solution. The crystals were obtained from 24–28% PEG400 (v/v), 200 mM CaCl2 or 200 mM MgCl2, 50 mM Na acetate, pH 5.0–6.5, at 4°C and reached a size of ~100–400 µm within 2–3 weeks. The crystals were then transferred through a series of five steps using the components of an equilibrated drop to increase the PEG 400 concentration to 35% before flash-cooling in liquid nitrogen.
Monobody generation
General methods for phage- and yeast-display library sorting and gene shuffling have been described13,28. His10-tagged beetle ICMT protein, purified from P. pastoris and solubilised in 10 mM Tris-HCl, pH 7.5, 150 mM NaCl, 25 µM AdoHcy, 50 µM AGGC and 1 mM DMNG was mixed with an equimolar concentration of BTtrisNTA, a high-affinity His-tag ligand conjugated with biotin29, so as to capture the target proteins with streptavidin magnetic beads in phage-display selection and to detect them with fluorescent dye-labeled streptavidin in yeast surface display experiments30. Two separate monobody libraries, denoted "loop" and "side," were used to generate monobodies with diverse binding-surface topography13. Four rounds of phage-display library sorting were performed using the target concentrations of 100, 100, 100 and 50 nM, for the first, second, third and fourth rounds at room temperature. Three rounds of yeast display library sorting using a fluorescence-activated cell sorter (FACSAria, BD) were performed. The first round was to enrich clones that did not bind to 500 nM BTtrisNTA but without ICMT (negative sorting), and the second and third rounds were to enrich clones that bound to 500 nM and 250 nM ICMT-BTtrisNTA complex (positive sorting). Target binding of individual clones were tested using yeast display and three were selected for purification. The monobody proteins were expressed in E. coli using expression vector pHBT that adds an N-terminal His6 tag followed by a biotin-acceptor tag and a TEV cleavage site31. Cocrystallization with one of these monobodies (designated MB-15) yielded well-diffracting crystals. For purification of MB-15, frozen cells were mechanically lysed in a mixer mill (Retsch model PM 100; 8 × 3 min at 400 rpm) using steel balls. Lysed cells (6 g) were re-suspended in 50 ml of buffer containing 50 mM Tris-HCl, pH 8.0, 500 mM NaCl, 0.2 mg/mL DNase I and 200 µM AEBSF. The mixture was stirred at 4°C for 30 min. The sample was then centrifuged at 43,000 g for 30 min at 4°C and the supernatant was filtered (0.22 µm polystyrene membrane, Millipore). The supernatant was applied to a column containing 4 ml of immobilised metal affinity chromatography resin charged with cobalt (TALON; BD Biosciences), the resin was washed with 7.5 column volumes of buffer containing 20 mM Tris, pH 8.0, 500 mM NaCl, and the protein was eluted with buffer containing 20 mM Tris, pH 8.0, 500 mM NaCl, and 300 mM imidazole, pH 8.0. Following elution, 5 mM EDTA (pH 8.0) was added and the samples were centrifuged (43,000 g, 10 min, 17°C) to pellet any precipitated protein. The N-terminal affinity tag was removed by treatment with TEV protease (4°C, 1:20 ratio [wt/wt, TEV:monobody] for 16 h and an additional 1:40 ratio for 8 h). The amino sequence of MB-15 is:
MKHHHHHHSSGLNDIFEAQKIEWHEENLYFQGSVSSVPTKLEVVAATPTSLLISWDAPAVTVDLYVITYGETGGNSPVQEFKVPGSKSTATISGLKPGVDYTITVYAFSSYYWPSYKGSPISINYRT
The underlined portion indicates the peptide removed by TEV cleavage. Purified MB-15 was stored at −80°C until use.
Structure determination
X-ray data were collected at beamlines 23ID-D and 24ID-C of the Advanced Photon Source (APS) (Argonne, Illinois). Diffraction data were collected using an oscillation angle of 0.3° and high redundancy was obtained by collecting data from multiple locations throughout the crystals. For phasing of the ICMT-monobody complex, Se-Met labeled ICMT protein was generated by producing the enzyme in High Five insect cells (Invitrogen) using a baculovirus system using standard techniques. Diffraction data were processed using the HKL3000 suite32. The crystals diffracted X-rays to 2.3 Å resolution and each asymmetric unit contains one ICMT-monobody complex. Initial experimental phases (35 – 4 Å) for the ICMT-monobody complex (space group P212121) were determined using the SIRAS phasing method in SHARP and improved using solvent flattening33. Five Se-Met sites were located and correspond to the five methionine residues of ICMT. Electron density for the monobody was discontinuous in these maps. The monobody was placed in the asymmetric unit using molecular replacement (using an ensemble of monobody structures, PDBID: 3UYO, 1FNA, 2QBW, 2OCF, and a homology model of MB-15 based on PDBID 3UYO) in Phaser34. At this point, well-defined electron density was observed for the entire complex. The atomic model was constructed using Coot and improved through iterative cycles of refinement using CNS and PHENIX35–37. Model validation was performed with MolProbity38. Each unit cell contains one ICMT-monobody complex. Data collection, phasing, and refinement statistics are shown as Extended Data Table 1.
The structure of ICMT in the absence of the monobody (space group C2221) was determined by molecular replacement using the refined 2.4 Å resolution structure of ICMT from the monobody complex as a search model in Phaser34. X-ray diffraction from the crystal of ICMT without monobody was anisotropic and the dataset was truncated to 4.2 Å resolution along b* using the Diffraction Anisotropy Server39. The electron density maps from Phaser showed continuous electron density throughout the model and indicated slight tilting of M5. The model was adjusted accordingly in Coot and refined in Phenix36,37. A composite simulated-annealing omit electron density map was constructed using Phenix36 and this map confirmed that the only discernable difference in the overall structure was the tilting of M5 (Fig. 3e, Extended Data Fig. 3e). Molecular graphics figures were prepared using PyMOL (www.pymol.org).
Enzymatic assay
The catalytic activity of ICMT was measured using a previously described assay, with slight modifications, to monitor [3H]methyl incorporation into biotin-S-farnesyl-L-cysteine (BFC)11,12. For these assays, ICMT was either purified (as described above; using 0.2 mM DMNG detergent) or present as a GFP fusion protein in HEK293 cell lysate12 (GFP was fused to the N-terminus and an AAEGEEF tag was present on the C-terminus). For experiments using GFP-tagged ICMT, the preparation of the cell lysate and the determination of the ICMT concentration from the GFP fluorescence were as previously described12. The enzyme, either as purified ICMT in DMNG detergent or as GFP-ICMT in HEK293 cell lysate, was diluted into reaction buffer containing 150 mM NaCl, 5 mM MgCl2, 1mM DTT, and 100 mM HEPES pH 7.4 to yield an ICMT protein concentration of approximately 10 nM. For experiments using purified protein, the reaction buffer was supplemented with 10 µM DMNG. For the initial velocity curves, the data were fit using GraphPad Prism 7 software as previously described 12. For experiments used to study the effect of the monobody on activity (Extended Data Fig. 2f–g), enzymatic assays were performed with varying concentrations of monobody and a fixed amount (~10 nM) of enzyme, using either purified beetle ICMT or one of the following GFP-tagged ICMT orthologs in HEK293 cell lysate: beetle ICMT, human ICMT, or Anopheles gambiae ICMT12. 5 µM BFC and 4 µM AdoMet were used in these assays.
For initial velocity curves, the data were fit to the following models using least squares nonlinear regression with GraphPad Prism 7 software:
- For the initial velocity versus AdoMet concentration curves, a Michaelis-Menten model was used.
(1) - For the initial velocity versus BFC concentration curves when substrate inhibition was not observed, an allosteric sigmoidal model was used.
(2) - For the initial velocity versus BFC concentration curves when substrate inhibition was observed, an allosteric sigmoidal model that takes into account substrate inhibition was used.
(3)
In these equations Y is the initial velocity, X is the substrate concentration, h is the Hill coefficient, Vmax is the maximum enzyme velocity, Khalf and Km are the concentrations of half-maximal velocity for sigmoidal and Michaelis-Menten models, respectively, and Ki is the inhibition constant. For experiments where the concentration of BFC was varied, 5 µM AdoMet was used. For experiments where the concentration of AdoMet was varied, 4 µM BFC was used. To account for the background activity due to endogenous human ICMT in the HEK293 cell lysate, initial velocity curves were constructed using lysate from cells transfected with GFP alone and subtracted for all analyses. The effective BFC concentration was corrected for the small amount of BFC that binds to plastic ware used in the assay as described12.
FSEC and Western analysis of ICMT using a cleavable M1–M2 linker
cDNA encoding beetle ICMT was cloned into the pNGFP-EU expression vector26 using the EcoRI and SalI restriction sites to create an ICMT construct with a 6× His tag and green fluorescent protein (GFP) fused to the N-terminus (HIS-GFP-ICMT). A PreScission protease (PS) cleavage site and several flanking amino acids were inserted into the loop between the M2 and M3 helices (introduced between Asn58 and Glu59 to yield the final sequence Asn58-SGSSGSLEVLFQGPSAGGSAGAAS-Glu59, where the underlined region is the PS site) using standard molecular biology techniques. These constructs, with or without the cleavage site, were expressed by transient transfection in HEK293 cells (~ 1.5 × 10⁶ cells using Lipofectamine 2000, Invitrogen) for 48 h. The cells were pelleted (500 ×g) and re suspended in 300 µL of buffer consisting of 50 mM NaH2PO4, pH 7.5, 190 mM NaCl, 10 mM KCl, 20 mM DTT, 200 µM AdoHcy, 40 mM dodecyl maltoside (DDM, Anatrace) detergent and 1:500 dilution of Protease Inhibitor Cocktail Set III, EDTA-free (CalBiochem). Samples were rotated for 1 h at 4°C to allow for detergent-extraction of ICMT from membranes, and then were centrifuged at 20,800 ×g for 1 h at 4°C. The supernatants, which contained detergent-solubilized ICMT, were divided into two portions. 2 µg PreScission protease (made in-house, but available from GE Healthcare) was added to one of these. The samples were incubated for 2 h at 4°C and analyzed by anti-HIS Western blot (Anti-HIS6 antibody, Roche Cat. # 04905318001) and by FSEC26, using a Superose 6 column (GE Healthcare). The running buffer for FESC was: 20 mM NaH2PO4, pH 7.5, 190 mM NaCl, 10 mM KCl, 5 mM DTT, and 1 mM DDM.
Data availability
Atomic coordinates and structure factors have been deposited in the Protein Data Bank (PDB) with accession numbers 5V7P (ICMT-monobody) and 5VG9 (ICMT alone).
Extended Data
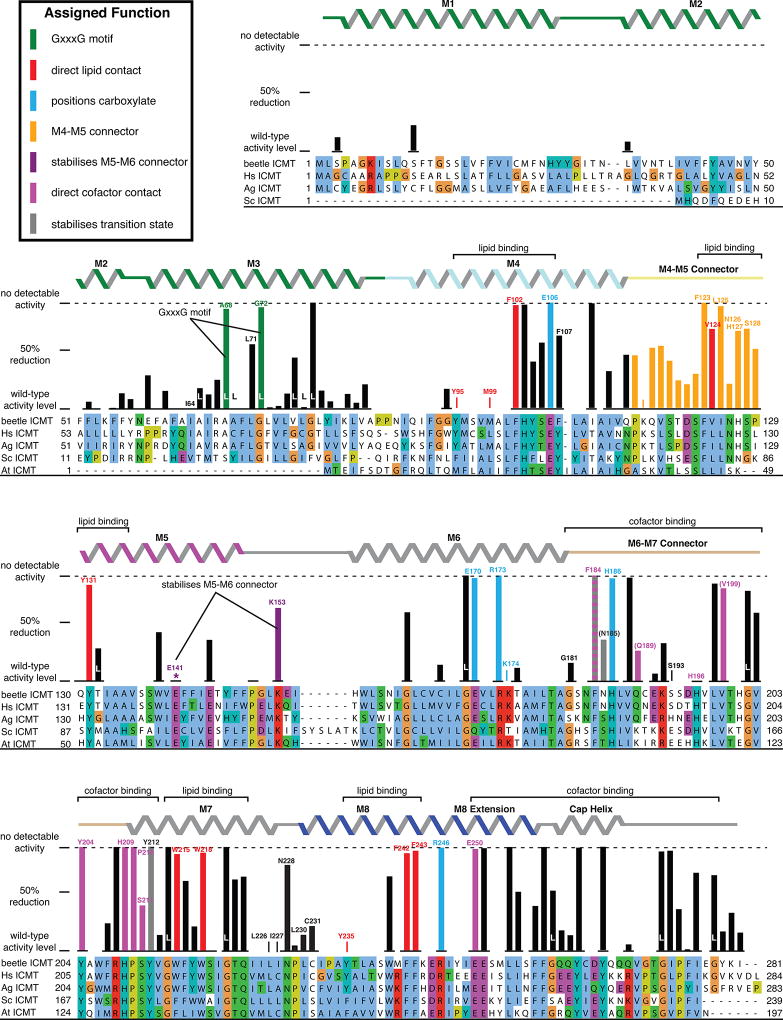
Extended Data Figure 1. The structure identifies functions for key residues.
ICMT is displayed as a progression from primary sequence alignment, to the effects of scanning mutagenesis (bar graphs), to observed secondary structure (α-helices depicted as ribbons), to the assigned role of amino acids. Results from scanning mutagenesis experiments12 are plotted above the sequence alignment as a bar graph showing the reduction of specific activity in comparison to wild-type ICMT, with 0% representing wild-type activity and 100% reflecting no detectable activity (indicated by a horizontal dashed line). The secondary structure is coloured according to Figure 4a. The inset key denotes the colouring of the bar graph according to the functional role of the amino acid inferred from the atomic structure. Labeled brackets above the secondary structure denote the general function of the indicated regions of the primary sequence. The colouring of the bar graph is the following: amino acids that contact AdoHcy are magenta; parentheses indicate hydrogen bonds to backbone atoms. Amino acids that line the lipid-binding cavity are red. Arginine residues that are proposed to form hydrogen bonds with the carboxylate of the prenylcysteine substrate, and the residues that position them, are coloured blue. Residues proposed to form hydrogen bonds to the methyl of AdoHcy in the transition state are coloured grey. Hydrogen bonds made with backbone atoms are indicated by parentheses surrounding the amino acid label. The mutagenesis data are derived from Diver and Long12 from experiments using Anopheles gambiae ICMT, and are normalised for expression level. Except where noted, the mutations were alanine substitutions. In some cases, leucine substitutions were made, as indicated by the letter “L” (e.g. when the wild-type amino acid was a glycine or alanine). The data represent triplicate measurements for each mutate and have an average standard deviation of +/− 11%. Gaps in the bar graph indicate amino acid positions that were not analyzed by mutagenesis. Based on size-exclusion chromatography that was performed for each of the mutants, only the E141A mutation was found to be notably destabilising (asterisk). A few mutations increased the activity relative to wild-type; these are also depicted at the 0% reduction level. The amino acid sequences included in the alignment are: Tribolium castaneum ICMT (beetle ICMT), and human (Hs), Anopheles gambiae (Ag), Saccharomyces cerevisiae (Sc), and Arabidopsis thaliana (At) orthologs, with UniProt accession numbers: D6WJ77, O60725, Q7PXA7, P32584, Q93W54, respectively. The alignment is coloured according to the ClustalW convention.
Extended Data Figure 2. Enzymatic activity and monobody inhibition of beetle ICMT.
a, Schematic of the ICMT reaction. Gray region represents the ER membrane. “R” denotes the protein portion of the substrate. In the minimal substrate AGGC, “R” is an acetyl group. For biotin-S-farnesyl-L-cysteine (BFC), “R” is a biotin group. b–e, Activity of beetle ICMT, purified in DMNG detergent (b and c), or in cell lysate (d and e), shown as a plot of the formation of BFC-[3H]methyl ester as a function of BFC concentration (b and d) or AdoMet concentration (c and e). For assays using HEK293 cells (d–e), ICMT was expressed as a fusion protein with green fluorescent protein (GFP) in order to quantify the amount of enzyme in the cell lysate (Methods). f, Kinetic parameters determined from the curves in (b–e). Best-fit values (calculated in GraphPad Prism 7 software) are reported with the standard error of the fit. We observed a degree of substrate inhibition at higher concentrations of BFC (Ki ~40 µM) when using ICMT in detergent (b and f), which may be due to a dispersive nature of BFC when it exceeds the detergent concentration (10 µM). g, Dose-response curve showing the inhibitory effects of the monobody on the activity of purified beetle ICMT in detergent. h, Comparison of the effects of the monobody on the activities of beetle, human (Hs), and Anopheles gambiae (Ag) ICMT enzymes in HEK293 cell lysates. GFP-ICMT fusion proteins were used for the three orthologs and the concentration of each enzyme was determined using the fluorescence of GFP (Methods). The monobody inhibited beetle ICMT with an IC50 of ~7 µM in this assay, whereas no detectable inhibition of Hs or Ag ICMT was observed. Individual data points are shown on the graphs (b–e and g–h).
Extended Data Figure 3. Electron density maps and crystal lattice.
a, Stereo representation of the electron density for the ICMT-monobody complex (blue mesh, 2Fo - Fc, 1.1 σ contour, calculated from 35 to 2.3 Å resolution) drawn around the atomic model (stick representation). The monobody is coloured magenta; ICMT is tan. b, Electron density for the lipid in the active site from a composite simulated annealing omit electron density map (2Fo-Fc, contoured at 1 σ and calculated from 35 – 2.3 Å resolution). The density would accommodate a geranylgeranyl lipid (orange sticks), as shown in this figure. c, Electron density (blue mesh; 2Fo-Fc map contoured at 1 σ) for ordered monoolein lipids (magenta sticks) around ICMT. Monoolein lipids surround the transmembrane region of ICMT and collectively resemble a bilayer with typical thickness (arrows). The positioning of monoolein lipids in the vicinity of the M4–M5 connector (yellow) are consistent with the hypothesis that the enzyme would cause a slight depression in the membrane in this region, as illustrated in Extended Data Figure 9. d, Crystal lattice in the ICMT-monobody complex, with ICMT coloured and the monobody in gray. e, A composite omit electron density map (2Fo-Fc, contoured at 1 σ and calculated from 35 – 4.0 Å resolution) for the X-ray structure of ICMT without the monobody. The composite omit maps, which reduce model-bias, were obtained using Phenix36.
Extended Data Figure 4. Interactions with the M5–M6 connector, interactions with active site arginine residues, and cross-section of the active site.
a, Interactions between the M5–M6 and M7–M8 connectors. The side chains of Glu141 (on M5) and Lys153 (on the M5–M6 connector) form hydrogen bonds (dashed lines) that cap the C-terminal end of M7 and the N-terminal end of M8, respectively. Portions of the amino acids involved are drawn as sticks. Parentheses indicate hydrogen bonds made with backbone atoms. The colouring is: carbon, gray; nitrogen, blue; oxygen, red. b, Hydrogen bonding network involving Arg173 and Arg246. Bonds (dashed lines) are made with surrounding amino acids (labeled sticks) and two water molecules (red spheres) in the active site. c, Cutaway view of the molecular surface of ICMT (gray), showing labeled regions of the active site. The view is approximately orthogonal to that shown in Fig. 2a. AdoHcy is drawn as sticks; approximate boundaries of the membrane are indicated by horizontal bars.
Extended Data Figure 5. The M4–M5 connector.
a, Close up view of the M4–M5 connector with side chains depicted on it (sticks). ICMT is predominately gray, with the M4–M5 connector coloured yellow. Amino acids that interact with Phe123 (Ile64, Leu71, and Phe107) are coloured grey. b, The N-terminal end of the M5 helix is capped by Ser128. The side chain of Ser128 is shown, in stick representation, with the hydrogen bond to the backbone nitrogen atom of Tyr131 indicated by a dotted line.
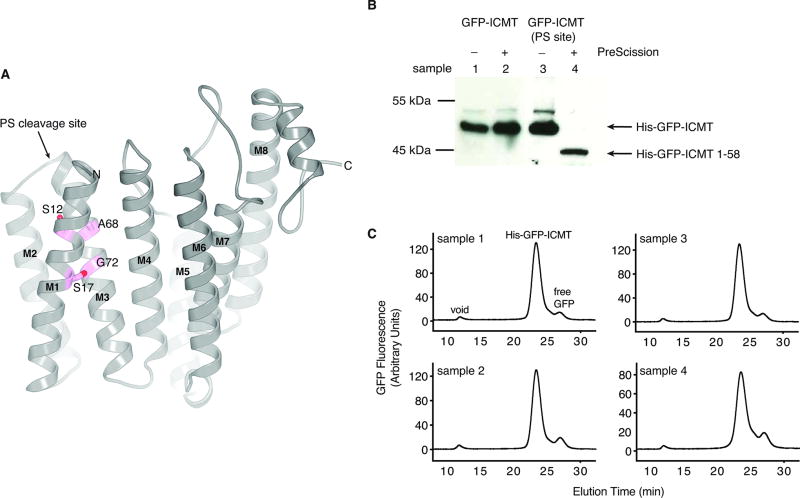
Extended Data Figure 6. The M1–M2 portion of ICMT is an integral part of the enzyme.
a, GxxxG packing motif between helices M1 and M3 of ICMT. Residues on M1 and M3 that make contacts between these helices are drawn as sticks and coloured magenta. Because the M1 and M2 helices are not present in Saccharomyces cerevisiae ICMT enzyme, we hypothesize that the GxxxG motif that is present in the first transmembrane helix of yeast ICMT (equivalent to M3 of beetle ICMT) may cause dimerization of the yeast enzyme through packing of these helices41, whereas ICMT enzymes that contain M1 and M2, which includes human and beetle ICMT, are monomeric. The location of a PreScission protease cleavage site (PS site) that was inserted in the connection between the M2 and M3 helices (introduced at Asn58) for experiments outlined in this figure is indicated. b, Anti-HIS western blot showing that the PS site can be cleaved by PreScission protease. In this experiment, ICMT is expressed in HEK293 cells with an N-terminal HIS-GFP tag (HIS-GFP-ICMT), with or without the PS site. The addition of PreScission protease to detergent-solubilised sample 4 (HIS-GFP-ICMT with the PS site), but not control samples 1–3, results in a cleavage product consisting of HIS-GFP followed by amino acids 1–58 of ICMT (HIS-GFP-ICMT 1–58), which is detected by anti-HIS Western blot. This confirms that the loop connecting the M2 and M3 helices is cut by the protease. Samples 1–3 are control experiments, as indicated. For gel source data, see Supplementary Figure 1. c, FSEC profiles of the samples evaluated by western blot in (b) and numbered accordingly. Elution volumes for the void, HIS-GFP-ICMT, and free GFP are indicated on the plot for sample 1. The cleavage of the M2–M3 loop by PreScission protease does not alter the elution profile (sample 4) in comparison to the other samples, which indicates that the cleaved portion (HIS-GFP-ICMT 1–58) is associated with the remainder of the enzyme via non-covalent interactions. No replicates of these experiments were performed.
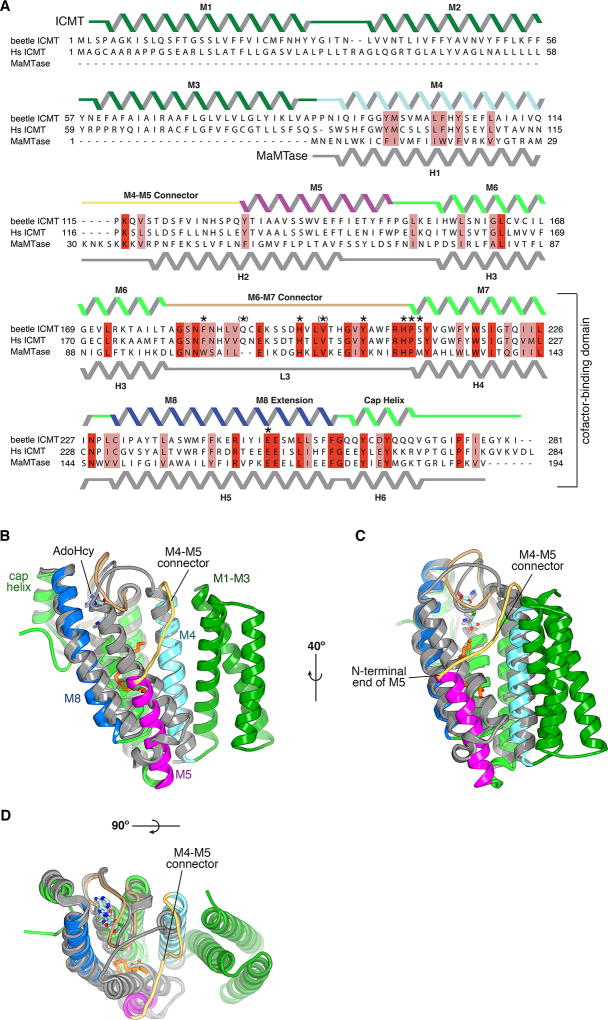
Extended Data Figure 7. Comparison of ICMT and MaMTase.
a, Sequence alignment between beetle ICMT, human (Hs) ICMT, and MaMTase (referred to as Ma-ICMT in 16). In the alignment, red colouring indicates identical residues and pink indicates similar ones. The secondary structures of ICMT and MaMTase (PDB ID 4A2N) are shown above and below the alignment, respectively. The region of highest sequence conservation corresponds to the cofactor-binding domain (bracketed); elsewhere there is low sequence similarity. Asterisks indicate amino acids of ICMT that contact AdoHcy; surrounding parentheses, were present, indicate that hydrogen bonds are made with backbone atoms. b–d, Superposition of the structures of beetle ICMT and MaMTase, shown from three vantage points in cartoon representations. ICMT is coloured according to the colouring of its secondary structure in a; MaMTase is coloured gray.
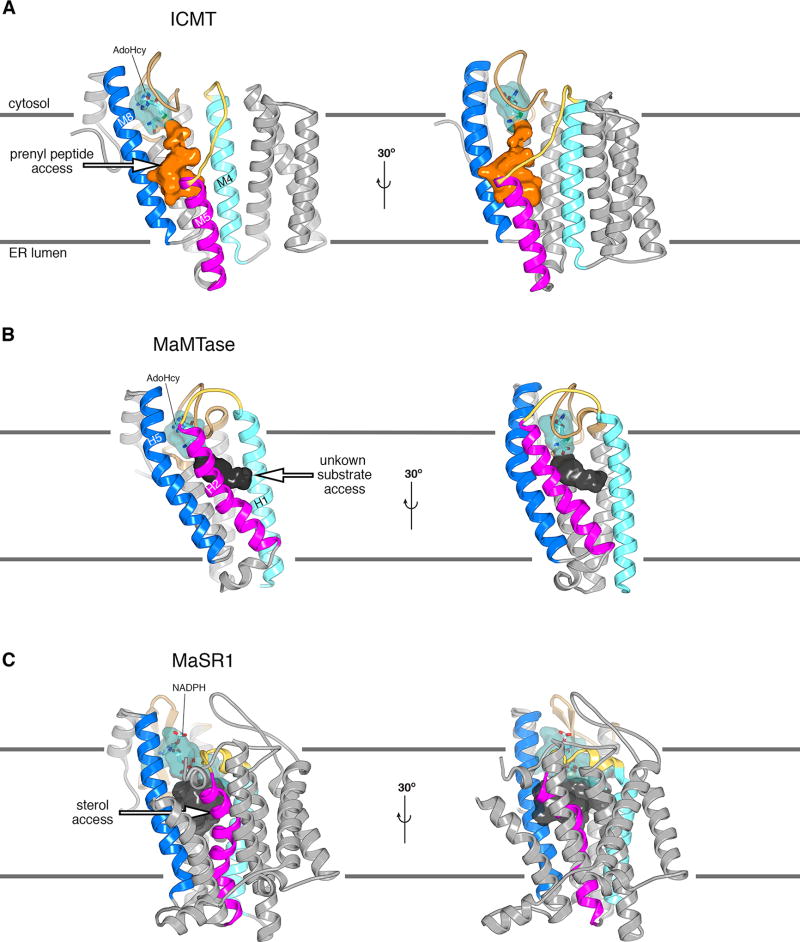
Extended Data Figure 8. Comparison of the active sites of ICMT, MaMTase and MaSR1.
a, Two orientations of the overall structure of ICMT are shown with the active site depicted as a molecular surface. The portion that binds AdoHcy is coloured cyan and is partially transparent to reveal a stick representation of the cofactor. The cavity that would be exposed to the membrane and forms the presumed binding site of the prenylcysteine moiety of the substrate is coloured orange. An arrow marks a pathway by which the prenyl group of the substrate could reach the active site via the membrane. Horizontal lines denote the approximate boundaries of the ER membrane. b, Overall structure of MaMTase (a prokaryotic integral membrane methyltransferase previously termed “Ma-ICMT” in 16, PDB ID: 4A2N) shown in two orientations, which were obtained by superposing with ICMT. A cavity, denoting the active site, is drawn as a molecular surface. The portion in which AdoHcy binds is coloured cyan; the remainder is dark grey and likely represents the binding site of its biological substrates, which are unknown. Structural elements are coloured as for ICMT in a. The cavity is exposed to the membrane on the opposite side of the enzyme relative to ICMT. Instead of having a crevice between the magenta- and dark blue-coloured helices like ICMT (H2 and H5 of MaMTase, which roughly correspond to M5 and M8 of ICMT, respectively), MaMTase has a crevice between H1 (light blue) and H2 (magenta), suggesting that its substrates access it from the “right” (arrow) rather than from the “left”. In ICMT, this route is blocked by the M4–M5 linker. The dimensions of the cavity in MaMTase and its exposure to the membrane suggest that the substrates of MaMTase are hydrophobic molecules with smaller dimensions than a farnesyl or geranylgeranyl prenyl group. c, Overall structure of the prokaryotic integral membrane sterol reductase MaSR1 (PDB ID: 4QUV)18. The orientation is based on superposition of the cofactor binding domain with ICMT, with corresponding colouring. The carbon atoms of a bound NADPH cofactor are coloured cyan. A crevice between the magenta- and dark blue-coloured helices may serve as access for lipophilic sterol substrates (arrow)18.
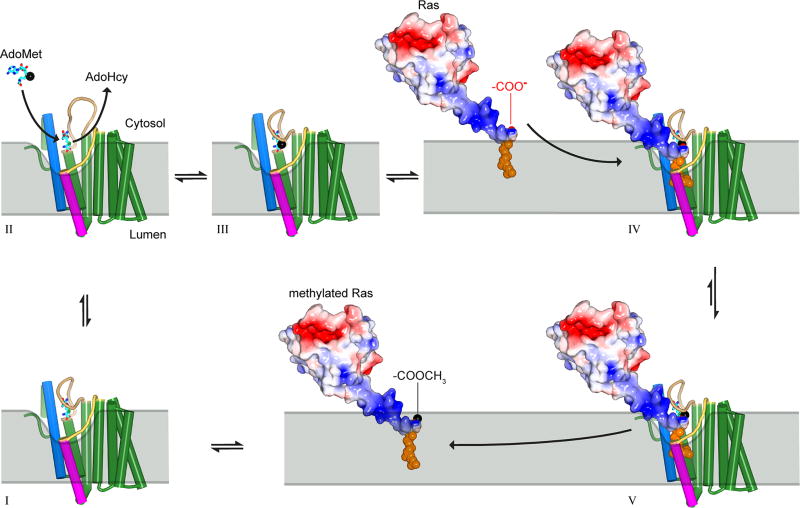
Extended Data Figure 9. Proposed reaction cycle for ICMT.
Major steps along the reaction coordinate (I–V). From the AdoHcy-bound state (I), a hinged displacement of the M6–M7 connector loop (II) allows release of AdoHcy and exchange for AdoMet from the cytosol (III). The C-terminal prenyl group of the substrate is located within the ER membrane prior to methylation, as depicted for k-Ras4b in the figure, and approaches the enzyme by two-dimensional diffusion within the membrane. The prenylcysteine reaches the active site by passing between the M5 and M8 helices (coloured magenta and blue in the figure, respectively). In the ternary complex (IV), substrate-enzyme contacts are limited to interactions with the prenyl group and the C-terminal carboxylate, giving rise to specificity for these elements within the context of a wide range of protein substrates. A cytosolic cleft above the M5–M8 crevice that leads to the active site accommodates the polar C-terminal peptide of protein substrates (e.g. the polybasic region of k-Ras4b, coloured blue in the figure). The inhibitory monobody occupies this region. Catalysis proceeds from the ternary complex, and the product, made more lipophilic by methylation and neutralization of a negative charge, is able to diffuse into the ER membrane (V). ICMT is show as a cartoon with helices drawn as cylinders and the AdoHcy/AdoMet cofactors depicted as cyan sticks. A black sphere indicates the methyl group of AdoMet. Prenylated k-Ras4b (based upon PDB ID 5TAR42) is depicted as a molecular surface and coloured according to electrostatic potential (red, negative; blue, positive) with its prenyl group shown as orange spheres. The ER membrane is depicted in gray and curved in the vicinity of the active site to suggest that the enzyme might modulate the local distribution of lipid molecules to facilitate substrate access.
Extended Data Table 1.
Data collection, phasing and refinement statistics. Data collection statistics are from HKL300032; phasing statistics are from SHARP33; refinement statistics are from PHENIX36. CC1/2 is defined in40; Clash Score is defined in38. Rsym = Σ | Ii - < Ii > | / Σ Ii, where < Ii > is the average intensity of symmetry-equivalent reflections. Phasing power = RMS (|F|/ε), where |F| is the heavy-atom structure factor amplitude and ε is the residual lack of closure error. Rcullis is the mean residual lack of closure error divided by the dispersive or anomalous difference. R-factor = Σ | Fo – Fc | / Σ | Fo |, where Fo and Fc are the observed and calculated structure factors, respectively. Rfree = R-factor calculated using a subset (~ 5%) of reflection data chosen randomly and omitted throughout refinement. Numbers in parentheses indicate the highest resolution shells and their statistics.
| ICMT-monobody Native |
ICMT-monobody SeMet |
ICMT Native |
|
|---|---|---|---|
| Data Collection | APS 24-ID-C | APS 23-ID-D | APS 23-ID-D |
| Space group | P212121 | P212121 | C2221 |
| Wavelength (Å) | 0.9790 | 0.9791 | 1.0332 |
| Cell dimensions: | |||
| a, b, c (Å) | 40.6, 87.7, 147.7 | 40.8, 88.7, 148.4 | 51.6, 123.6, 236.1 |
| α, β, γ (°) | 90, 90, 90 | 90, 90, 90 | 90, 90, 90 |
| Resolution (Å) | 31 – 2.3 (2.34 – 2.3) | 40 – 3.0 (3.05 – 3.0) | 33 – 4.0 (4.07 – 4.0) |
| No. of crystals | 1 | 9 | 1 |
| Rmerge (%) | 20.6 (97.9) | 64.2 (>100.0) | 7.1 (>100.0) |
| Rsim (%) | 6.2 (29.5) | 9.6 (57.0) | 1.2 (34.0) |
| I/σI | 13.3 (2.5) | 15.5 (2.0) | 85 (3.0) |
| Completeness (%) | 97.2 (99.8) | 100.0 (100.0) | 100.0 (100.0) |
| Redundancy | 11.2 (11.1) | 45.7 (47.9) | 34.6 (35.6) |
| SIRAS Phasing | 30 – 4.0 Å | ||
| No. of sites | 5 | ||
| Phasing Power (iso / ano) | 0.129/0.292 | ||
| Rcullis (iso / ano) (%) | 95.5/97.5 | ||
| Figure of Merit (acentric / centric) | 0.183/0.047 | ||
| Refinement | |||
| Resolution (Å) | 31 – 2.3 (2.4 – 2.3) | 33 – 4.0 (5.0 – 4.0) | |
| No. of reflections | 23,203 | 6,119 | |
| Rwork (%) | 21.4 (26.9) | 36.9 (45.0) | |
| Rfree (%) | 24.6 (32.2) | 38.9 (42.2) | |
| No. atoms | |||
| Protein | 3039 | 2250 | |
| Ligands | 319 | 26 | |
| Water | 92 | ||
| Average B-factors (Å2) | |||
| Protein | 33.4 | 209.6 | |
| Ligands | 58.6 | 200.7 | |
| Water | 38.7 | ||
| Ramachandran (%) | |||
| Favoured | 98.1 | 97.3 | |
| Outliers | 0.0 | 0.0 | |
| R.m.s. deviations | |||
| Bond lengths (Å) | 0.003 | 0.004 | |
| Bond angles (°) | 0.595 | 0.745 | |
| Clash Score | 2.3 | 24 |
Supplementary Material
Acknowledgments
We thank D. Julius, C.D. Lima, M. Luo, N.P. Pavletich, R.K. Hite, S. Shuman and members of the laboratory for discussions. Beamlines 24-ID and 23-ID at the Advanced Photon Source are supported by NIH grants ACB-12002, AGM-12006, P41 GM103403, and S10 RR029205, under DOE contract No. DE-AC02-06CH11357. This work was supported, in part, by an American Heart Association Pre-doctoral Fellowship (M.M.D.), a Burroughs Wellcome Career Award (S.B.L), the Geoffrey Beene Cancer Research Center at MSKCC (S.B.L.), a core facilities support grant to MSKCC (P30 CA008748), and NIH grant U54-GM087519 (S.K.).
Footnotes
Author Contributions M.M.D. and L.P. expressed, purified, and crystallized proteins. A.K. and S.K. developed monobodies. M.M.D. performed all other experiments. M.M.D. and S.B.L. designed experiments, determined structures, analyzed results, and prepared the manuscript with contributions from all authors.
The authors declare no competing financial interests.
References
- 1.Wang M, Casey PJ. Protein prenylation: unique fats make their mark on biology. Nature reviews. Molecular cell biology. 2016;17:110–122. doi: 10.1038/nrm.2015.11. [DOI] [PubMed] [Google Scholar]
- 2.Dai Q, et al. Mammalian prenylcysteine carboxyl methyltransferase is in the endoplasmic reticulum. J Biol Chem. 1998;273:15030–15034. doi: 10.1074/jbc.273.24.15030. [DOI] [PubMed] [Google Scholar]
- 3.Ibrahim MX, et al. Targeting isoprenylcysteine methylation ameliorates disease in a mouse model of progeria. Science (New York, NY) 2013;340:1330–1333. doi: 10.1126/science.1238880. [DOI] [PMC free article] [PubMed] [Google Scholar]
- 4.Court H, Ahearn IM, Amoyel M, Bach EA, Philips MR. Regulation of NOTCH signaling by RAB7 and RAB8 requires carboxyl methylation by ICMT. J Cell Biol. 2017 doi: 10.1083/jcb.201701053. [DOI] [PMC free article] [PubMed] [Google Scholar]
- 5.Berndt N, Hamilton AD, Sebti SM. Targeting protein prenylation for cancer therapy. Nature reviews. Cancer. 2011;11:775–791. doi: 10.1038/nrc3151. [DOI] [PMC free article] [PubMed] [Google Scholar]
- 6.Cox AD, Fesik SW, Kimmelman AC, Luo J, Der CJ. Drugging the undruggable RAS: Mission Possible? Nature Reviews Drug Discovery. 2014;13:828–851. doi: 10.1038/nrd4389. [DOI] [PMC free article] [PubMed] [Google Scholar]
- 7.Lau HY, Tang J, Casey PJ, Wang M. Isoprenylcysteine carboxylmethyltransferase is critical for malignant transformation and tumor maintenance by all RAS isoforms. Oncogene. 2017 doi: 10.1038/onc.2016.508. [DOI] [PMC free article] [PubMed] [Google Scholar]
- 8.Wang T, et al. Gene Essentiality Profiling Reveals Gene Networks and Synthetic Lethal Interactions with Oncogenic Ras. Cell. 2017;168:890–903.e815. doi: 10.1016/j.cell.2017.01.013. [DOI] [PMC free article] [PubMed] [Google Scholar]
- 9.Wright LP, et al. Topology of mammalian isoprenylcysteine carboxyl methyltransferase determined in live cells with a fluorescent probe. Molecular and cellular biology. 2009;29:1826–1833. doi: 10.1128/MCB.01719-08. [DOI] [PMC free article] [PubMed] [Google Scholar]
- 10.Romano JD, Michaelis S. Topological and mutational analysis of Saccharomyces cerevisiae Ste14p, founding member of the isoprenylcysteine carboxyl methyltransferase family. Molecular Biology of the Cell. 2001;12:1957–1971. doi: 10.1091/mbc.12.7.1957. [DOI] [PMC free article] [PubMed] [Google Scholar]
- 11.Baron RA, Casey PJ. Analysis of the kinetic mechanism of recombinant human isoprenylcysteine carboxylmethyltransferase (Icmt) BMC biochemistry. 2004;5:19. doi: 10.1186/1471-2091-5-19. [DOI] [PMC free article] [PubMed] [Google Scholar]
- 12.Diver MM, Long SB. Mutational analysis of the integral membrane methyltransferase isoprenylcysteine carboxyl methyltransferase (ICMT) reveals potential substrate binding sites. Journal of Biological Chemistry. 2014;289:26007–26020. doi: 10.1074/jbc.M114.585125. [DOI] [PMC free article] [PubMed] [Google Scholar]
- 13.Koide A, Wojcik J, Gilbreth RN, Hoey RJ, Koide S. Teaching an old scaffold new tricks: monobodies constructed using alternative surfaces of the FN3 scaffold. J Mol Biol. 2012;415:393–405. doi: 10.1016/j.jmb.2011.12.019. [DOI] [PMC free article] [PubMed] [Google Scholar]
- 14.Caffrey M, Cherezov V. Crystallizing membrane proteins using lipidic mesophases. Nature protocols. 2009;4:706–731. doi: 10.1038/nprot.2009.31. [DOI] [PMC free article] [PubMed] [Google Scholar]
- 15.Lemmon MA, Treutlein HR, Adams PD, Brunger AT, Engelman DM. A dimerization motif for transmembrane alpha-helices. Nat Struct Biol. 1994;1:157–163. doi: 10.1038/nsb0394-157. [DOI] [PubMed] [Google Scholar]
- 16.Yang J, et al. Mechanism of Isoprenylcysteine Carboxyl Methylation from the Crystal Structure of the Integral Membrane Methyltransferase ICMT. Molecular cell. 2011;44:997–1004. doi: 10.1016/j.molcel.2011.10.020. [DOI] [PubMed] [Google Scholar]
- 17.Long SB, Casey PJ, Beese LS. Reaction path of protein farnesyltransferase at atomic resolution. Nature. 2002;419:645–650. doi: 10.1038/nature00986. [DOI] [PubMed] [Google Scholar]
- 18.Li X, Roberti R, Blobel G. Structure of an integral membrane sterol reductase from Methylomicrobium alcaliphilum. Nature. 2014:1–15. doi: 10.1038/nature13797. [DOI] [PMC free article] [PubMed] [Google Scholar]
- 19.Koide S. Engineering of recombinant crystallization chaperones. Curr Opin Struct Biol. 2009;19:449–457. doi: 10.1016/j.sbi.2009.04.008. [DOI] [PMC free article] [PubMed] [Google Scholar]
- 20.Tan EW, Pérez-Sala D, Cañada FJ, Rando RR. Identifying the recognition unit for G protein methylation. The Journal of Biological Chemistry. 1991;266:10719–10722. [PubMed] [Google Scholar]
- 21.Pérez-Sala D, Gilbert BA, Tan EW, Rando RR. Prenylated protein methyltransferases do not distinguish between farnesylated and geranylgeranylated substrates. The Biochemical journal. 1992;284(Pt 3):835–840. doi: 10.1042/bj2840835. [DOI] [PMC free article] [PubMed] [Google Scholar]
- 22.Anderson JL, Henriksen BS, Gibbs RA, Hrycyna CA. The isoprenoid substrate specificity of isoprenylcysteine carboxylmethyltransferase: development of novel inhibitors. The Journal of Biological Chemistry. 2005;280:29454–29461. doi: 10.1074/jbc.M504982200. [DOI] [PMC free article] [PubMed] [Google Scholar]
- 23.Horowitz S, et al. Conservation and functional importance of carbon-oxygen hydrogen bonding in AdoMet-dependent methyltransferases. Journal of the American Chemical Society. 2013;135:15536–15548. doi: 10.1021/ja407140k. [DOI] [PubMed] [Google Scholar]
- 24.Gordon LB, Rothman FG, Lopez-Otin C, Misteli T. Progeria: a paradigm for translational medicine. Cell. 2014;156:400–407. doi: 10.1016/j.cell.2013.12.028. [DOI] [PMC free article] [PubMed] [Google Scholar]
- 25.Kawate T, Gouaux E. Fluorescence-detection size-exclusion chromatography for precrystallization screening of integral membrane proteins. Structure (London, England : 1993) 2006;14:673–681. doi: 10.1016/j.str.2006.01.013. [DOI] [PubMed] [Google Scholar]
- 26.Kilmartin JV, Wright B, Milstein C. Rat monoclonal antitubulin antibodies derived by using a new nonsecreting rat cell line. The Journal of Cell Biology. 1982;93:576–582. doi: 10.1083/jcb.93.3.576. [DOI] [PMC free article] [PubMed] [Google Scholar]
- 27.Long SB, Campbell EB, MacKinnon R. Crystal structure of a mammalian voltage-dependent Shaker family K+ channel. Science (New York, NY) 2005;309:897–903. doi: 10.1126/science.1116269. [DOI] [PubMed] [Google Scholar]
- 28.Koide S, Koide A, Lipovsek D. Target-binding proteins based on the 10th human fibronectin type III domain ((1)(0)Fn3) Methods Enzymol. 2012;503:135–156. doi: 10.1016/B978-0-12-396962-0.00006-9. [DOI] [PubMed] [Google Scholar]
- 29.Koide A, et al. Accelerating phage-display library selection by reversible and site-specific biotinylation. Protein engineering, design & selection : PEDS. 2009;22:685–690. doi: 10.1093/protein/gzp053. [DOI] [PMC free article] [PubMed] [Google Scholar]
- 30.Stockbridge RB, Koide A, Miller C, Koide S. Proof of dual-topology architecture of Fluc F− channels with monobody blockers. Nature communications. 2014;5:5120. doi: 10.1038/ncomms6120. [DOI] [PMC free article] [PubMed] [Google Scholar]
- 31.Sha F, et al. Dissection of the BCR-ABL signaling network using highly specific monobody inhibitors to the SHP2 SH2 domains. Proc Natl Acad Sci U S A. 2013;110:14924–14929. doi: 10.1073/pnas.1303640110. [DOI] [PMC free article] [PubMed] [Google Scholar]
- 32.Minor W, Cymborowski M, Otwinowski Z, Chruszcz M. HKL-3000: the integration of data reduction and structure solution--from diffraction images to an initial model in minutes. Acta crystallographica. Section D, Biological crystallography. 2006;62:859–866. doi: 10.1107/S0907444906019949. [DOI] [PubMed] [Google Scholar]
- 33.Bricogne G, Vonrhein C, Flensburg C, Schiltz M, Paciorek W. Generation, representation and flow of phase information in structure determination: recent developments in and around SHARP 2.0. Acta crystallographica. Section D, Biological crystallography. 2003;59:2023–2030. doi: 10.1107/s0907444903017694. [DOI] [PubMed] [Google Scholar]
- 34.McCoy AJ, et al. Phaser crystallographic software. Journal of applied crystallography. 2007;40:658–674. doi: 10.1107/S0021889807021206. [DOI] [PMC free article] [PubMed] [Google Scholar]
- 35.Brunger AT. Version 1.2 of the Crystallography and NMR system. Nat Protoc. 2007;2:2728–2733. doi: 10.1038/nprot.2007.406. [DOI] [PubMed] [Google Scholar]
- 36.Adams PD, et al. PHENIX: a comprehensive Python-based system for macromolecular structure solution. Acta Cryst. 2010;D66:213–221. doi: 10.1107/S0907444909052925. [DOI] [PMC free article] [PubMed] [Google Scholar]
- 37.Emsley P, Lohkamp B, Scott WG, Cowtan K. Features and development of Coot. Acta crystallographica. Section D, Biological crystallography. 2010;66:486–501. doi: 10.1107/S0907444910007493. [DOI] [PMC free article] [PubMed] [Google Scholar]
- 38.Chen VB, et al. MolProbity: all-atom structure validation for macromolecular crystallography. Acta crystallographica. Section D, Biological crystallography. 2010;66:12–21. doi: 10.1107/S0907444909042073. [DOI] [PMC free article] [PubMed] [Google Scholar]
- 39.Strong M, et al. Toward the structural genomics of complexes: crystal structure of a PE/PPE protein complex from Mycobacterium tuberculosis. Proc Natl Acad Sci U S A. 2006;103:8060–8065. doi: 10.1073/pnas.0602606103. [DOI] [PMC free article] [PubMed] [Google Scholar]
- 40.Karplus PA, Diederichs K. Linking crystallographic model and data quality. Science (New York, NY) 2012;336:1030–1033. doi: 10.1126/science.1218231. [DOI] [PMC free article] [PubMed] [Google Scholar]
- 41.Griggs AM, Hahne K, Hrycyna CA. Functional oligomerization of the Saccharomyces cerevisiae isoprenylcysteine carboxyl methyltransferase, Ste14p. The Journal of Biological Chemistry. 2010;285:13380–13387. doi: 10.1074/jbc.M109.061366. [DOI] [PMC free article] [PubMed] [Google Scholar]
- 42.Dharmaiah S, et al. Structural basis of recognition of farnesylated and methylated KRAS4b by PDEdelta. Proc Natl Acad Sci U S A. 2016;113:E6766–E6775. doi: 10.1073/pnas.1615316113. [DOI] [PMC free article] [PubMed] [Google Scholar]
Associated Data
This section collects any data citations, data availability statements, or supplementary materials included in this article.
Supplementary Materials
Data Availability Statement
Atomic coordinates and structure factors have been deposited in the Protein Data Bank (PDB) with accession numbers 5V7P (ICMT-monobody) and 5VG9 (ICMT alone).


