

Abstract
Background and Purpose
Several anti‐angiogenic cancer drugs that inhibit VEGF receptor (VEGFR) signalling for efficacy are associated with a 15–60% incidence of hypertension. Tyrosine kinase inhibitors (TKIs) that have off‐target activity at VEGFR‐2 may also cause blood pressure elevation as an undesirable side effect. Therefore, the ability to translate VEGFR‐2 off‐target potency into blood pressure elevation would be useful in development of novel TKIs. Here, we have sought to quantify the relationship between VEGFR‐2 inhibition and blood pressure elevation for a range of kinase inhibitors.
Experimental Approach
Porcine aortic endothelial cells overexpressing VEGFR‐2 (PAE) were used to determine IC50 for VEGFR‐2 phosphorylation. These IC50 values were compared with published reports of exposure attained during clinical use and the corresponding incidence of all‐grade hypertension. Unbound average plasma concentration (Cav,u) was selected to be the most appropriate pharmacokinetic parameter. The pharmacokinetic‐pharmacodynamic (PKPD) relationship for blood pressure elevation was investigated for selected kinase inhibitors, using data derived either from clinical papers or from rat telemetry experiments.
Key Results
All‐grade hypertension was predominantly observed when the Cav,u was >0.1‐fold of the VEGFR‐2 (PAE) IC50. Furthermore, based on the PKPD analysis, an exposure‐dependent blood pressure elevation >1 mmHg was observed only when the Cav,u was >0.1‐fold of the VEGFR‐2 (PAE) IC50.
Conclusions and Implications
Taken together, these data show that the risk of blood pressure elevation is proportional to the amount of VEGFR‐2 inhibition, and a margin of >10‐fold between VEGFR‐2 IC50 and Cav,u appears to confer a minimal risk of hypertension.
Abbreviations
- AUC0–24
the area under the plasma drug concentration–time curve calculated over 24 h
- Cav
average plasma concentration
- Cmax
maximal concentration at steady state
- fu
fraction unbound
- PAE
porcine aortic endothelial cells
- PKPD
pharmacokinetic‐pharmacodynamic
- SPR
surface plasmon resonance
Introduction
Tyrosine kinases play a central role in a number of cellular signalling processes, and pathological activation of kinase activity is implicated in a number of cancer mechanisms. This knowledge has led to the development of a number of treatments for cancer that specifically target kinase signalling. However, many of these pathways are also involved in cardiovascular physiological processes, and perturbation of these signals can lead to undesirable effects (Shah et al., 2013). For example, a number of treatments have been developed that target the VEGF signalling pathway, such as bevacizumab and axitinib. The mechanism of action for these agents is inhibition of angiogenesis that limits tumour growth (Wang et al., 2015). However, drugs that inhibit VEGF receptor 2 (VEGFR‐2) at clinically therapeutic exposures are associated with a 15–60% incidence of hypertension in the clinic (Keefe et al., 2011; Herrmann, 2016). VEGF is an important regulator of vascular homeostasis and causes vasodilation by triggering nitric oxide release from the endothelium (Robinson et al., 2010). Therefore, inhibition of VEGF itself (e.g. by the anti‐VEGF bevacizumab) or direct inhibition of VEGFR‐2 can impair this vasodilatory response, leading to blood pressure elevation. Depending on the dose and the susceptibility of the patient, this blood pressure elevation can result in clinically significant hypertension. Treatment with agents that inhibit VEGF signalling therefore requires careful cardiovascular monitoring of patients and can require intervention with anti‐hypertensive agents, dose reduction or withdrawal of treatment (Steingart et al., 2012). While undesirable, these side effects may be deemed acceptable, given clinical benefit obtained in terms of extension to life. Indeed, a number of studies have examined whether the degree of blood pressure elevations can be used as surrogate biomarker for progression‐free or overall survival (Shah et al., 2013).
A key challenge in developing low MW kinase inhibitors is achieving appropriate target selectivity. A lack of selectivity may increase the risk of off‐target effects, which could be beneficial, neutral or a potential safety concern (Bowes et al., 2012). Achieving the optimal level of selectivity can be an important factor in obtaining a therapeutic index between on‐target efficacy and off‐target‐driven safety issues (Muller and Milton, 2012). In practice, kinase selectivity can be assessed by screening compounds against a panel of assays that covers the kinome (Davis et al., 2011). However, interpreting the output of such panels requires knowledge of the biological role of each kinase and the level of target engagement required to elicit a physiological response. In this context, VEGFR‐2 is an interesting example. Although the hypertensive effects of on‐target inhibition may be acceptable in the oncology setting, off‐target VEGFR‐2 activity may result in undesirable blood pressure elevation that could be dose‐limiting and therefore affect the ability to achieve a fully efficacious dose (Grossman and Messerli, 2012). In such circumstances, minimizing VEGFR‐2 activity requires knowledge of the level of inhibition required to elevate blood pressure. Although there is some data linking the level of VEGFR‐2 inhibition required for efficacy, the same cannot be said for the level of inhibition causing blood pressure elevation (McTigue et al., 2012).
The aim of the present study was to quantify the relationship between VEGFR‐2 inhibition, blood pressure elevation or hypertension. Firstly, pharmacokinetic pharmacodynamic (PKPD) models that describe the effects of VEGFR‐2 inhibitors on blood pressure in rats and humans were used to generate steady state pharmacokinetic (PK)‐effect curves. These exposure–response curves were corrected for VEGFR‐2 potency. Secondly, hypertension incidence was gathered from published reports, and this was also plotted versus exposure and corrected for VEGFR‐2 potency. From this analysis, the relationship between the theoretical level of VEGFR‐2 inhibition and the degree of blood pressure elevation/hypertension was determined using different PK parameters and VEGFR‐2 assay formats. Taken together, the data indicate that a simple proportional relationship exists between VEGFR‐2 inhibition and the effects on blood pressure. Knowledge of this relationship can be used to inform what level of selectivity is required to avoid off‐target cardiovascular effects driven by VEGFR‐2 activity.
Methods
VEGFR‐2 activity and compounds
Compounds were tested in three different VEGFR‐2 assay formats: a binding assay [surface plasmon resonance (SPR)], in order to determine potency in a cell‐free system; and two mammalian cell‐based functional assays that measure inhibition of VEGFR‐2 phosphorylation in either a human cell line that natively expresses VEGFR‐2 (HUVEC) or porcine aortic endothelial (PAE) cells overexpressing VEGFR‐2. None of the assays are considered as the ‘definitive’ assessment of potency, but by selecting three different assay formats, we sought to determine which, if any, would correlate with in vivo blood pressure or hypertension data.
Surface plasmon resonance (SPR) VEGFR‐2 assay
SPR data were typically run as single‐cycle kinetics experiments. In each experiment, binding kinetics were derived from a kinetic titration typically consisting of five short injections of ascending concentrations of the compound followed by a long dissociation period when inhibitor is washed off and receptor returns to unligated state. Data analysis is based on evaluation of initial binding rates obtained from each injection as well as analysis of dissociation kinetics of the inhibitor, to yield a K D value. Typically, one such experiment was performed for each test compound. SPR experiments were performed using a Biacore T200 biosensor (GE Healthcare) (Morton and Myszka, 1998). Series S NTA sensor chips (GE Healthcare) were used. All experiments were carried out using assay buffer containing the following: 20 mM HEPES pH 7.5, 200 mM NaCl, 0.005% Tween‐20 (v/v), 1 mM TCEP and 1% DMSO (v/v) as running buffer. Typically, 2 mM DMSO stocks of compounds were diluted 1:100 (v/v) in 20 mM HEPES pH 7.5, 200 mM NaCl, 0.005% Tween‐20 (v/v), 1 mM TCEP to form 20 μM intermediate stocks with final DMSO concentration of 1% (v/v). The intermediate solutions were then subsequently diluted using assay buffer to achieve final concentration range.
Histidine‐tagged VEGFR‐2 [6His‐TEV‐SHM‐KDR(V789‐V1356)‐LE‐Flag, insect cell expressed] was immobilized as the ligand onto nitrilotriacetic (NTA) sensor chips using a capture coupling method (Kimple et al., 2010). Assay buffer was used as immobilization buffer. The NTA surface was first activated with a 2 min injection of 500 μM NiCl2 in running buffer before the carboxymethyl dextran surface was activated with a 7 min injection of a 1:1 ratio of 0.4 M ethyl (dimethylaminopropyl) carbodiimide and 0.1 M N‐Hydroxysuccinimide. His‐tagged protein was diluted into running buffer to a concentration of 20 μg·mL−1 and immobilized to the surface with a 7 min injection. Remaining activated groups were blocked with three consecutive 60 s pulses of 1 M Tris–HCl pH = 8.0. Typical immobilization levels ranged from 500 to 3000 resonance units. Equilibrium binding analysis was analysed by plotting steady‐state response level versus compound concentration and fitting to the Langmuir equation (describing simple 1:1 binary interaction).
Porcine aortic endothelial cells (PAE) elisa VEGFR‐2 assay
The purpose of the assay was to determine the potency of test compounds to inhibit VEGFR‐2 phosphorylation in PAE cells (obtained from Invitrogen, UK) overexpressing VEGFR‐2. These cells were plated (3 × 10⁴ cells per well) in 96‐well plates in Ham/F12 media containing 10% FBS, 1% L‐glutamine and 2 μg·mL−1 puromycin. After 24 h, media were removed and cells were serum starved (Ham/F12 + 1% L‐glutamine +2 μg·mL−1 puromycin) for 2.5 h prior to compound treatment for 1.5 h (0.0006 to 10 μM test concentrations, each tested in duplicate to ensure reliability). Cells were incubated with VEGF (50 ng·mL−1 for 5 min). After 5 min, media were removed and cells lysed with 100 μL RIPA buffer [RIPA – 60 mM Tris pH 7.4, 150 mM NaCl, 1 mM EDTA, 10× RIPA detergent (10% NP40 + 2.5% deoxycholate) containing phosphatase inhibitor cocktail 1 (Sigma P2850), 2 (Sigma P5726) and protease inhibitor (Sigma P8340)]. Plates were sealed and incubated shaking at room temperature for approximately 5 min to fully lyse cells. Lysates were snap‐frozen on dry ice and stored at −20°C overnight.
Lysates were analysed in a phospho‐VEGFR‐2 elisa according to the manufacturers' instructions (R&D Systems Cat# DYC1766–2). Briefly, plates were prepared with 100 μL capture antibody (human VEGFR‐2/KDR/FlK‐1) diluted to a working concentration of 8 μg·mL−1 in PBS, and the plate was sealed and incubated overnight at room temperature. Antibody was subsequently removed and plates washed five times with wash buffer (0.05% Tween 20 in PBS), and wells were then incubated with block buffer (1% BSA, 0.05% NaN3 in PBS) for 1–2 h at room temperature followed by washing as previously described. A total of 100 μL of sample or controls (DMSO as vehicle control and 10 μM sunitinib as a negative control) in IC diluent#12 [1% NP‐40 Alternative, 20 mM Tris (pH 8.0), 137 mM NaCl, 10% glycerol, 2 mM EDTA, 1 mM activated sodium orthovanadate] were added to the wells (including a diluent only well as a control), and the plate was covered and incubated at 4°C overnight. After washing, 100 μL of the diluted detection antibody (1:1500 anti‐phospho‐tyrosine‐HRP) was added to each well. Plates were covered and incubated at room temperature for a further 2 h. Plates were then washed, and 100 μL substrate solution added to each well followed by incubation at room temperature for 20 min, at which time 50 μL stop solution was applied to each well and mixed. The optical density of each well was measured at 450 nm using a microplate reader. Each 96‐well plate is analysed separately by deducting the mean ‘min’ control data from each plate then plotting the corrected data to calculate IC50 and IC90 using GeneData Screener 13. Each compound was tested in one to two independent experiments.
Human umbilical vein endothelial cells (HUVEC) elisa VEGFR‐2 assay
An in vitro mode of action assay based on HUVECs was used to determine the potency of compounds to inhibit phosphorylation of natively expressed VEGFR‐2. HUVECs were plated out at 3.5 × 10⁴ cells per well in 24‐well plates in reduced serum media (500 mL MCDB131 + 848 mg glutamine +1% P&S + 10 mL serum), after 24 h cells were serum starved (500 mL MCDB131 + 848mg glutamine +1% P&S), the compound added (0.0006 μM to 1 μM test concentrations) and pulsed with VEGF (50 ng·mL−1 into all wells for 5 min). Thereafter, the procedures were as described for the PAE assay.
Animal care and use
All animal care and experimental procedures at the AstraZeneca facility in the UK were performed under the authority of a valid Home Office project licence and conformed to the UK Animals (Scientific procedures) Act, 1986. Animal studies are reported in compliance with the ARRIVE guidelines (Kilkenny et al., 2010; McGrath and Lilley, 2015). A total of 17 animals were used in the experiments conducted by AstraZeneca. Rats were maintained in a 12 h light:dark cycle (light cycle 07:00 to 19:00 h) and were given full access to a standard rat RM1E (Special Diet Services) diet and drinking water at all times.
Rat telemetry
Arterial blood pressure was measured using radiotelemetry, as previous in‐house data indicated this species and model to be sensitive to induced blood pressure elevation following treatment with VEGFR‐2 inhibitors. Briefly, male Han Wistar rats were implanted with HD‐S11 transmitters (Data Sciences International, St. Paul, MN USA) under isoflurane anaesthesia at Charles River Laboratories (Margate, UK) and allowed to recover for at least 2 weeks. Animals were transferred to the AstraZeneca facility at around 2–3 months old. The animals were pair‐housed in standard rat individually ventilated cages with a non‐instrumented companion throughout the study. Cages were prepared with bedding material and enrichment.
After the acclimatization period of a minimum of 7 days, compound was administered by oral gavage (10% DMSO, 60% PEG400) on day 0 (at 10:00 h) and subsequently with the test item on day 1. Depending on the test item and dose, additional doses of test item were administered on days 2 and 3. Due to the ascending dose design, animals were not randomized to a dose group. Each group consisted of six rats, as a power analysis and previous in‐house data indicate that this number is sufficient to detect a 5 to 10 mmHg increase in blood pressure. Rats weighed 376–650 g at time of treatment. Blood samples (obtained via tail vein using micro‐sampling – 32 μL collected blood volume) were taken for confirmation of exposure at 2 h post‐dose. Clinical signs were monitored. The study design is outlined in the Supporting Information.
Systolic blood pressure was obtained as a series of 1 min averages which was subsequently averaged over 2 h consecutive periods (average of 120 data points) or a super‐interval of 10–22 h post‐dose (average of 720 data points). For the PKPD analysis of the rat telemetry studies, data were binned into 2 h intervals, including a pre‐dose, each day of dosing and washout period.
PKPD modelling of rat telemetry data
All modelling was carried out using Phoenix 6.4 (Certara).
The rat telemetry blood pressure and plasma PK data for AZ1 and regorafenib were used to derive a PKPD model to describe the effects of the compounds on blood pressure. Due to the limited PK sampling within the study, the PK models were built using PK from separate studies – however, this was in line with the observed concentrations. Full details of the population PK/PD model parameter estimates and fits can be found in the Supporting Information.
An oral, one compartment PK model with first‐order absorption model was used for both AZ1 and regorafenib. PK models were fitted to data from tolerability studies, so these parameter estimates were fixed for the telemetry study.
The pharmacodynamic (PD) model used a population approach to describe 2 h binned systolic BP (SBP) for both compounds, and additive inter‐occasional variability, proportional between subject variability, handling effects were considered. The handling effect at time of dosing used was replicated from Snelder et al. (2014):
| (1) |
where PBP represents the magnitude of effect which decays over time from time of handling tHD, determined by rate constant kHD. An effect compartment was considered to account for delay between plasma concentrations and SBP changes. The effect compartment concentration was used to drive the SBP changes above baseline, and linear, Emax and power models were considered:
| (2) |
where E0 represents baseline, and f(Ce) the effect concentration function selected.
For AZ1, separate PK parameter values were used at each dose level since it was not dose proportional over the range studied. The function that best described the drug effect on BP was proportional to concentration:
| (3) |
The value estimated for ke0 indicates that steady state would not have been reached under the dose regimen tested. Daily dosing using the 450 mg·kg−1 PK required approximately 25 days dosing to reach steady state.
For regorafenib, dose linearity was assumed for PK. The function that best described the drug effect was proportional to effect compartment concentration (as Equation (5)). Five daily doses were required to achieve steady state.
In addition to modelling the in‐house rat data, a rat telemetry study (including mean blood pressure, MBP) was obtained from published papers for sunitinib (Engle and Watson, 2016). To estimate the PKs, concentration data following a 15 mg·kg−1 dose of 14C sunitinib in male rats were obtained from a separate study (Speed et al., 2012), digitized and used to fit a PK model. The reported maximal concentration at steady state (Cmax) was 963 ng·mL−1, AUC0‐inf was 11 848 ng·h−1·mL−1, and t 1/2 was 8 h. The rat telemetry study provided MBP as 1 h averaged time course (group mean) over a 5 day period for three groups: vehicle, 5 and 50 mg·kg−1 once a day for 3 days. This was digitized, and using the simulated PK, the data were fitted to a naïve pooled PD model. The cyclical (diurnal) variation in the data was explored using cosine functions. The same PD models for MBP were considered as for the in‐house studies.
For sunitinib, dose linearity was assumed for PK. A single cosine function best described the cyclical diurnal variation in MBP.
| (4) |
An effect compartment was required, and the drug effect was used as described in Equation (3). The value estimated for ke0 indicates that steady state would not have been reached under the dose regimen tested, and approximately 30 days QD dosing would be required before steady state was reached.
Using the models and typical parameter estimates obtained, the BP change was simulated out to steady state over a dose range covering approximately drug induced 0–10 mmHg change, and the daily maximum BP change, AUC 0–24, C max and calculated average plasma concentration (C av) were recorded for the 24 h period following final dose. This was converted to a linear regression and then adjusted for fraction unbound (fu) and VEGFR‐2 potency. The resulting potency‐adjusted, unbound exposure–response relationships for blood pressure are plotted in Figure 2.
Simulation of rat steady state BP exposure‐response
Repeated daily dosing was simulated using the model and parameter estimates from the rat telemetry studies until BP changes reached steady state, and the predicted steady state plasma C max to peak daily SBP change was obtained. To assess steady state C av and AUC 0–24, constant plasma concentrations were used to drive BP changes until steady state was reached, and AUC 0–24, C av and the absolute SBP change was recorded.
Simulation of clinical BP exposure‐response at steady state
A literature search for clinical PKPD models of VEGFR‐2‐induced BP changes produced reports for axitinib and sunitinib (Houk et al., 2010; Lindauer et al., 2010; Khosravan et al., 2016), and these were used to obtain PK parameters and absolute BP change (in mm Hg) at steady state (Supporting Information). Length of dosing required to achieve steady state for both concentrations and BP change differed across studies. Variability (between‐subject, inter‐occasional, etc.) was not considered, and the typical parameter values were used. While it is expected that diastolic BP (DBP) and SBP could be used interchangeably, when both SBP and DBP were modelled, the measure with the greatest absolute change was selected.
Simulation of BP change from clinical PKPD reports
In order to compare the blood pressure PKPD relationships generated using rat telemetry data with that for humans, examples of human PKPD data were taken from clinical papers for both sunitinib and axitinib as follows. The axitinib PKPD model (Chen et al., 2015) was simulated for 4 days to reach steady state. For sunitinib (Khosravan et al., 2016), the model was simulated for 13 days. Using the models and typical parameter estimates obtained, the BP change was simulated out to steady state over a dose range covering approximately drug induced 0–10 mmHg change, and the daily maximum BP change, AUC 0–24, C max and calculated C av were recorded for the 24 h period after the last dose. This was converted to a linear regression and adjusted for fu and VEGFR‐2 potency. For the sunitinib report (Houk et al., 2010), the direct relationship between Ctrough (total was adjusted to fu) and BP was used to simulate steady state. For the sunitinib report (Lindauer et al., 2010), the BP change was simulated using raw plasma concentrations (total was adjusted to fu) and the drug effect model as described in the Supporting Information. The resulting exposure–response relationships from the Houk and Lindauer papers are used in the C max and C av but not in AUC 0–24 as this was not calculated.
Calculation of PK metrics and normalization using VEGFR‐2 IC50
The PK metrics considered in the analysis are C max, daily AUC 0–24 and average daily concentration C av at steady state. C av was calculated as follows:
| (5) |
All three PK metrics were expressed in μM and converted to unbound concentrations using the appropriate species' fu values (C max,u , AUC 0–24,u , C av,u), using plasma protein binding values. The unbound PK parameters were corrected for VEGFR‐2 potency IC50 values, giving a ratio relative to the IC50, for example, the C av, u corrected for the HUVEC assay:
| (6) |
For Cmax,u and Cav, u, a ratio of <1 produced in this calculation indicates lower unbound concentrations than the IC50 value, and a ratio of >1 indicates higher unbound concentrations than the IC50. This is the inverse of margin calculations commonly considered in safety assessment, for example, the ratio of 0.02 would equate to margin of 50 to the IC50 value. Each PK metric was individually adjusted for each VEGFR‐2 assay (HUVEC, SPR and PAE), giving nine different options to investigate for PK parameter and BP change between compounds and across species.
Literature search strategy for reports of clinical hypertension
Data were sourced from published clinical trial studies for each of the tyrosine kinase inhibitors, using PubMed, filtered for Clinical trials. PK data (including AUC 0–24 and C max), dose and % hypertension incidence (based on Common Terminology Criteria for Adverse Events grades 1–4) were all taken into consideration. Combination studies were excluded from the analysis. The drugs found from the literature search were tested in the VEGFR‐2 HUVEC, PAE or SPR assay formats. As described previously, AUC 0–24, C max and calculated C av were converted to unbound values using human plasma protein binding data and corrected for VEGFR‐2 potency. At each dose level, the VEGFR‐2 IC50 : PK parameter ratio was plotted versus the incidence of all grade hypertension observed for that dose.
Data and statistical analysis
The data and statistical analysis comply with the recommendations on experimental design and analysis in pharmacology (Curtis et al., 2015). Data from the rat telemetry studies were statistically analysed by fitting to a random effects model, with animal and the interaction between animal and day fitted as random effects, a variance‐components covariance pattern and the Kenward–Roger method for calculating the degrees of freedom (Kenward and Roger, 1997). Day and time‐point/bin were fitted as categorical variables. The two‐way interaction between day and time‐point/bin was also fitted. Least squares means are reported (these will be identical to arithmetic means when there is no missing data). This method takes advantage of the repeated measures on each animal to derive a more robust estimate of the standard error of the mean changes. Effects are reported as statistically significant (at the 5% level) if the P‐value is less than 0.05.
Materials
AZ1 is a proprietary AstraZeneca tyrosine kinase inhibitor with activity against VEGFR‐2. Regorafenib (BAY 73‐4506) is a multikinase inhibitor also with activity against VEGFR‐2 (Wilhelm et al., 2011). These and the other kinase inhibitors tested in this study represent a structurally diverse range of molecules with a range of VEGFR‐2 potencies. All compounds were obtained from the AstraZeneca compound collection.
Nomenclature of targets and ligands
Key protein targets and ligands in this article are hyperlinked to corresponding entries in http://www.guidetopharmacology.org, the common portal for data from the IUPHAR/BPS Guide to PHARMACOLOGY (Southan et al., 2016), and are permanently archived in the Concise Guide to PHARMACOLOGY 2017/18 (Alexander et al., 2017).
Results
Rat telemetry with VEGFR‐2 inhibitors
A number of studies have previously shown that VEGFR‐2 inhibitors show a robust blood pressure elevation in telemetered rats. Therefore, the rat telemetry model was chosen as a suitable non‐clinical model in which to determine the PKPD relationship for blood pressure for two selected kinase inhibitors with VEGFR‐2 activity, AZ1 and regorafenib. AZ1 at 10 and 100 mg·kg−1 had no or minimal effects on blood pressure in rats when dosed once daily for 3 days (data not shown). When dosed as a single dose of 450 mg·kg−1, AZ1 caused an increase in blood pressure (max increase of 10 mmHg when averaged over an interval of 12 h) that was sustained for ~72 h post‐dose (Figure 1A, B). The sustained effect on blood pressure was the result of the sustained plasma PK profile of AZ1 (Figure 1A).
Figure 1.
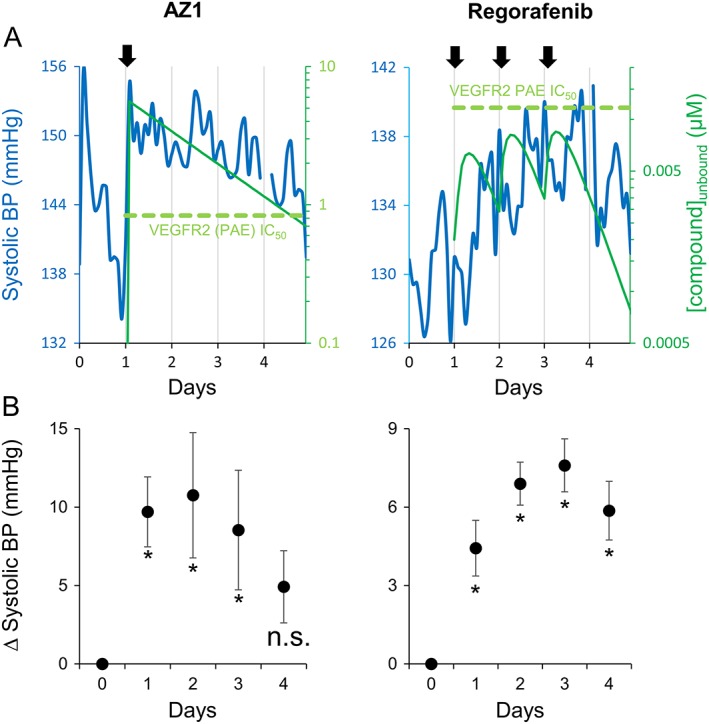
The effects of kinase inhibitors with VEGFR‐2 activity on SBP in telemetered rats. (A) Time‐course for changes in SBP and simulated unbound plasma concentration for rats treated with either 450 mg·kg−1 AZ1 (left panel, n = 6) or 16 mg·kg−1 regorafenib (right panel, n = 6). Rats received vehicle control on day 0, and first dose of test compound on day 1. Regorafenib was also administered on days 2 and 3 (arrows indicate times of test‐article dosing). BP data are a moving average of sequential 2 h time points. (B) The change in SBP relative to vehicle control averaged over a 10–22 h time period for each recording day (day 0 = vehicle control) for 450 mg·kg−1 AZ1 (left panel) or 16 mg·kg−1 regorafenib (right panel). Data are means ± SEM (n=6). *P ≥ 0.05, significant increase in blood pressure, n.s. non‐significant change; random effects model, as described in Methods.
When dosed daily, 16 mg·kg−1 regorafenib caused an increase in systolic blood pressure that persisted for up to ~24 h post dose (max increase of 8 mmHg when averaged over an interval of 12 h, Figure 1A, B). Similar effects were also observed with daily doses of regorafenib at 8 mg·kg−1 (data not shown). Measured plasma concentrations are shown in the Supporting Information.
VEGFR‐2 potency
The VEGFR‐2 potencies for AZ1 and the other compounds tested in this paper were determined using two cell‐based assays (HUVEC and PAE) as well as a cell‐free binding assay. The IC50 values obtained in the PAE, SPR and HUVEC VEGFR‐2 assays can be found in the Supporting Information.
Relationship between PK metric and BP elevation
Rat telemetry data (AZ1 and regorafenib from this study, and sunitinib from published data) and data from published clinical studies (sunitinib and axitinib) were used to derive the exposure–response relationships for blood pressure elevation (see Methods). The data from these PKPD models were used to generate VEGFR‐2 potency‐corrected, exposure–response relationships for blood pressure elevation for each compound and are presented in Figure 2. The normalization for VEGFR‐2 IC50 had differing effects on the different assays. For example, the HUVEC assay separated the sunitinib curves from the other curves. The normalization using SPR and PAE assays achieved better concordance of PK metric–response relationships across compounds. C max,u and C av, u are similar in terms of where the PK metric–response relationships lie on the X‐axis, but C av, u appears tighter between compounds. The AUC 0–24, u curves lie at higher values on the X‐axis compared to C max,u and C av, u, as the PK units are different (μM.h not μM).
Figure 2.
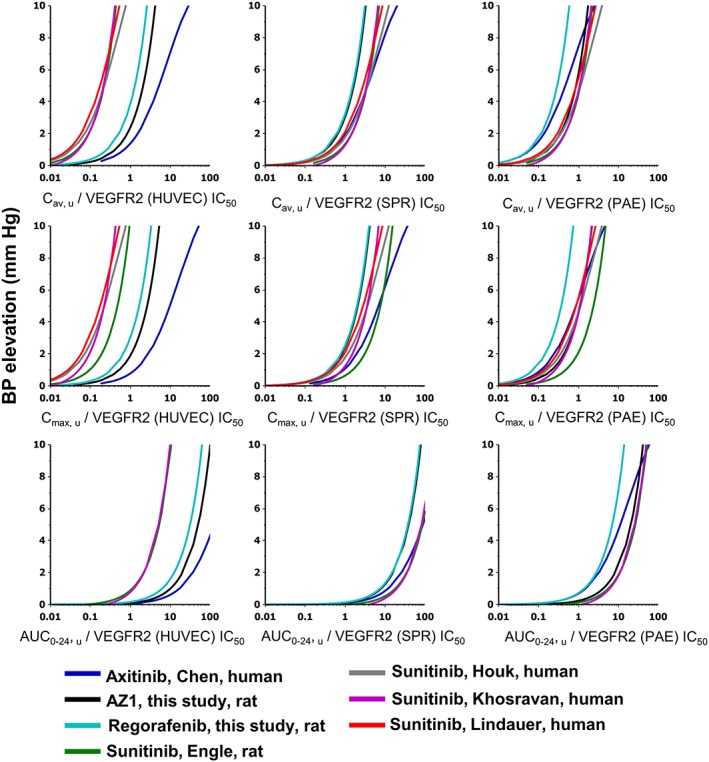
PKPD modelled exposure–response relationships for BP elevation at steady state corrected for VEGFR‐2 potency: multiple PK parameters and VEGFR‐2 assays. Each graph shows effects of four different VEGFR‐2 inhibitors at steady state derived from rat telemetry or clinical studies. The X‐axis by row from top to bottom is Cav,u, Cmax,u and AUC0–24,u in μM; by column going from left to right is the normalization applied to the PK metric using the IC50 of the VEGFR‐2 assays: HUVEC, SPR and PAE. Data were plotted as the dose response of the calculated PK metric assay value normalized for VEGFR‐2 IC50 versus BP elevation (in mmHg). Curves are coloured according to the key shown, which describes the VEGFR‐2 inhibitor, the report and the species where the model was developed. The rat telemetry study performed to support this work (as described in the text) is denoted by ‘this study’.
A more detailed view of the PKPD relationship between C av, u/VEGFR‐2 (PAE) IC50 and the increase on blood pressure is shown in Figure 3. The graph indicates that noteworthy (i.e. >1 mmHg) increases in blood pressure were observed when the C av,u/VEGF2 (PAE) IC50 ratio was, on average, approximately >0.1, though some drugs produced an increase of 1 mmHg below this threshold (regorafenib and axitinib).
Figure 3.
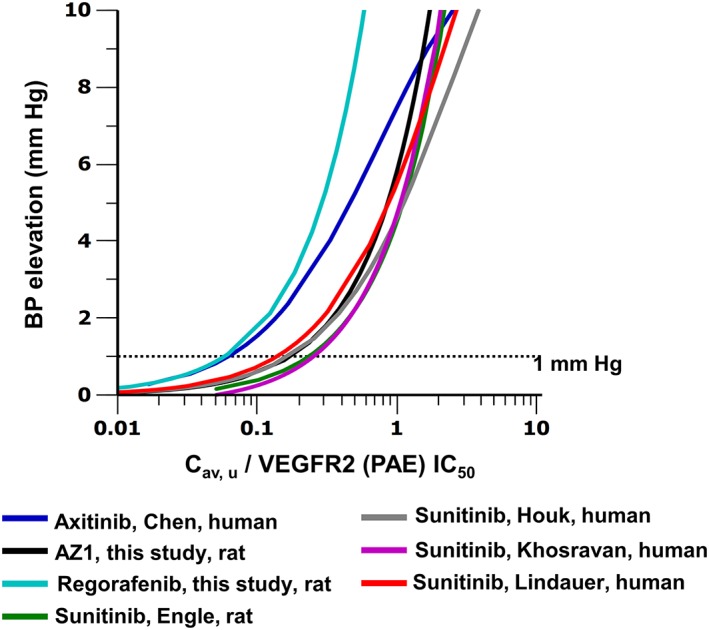
PKPD modelled exposure–response relationships for BP elevation at steady state, corrected for VEGFR‐2 potency: Cav,u/VEGFR‐2 (PAE) IC50. Curves are coloured according to the key shown, which describes the VEGFR‐2 inhibitor, the report and the species where the model was developed. The rat telemetry study performed to support this work (as described in the text) is denoted by ‘this study’. The trend across compounds support the hypothesis that the hypertension risk increases when Cav,u/VEGFR‐2 (PAE) IC50 is equal to or greater than 0.1. Dotted line indicates 1 mmHg BP change.
Relationship between PK metric and reported incidence of clinical hypertension
The relationship between PK ratio to VEGFR‐2 activity and hypertension risk was established as follows. Based on a literature search, 21 drugs with VEGFR‐2 activity were identified for which clinical trial publications were available that reported PK data (C max and AUC 0–24 , C av was calculated) alongside the incidence of all‐grade hypertension (Supporting Information). For a number of these drugs, PK and hypertension data were available for more than one dose level. The VEGFR‐2 IC50 values of these 22 drugs were determined using three specific assays: HUVEC, SPR and PAE (Supporting Information). For each dose level, three PK parameters were derived: C av, u, C max, u and AUC 0–24, u. Each of these PK values were divided by each of the three VEGFR‐2 IC50 values, to generate nine possible PK/VEGFR‐2 IC50 ratios (Supporting Information). These PK/VEGFR‐2 IC50 ratios were subsequently plotted against hypertension incidence for each drug and dose level (Figure 4). Of the 21 drugs, some carried no hypertension risk at any dose, and these included (but were not restricted to) imatanib, lapatanib and nilotinib. These form a baseline when plotted graphically, whereby although the PK/VEGFR‐2 IC50 ratios vary over a significant range (0.0001–10), there was no incidence of hypertension in patients from these clinical trials. However, of the 21 compounds, a proportion did induce significant hypertension within the population following administration, including motesanib, telatinib and pazopanib. The plots shown in Figure 4 all showed a similar trend, where the higher the PK parameter ratio to the VEGFR‐2 IC50 value, the higher the incidence of hypertension.
Figure 4.
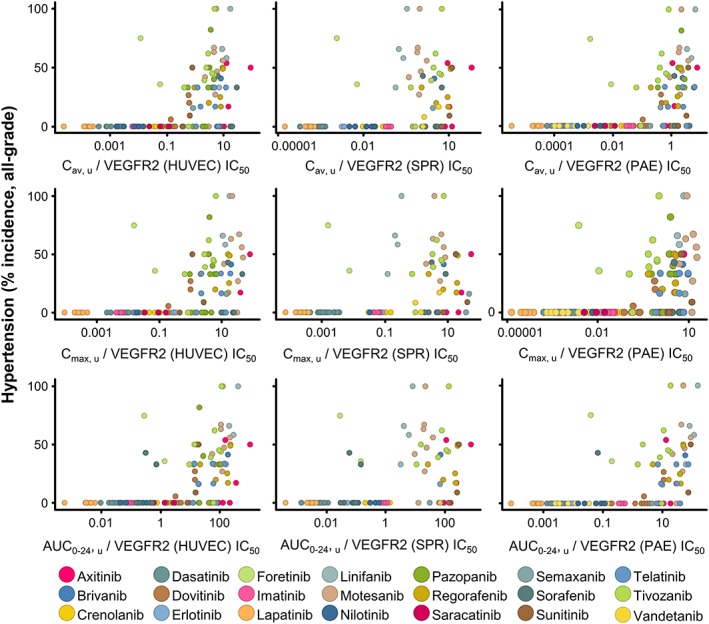
Relationship between the incidence of hypertension in the clinic and plasma PK corrected for VEGFR‐2 potency for a range of tyrosine kinase inhibitors: multiple PK parameters and VEGFR‐2 assays. Hypertension and PK data were extracted from published clinical trials for tyrosine kinase inhibitors. The X‐axis in rows from top to bottom is Cav,u, Cmax,u AUC0–24,u in μM; in columns going from left to right is the normalization applied using the IC50 of the different VEGFR‐2 assays (HUVEC, SPR and PAE). Data were plotted as the calculated PK metric normalized for VEGFR‐2 IC50 versus all‐grade hypertension incidence (%), each dot denoting a different dose level; the key shows the colour for each VEGFR‐2 inhibitor.
A more detailed view of the relationship between C av, u/VEGFR‐2 (PAE) IC50 and the incidence of hypertension is shown in Figure 5. The plot indicates that the incidence of hypertension remains low when the C av, u/PAE, IC50 ratio is <0.1. Of the 57 data points with a C av, u/VEGFR‐2 (PAE) IC50 < 0.1 and only three (5%) have a >10% incidence of hypertension. Conversely, of the 69 data points with a C av, u/VEGFR‐2 (PAE) IC50 > 0.1, 47 (68%) have a >10% incidence of hypertension.
Figure 5.
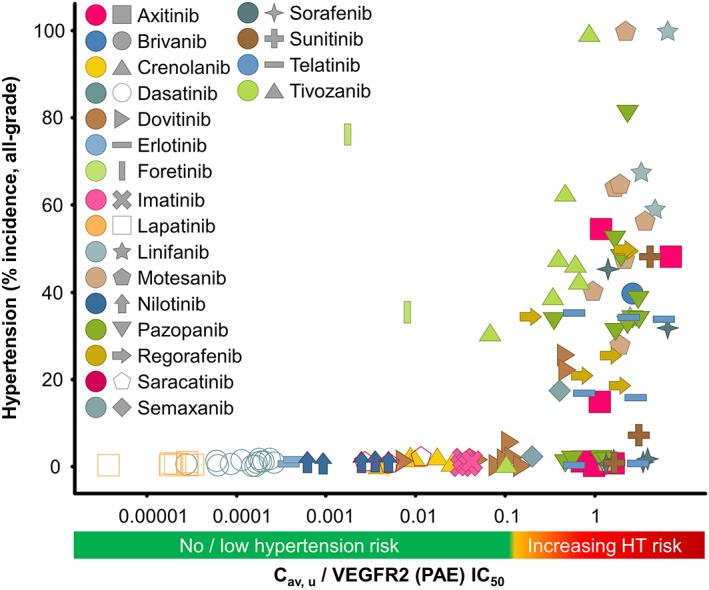
Relationship between the incidence of hypertension in the clinic and plasma PK corrected for VEGFR‐2 potency for a range of tyrosine kinase inhibitors: Cav,u/VEGFR‐2 (PAE) IC50. Hypertension and PK data were extracted from published clinical trials for tyrosine kinase inhibitors. Data were plotted as the calculated Cav,u normalized for VEGFR‐2 (PAE) IC50 versus all‐grade hypertension incidence (%), each dot denoting a different dose level; the key shows the colour for each VEGFR‐2 inhibitor.
Discussion
Novel insight into the threshold for risk of VEGFR‐2 mediated effects on blood pressure and hypertension
Cancer therapies that inhibit VEGF signalling are associated with a high risk of causing clinically significant hypertension that requires careful monitoring and management (Herrmann, 2016). Although the increased blood pressure and hypertension risk may be considered acceptable for VEGFR inhibitors, for novel kinases inhibitors, significant off‐target VEGFR inhibition may result in undesirable hypertension, from which the patient would not receive any clinical benefit. Therefore it is important to understand what level of VEGFR‐2 inhibition is required to cause blood pressure elevation, in order to determine the appropriate safety margins for prospective new therapies during the drug discovery process. This study was designed to specifically address this question using two separate approaches. The first employed PKPD analysis of blood pressure data from rat and human studies in order to derive exposure–response curves, where the exposure could be corrected for VEGFR‐2 activity. The second analysis examined the incidence of hypertension observed in clinical studies conducted with tyrosine kinase inhibitors designed for cancer treatment and determined the relationship with plasma exposure corrected for VEGFR‐2 activity. From these analyses, it was possible to conclude two key findings across a range of structurally diverse VEGFR‐2 inhibitors: (i) the magnitude of BP increase, or the incidence of hypertension, was proportional to the plasma PK : VEGFR‐2 IC50 ratio – the higher the ratio, the greater the increase in BP/hypertension incidence. (ii) Based on the PKPD analysis, an exposure‐dependent blood pressure elevation >1 mmHg was observed when the C av, u was approximately >0.1‐fold of the VEGFR‐2 (PAE) IC50 in both rats and humans. Furthermore, the incidence of hypertension tended in increase once the threshold of C av, u was >0.1‐fold of the VEGFR‐2 (PAE) IC50 value. To our knowledge, this is the first study to quantify the relationship between VEGFR‐2 inhibition and blood pressure elevation or hypertension incidence. This knowledge will have utility for drug discovery programmes seeking to optimize selectivity against VEGFR‐2.
The data presented here give an important insight into the level of kinase inhibition required in order to evoke a physiological response. The data suggest that the inflexion point for the exposure–response relationship for blood pressure elevation is approximately 10‐fold below the IC50 of VEGFR‐2 activity in the assays employed here. This level of kinase inhibition might be viewed as relatively low when compared to the level of inhibition required for efficacy for cancer treatments. These typically aim to achieve 50–90% inhibition at therapeutic exposures (Luo et al., 2005; Luo et al., 2006; Falchook et al., 2014; Zhang et al., 2014; Bruce et al., 2016). However, this apparent difference can be reconciled by the fact that cancer therapies generally aim to achieve maximal efficacy. Indeed, most early clinical studies are aimed at exploring the maximum tolerated dose (Le Tourneau et al., 2009; Hoshino‐Yoshino et al., 2011). Therefore, although some effect on tumour growth may be achieved at a lower level of kinase inhibition, achieving maximal efficacy is obviously more desirable. The effects of VEGFR‐2 on blood pressure are directly analogous – at equivalent plasma concentrations below the VEGFR‐2 IC50, only a small increase in blood pressure is observed, whereas greater blood pressure elevation (efficacy) is achieved with plasma concentrations exceeding the VEGFR‐2 IC50. A small increase in BP could be of relevance in an already hypertensive patient, so when VEGFR‐2 inhibition is a safety concern, even small changes can be of significant consequences for drug projects.
The low level of VEGFR‐2 required to elicit an increase in blood pressure has parallels with other targets associated with undesirable effects. For example, ≥30‐fold safety margin between ion channel IC50 value (either hERG or hNav1.5 channels) and Cmax,u value in humans seems to confer an acceptable degree of safety for effects in the ECG (Redfern et al., 2003; Harmer et al., 2011). For drug–drug interactions, inhibition of CYP metabolizing enzymes is considered possible if the human Cmax,u is 0.02‐fold of the CYP enzyme K i value (Muller and Milton, 2012). Taken together, the observations illustrate how both off‐target selectivity and therapeutic exposures should be taken into account when establishing the therapeutic index of a potential investigative medicine.
Limitations and considerations of current study
The data presented here should be viewed in light of a number of limitations that could affect the conclusions reached. The first of which is that we have used unbound plasma concentrations to calculate the theoretical cover over the VEGFR‐2 IC50 achieved in vivo. This is, in effect, a proxy for target engagement and assumes that the amount of inhibition is equivalent in vivo and in vitro for a given compound concentration (Durham and Blanco, 2015). This also assumes that the plasma concentration is equivalent to the compound concentration at the target site. Ultimately, further experimental data will be required to directly measure VEGFR‐2 phosphorylation in the endothelium as a more direct assessment of target engagement. Another limitation to the current analysis is the hypertension data presented in Figure 4. Each of the data points has a number of potential errors associated with it that could affect the accuracy: the hypertension grade category, the PK value, the plasma protein binding and the VEGFR‐2 potency value. For example, a patient will be assigned a specific Common Terminology Criteria for Adverse Events (CTCAE) grade of hypertension based on their blood pressure measurement post‐drug. A CTCAE grade 3 hypertension is a diastolic BP >100 mHg. Therefore, the level of blood pressure elevation required for hypertension will vary depending on that patient's pre‐drug blood pressure, their sensitivity to the drug and also to their sensitivity to anti‐hypertensive medication. Given this potential for variability, the data presented in Figures 4 and 5 show a remarkable trend when all of the data are taken into account, as well as offering a potential explanation for the outliers observed. The hypertension risk is typically reported as a percentage incidence across different CTC grades, and here, the values were summed to give an incidence of all grade hypertension, given that this represents a considerable spread in BP measurements across patient groups, it is surprising that across compounds, there is a consistent trend, when protein binding, PK metric and VEGFR‐2 potency are taken into account. Conversely, modelling BP elevation is more quantitative in nature and considers both a patient/groups pre‐drug BP in modelling the time course of BP effect.
The key focus of this study has been to examine the relationship between VEGFR‐2 inhibition and the effect on blood pressure. However, this study has not taken into consideration that the compounds tested may have activity at other targets that could also affect blood pressure. Although this possibility cannot be excluded, the compounds tested in this study are structurally diverse in the context of clinical kinase inhibitors. Therefore, it is considered that for the compounds tested in this study, VEGFR‐2 inhibition is the most likely common factor contributing to blood pressure elevation.
VEGFR‐2 mediated BP elevation across species
PKPD modelling of preclinical toxicity data offers a number of advantages, including the ability to extrapolate responses from preclinical species to make predictions of potential effects in humans (Ekerot et al., 2013; Caruso et al., 2014). Furthermore, by combining mathematical models for both disease efficacy and safety parameters, it can be possible to make predictions of whether a candidate drug will have an optimal therapeutic index (Muller and Milton, 2012; Mould et al., 2015). The data presented in Figures 2 and 3 suggest a close alignment between the PKPD relationship for VEGFR‐2‐mediated blood pressure effect in both humans and rats. A number of other publications have also shown that VEGFR‐2‐inhibiting compounds known to cause hypertension in humans also cause blood pressure elevation in rats (Banfor et al., 2009; Isobe et al., 2014; Skinner et al., 2014; Carter et al., 2017). These data therefore suggest that the role of VEGFR‐2 in regulating blood pressure is conserved in both species. Furthermore, they indicate that rat telemetry is a useful preclinical model to predict potential VEGFR‐2‐induced blood pressure elevation.
Delineating the PK metric
The selection of PK metric (AUC 0–24, C max or C av) in this study is defined by two major factors: the observed agreement across drugs and the true underlying PK metric (Smith et al., 2010). The agreement across drugs can be observed in the plots above and led to the recommendation of C av, u as a metric of daily steady state exposure over C max, u which represents a transient peak concentration at steady state. As BP changes caused by VEGFR‐2 inhibition are often delayed relative to plasma concentrations, daily fluctuations (such as C max) may have less importance than a more general daily exposure measure such as AUC 0–24 and C av. C av is recommended over AUC, because C av has the same concentration units as IC50, and so, it is easier to communicate/interpret as ratio or margin relative to the in vitro assay concentrations. It is often observed that C max and C av are often highly correlated, as it is the daily C max to C min ratio that will determine the C av at steady state, and therefore, similar conclusions could be made with C max as an alternative. Therefore, it can be difficult to determine the true underlying PK metric, without designing bespoke dose fractionation studies.
In conclusion, the present study has quantified the in vitro to in vivo relationship for the effects of VEGFR‐2‐inhibiting compounds on blood pressure. This data can be used in order to understand potential off‐target effects driven by VEGFR‐2 activity of kinase inhibitors on blood pressure. The data also indicate that maximizing selectivity against VEGFR‐2 will minimize the potential for causing drug‐induced hypertension in the clinic.
Author contributions
T.C., J.M. and A.R.H. conceived and designed the study. K.G. conducted the analysis of the incidence of hypertension in the clinic. T.C. performed the PKPD analysis. M.B., C.H. and H.W. generated the in vitro data. M.S. conducted the rat telemetry studies. T.C., K.G. and A.R.H. authored the manuscript.
Conflict of interest
All authors are, or have previously been, employees of AstraZeneca.
Declaration of transparency and scientific rigour
This Declaration acknowledges that this paper adheres to the principles for transparent reporting and scientific rigour of preclinical research recommended by funding agencies, publishers and other organisations engaged with supporting research.
Supporting information
Table S1 Study design for rat telemetry study with AZ1 and regorafenib.
Table S2 Concentrations obtained at 2 h post dose in the rat telemetry study.
Table S3 Overview of Clinical PKPD models of BP changes with VEGFR‐2 inhibitors used in analysis.
Table S4 Final parameter estimates for PKPD model estimated from rat telemetry study with AZ1 (PK was fixed). A handling effect was included as described in Equation 1.
Table S5 Final parameter estimates for PKPD model estimated from rat telemetry study with regorafenib (PK was fixed). No handling effect was required.
Table S6 Sunitinib Rat telemetry parameter estimates (PK was fixed during PD estimation) using PK model estimated from data in Speed et al. and average rat BP from Engle et al. No mixed effects (i.e. IIV or IOV) or handling effect was included in the final model fit.
Table S7 Overview of approach to simulate exposure‐response relationship for clinical PKPD reports.
Table S8 VEGFR‐2 IC50 values from HUVEC, PAE and SPR assays, and rat and human f u where relevant. *was obtained from Wilhelm et al., 2011.
Table S9 References for studies used to determine the incidence of hypertension for tyrosine kinase inhibitors.
Figure S1 Observed systolic blood pressure (SBP) over time following dosing of vehicle and AZ1 to male Han Wistar rats, versus the individual and population PKPD model fit for each animal. The black circles indicate the observations the population model fit is represented as the black line, the individual model fit as the grey line. Top row for test occasion 1 high dose (450 mg·kg−1), middle row for test occasion 2 low dose (10 mg·kg−1) and bottom row for test occasion 3 mid dose (100 mg·kg−1).
Figure S2 Observed systolic blood pressure (SBP) over time following dosing of vehicle and regorafenib to male Han Wistar rats, versus the individual and population PKPD model fit for each animal. The black circles indicate the observations the population model fit is represented as the black line, the individual model fit as the grey line. Top panel for test occasion 1 low dose (8 mg·kg−1) and bottom panel for test occasion 2 high dose (16 mg·kg−1) as indicated.
Figure S3 Observed mean aortic blood pressure (MBP) over time following repeated daily dosing of vehicle, 5 and 50 mg·kg−1 of sunitinib in male Sprague Dawley rats (n = 4), versus the PKPD model fit. The dots indicate the observations after vehicle (diamonds), 5 mg·kg−1 (squares) and 50 mg·kg−1, the model fit for vehicle represented as grey line, 5 mg·kg−1 in dashed black line, 50 mg·kg−1 as solid black line. Data‐points extracted from (Engle and Watson, 2016; Speed et al., 2012).
Collins, T. , Gray, K. , Bista, M. , Skinner, M. , Hardy, C. , Wang, H. , Mettetal, J. T. , and Harmer, A. R. (2018) Quantifying the relationship between inhibition of VEGF receptor 2, drug‐induced blood pressure elevation and hypertension. British Journal of Pharmacology, 175: 618–630. doi: 10.1111/bph.14103.
Contributor Information
Teresa Collins, Email: teresa.collins@astrazeneca.com.
Alexander R Harmer, Email: alex.harmer@astrazeneca.com.
References
- Alexander SPH, Fabbro D, Kelly E, Marrion NV, Peters JA, Faccenda E et al (2017). The Concise Guide to PHARMACOLOGY 2017/18: Catalytic receptors. Br J Pharmacol 174: S225–S271. [DOI] [PMC free article] [PubMed] [Google Scholar]
- Banfor PN, Franklin PA, Segreti JA, Widomski DL, Davidsen SK, Albert DH et al (2009). ETA receptor blockade with atrasentan prevents hypertension with the multitargeted tyrosine kinase inhibitor ABT‐869 in telemetry‐instrumented rats. J Cardiovasc Pharmacol 53: 173–178. [DOI] [PubMed] [Google Scholar]
- Bowes J, Brown AJ, Hamon J, Jarolimek W, Sridhar A, Waldron G et al (2012). Reducing safety‐related drug attrition: the use of in vitro pharmacological profiling. Nat Rev Drug Discov 11: 909–922. [DOI] [PubMed] [Google Scholar]
- Bruce JY, LoRusso PM, Goncalves PH, Heath EI, Sadowski E, Shalinsky DR et al (2016). A pharmacodynamically guided dose selection of PF‐00337210 in a phase I study in patients with advanced solid tumors. Cancer Chemother Pharmacol 77: 527–538. [DOI] [PMC free article] [PubMed] [Google Scholar]
- Carter JJ, Fretwell LV, Woolard (2017). Effects of 4 multitargeted receptor tyrosine kinase inhibitors on regional hemodynamics in conscious, freely moving rats. FASEB J 31 (3): 1193–1203. [DOI] [PMC free article] [PubMed] [Google Scholar]
- Caruso A, Frances N, Meille C, Greiter‐Wilke A, Hillebrecht A, Lave T (2014). Translational PK/PD modeling for cardiovascular safety assessment of drug candidates: methods and examples in drug development. J Pharmacol Toxicol Methods 70: 73–85. [DOI] [PubMed] [Google Scholar]
- Chen Y, Rini BI, Bair AH, Mugundu GM, Pithavala YK (2015). Population pharmacokinetic‐pharmacodynamic modelling of 24‐h diastolic ambulatory blood pressure changes mediated by axitinib in patients with metastatic renal cell carcinoma. Clin Pharmacokinet 54: 397–407. [DOI] [PubMed] [Google Scholar]
- Curtis MJ, Bond RA, Spina D, Ahluwalia A, Alexander SP, Giembycz MA et al (2015). Experimental design and analysis and their reporting: new guidance for publication in BJP. Br J Pharmacol 172: 3461–3471. [DOI] [PMC free article] [PubMed] [Google Scholar]
- Davis MI, Hunt JP, Herrgard S, Ciceri P, Wodicka LM, Pallares G et al (2011). Comprehensive analysis of kinase inhibitor selectivity. Nat Biotechnol 29: 1046–1051. [DOI] [PubMed] [Google Scholar]
- Durham TB, Blanco MJ (2015). Target engagement in lead generation. Bioorg Med Chem Lett 25: 998–1008. [DOI] [PubMed] [Google Scholar]
- Ekerot P, Ferguson D, Glamsta EL, Nilsson LB, Andersson H, Rosqvist S et al (2013). Systems pharmacology modeling of drug‐induced modulation of thyroid hormones in dogs and translation to human. Pharm Res 30: 1513–1524. [DOI] [PubMed] [Google Scholar]
- Engle SK, Watson DE (2016). Natriuretic peptides as cardiovascular safety biomarkers in rats: comparison with blood pressure, heart rate, and heart weight. Toxicol Sci 149: 458–472. [DOI] [PubMed] [Google Scholar]
- Falchook GS, Long GV, Kurzrock R, Kim KB, Arkenau HT, Brown MP et al (2014). Dose selection, pharmacokinetics, and pharmacodynamics of BRAF inhibitor dabrafenib (GSK2118436). Clin Cancer Res 20: 4449–4458. [DOI] [PubMed] [Google Scholar]
- Grossman E, Messerli FH (2012). Drug‐induced hypertension: an unappreciated cause of secondary hypertension. Am J Med 125: 14–22. [DOI] [PubMed] [Google Scholar]
- Harmer AR, Valentin JP, Pollard CE (2011). On the relationship between block of the cardiac Na(+) channel and drug‐induced prolongation of the QRS complex. Br J Pharmacol 164: 260–273. [DOI] [PMC free article] [PubMed] [Google Scholar]
- Herrmann J (2016). Tyrosine kinase inhibitors and vascular toxicity: impetus for a classification system? Curr Oncol Rep 18: 33. [DOI] [PubMed] [Google Scholar]
- Hoshino‐Yoshino A, Kato M, Nakano K, Ishigai M, Kudo T, Ito K (2011). Bridging from preclinical to clinical studies for tyrosine kinase inhibitors based on pharmacokinetics/pharmacodynamics and toxicokinetics/toxicodynamics. Drug Metab Pharmacokinet 26: 612–620. [DOI] [PubMed] [Google Scholar]
- Houk BE, Bello CL, Poland B, Rosen LS, Demetri GD, Motzer RJ (2010). Relationship between exposure to sunitinib and efficacy and tolerability endpoints in patients with cancer: results of a pharmacokinetic/pharmacodynamic meta‐analysis. Cancer Chemother Pharmacol 66: 357–371. [DOI] [PubMed] [Google Scholar]
- Isobe T, Komatsu R, Honda M, Kuramoto S, Shindoh H, Tabo M (2014). Estimating the clinical risk of hypertension from VEGF signal inhibitors by a non‐clinical approach using telemetered rats. J Toxicol Sci 39: 237–242. [DOI] [PubMed] [Google Scholar]
- Keefe D, Bowen J, Gibson R, Tan T, Okera M, Stringer A (2011). Noncardiac vascular toxicities of vascular endothelial growth factor inhibitors in advanced cancer: a review. Oncologist 16: 432–444. [DOI] [PMC free article] [PubMed] [Google Scholar]
- Kenward MG, Roger JH (1997). Small sample inference for fixed effects from restricted maximum likelihood. Biometrics 53: 983–997. [PubMed] [Google Scholar]
- Khosravan R, Motzer RJ, Fumagalli E, Rini BI (2016). Population pharmacokinetic/pharmacodynamic modeling of sunitinib by dosing schedule in patients with advanced renal cell carcinoma or gastrointestinal stromal tumor. Clin Pharmacokinet 55: 1251–1269. [DOI] [PMC free article] [PubMed] [Google Scholar]
- Kilkenny C, Browne WJ, Cuthill IC, Emerson M, Altman DG (2010). Improving bioscience research reporting: the ARRIVE guidelines for reporting animal research. PLoS Biol 8: e1000412. [DOI] [PMC free article] [PubMed] [Google Scholar]
- Kimple AJ, Muller RE, Siderovski DP, Willard FS (2010). A capture coupling method for the covalent immobilization of hexahistidine tagged proteins for surface plasmon resonance. Methods Mol Biol 627: 91–100. [DOI] [PMC free article] [PubMed] [Google Scholar]
- Le Tourneau C, Lee JJ, Siu LL (2009). Dose escalation methods in phase I cancer clinical trials. J Natl Cancer Inst 101: 708–720. [DOI] [PMC free article] [PubMed] [Google Scholar]
- Lindauer A, Di Gion P, Kanefendt F, Tomalik‐Scharte D, Kinzig M, Rodamer M et al (2010). Pharmacokinetic/pharmacodynamic modeling of biomarker response to sunitinib in healthy volunteers. Clin Pharmacol Ther 87: 601–608. [DOI] [PubMed] [Google Scholar]
- Luo FR, Yang Z, Dong H, Camuso A, McGlinchey K, Fager K et al (2005). Prediction of active drug plasma concentrations achieved in cancer patients by pharmacodynamic biomarkers identified from the geo human colon carcinoma xenograft model. Clin Cancer Res 11: 5558–5565. [DOI] [PubMed] [Google Scholar]
- Luo FR, Yang Z, Camuso A, Smykla R, McGlinchey K, Fager K et al (2006). Dasatinib (BMS‐354825) pharmacokinetics and pharmacodynamic biomarkers in animal models predict optimal clinical exposure. Clin Cancer Res 12: 7180–7186. [DOI] [PubMed] [Google Scholar]
- McGrath JC, Lilley E (2015). Implementing guidelines on reporting research using animals (ARRIVE etc.): new requirements for publication in BJP. Br J Pharmacol 172: 3189–3193. [DOI] [PMC free article] [PubMed] [Google Scholar]
- McTigue M, Murray BW, Chen JH, Deng YL, Solowiej J, Kania RS (2012). Molecular conformations, interactions, and properties associated with drug efficiency and clinical performance among VEGFR TK inhibitors. Proc Natl Acad Sci U S A 109: 18281–18289. [DOI] [PMC free article] [PubMed] [Google Scholar]
- Morton TA, Myszka DG (1998). Kinetic analysis of macromolecular interactions using surface plasmon resonance biosensors. Methods Enzymol 295: 268–294. [DOI] [PubMed] [Google Scholar]
- Mould DR, Walz AC, Lave T, Gibbs JP, Frame B (2015). Developing exposure/response models for anticancer drug treatment: special considerations. CPT Pharmacometrics Syst Pharmacol 4: e00016. [DOI] [PMC free article] [PubMed] [Google Scholar]
- Muller PY, Milton MN (2012). The determination and interpretation of the therapeutic index in drug development. Nat Rev Drug Discov 11: 751–761. [DOI] [PubMed] [Google Scholar]
- Redfern WS, Carlsson L, Davis AS, Lynch WG, MacKenzie I, Palethorpe S et al (2003). Relationships between preclinical cardiac electrophysiology, clinical QT interval prolongation and torsade de pointes for a broad range of drugs: evidence for a provisional safety margin in drug development. Cardiovasc Res 58: 32–45. [DOI] [PubMed] [Google Scholar]
- Robinson ES, Khankin EV, Karumanchi SA, Humphreys BD (2010). Hypertension induced by vascular endothelial growth factor signaling pathway inhibition: mechanisms and potential use as a biomarker. Semin Nephrol 30: 591–601. [DOI] [PMC free article] [PubMed] [Google Scholar]
- Shah DR, Shah RR, Morganroth J (2013). Tyrosine kinase inhibitors: their on‐target toxicities as potential indicators of efficacy. Drug Saf 36: 413–426. [DOI] [PubMed] [Google Scholar]
- Skinner M, Philp K, Lengel D, Coverley L, Lamm Bergstrom E, Glaves P et al (2014). The contribution of VEGF signalling to fostamatinib‐induced blood pressure elevation. Br J Pharmacol 171: 2308–2320. [DOI] [PMC free article] [PubMed] [Google Scholar]
- Smith DA, Morgan P, Vogel WM, Walker DK (2010). The use of C(av) rather than AUC in safety assessment. Regul Toxicol Pharmacol 57: 70–73. [DOI] [PubMed] [Google Scholar]
- Snelder N, Ploeger BA, Luttringer O, Rigel DF, Fu F, Beil M et al (2014). Drug effects on the CVS in conscious rats: separating cardiac output into heart rate and stroke volume using PKPD modelling. Br J Pharmacol 171: 5076–5092. [DOI] [PMC free article] [PubMed] [Google Scholar]
- Southan C, Sharman JL, Benson HE, Faccenda E, Pawson AJ, Alexander SPH et al (2016). The IUPHAR/BPS guide to PHARMACOLOGY in 2016: towards curated quantitative interactions between 1300 protein targets and 6000 ligands. Nucl Acids Res 44: D1054–D1068. [DOI] [PMC free article] [PubMed] [Google Scholar]
- Speed B, Bu HZ, Pool WF, Peng GW, Wu EY, Patyna S et al (2012). Pharmacokinetics, distribution, and metabolism of [14C]sunitinib in rats, monkeys, and humans. Drug Metab Dispos 40: 539–555. [DOI] [PubMed] [Google Scholar]
- Steingart RM, Bakris GL, Chen HX, Chen MH, Force T, Ivy SP et al (2012). Management of cardiac toxicity in patients receiving vascular endothelial growth factor signaling pathway inhibitors. Am Heart J 163: 156–163. [DOI] [PubMed] [Google Scholar]
- Wang Z, Dabrosin C, Yin X, Fuster MM, Arreola A, Rathmell WK et al (2015). Broad targeting of angiogenesis for cancer prevention and therapy. Semin Cancer Biol 35 (Suppl): S224–S243. [DOI] [PMC free article] [PubMed] [Google Scholar]
- Wilhelm SM, Dumas J, Adnane L, Lynch M, Carter CA, Schütz G et al (2011). Regorafenib (BAY 73‐4506): a new oral multikinase inhibitor of angiogenic, stromal and oncogenic receptor tyrosine kinases with potent preclinical antitumor activity. Int J Cancer 129: 245–255. [DOI] [PubMed] [Google Scholar]
- Zhang M, Xu CR, Shamiyeh E, Liu F, Yin JY, von Moltke LL et al (2014). A randomized, placebo‐controlled study of the pharmacokinetics, pharmacodynamics, and tolerability of the oral JAK2 inhibitor fedratinib (SAR302503) in healthy volunteers. J Clin Pharmacol 54: 415–421. [DOI] [PubMed] [Google Scholar]
Associated Data
This section collects any data citations, data availability statements, or supplementary materials included in this article.
Supplementary Materials
Table S1 Study design for rat telemetry study with AZ1 and regorafenib.
Table S2 Concentrations obtained at 2 h post dose in the rat telemetry study.
Table S3 Overview of Clinical PKPD models of BP changes with VEGFR‐2 inhibitors used in analysis.
Table S4 Final parameter estimates for PKPD model estimated from rat telemetry study with AZ1 (PK was fixed). A handling effect was included as described in Equation 1.
Table S5 Final parameter estimates for PKPD model estimated from rat telemetry study with regorafenib (PK was fixed). No handling effect was required.
Table S6 Sunitinib Rat telemetry parameter estimates (PK was fixed during PD estimation) using PK model estimated from data in Speed et al. and average rat BP from Engle et al. No mixed effects (i.e. IIV or IOV) or handling effect was included in the final model fit.
Table S7 Overview of approach to simulate exposure‐response relationship for clinical PKPD reports.
Table S8 VEGFR‐2 IC50 values from HUVEC, PAE and SPR assays, and rat and human f u where relevant. *was obtained from Wilhelm et al., 2011.
Table S9 References for studies used to determine the incidence of hypertension for tyrosine kinase inhibitors.
Figure S1 Observed systolic blood pressure (SBP) over time following dosing of vehicle and AZ1 to male Han Wistar rats, versus the individual and population PKPD model fit for each animal. The black circles indicate the observations the population model fit is represented as the black line, the individual model fit as the grey line. Top row for test occasion 1 high dose (450 mg·kg−1), middle row for test occasion 2 low dose (10 mg·kg−1) and bottom row for test occasion 3 mid dose (100 mg·kg−1).
Figure S2 Observed systolic blood pressure (SBP) over time following dosing of vehicle and regorafenib to male Han Wistar rats, versus the individual and population PKPD model fit for each animal. The black circles indicate the observations the population model fit is represented as the black line, the individual model fit as the grey line. Top panel for test occasion 1 low dose (8 mg·kg−1) and bottom panel for test occasion 2 high dose (16 mg·kg−1) as indicated.
Figure S3 Observed mean aortic blood pressure (MBP) over time following repeated daily dosing of vehicle, 5 and 50 mg·kg−1 of sunitinib in male Sprague Dawley rats (n = 4), versus the PKPD model fit. The dots indicate the observations after vehicle (diamonds), 5 mg·kg−1 (squares) and 50 mg·kg−1, the model fit for vehicle represented as grey line, 5 mg·kg−1 in dashed black line, 50 mg·kg−1 as solid black line. Data‐points extracted from (Engle and Watson, 2016; Speed et al., 2012).