

Summary
The immune system can mount T cell responses against tumors; however, the antigen specificities of tumor-infiltrating lymphocytes (TILs) are not well understood. We used yeast-display libraries of peptide-human leukocyte antigen (pHLA) to screen for antigens of ‘orphan’ T cell receptors (TCRs) expressed on TILs from human colorectal adenocarcinoma. Four TIL-derived TCRs exhibited strong selection for peptides presented in a highly diverse pHLA-A*02:01 library. Three of the TIL TCRs were specific for non-mutated self-antigens, two of which were present in separate patient tumors, and shared specificity for a non-mutated self-antigen derived from U2AF2. These results show that the exposed recognition surface of MHC-bound peptides accessible to the TCR contains sufficient structural information to enable reconstruction of sequences of peptide targets for pathogenic TCRs of unknown specificity. This finding underscores the surprising specificity of TCRs for their cognate antigens, which enables the facile identification of tumor antigens through unbiased screening.
ETOC
A new approach for identification T cell receptor ligands reveals insights into the specificity of tumor-infiltrating lymphocytes
Introduction
T cells are integral to the adaptive immune system and provide protection against pathogens and cancer (Davis and Bjorkman, 1988). They function through extracellular recognition by the TCR, which is specific for short peptides presented on the human leukocyte antigen (HLA) on cells (Rossjohn et al., 2015). The diversities inherent to the TCR, peptide, and HLA molecules make identifying the specificity of any one TCR an extremely complex problem. While our ability to characterize T cells and sequence their TCRs has improved considerably (Han et al., 2014), the ability to determine and study the antigen specificities of T cells has remained a major bottleneck. Approaches to determining the specificity of ‘orphan’ TCRs (i.e. TCRs of unknown antigen specificity) could help uncover potential targets for cancer immunotherapy, autoimmunity, and infection.
There have been a number of strategies used to determine the specificity of ‘orphan’ TCRs (Birnbaum et al., 2012). Mass spectrometry can provide an unbiased method of antigen isolation (Abelin et al., 2017), but requires large cell numbers, typically 107 to 109. Most studies of T cell antigen specificities involve testing candidate antigens empirically. For example, studies of anti-tumor T cell specificities have shown that there are productive T cell responses towards neo-antigens. Such studies entail sequencing of tumors to identify mutations, using epitope prediction algorithms to predict immunogenic mutant peptides, and testing for T cell responses directed at these mutant peptides (Kreiter et al., 2015; Rajasagi et al., 2014; Tran et al., 2014). Other strategies query established T cell specificities in patients by using pHLA multimers (Bentzen et al., 2016; Newell et al., 2013).
We sought to extend a previously reported technology using yeast-display of pHLA libraries as an approach to TCR ligand discovery, which requires no a priori knowledge regarding the nature of these antigens (Adams et al., 2011). This approach is an unbiased, affinity-based selection of a diverse pHLA library by a TCR of interest (Figure 1A). This technique has previously been used to study the cross-reactivity of TCRs of known peptide specificities (Adams et al., 2016; Birnbaum et al., 2014). Other variations of a library strategy have been used to study TCR specificities and/or mimotopes (Birnbaum et al., 2012; Hiemstra et al., 1997; Rubio-Godoy et al., 2002; Wang et al., 2005). Through pHLA library screening, previously unknown stimulatory human antigens and mimotopes derived from the library were identified for two TCRs of known specificity for myelin basic protein (MBP) (Birnbaum et al., 2014). This result suggested that this approach could, in principle, enable recovery of full peptide sequences of ligands to orphan TCRs.
Figure 1.

Design of the peptide-HLA-A*02:01 yeast-display library.
(A) Methodology for selecting a yeast-display library of pHLA. Each yeast displays a unique peptide that is genetically encoded. A typical library contains ~108 unique peptides, which is selected by a TCR of interest. Yeast are enriched in an affinity-based selection using bead-multimerized TCR and grown for iterative rounds of selection. Peptides are successively enriched and all yeast DNA is deep-sequenced. These synthetic peptide sequences are used to generate a model to make predictions for TCR ligands derived from the human proteome and/or patient-specific exome.
(B) The goal of the study is to use the yeast-display selection to de-orphanize a TCR of unknown antigen specificity. The peptides selected by a TCR from the yeast-display selection generates a recognition landscape for a particular TCR, which is then used to make predictions of antigen specificity for orphan TCRs. Predicted targets can be validated in a T cell stimulation assay.
(C) The construct utilizes a single-chain design to display the pHLA-A*02:01 complex tethered to an epitope tag and Aga2p, which binds to the native Aga1 protein on yeast. Each component is connected covalently by a Gly-Ser linker. The epitope tag is introduced to monitor expression of the library.
(D) The MART-1/HLA-A*02 complex structure (PDB 4L3E) highlighting the two peptide anchors with orange arrows. These peptide positions at P2 and PΩ of the peptide allow for peptide binding to HLA-A*02.
(E) An example 8mer peptide library shows the anchor preferences for the HLA-A*02:01 library and the remaining positions that are randomized to any of the twenty amino acids (X = twenty amino acids and stop codon). Nucleotide abbreviations for codon usage are listed according to the IUPAC nucleotide code.
(F) A multi-length library designed to capture the most common length peptides presented by HLA-A*02:01. Each peptide length is placed in a construct using a unique epitope tag for selection monitoring. The libraries have theoretical nucleotide diversities dictated by the peptide length and library composition. The functional diversity represents the true capacity of the physical libraries based on yeast colony counting after limiting dilution of the library.
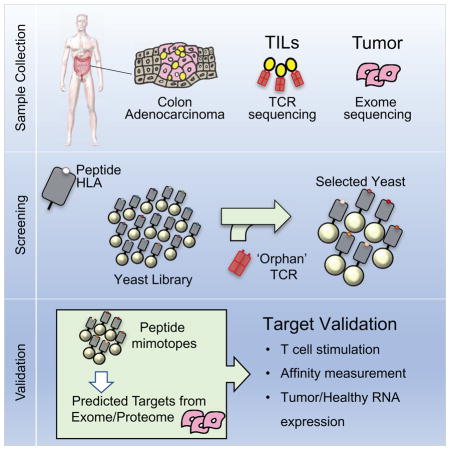
Here, we have attempted to identify antigens recognized by TCRs derived from TILs (Figure 1B). We applied single-cell T cell phenotyping and TCR sequencing (Han et al., 2014) of CD8+ TILs in two HLA-A2 homozygous patients with colorectal adenocarcinoma to predict candidate antigen targets from yeast-display library selections (Figure 1B). Of the TCRs screened, four TCRs isolated peptide targets in the HLA-A*02:01 library. Two of these TCRs shared antigen specificity. The synthetic peptides isolated from the library, in addition to predicted peptides from the Uniprot human reference genome, stimulated the respective T cell receptors of interest. Surprisingly, three of the four receptors recognized unmutated self-antigens. This serves as proof-of-principle for linking T cell immune responses and their clonal TCRs with a direct antigen identification method that can serve as a powerful tool to identify novel cancer antigens recognized by the immune response.
Results
Design of the HLA-A*02:01 yeast-display library
The HLA-A*02:01 allele is present in up to 50% of a number of populations (Gonzalez-Galarza et al., 2015). The binding motifs for peptides presented by HLA-A*02 have been well characterized (Rammensee et al., 1999) and a number of restricted clinically relevant TCRs identified (Johnson et al., 2009). We generated a yeast-display library for screening potential HLA-A*02:01-restricted T cell receptors (Figure 1A). Individual yeast express a random peptide covalently linked to the HLA molecule, which enables peptide identification by DNA sequencing (Figure 1C) (Adams et al., 2016; Birnbaum et al., 2014). This pHLA library features an N-terminal peptide library linked to wildtype β-2-microglobulin (B2M) and HLA-A*02:01 heavy chain with a single point mutation Y84A (See STAR Methods). To ensure proper display of peptides in the binding groove, the peptide library restricts amino acid usage at P2 and PΩ to the aliphatic hydrophobic residues preferred by HLA-A*02:01 (Rammensee et al., 1999) (Figure 1D–F). At other positions, NNK codons randomly encode all twenty amino acids to provide an unbiased library. Because HLA-A*02:01 typically presents peptides 8 to 11 amino acids in length (Hassan et al., 2015), we generated multiple peptide length libraries using epitope tags for multiplexed selections (Figure 1F). Each library has a theoretical nucleotide diversity dictated by the library composition and length, but the functional diversity of the library is limited (Figure 1F). In total, we estimate that approximately 400 million unique peptides ranging from 8 to 11 amino acids are represented in the combined libraries.
Validation of the library with the MART-1-specific DMF5 TCR
To determine whether the HLA-A*02:01 complex is properly folded to present peptides, we used a ‘proxy’ TCR with known specificity. We used the DMF5 TCR (Johnson et al., 2009), which is a naturally occurring TCR that recognizes a 10 amino acid sequence (EAAGIGILTV) derived from the MART-1 melanoma antigen bound to HLA-A*02:01 (Borbulevych et al., 2011). To validate the HLA-A*02:01 library, the 10mer peptide ELAGIGILTV, which has improved HLA stability (Cole et al., 2010), was displayed with HLA-A*02:01 on yeast and stained by both an anti-hemagglutinin (HA) antibody and 400 nM tetramerized DMF5 TCR, indicating surface expression of the protein complex and proper folding of the pHLA (Figure 2A). To confirm that the library could be used to identify the antigen of the DMF5 TCR, the HLA-A*02:01 10mer library (Figure 1F) was selected by MACS bead-multimerized DMF5 TCR (See STAR Methods, Figure 2B). A sample of the fourth round of selection was sequenced to identify enriched peptides, most of which were found to be highly related to the MART-1 10mer peptide. The yeast containing these sequences were stained with TCR tetramer (Figure 2C) and anti-HLA-A*02 (Figure S1A).
Figure 2.

Validation of the HLA-A*02:01 library with the DMF5 TCR
(A) The DMF5 TCR stains yeast displaying the MART-1 peptide (ELAGIGILTV) in complex with HLA-A*02:01 on the surface of yeast. Streptavidin-647 (SA-647) was used to tetramerize and fluorescently label the DMF5 TCR.
(B) Enrichment of the 10mer length HLA-A*02:01 yeast-display library by the DMF5 TCR as measured by anti-HA epitope tag staining by flow cytometry. Three of four rounds of selection shown.
(C) Highly-enriched peptides sequenced from the 10mer selection by the DMF5 TCR are stained by the DMF5 TCR tetramer and measured by flow cytometry.
(D) The fraction of total sequencing read counts of the top 10 peptides according to deep sequencing of round 3 of the 10mer HLA-A*02:01 library selections by the DMF5 TCR.
(E) Unique peptides from round 3 of selection fall into two major clusters that appear similar to the wildtype MART-1 peptide sequence. Clusters are determined by first calculating reverse hamming distance between all peptides present in round 3 of the selection and then clustered by score. The MART-1 decamer structure (PDB: 4L3E) is aligned to the selected peptides.
(F) A substitution matrix (2014PWM) using cluster 1 peptides predicts the MART-1 peptide as the most probable peptide to bind the DMF5 TCR among eight other predicted peptides.
All rounds of the yeast-display selection by the DMF5 TCR were deep-sequenced. The library converged significantly by round 3 of the selection to 68 unique peptides, of which the top 10 peptides dominated 91.7% of the library (Figure 2D). The most striking observation was that almost all peptides selected had a Gly at P6 (P6G) (Table S1), consistent with the DMF5-MART-1/HLA-A*02:01 crystal structure showing that P6G provides flexibility to allow a cleft for CDR3β 100F, to which P6G hydrogen bonds (Borbulevych et al., 2011). Deep-sequencing revealed two major clusters of peptide sequences (Figure 2E). To clarify these clusters, the reverse hamming distance, which is a metric used to identify the number of exact amino acid matches between two peptides, was calculated between all peptides and then clustered by score (Figure 2E, Table S1). The two major clusters diverged at P4 to P6 with a central ‘GIG’ motif in 29 peptides (cluster 1) and a central ‘DRG’ motif in 32 peptides (cluster 2). Cluster 1 peptides were used in a search matrix to score potential human peptide targets, a method used previously to predict human antigens from yeast-display selection data (2014PWM) (Birnbaum et al., 2014). However, because the 10mer library did not allow for Ala at P2 of the library, P2A was manually included in the search matrix matching the anchor with the lowest frequency – Leu at 16.67%. From this analysis, 9 peptides from the human proteome were predicted with varying probabilistic scores to bind the DMF5 TCR (Figure 2F, Table S1). Strikingly, the human MART-1 peptide was the most probable to bind the DMF5 TCR of the 9 peptides predicted (Figure 2F). Using cluster 2, orders of magnitude more peptides were predicted to bind the TCR (Figure S1B, S1C, Table S1). However, the DMF5 TCR has not shown any off-target toxicity (Johnson et al., 2009), indicating that this other ‘DRG’ peptide motif may not be physiologically relevant.
Blinded validation of the HLA-A*02:01 library with neoantigen-specific TCRs
We screened three TCRs derived from a melanoma patient, in which all TCRs had blinded specificities to neoantigens. These antigens had been identified independently by exome sequencing of tumor material, predicting neoantigen presentation by HLA-A*02:01 and staining of patient-derived tumor-infiltrating T cells with peptide-loaded HLA-A*02:01 multimers (van Rooij et al., 2013) (Kelderman et al., unpublished). The three recombinant TCRs, labeled NKI1, NKI2, and NKI3 were used to select the HLA-A*02:01 library containing all four peptide lengths.
Only the selection for NKI2 produced 400 nM tetramer-positive yeast beginning at round 2 of the selection, indicating strong binding of the peptide-HLA-A*02:01 library (Figure 3A) (Table S2). The peptides converged by round 3 of the selection and peptides were clustered by reverse hamming distance (Figure 3B). The selection results for NKI2 showed similarity in 9mer, 10mer, and 11mer sequences, sharing a conserved Glu in the 9mer, 10mer, and 11mer sequences at P6, P7, and P8 respectively, and the peptides share a positively charged residue at P5 of the 9mer, 10mer, and 11mer.
Figure 3.

Blinded validation of the HLA-A*02:01 library by neoantigen-specific TCRs.
(A) Three TCRs of blinded specificity separately enrich the HLA-A*02:01 library for a specific peptide length according to epitope tag staining over the rounds of selection. The left panels indicate tetramer and epitope staining after all 4 rounds of selection have completed and the right panels indicate epitope staining through the course of selections.
(B) Unique peptides selected by NKI 2 in round 3 of the selection are parsed by peptide length and clustered by reverse hamming distance. The number of peptides identified in the cluster are shown on the right along with the respective peptide lengths.
(C) The maximum reverse hamming distance computed between every 10mer of the selected peptides by NKI 2 at round 3 and each 10mer neoantigen peptide from the list of 127 total neoantigens.
(D) Two peptides Lib-1 and Lib-2 from the selected library closely resemble the 10mer neoantigen peptide ALDPHSGHFV derived from CDK4. Identical amino acids with the neoantigen are colored in red.
(E) The top 5 peptides of length 10 selected by the NKI 2 TCR were used to stimulate peripheral blood lymphocytes transduced with NKI2 TCR, which is specific for the CDK4 neoantigen ALDPHSGHFV. Transduced lymphocytes were mixed 1:1 with JY cells pulsed with peptide, control peptide, or no peptide, and IFNγ production as measured by intracellular antibody staining was assessed using flow cytometry.
Related to Table S2.
As part of the blinded validation, a list of 127 neoantigens predicted to be presented by HLA-A*02:01 served as candidate ligands for the NKI2 TCR (Stronen et al., 2016). The reverse hamming distance was calculated for each of these 127 potential neoantigen peptides compared to the list of 10mer synthetic peptides selected by NKI2 (Figure 3C). ALDPHSGHFV, a peptide neoantigen derived from cyclin-dependent kinase 4 (CDK4), had 5 and 6 of the 10 positions being identical to library peptides Lib-1 and Lib-2, respectively (Figure 3D). CDK4 was correctly identified and confirmed as the neoantigen target of NKI2. The targets of NKI1 and NKI3 could not be unambiguously identified through this blinded validation.
We next asked whether the predicted peptides could stimulate NKI2-expressing T cells. Human peripheral blood lymphocytes were transduced with either NKI1 or NKI2 and co-cultured with HLA-A*02:01+ JY cells loaded with each of the top 5 peptides selected by NKI2. Interestingly, all 5 peptides elicited IFNγ production by NKI2 transduced T cells in a dose-dependent manner (Figure 3F). Furthermore, the most selected peptide mimotope ALDSRSEHFM stimulated these cells as potently as the CDK4 neoantigen ALDPHSGHFV itself.
Single-cell characterization of tumor-infiltrating lymphocytes in colorectal cancer patients
Our ultimate goal is to identify peptide ligands for TCRs derived from expanded and cytotoxic T cell populations infiltrating patient tumors using the yeast-display platform (Figure 1B). Single-cell technology for analyzing T cells (Han et al., 2014) provides a means to individually phenotype single T cells and to sequence their paired αβ TCRs in a high-throughput manner.
We selected patients homozygous for the HLA-A*02 allele (Figure 4A). This improves the probability that a T cell isolated from a patient has a receptor restricted to the HLA-A*02 allele. The full HLA locus was typed for both patients sans HLA-C (Table S3). HLA-A*02:01 and HLA-A*02:06 suballeles have been described to share a subset of presentable peptide antigens (Sudo et al., 1995), although differences can amount to distinct patterns of TCR multimer staining of pHLA (van Buuren et al., 2014).
Figure 4.

Profiling TCRs identified in two HLA-A*02 patients with colorectal adenocarcinoma
(A) Study design to de-orphanize patient-derived TCRs on the HLA-A*02:01 library with summarized results.
(B) Bar graph of abundances of unique paired αβ TCR sequences from TILs. * = TCRs that enriched peptides from the library.
(C) Venn diagrams representing the overlap of individual unique CDR3α or CDR3β chain sequences between tumor and healthy tissues for each patient. The number indicates the amount of CDR3 sequences in the nearest section of the Venn diagram.
(D) Heatmaps identifying the binary measurement of transcription factors using sequencing of amplified and barcoded transcripts. The alternating black and white panels indicate boundaries of single T cell clones with the same receptor sequences, with the most abundance clones beginning from the left most side. The left panel identifies those T cells with TCRs chosen from Patient A to be screened and green denoting the presence of transcript. The right panel identifies those T cells with TCRs chosen from Patient B to be screened and blue denoting the presence of transcript. White indicates lack of transcript detected. TCRs 1A, 2A, 3B, and 4B are labeled.
Both patients were males in their mid-60s with colorectal adenocarcinoma (Figure 4A). Tissue samples of the tumors were analyzed for infiltration of CD8+ and CD4+ T cells and the overall structure observed by H&E staining (Figure S2A). For Patient A, CD4+ and CD8+ T cells were found in the lamina propria of the colon, but less in the tumor. For Patient B, CD4+ T cells were not abundant within the colon tissue; however, there was significant CD8+ T cell infiltration into the tumor.
From these two patients, several hundred CD8+ T cells were phenotyped and sequenced from the site of the tumor with 53-paired sequences from the healthy tissues and 709-paired sequences from the tumor tissues (Figure 4B). Any clone seen more than once at the site of the tumor is considered an expanded clone. In both cases, there were expanded TCR clones in the tumor, suggesting antigen-specific expansion. The most expanded TCR clones comprised 12.9% (23/178) of the sequenced population in Patient A and 6.67% (35/526) in Patient B, respectively. This level of expansion at the tumor is consistent with other reports of T cell repertoire populations in primary liver carcinoma (Shi et al., 2017) and CD4+ T cells infiltrating colorectal carcinoma (Han et al., 2014). Because not many T cells were identified from healthy tissue, clones were considered exclusive to the tumor and not shared with healthy tissue if either α or β chain are not shared. For both patients, both α and β chain sequences showed only a small overlap of sequences between tumor and healthy tissues (Figure 4C). This suggests that most TIL T cell clones are enriched and present in the tumor as a result of tumor-driven responses; however, we cannot conclude that any TIL TCR is exclusively present within tumor due to limited sampling of healthy tissue.
The T cell receptors sequenced from the patients exhibited typical CDR3α and CDR3β lengths (Rock et al., 1994) (Figure S2B). Both patients had a predominance of TRAV8-3, TRAV19 (Figure S2C), and TRBV7-2 (Figure S2D) expression. Unlike T cells from Patient A, T cells from Patient B were analyzed by index sorting, allowing for pairing of cell surface marker expression and transcript expression. When separating T cell populations based on cell surface markers and transcriptional profiles using t-Distributed Stochastic Neighbor Embedding (t-SNE) (Van der Maaten and Hinton, 2008), CD8+ and CD4+ T cell populations separated into major clusters (Figure S2E). For Patient B, there was significant CD8+ T cell infiltration into the tumor and the majority of cells sampled co-expressed PD-1 and IFNγ with a heterogenous expression of other cytotoxic markers granzyme B, perforin, and TNF-α. It has been suggested that the PD-1+CD8+ T cell population is the tumor-reactive population (Gros et al., 2016; Gros et al., 2014).
Screening Orphan TCRs on the HLA-A*02:01 Library
Twenty candidate receptors were chosen based on local expansion at the tumor, cytotoxic profile (IFNγ, TNFα, perforin, granzyme B), and in some cases based on common TCR chain usage (Figure 4B, 4D). Of the twenty candidate TCRs (Table S4) screened on the HLA-A*02:01 library, four TCRs enriched peptides from the library, TCRs 1A and 2A derived from Patient A and TCRs 3B and 4B derived from Patient B (Figure 5A). Two receptors, 2A and 3B, isolated from separate patients, express the same TCRα chain and similar TCRβ chains, which contain CDR3β sequences of the same length with five conservative amino acid differences and a central Val residue completely generated by NP addition (Figure 5B).
Figure 5.

Four TIL-derived TCRs enrich the HLA-A*02:01 library for peptides.
(A) TCR sequences of the four orphan TCRs that selected peptides from the HLA-A*02:01 library. The TCR gene segments variable and joining are shown along with the corresponding CDR3 sequence. The abundance represents the amount of times a single cell was found to have the exact TCR sequence in tumor/healthy tissue.
(B) Nucleotide sequences of the two sequence-similar TCRs isolated from patients A and B. Non-encoded nucleotides are highlighted in red.
(C) HLA enrichment and tetramer staining per round of selection by the four orphan TCRs as measured by flow cytometry. The left panels indicate tetramer and epitope staining after all 4 rounds of selection have completed and the right panels indicate epitope staining through the course of selections.
Each TCR was screened on the HLA-A*02:01 library. Each of the four TCRs enriched an HLA-linked epitope tag expressed by the yeast, while the remaining sixteen TCRs did not (Figure 5C, data not shown). For TCRs 1A, 2A, and 3B, tetramer stained yeast gradually increased across the rounds of selection. However, TCR 4B did not stain the yeast despite successive enrichment of the 9mer epitope tag (Figure 5C). Lack of enrichment of the remaining sixteen TCRs screened is most likely HLA restriction to alternative HLA alleles; other possibilities are raised in the Discussion.
The yeast selected by TCRs 1A, 2A, 3B, and 4B were deep sequenced (Table S4). For all four TCRs, sequences converged by round 3 of the selection and the unique peptide sequences were used to generate peptide motifs to identify positional hotspots (Figure 6A). The highly similar TCRs 2A and 3B selected for related peptide sequences, 11 of which were common to both (Figure 6C). The selection of a common pool of peptides suggests that these TCRs recognize the same antigen. However, significant differences are seen between these two motifs at P6 with an invariant Asn for TCR 2A and Asn, Glu, and Ser predominant for TCR 3B. In general, TCR 2A displays a wider degree of cross-reactivity selecting 190 unique peptides (data not shown) with positions P1, P4, and P5 allowing more amino acid substitutions than in the 66 unique peptides selected by TCR 3B (data not shown). TCRs 1A and 4B have different motifs entirely with 15 and 61 unique peptides selected, respectively at the third round of selection (data not shown).
Figure 6.

Deep-sequencing of the yeast selections by the four TIL TCRs.
(A) Word logos display the unique round 3 selected peptides for each TCR not accounting for deep sequencing read count abundance. The size of the amino acid letter represents its proportional abundance at the given position among the unique peptides.
(B) Heatmap plots showing the amino acid composition per position of the peptide accounting for peptide enrichment at round 3 of the selection. Darker colors indicate greater abundance of a given amino acid at a given position. Anchor residues are outlined in black.
(C) TCRs 2A and 3B select an overlapping set of 11 peptides in round 3 of the selection shown as a fraction of total reads in round 3.
One method to measure cross-reactivity of a T cell receptor is to observe the selected breadth of tolerated amino acids at a particular position of the peptide. Thus, we determined the proportions of all amino acids at every position, accounting for peptide enrichment at round 3 (Figure 6B). TCR 1A and 3B are relatively specific for their peptide motif with more rigidity in amino acid preference per position. In contrast, TCRs 2A and 4B are more cross-reactive in their specificity, allowing degeneracy at positions along the peptide, except for the limited anchor residues. Despite the close similarities in amino acid sequences between 2A and 3B, the TCRs display a high contrast in cross-reactivity for their peptide landscapes. In this respect, the pHLA library screening is effective at ‘measuring’ the relative cross-reactivity of TCRs, which could be important for selection of TCRs for adoptive cell therapy, in which limited cross-reactivity may be desired to limit autoreactivity (Raman et al., 2016).
TCR target prediction from human proteome and patient exomes
The peptides identified in the yeast-display selections generate a recognition landscape of sequences for each TCR. As was done for the DMF5 TCR using the 2014PWM, this information can be used in an algorithm to predict stimulatory human antigens. In applying the algorithm to the colorectal cancer data, we generated human predictions for TCR 2A (Table S6), but yielded no predictions for TCR 1A and TCR 3B and limited predictions for TCR 4B (Table S7). This motivated the development of two additional algorithms to predict human peptides from selection data – a modified variant of the previous statistical method (2017PWM) and a method utilizing a two-layer convolutional neural network (2017DL) (See STAR Methods). Data from previous selections using the DR15 library was used to test the accuracy of the 2017PWM and 2017DL algorithms in predicting peptide antigens (Birnbaum et al., 2014). MBP was the best prediction using 2017DL and the second best prediction using 2017PWM for TCR OB1.A12 (data not shown) and the second best prediction in both algorithms for TCR OB1.2F3 (data not shown).
The additional two algorithms were used to score predicted peptides from the human proteome using the UniProt database (Tables S6–8). For TCRs 2A and 3B, there were many peptides that were predicted by multiple algorithms for both TCRs, indicating shared target specificity. Overall, the three algorithms were able to collectively make predictions from the human proteome for all four TCRs (Table S5–8).
Because patient mutations can generate neoantigens recognized by T cells, we performed exome sequencing and variant calling to identify potential candidates. In total, 762 PASS variants were identified in Patient A and 4,763 PASS variants identified in Patient B with at least 30x sequencing coverage for both healthy and tumor tissue. Exome peptides were scored by the 2017PWM and 2017DL algorithms, but very few were significant across the TCRs (data not shown). One exception was a 21-nucleotide translocation from an intron to exon 7 of the same WDR66 gene, which generated a neoantigen peptide in Patient A, albeit with sub-optimal HLA anchors that would result in it being poorly presented, if at all. This resulted in a novel peptide sequence EYGVSYEW, which closely matches the peptide motif for patient A-derived TCR 1A, however the significance of these findings is unclear. Overall, the predictions for the four TCRs suggest that three of the four are likely to bind unmutated self-antigens.
In vitro target validation of synthetic and predicted human peptides
Both synthetic peptides selected from the library and the predicted human peptides from the human and/or exome were presented by T2 cells used to stimulate SKW-3 CD8+ T cell lines modified to express the four TCRs identified from the patients. Interestingly, the synthetic library peptides selected by TCR 1A all potently stimulated the T cells via CD69 activation (Figure 7A, Figure S3A) and in a dose-dependent manner (Figure 7B). For TCR 1A, the exome peptide (EYGVSYEW), the anchor-modified exome peptide (EMGVSYEM), nor the human peptide predictions stimulated the cell line (Figure 7A). Although we have identified a strong antigen recognition motif for TCR 1A, we have not been able to recover a stimulatory endogenous antigen, only mimotopes.
Figure 7.

Activation of TIL-derived TCRs with predicted human targets and peptide mimotopes.
TCRs are retrovirally infected into CD8+ SKW-3 cells and sorted for stable TCR (IP26) and CD3 (UCHT1) co-expression. T2 antigen-presenting cells are pulsed with 100 μM peptide for 3 hours, co-incubated with the T cell lines for 18 hours and analyzed for CD69 expression by flow cytometry. (A) TCR1A, (C) TCR2A, (E) TCR3B, and (G) TCR4B are tested for CD69 activation by peptide stimulation in technical triplicate with standard deviation shown. A representative experiment is shown from biological triplicate. (B), (D), (F), (H) A dose-response curve for each stimulatory peptide is shown on the right plotted with means of biological triplicates with standard error of the mean. For both experiments, p-values are calculated using ordinary one-way ANOVA. For TCRs 2A and 3B, 17 non-stimulating peptides are removed for simplicity (Table S6).
See also Figure S3, Table S5, Table S6, Table S7, and Table S8.
For the three TCRs 2A, 3B, and 4B (Figure 7C–H), we were able to identify stimulatory endogenous antigens. TCR 4B was stimulated by its selected synthetic peptide libraries and also stimulated by 6/19 of the predicted human peptides, which is in accord with the higher degree of cross-reactivity seen in the yeast selection deep-sequencing analyses (Figure 7G, 7H, Figure S3D). Interestingly, we see that TCR 4B is stimulated by antigens from two different putative driver genes WDR871310–1318 (peptide LLEDLDWDV), a testis-expressed antigen found to be recurrently mutated in colorectal cancer (Brim and Ashktorab, 2016; Guda et al., 2015), and CRISPLD182–90 (peptide NMEYMTWDV), a protein expressed in many cancers with no known function (Chung et al., 2016; Uhlen et al., 2015). The cysteine-rich secretory proteins, antigen 4, and pathogenesis-related 1 proteins (CAP) superfamily includes CRISPLD1, and these proteins have been implicated in a wide-range of functions including ion channel regulation, reproduction, cancer, cell-cell adhesion, and others (Gibbs et al., 2008). From exome analysis, Patient B has a mutation in CRISPLD1 at D143Y (data not shown). TCR 4B is also stimulated by 5 other human antigens including CD74181–189 peptide TMETIDWKV, FANCI1104–1112 peptide VLEEVDWLI, GEMIN4771–779 peptide KLEQLDWTV, PDE4a243–251 peptide TLEELDWCL or PDE4b231–239 peptide TLEELDWCL, and KLHL7506–514 peptide NVEYYDIKL. The true in vivo specificity cannot be unambiguously identified without additional tumor information.
The highly similar TCRs 2A and 3B have different stimulatory profiles against the selected synthetic peptides (Figure 7C–F, Figure S3B–C). TCR 2A cells were stimulated by four of the top five peptides selected by TCR 2A and four of the top five peptides selected by TCR 3B. However, TCR 3B cells were only stimulated by four out of the top five peptides selected by its own TCR and none selected by TCR 2A. These results support the finding that TCR 3B is relatively selective compared to TCR2A (Figure 6B). Strikingly, of the 26 human peptides tested from the predictions (Table S6), only a single human peptide was found to stimulate T cells with bearing either receptor (Figure 6C, 6E). This peptide is MMDFFNAQM, which is derived from U2AF2174–182, a protein involved in an RNA splicing complex. U2AF2 is normally expressed in many human tissues and overexpressed in many cancers including colorectal cancer as determined by antibody staining deposited in the Protein Atlas (Uhlen et al., 2015). In fact, U2AF2 RNA was overexpressed in tumor tissue over healthy tissue by 2.11- and 2.65-fold in Patient A and Patient B, respectively (Figure S4A). When examining human lymphoma, breast, colon, and lung tumor cell lines, U2AF2 RNA is overexpressed significantly relative to patient samples (Figure S4B–C). U2AF2 has been implicated in promotion of tumor metastasis in melanoma (Zhang et al., 2016) and is rarely mutated in chronic myelogenous leukemia, myelodysplastic syndro mes, and solid tumors like lung adenocarcinomas (Garraway and Lander, 2013). U2AF1, U2AF2’s binding partner, is commonly mutated in cancer and mutations have shown enhanced RNA splicing and exon skipping, leading to gene dysregulation in vitro (Graubert et al., 2011). In both patients, no mutations were found in U2AF2 or U2AF1 (data not shown). For the more cross-reactive TCR 2A compared to TCR 3B, an additional human peptide VLDFQGQL derived from protein TXNDC11107–115 was able to stimulate the receptor, which has not been previously described to be involved in cancer, but is expressed in the colon and many other tissue types (Uhlen et al., 2015).
We determined by surface plasmon resonance the affinity of TCR 2A for the peptide MMDFFNAQM displayed by HLA-A*02:01 to be 110 μM, identifying a bona fide interaction (Figure S4D–E). An affinity could not be determined for TCR 3B. These low affinities may explain, in part, the lack of TCR tetramer staining of yeast expressing the single-chain MMDFFNAQM-HLA-A*02:01 (Figure S3F–G). These discordant results of stimulation versus tetramer binding are seen across all TCRs studied (Figure S3-E–H). Additionally, MMDFFNAQM-HLA-A*02:01 tetramers failed to stain SKW-3 cells expressing either TCR2A or TCR 3B (data not shown). Unfortunately, tissue samples were not available to confirm peptide presentation by HLA-A*02 by mass spectrometry. Although we cannot definitively determine an immune response targeting the peptide derived from U2AF2, the evidence from the yeast-display screen, prediction algorithm, and in vitro stimulation identify this peptide as the likely target.
Discussion
The fundamentally surprising insight from our studies is that the specificity encoded in the small kernel of the MHC-bound peptide visible to the TCR, is sufficient to enable reconstruction of entire sequences of endogenous peptides specific to TCRs of unknown specificity. This finding has important implications for the identification of antigens in T cell mediated diseases. T cells provide an avenue of therapeutic treatment in infectious diseases, autoimmunity, allergy, and cancer. In most of these, we have very little information about T cell specificities, especially in humans, because of limited methods. This situation has improved through the availability of high-throughput methods to obtain TCR sequences from single T cells directly ex vivo (Han et al., 2014), but one is still faced with the daunting task of determining peptide ligand(s). Here we combine a single cell TCR analysis method (Han et al., 2014) with a refined version of the yeast display library screening approach (Birnbaum et al., 2014) to discover novel pHLA specificities in human colorectal adenocarcinoma.
A single wildtype antigen derived from U2AF2 is likely a shared immune response target in 2/2 patients studied. For all TCRs that were successfully screened on the HLA-A*02 library, we were able to identify multiple mimotope peptides that stimulated these TCRs, often more potently than the native peptide. Akin to neoantigens, the synthetic peptide antigens or mimotopes may have utility as DNA, RNA or peptide vaccines to stimulate particular antigen-specific T cells (Ott et al., 2017) and generate a more immunogenic response than the self-antigen that the immune response is likely tolerant towards (Buhrman et al., 2013).
Although this technique has been successful in four cases, the remaining sixteen TCRs screened failed to select peptide ligands, for a number of possible reasons. In most cases αβ TCR pairs isolated from a patient have an unknown HLA restriction, and the screen conducted here focuses solely on the HLA-A*02 allele. In addition to uncertainty in HLA restriction, there is also uncertainty in peptide length. Class I HLA molecules have shown to accommodate unusually large peptide lengths (Hassan et al., 2015), which can result in missed specificities if the peptide length is not present in the library. Additional considerations include the sensitivity of the selections, in which extremely low affinity TCRs may not isolate antigens from the library despite the highly avid selections. Post-translational modifications such as citrullination or glycosylation to peptide antigens common to autoimmune disorders are important in TCR recognition (Malmstrom et al., 2017) and are not captured in the yeast-display selections. Spliced peptide antigens can arise post-translation (Liepe et al., 2016) and complicate the ability to correctly identify the target antigen(s) and corresponding human protein(s). The success of predicting the cognate tumor antigen from deep sequencing selection data depends on improved and refined search algorithms and patient tissue validation. However, screening more TCRs from a given tumor can increase the odds of linking selection data to the cognate antigen, especially when coupled to relevant patient data including RNA expression and/or mass spectrometry of eluted peptides.
We envision two principal applications for this method in immunotherapy: 1) to identify endogenous and mimotope ligands for orphan TCRs and/or 2) as a means of classifying TCRs based on peptide antigen specificities, which will allow the identification of clinical candidate TCRs that recognize shared antigens across patients. Shared TCRs can either be receptors that share similar TCR sequence (Munson et al., 2016; Shi et al., 2017), which can potentially lead to shared antigen specificity, or TCRs that do not have any shared sequence but recognize the same antigen. Such TCRs recognizing shared antigens would be especially useful in engineered T cell or vaccine therapies (Buhrman et al., 2013). As TCR sequencing continues to advance and more TCR sequencing data becomes available, we can potentially infer TCR restriction for patient HLA and infer a common TCR specificity for convergent TCR sequence clusters (Glanville et al., 2017). This could enable TCR ligand identification to be more effectively directed at impactful TCRs with known HLA restriction.
Unlike other methods utilizing exome data to identify patient-specific neoantigens that can serve as potential targets of the T cell immune response, this method is an unbiased interrogation of TCR specificities of the present immune response that relies on a physical interaction between the TCR and pHLA. This ligand identification method may be especially important in cancers that have low mutational burden, in which neoantigen targets may not be as prevalent compared to wildtype antigens (Alexandrov et al., 2013).
STAR Methods
Contact for reagent and resource sharing
Further information and requests for resources and reagents should be directed to and will be fulfilled by the Lead Contact, K. Christopher Garcia (kcgarcia@stanford.edu)
Experimental model and subject details
Human Subjects
Two male subjects of age 64 and 66, both with colorectal adenocarcinoma. 64N had invasive adenocarcinoma with positive lymph nodes and liver metastases. The patient was found to be microsatellite instability negative. 66M had invasive adenocarcinoma with multiple liver metastases and received neoadjuvant chemotherapy. The Stanford University Institutional Review Board approved all protocols for collection of human tissue and blood. Patient samples were obtained with patient consent from the Pathology Department at Stanford Hospital. Both patients were HLA typed sans HLA-C and specifically chosen for their HLA-A*02 allelic expression.
Primary and Cell Lines
All cells are grown at 37°C with 5% CO2 unless otherwise stated.
Human PBMCs were cultured in RPMI complete (ThermoFisher) containing 10% fetal bovine serum (FBS), 2 mM L-glutamine (ThermoFisher) and 50 U/mL penicillin and streptomycin (ThermoFisher).
SKW-3 cells are derived from a human T cell leukemia and cultured in RPMI complete containing 10% FBS, 2 mM L-glutamine, and 50 U/mL penicillin and streptomycin.
Transduced cells are cultured with additional 1 ug/mL puromycin (ThermoFisher) and 20 ug/mL zeocin (ThermoFisher).
T2 cells are HLA-A*02 positive cells used as antigen-presenting cells to SKW-3 cells.
They were cultured in IMDM (ThermoFisher) with 10% FBS, 2 mM L-glutamine, and 50 U/mL penicillin and streptomycin.
JY cells are EBV-immortalized B cell line cultured in RPMI complete containing 10% FBS, 2 mM glutamine, and 50 U/mL penicillin and streptomycin.
HEK 293T cells are grown in DMEM complete (ThermoFisher) containing 10% FBS, 2 mM L-glutamine, and 50 U/mL penicillin and streptomycin.
FLYRD18 are grown in DMEM complete with 10% FBS with 2 mM glutamine with 50 U/mL penicillin and streptomycin.
EBY100 yeast cells are grown in either SDCAA, which contains 20 g dextrose, 6.7 g Difco yeast nitrogen base (BD Biosciences), 5 g Bacto casamino acids (BD Biosciences), 14.7 g sodium citrate (Sigma-Aldrich), 4.29 g citric acid monohydrate (Sigma-Aldrich) per liter of H2O at pH 4.5 or SGCAA, which replaces dextrose with galactose. The yeast are grown at 30°C in SDCAA or 20°C in SGCAA for protein induction at atmospheric CO2.
High Five cells are grown in Insect X-press media (Lonza) with final concentration 10 mg/L of gentamicin sulfate (ThermoFisher) at 27°C at atmospheric CO2.
SF9 cells are grown in SF900-III serum-free media (ThermoFisher) with 10% FBS and final concentration 10 mg/L of gentamicin sulfate at 27°C at atmospheric CO2.
Method details
Preparation and selection of yeast-display libraries
Yeast-display libraries were generated as previously reported (Birnbaum et al., 2014) using chemically competent EBY100 yeast (ATCC). In short, primers encoding chosen codon sets were used to generate DNA-encoded peptide libraries. Anchor positions at P2 and PΩ of the peptide has limited codon usage to Leu-Met and Leu-Met-Val, respectively, while NNK codon diversity was allowed at all other positions (Figure 1E, Table S8). Separate length libraries encode different length codon sets and vectors used unique epitope tags for multiplexed selections: 8mer – V5 tag, 9mer – myc tag, 10mer – HA tag, 11mer – VSV tag. To display the peptide/HLA*A-02:01 complex on the yeast, the heavy chain of the HLA*A-02:01 was modified with Y84A mutation and the heavy chain truncated at S302 (Hansen et al., 2009). This mutation allows an opening for a linker to thread between the C-terminal end of the peptide, through the end of the peptide binding groove, to B2M to generate a single-chain trimer. The transmembrane-truncated heavy chain is linked to an epitope tag linked to the Aga2p protein (Boder and Wittrup, 2000) for yeast-display. The diversities of the yeast libraries were determined post-electroporation by colony counting after limiting dilutions.
Yeast were mixed at 10x diversity of the individual length libraries and frozen at −80°C in 2% glycerol and 0.67% yeast nitrogen base. Libraries were thawed as needed in SDCAA pH 4.5, passaged, induced in SGCAA, and subsequently selected as described previously (Birnbaum et al., 2014) using biotinylated soluble TCR coupled to streptavidin-coated magnetic MACS beads (SAb) (Miltenyi). In short, 10x diversity of yeast containing all four length libraries (4 × 10⁹ cells) were negatively selected with 250 μL SAb for 1 hr at 4°C in 10 mL of PBS + 0.5% bovine serum albumin and 1 mM EDTA (PBE). Yeast were passed through an LS column (Miltenyi) attached to a magnetic stand (Miltenyi) and washed three times. The flow through was then incubated for 3 hr at 4°C with 250 μL SAb pre-incubated with 400 nM biotinylated TCR for 15 minutes at 4°C. Once again, yeast were passed through an LS column and the elution was grown in SDCAA pH 4.5 overnight after an SDCAA wash. Once yeast reached an OD > 2, they were induced in SGCAA with 10% SDCAA for 2–3 days before an additional selection. All subsequent selections were done using 50 μL SAb or TCR-coated SAb in 500 μL of PBE. The fourth round was done using a negative selection following a 1 hr incubation of yeast with 400 nM SA-647 in 500 uL PBE followed by a PBE wash and an incubation with 50 μL of anti-Alexa647 Microbeads (Miltenyi) for 20 minutes. The positive selection was done after a 3 hr incubation with 400 nM SA-647 TCR tetramer followed by 20 minutes of anti-Alexa647 Microbeads for 20 minutes. The naïve library and all rounds of selection were processed for deep-sequencing as described below. Each round was monitored post-induction with anti-epitope staining and 400 nM TCR tetramer staining completed at 4°C for 3 hrs.
Individual yeast clones isolated from the selections or competent yeast electroporated with reconstructed peptide-HLA constructs identified from the deep sequencing were stained with 400 nM TCR tetramer labeled with SA-647 or SA-647 alone in combination with anti-epitope tag.
Deep sequencing of pHLA libraries
DNA was isolated from 5 × 10⁷ yeast per round of selection by miniprep (Zymoprep II kit, Zymo Research). Individual barcodes and random 8mer sequences were added to the flanking regions of the sequencing product by PCR and amplified for 25 cycles (Table S8). These primers amplified from the signal peptide of the construct to mid-sequence of the B2M. This was followed by an additional PCR amplification adding the Illumina chip primer sequences to generate final products containing Illumina P5-Truseq read 1-(N8)-Barcode-pHLA-(N8)-Truseq read 2-IlluminaP7. The library was purified by agarose gel purification, quantified by nanodrop and/or BioAnalyzer (Agilent Genomics), and deep sequenced by Illumina Miseq sequencer using a 2×150 V2 kit for a low-diversity library.
Expression of soluble TCR
Each chain of the F5 TCR was expressed separately in E. coli BL21 (DE3) and purified, refolded, and functionally validated (Bethune et al., 2017). For all other TCRs, each chain of the TCR was expressed separately using SF9 cells to produce baculovirus in the pAcGP67a vector (BD Biosciences). Both the α and β chain contained the gp67 signal peptide corresponding to the TCR Vα or TCR Vβ. Both constructs utilized a polyhedrin promoter expressing the TCR V region with human constant regions truncated at the connecting peptide for soluble expression and with an engineered disulfide (Boulter et al., 2003). Both chains either expressed a C-terminal acidic GCN4 zipper-6xHis tag or a C-terminal basic GCN4 zipper-6xHis tag (O’Shea et al., 1993). All chains containing the acid zipper contained the biotinylation acceptor peptide. Both chains contained a 3C protease site between the C-terminus of the TCR ectodomains and the GCN4 zippers. The DNA was co-transfected into SF9 cells with BD baculogold linearized baculovirus DNA (BD Biosciences) with Cellfectin II (Life Technologies). Viruses were generated in 2 mL cultures. Viruses were passaged at dilution of 1:1000 in 25 mL cultures at 1 × 10⁶ cells/mL to generate more potent virus, which was then co-titrated in 2mL of High Five (Hi5) (ThermoFisher Scientific) cells at 2 × 10⁶ cells/mL to generate dilutions for 1:1 expression of TCR α and β chains by SDS-PAGE gel and coomassie staining. Co-titrations ranged from 1:1000 to 1:250 for each chain.
Virus was used to infect Hi5 cells for protein expression in 1 to 4 L volumes at 2 × 10⁶ Hi5 cells/mL. Cells were removed 2–3 days post-infection and supernatant treated to 100 mM Tris-HCl pH 8.0, 1 mM NiCl2, and 5 mM CaCl2 to precipitate contaminants. Precipitants were removed by centrifugation and supernatant incubated for 3 hrs with Ni-NTA resin (Qiagen) at room temperature. Protein was washed with 20 mM imidazole in 1X HBS pH 7.2 and then eluted in 200 mM imidazole in 1X HBS pH 7.2. Protein was biotinylated overnight with birA ligase, 100 uM biotin, 40 mM Bicine pH 8.3, 10 mM ATP, and 10 mM Magnesium Acetate at 4 °C after buffer-exchange to 1X HBS pH 7.2 in a 30 kDa filter (Millipore). Protein used for surface plasmon resonance was treated with 3C protease (10 ug/mg of TCR) O/N. Protein was purified by size-exclusion chromatography using an AKTAPurifier (GE Healthcare) Superdex 200 column (GE Healthcare). Fractions were isolated, run on SDS-PAGE gel to confirm 1:1 stoichiometry and biotinylation by streptavidin shift. Fractions were pooled and TCRs were quantified by nanodrop and frozen at −80°C for storage in 1X HBS buffer pH 7.2.
Processing and profiling patient samples
The Stanford University Institutional Review Board approved all protocols for collection of human tissue and blood. Patient samples from two males aged 64 and 66 were obtained with patient consent from the Pathology Department at Stanford Hospital. A portion of tumor tissue sample was processed by formalin-fixed paraffin embedding for immunohistochemical staining. Tissue was stained used anti-CD4 (clone 1F6, Leica biosystems), anti-CD8 (clone C8/144b, Dako), or hematoxylin/eosin. Fresh tumor and healthy samples were processed as previously done (Han et al., 2014). In short, tumor tissue was divided and incubated with 10 MM EDTA in PBS for 30 min. Cell suspensions were made and passed through a 10-μM nylon cell strainer (Becton Dickinson) and treated with 0.5 mg/mL Type 4 collagenase for 30 min (Worthington Biochemical) in RPMI with 5% FBS. Tissue was disrupted with a blunt-ended 16-gauge needle and syringe. Some samples were saved for antibody staining to isolate tumor tissue by staining for EpCam (clone 9C4, Biolegend) and LIVE/DEAD Fixable Dead Cell Stain kit (Invitrogen) and sorted by FACS using ARIA II (Becton Dickinson) to be processed by AllPrep DNA/RNA Mini Kit (Qiagen) for DNA/RNA extraction. Otherwise, lymphocytes were enriched by Percoll (GE Healthcare) gradient centrifugation and cells frozen in RPMI containing 10% dimethylsulfoxide and 40% FBS or used immediately for antibody staining. Lymphocytes were pre-stimulated non-specifically for 3 hours using 150 ng/mL PMA + 1 μM ionomycin prior to staining for FACS. Cells were washed with PBS + 0.05% sodium azide + 2 mM EDTA + 2% FCS.
Lymphocytes were stained with the following antibodies: anti-CD4 (RPA-T4, BioLegend), anti-CD8 (OKT8, eBiosciences), anti-αβ TCR (IP26, BioLegend), anti-TIM3 (F38-2E2, BioLegend), anti-CD28 (CD28.2, Biolegend), anti-CD103 (Ber-ACT8, BioLegend), anti-CCR7 (G043H7, BioLegend), anti-LAG3 (3DS223H, Invitrogen), anti-CD38 (HIT2, BioLegend), anti-CD45RO (UCHL1, BioLegend), and anti-PD1 (EH12.2H7, BioLegend). Dead cells were excluded using a LIVE/DEAD Fixable Dead Cell Stain kit (Invitrogen). Cells were sorted by fluorescence-activated cell sorting (FACS) using an ARIA II (Becton Dickinson) directly into One-Step RT-PCR buffer (Qiagen). Patient B samples were analyzed by index sorting. Reactions were amplified using pooled primer sets as generated previously (Han et al., 2014), barcoded, and pooled for purification by agarose gel purification and deep-sequenced by Illumina Miseq using the 2×250 V2 kit. Data was processed using a custom software pipeline and individual wells were called for CDR3, TCRα and TCRβ variable, joining, and diversity regions using VDJFasta (Glanville et al., 2009). Data was analyzed using t-SNE based on T cell transcriptional markers and phenotypic markers to separate cell populations.
Sequencing and variant calling of patient exomes
The DNA extracted from tumor and healthy tissue was used to generate libraries for exome sequencing. DNA of 50 ng from tumor and normal tissue were made into Illumina sequencing libraries using Nextera (Illumina). Libraries were pooled and enriched for exonic regions using Roche Nimblegen SeqCap EZ 3.0 (Roche). Paired-end 75 bp reads were generated using a Nextseq500. Tumor-specific variants were determined following GATK Best Practices (Van der Auwera et al., 2013). Briefly, adapters and low quality bases were trimmed using cutadapt v1.9 (Martin, 2011). Reads were aligned to hg19 using BWA MEM 0.7.12 (Li and Durbin, 2010). Duplicates were removed using Picard tools v1.119 followed by indel realignment and base recalibration using GATK v3.5 (McKenna et al., 2010) and reference files downloaded from the GATK Resource Bundle 2.8. Median coverage was determined using bedtools v2.25.0 (Quinlan and Hall, 2010). Lastly, variants between normal and tumor were determined using mutect2 (Cibulskis et al., 2013). Manufacturer’s instructions were followed in all kits and default software parameters were used in all pipelines.
All exome variants were used to generate alternate coding sequences using the Grch37 assembly from Ensembl. Each alternate coding sequence was processed and scored based on the length of the library peptide. Peptides were scored using the 2017PWM and 2017DL algorithms.
Developing algorithms and predictions for human peptides
Deep sequencing results were analyzed as done previously (Birnbaum et al., 2014) with a modification to incorporate deconvolution of the library for different peptide lengths. Different length peptides were identified based on the number of amino acids flanked by the signal peptide and GS linker. In short, paired-end reads were determined from the deep sequencing results using PandaSeq (Masella et al., 2012). Paired-end reads are parsed by barcode using Geneious version 6 to identify the round of selection. All nucleotide sequences with less than 10 counts in rounds 3 and 4 of the selection and which differed by only 1 nucleotide sequence from another sequence in the round were coalesced to the dominant sequence. Any data with frameshifts or stop codons were removed from further analysis. Sequences were processed using custom perl scripts and shell commands.
Reverse hamming distances are hamming distances subtracted from the total length of the peptide, representing the number of shared amino acids between two peptides. They were calculated using Matlab (Mathworks Inc.) by iterating through each peptide against all other peptides from the selected round 3 library sequences. The output score generated is the number of matching amino acid positions between peptides. Based on the reverse hamming distances, peptides were clustered using Cytoscape and cutoffs determined manually based on peptide similarity. For the DMF5 TCR, clustering was done and clusters were used to generate substitution matrices for predictions using no cutoff for amino acid frequencies. For the NKI TCRs, the reverse hamming distance was sufficient for determining the neoantigen specificity for the NKI2 TCR. The 2014PWM model did not yield any prediction results from the list of 127 neoantigens. Clustering was not done for the four colorectal cancer-derived TCRs prior to algorithm prediction.
For 2014PWM and 2017PWM, substitution matrices were generated from round 3 of all the selections and used to search human protein (Uniprot) or patient-specific exomes to score peptides of fixed lengths using a sliding window. Substitution matrices are made by determining the frequency of all amino acids per position of the peptide. For all predictions made using the 2014PWM except for those made for the DMF5 TCR, a cutoff of 0.1% frequency for an amino acid at a given position was instituted to remove noise. The scores of the peptides are calculated as the product of amino acid frequencies at each position. The 2017PWM is less stringent than the 2014PWM, in that it allows predicted peptides to incorporate amino acids at positions not found in the selected peptides of the library. This prevents discarding peptide sequences that may not have been selected for, but could potentially be a viable peptide solution.
The deep learning method 2017DL was generated to consider peptides as whole entities rather than taking each individual position of the peptide as independent of every other, as the previous algorithms do (Figure S5A). Sequencing data including peptide sequences and round counts were pre-processed in R to remove any peptide sequences that had fewer than 3 counts across all rounds. The data was then normalized by multiplying each round count by the average number of counts across the rounds and then divided by the number of counts in a given round. An adapted fitness score (Aakre et al., 2015) was used to score each peptide in the library derived from a fitness function represented by an exponential curve fit to each peptide through the normalized round counts (Figure S5B).
Next a model was generated using the fitness scores for each peptide and the peptides represented as a 20 x L matrix, where L is the length of the peptide sequence (Figure S5C). The 20 rows of the matrix relate to the 20 possible amino acids. Amino acids are represented as a one-hot vector, in which a vector contains a single 1 with the remaining being 0s. The matrix representing the peptide was flattened to a feature vector of length 20 x L for use in training the neural network. The one-hot matrix was used as input and the fitness scores used as output. A network architecture described previously (LeCun et al., 2015) utilizing a two-hidden layer network using 10 nodes and 5 nodes respectively was implemented using the data from the library peptides (Figure S5D). The training was done in Lua with the Torch package. This model was used to score given peptides from the Uniprot database (downloaded Dec. 18, 2015) and patient-specific exomes using peptides isolated from an L-length sliding window converted to one-hot matrices for neural network input. P-values and Bonferroni-corrected p-values were calculated for each peptide, representing the probability of randomly selecting, from the whole proteome, a peptide with fitness score as high as or higher than the scored peptide.
Measuring T cell activation in co-culture assays
The four TCRs identified from the colorectal cancer patients that selected peptides from the library were cloned into a MSCV-based vector pMIG II in α-P2A-β configuration using the wildtype signal peptides of the TCR variable genes and full length, unmodified constant regions. The P2A skip sequence allows for 1:1 stoichiometric expression of the TCRs. A MSCV-based vector pMIG II was also used to generate human CD3 in the format of δ-F2A-γ-T2A-ε-P2A-ζ. A packaging vector pCL10A was used to incorporate env, gag, and pol to allow for human mammalian tropism and viral generation. The vectors introduced puromycin and zeocin selectivity into infected cells. Retrovirus was generated for each TCR and human CD3 in human embryonic kidney 293T cells using 5 μg TCR or human CD3 DNA and 3.3 μg pCL10A DNA. The viruses were generated using X-tremeGENE 9 DNA transfection reagent (Sigma-Aldrich) in serum-free DMEM. In cell culture, 2% FBS DMEM was used to recover the cells and media was changed at 12 hours. Virus was harvested at 36, 40, 44, and 48 hours each in 2.5 mL amounts to be pooled, filtered with 0.45 μM syringe filters (Fischer Scientific), and frozen at −80°C or used immediately to infect T CR−CD8+ SKW-3 cells. The 2 mL virus of TCR and 2 mL virus of human CD3 was used to co-infect 2 × 10⁶ SKW-3 cells with 5 ug/mL polybrene (Millipore) by spinning for 2 hrs at 2500 rpm at 32°C. The virus was removed and replaced with media and cells cultured. The transduced SKW-3 cells were cultured after 2–3 days in 20 ug zeocin and 1 ug puromycin indefinitely to select for TCR and human CD3 co-expression. Cells were then co-stained for TCR (IP26, BioLegend) and human CD3 (UCHT1, BioLegend) and sorted on the SH800 cell sorter (Sony Biotechnology Inc.).
The transduced SKW-3 cells were co-cultured with TAP-deficient T2 cells in a 2:1 ratio with various peptide dilutions. The top 5 synthetic peptides isolated from the yeast-display selections were tested along with predictions determined from the 3 prediction algorithms. Peptides were synthesized to >70% purity (Genscript) (Elim Biopharm) and resuspended in dimethylsulfoxide to 20 mM and stored at −20°C. CD69 (FN50, BioLegend) was measured at 18 hours to detect early T cell activation by flow cytometry using the Accuri C6 (BD Biosciences). SKW-3 T cells were detected by UCHT1 staining and checked for TCR and CD3 expression. T2 cells were checked for HLA-A*02 expression by antibody (BB7.2, BioLegend). Data was analyzed using FlowJo version 10 (FlowJo, LLC) and samples were gated on SKW-3 cells by forward and side scatter and UCHT1+ cells followed by analysis for CD69 expression. Experiments were done in biological triplicate and technical triplicate. P-values were calculated by ordinary one-way ANOVA in Prism and experiments plotted with either standard deviation or standard error of the mean as indicated.
CDK4-specific TCRs clone 10 (NKI1) and 17 (NKI2) were derived from TILs of a melanoma patient that were screened with HLA multimers loaded with predicted neoantigens, essentially as described (van Rooij et al., 2013). The variable parts of both TCRs were cloned into a retroviral vector encoding the murine TCR α and β constant domains (Linnemann et al., 2013). FLYRD18 packaging cells were plated in 10 cm dishes at 1.2 × 10⁶ cells/well. After one day, cells were transfected with 10 μg retroviral vector DNA encoding the CDK4 TCRs using 25 μl X-tremeGENE HP DNA (Sigma-Aldrich). After 48 hrs, retroviral supernatant was isolated and transferred to retronectin-coated 24-well plates and centrifuged for 90 minutes at 430g. PBMCs were activated and selected with anti-CD3/CD28 beads (ThermoFisher) at a bead-to-cell ratio of 3:1. Forty-eight hours after stimulation, T cells were plated at 0.5 × 10⁶ cells/mL on virus-coated plates. Surface expression of the introduced CDK4 TCRs on transduced T cells was measured using APC labeled CDK4 R>L HLA-A*02:01 tetramers in combination with anti-murine Vβ TCR-PE labeled antibody (BD Biosciences). Cells were analyzed using a FACSCalibur (Becton Dickinson). JY cells were pulsed with the CDK4 peptide or the predicted peptides at the indicated concentrations for 1 hr at 37°C and then washed two times. Next, 0.2 × 10⁶ TCR-transduced T cells were incubated with 0.2 × 10⁶ peptide-pulsed JY cells in the presence of 1 μL/mL Golgiplug (BD Biosciences). T cells not exposed to JY cells, exposed to unloaded JY cells, and exposed to JY cells loaded with an irrelevant peptide (MART-1) were used as controls. After a 5-hour incubation at 37°C, 5% CO2, cells were washed and stained with PerCP-cy5.5 anti-CD8, FITC anti-CD3, PE anti-murine Vβ TCR and APC anti-IFNγ labeled antibodies.
Expression of refolded HLA-A*02:01 with exogenous peptide
The pet26b vector was used to express HLA-A*02:01 (1–275) and β2M (1–100) separately in Rosetta BL21 DE3 E. coli cells. Inclusion bodies containing the separate proteins were dissolved in 8 M urea, 40 mM Tris-HCl pH 8.0, 10 mM EDTA, and 10 mM DTT. For in vitro refolding, the HLA-A*02 heavy chain, β2M, and MMDFFNAQM peptide were mixed in a 1:2:10 molar ratio and diluted into a refolding buffer containing 0.4 M L-arginine-HCl, 100 mM Tris-HCl pH 8.0, 4 mM EDTA, 0.5 mM oxidized glutathione, and 4 mM reduced glutathione. After 72 hours at 4°C, the protein was dialyzed in 10 L of 10 mM Tris-HCl and purified via weak ion exchange using a DEAE cellulose column. The protein elution was purified using size exclusion chromatography on a Superdex 200 column and ion-exchange chromatography on a 5/50 Mono Q column (GE Healthcare). Protein was biotinylated overnight with birA ligase, 100 uM biotin, 40 mM Bicine pH 8.3, 10 mM ATP, and 10 mM Magnesium Acetate at 4 °C after buffer-exchange to 1X HBS pH 7.2 in a 30 kDa filter (Millipore) before being run on a size exclusion Superdex 200 column.
Surface plasmon resonance to measure TCR 2A and 3B binding affinity to MMDFFNAQM-HLA-A*02:01
The interaction of TCR 2A and 3B with MMDFFNAQM-HLA-A*02 was measured by surface plasmon resonance using a BIAcore T100 (GE Healthcare) biosensor at 25 °C. Biotinylated MMDFFNAQM-HLA-A2 was immobilized on a streptavidin-coated BIAcore SA chip at approximately 1000 resonance units (RU). A different flow cell was immobilized with non-relevant peptide-HLA-A2 to serve as blank control. Different concentrations of either 2A or 3B TCR were flowed sequentially over blank and MMDFFNAQM-HLA-A2. Injections of TCR were stopped after 60 s to allow sufficient time for SPR signals to reach plateau. The dissociation constant (KD) was obtained by fitting equilibrium data with a 1:1 binding model using BIAcore evaluation software.
Quantitative PCR to determine relative RNA expression of U2AF2
RNA extracted previously as mentioned above from the tumor and healthy patient tissue were used to determine the relative quantities of U2AF2 RNA expression. In addition, RNA was extracted from the following cell lines: Lymphoma: K562, Daudi; Breast: MDA MB 231; Lung: A549, EKVX, HCC78, H358, H441, H1373, H1437, H1650, H1792, H2009, H2126, H3122, LC-2/ad. cDNA was generated using the High-Capacity RNA-to-cDNA kit (Thermofisher) in triplicates. cDNA samples were pooled for quantity and quantitative real-time PCR carried out using TaqMan probes (ThermoFisher), TaqMan Universal Master Mix II, no UNG (ThermoFisher), and QuantStudio 3 Real-Time PCR System (ThermoFisher) in technical quadruplicate. The U2AF2 probe (ThermoFisher, Hs00200737_m1) amplified a 75 bp region spanning exons of U2AF2. The 18S RNA probe (ThermoFisher, Hs99999901_s1) was used as a housekeeping gene, amplifying a 187 bp region. The cycle threshold values of U2AF2 to 18S RNA were calculated for each sample and compared to either Patient A healthy tissue or Patient B healthy tissue cycle threshold values to determine relative expression levels. The standard deviation is plotted.
Quantification and statistical analysis
T-cell stimulation assays using SKW-3 cells
Data relates to Figure 7 and S6. Data is analyzed using Flowjo to gate SKW-3 cells and CD3+ group to identify T cells. T cells are then gated on CD69 expression using the negative control (no peptide). The median MFI expression of CD69 in the CD3+ group and the percentage of cells expressing CD69 have been analyzed. One-way ordinary ANOVA was determined for both analyses using Prism in comparison to the negative control (no peptide). The 100 μM peptide stimulation is completed in biological and technical triplicate. Only one of the biological triplicates is shown. The peptide titration experiments were done in biological triplicate. All biological triplicates were analyzed collectively. Legends for p-value designations are listed for each figure. Either SEM (n=3; technical triplicate) or SD (n=3, biological replicate) are used and is listed in the corresponding figure legends.
2014PWM scoring
Scoring is done as presented in (Birnbaum et al., 2014). A frequency matrix is generated from the round 3 selection data using the sequencing read counts as a multiplier for peptide sequence. Each position of the peptide is multiplied by the read counts to get a count of the number of times a given amino acid is present. This is done for each unique peptide in round 3 and the amino acid counts per position is divided by the number of total reads. The frequency matrix is then used to score every Nmer peptide of the human proteome, in which N is the length of the selected peptides from the library. Scoring is done by multiplying the frequencies of the given amino acid across the peptide.
2017PWM and 2017DL peptide scoring
Algorithms were generated in this paper. For both the 2017PWM, a frequency matrix is generated as in 2014PWM, except an additional frequency matrix is generated for data across all rounds of selection, instead of just round 3. A ratio per position per amino acid is taken for round 3 frequency matrix to all round frequency matrix. A pseudocount frequency of 0.05 is implemented for zero values, and the log10 is taken of the ratio. This score is interpreted as the enrichment ratio of a particular amino acid at a position. This score is used to determine the overall enrichment of a given peptide from the exome or human proteome by multiplying scores for each position. The 2017DL algorithm is implemented as described in the methods.
To determine the statistical significance of a peptide, the human proteome and exome peptide set is scored. To calculate the p-values for the exome peptide set, the percentile score is calculated in context of the human proteome scores. The uncorrected p-value is 1-percentile. The Bonferroni-corrected p-value is the uncorrected p-value multiplied by the number of peptides in the mutant set.
Quantitative PCR analysis
Data relates to Figure S4. Quantitative PCR was carried out in technical quadruplicate samples. The relative expression levels of U2AF2 RNA to 18S RNA (delta cycle threshold) was calculated by subtracting cycle threshold values. The fold-change over healthy (delta delta cycle threshold) was determined by subtracting the relative cycle threshold values (delta cycle threshold) of the reference to the sample. The standard deviation of a delta cycle threshold was calculated using
where s = standard deviation, s1 = standard deviation of target sample and s2 = standard deviation of reference sample. The delta delta cycle threshold standard deviation takes the standard deviation of the delta cycle threshold test sample.
Data and software availability
Exome sequencing
Data is available in the short read archive under BioSample accessions SAMN07350021, SAMN07350022, SAMN07350023, SAMN07350024, SAMN07350025, SAMN07350026, SAMN07350027, SAMN07350028, SAMN07350029, SAMN07350030, SAMN07350031, and SAMN07350032.
Deep-sequencing
Data is available in the short read archive under BioSample accessions SAMN07977164, SAMN07977165, SAMN07977166, SAMN07977167, SAMN07977168, and SAMN07977169.
2017PWM and 2017DL code
The code for these scripts are available at https://bitbucket.org/slofgren/antigen-id-paper-code/src.
Supplementary Material
Figure S1. Validation of the HLA-A2*01 library with the DMF5 TCR.
(A) MA2.1 antibody staining for correctly folded HLA-A*02:01 complex with DMF5 TCR wildtype peptide or peptide mimotopes. Histograms show staining by MA2.1 antibody followed by secondary antibody.
(B) The scores of predicted human peptides using the 2014PWM algorithm on cluster 2 of the round 3 sequences for the DMF5 TCR 10mer selection.
(C) The scores of the top 10 peptides identified in Figure S1B.
Related to Figure 1 and Table S1.
Figure S2. Patient tissue immunohistochemistry and TCR repertoire sequencing and phenotyping.
(A) Patient immunohistochemistry using H&E staining, anti-CD4/hematoxylin or anti-CD8/hematoxylin. All representative images are taken using 300x magnification.
Related to Figure 3 and Table S3.
(B) Patient CDR3 length as measured from the Cys to Phe.
(C) Patient distribution of TCR variable α genes in healthy and tumor tissue.
(D) Patient distribution of TCR variable β genes in healthy and tumor tissue.
(E) t-SNE plots of Patient B T cells showing transcriptional profiling by transcript sequencing (left) and cell surface markers by flow cytometry (right). The presence of transcripts is binary based off of deep-sequencing reads (1 = yes, 0 = no) and intensity relates to MFI of cell surface marker.
Related to Figure 3 and Table S4.
Figure S3. Activation of SKW-3 cells according to CD69 Median MFI and TCR tetramer staining of yeast expressing predicted peptide targets.
Data analyzed from Figure 7, but using mean fluorescence intensity of CD69 expression instead of percent cells positive for CD69 expression for (A), (B), (C), and (D). SKW-3 T cells with TCRs (A) 1A, (B) 2A, (C) 3B, or (D) 4B were co-cultured with peptide-pulsed T2 antigen-presenting cells as in Figure 7. The mean fluorescence intensity was measured from anti-CD69 staining of CD3-gated SKW-3 cells in technical triplicate with mean values and standard deviation shown. A representative experiment from biological triplicate is shown. P-values were measured using ordinary one-way ANOVA. Yeast expressing single-chain trimers of the library peptides and predicted target peptides for TCRs (E) 1A, (F) 2A, (G), 3B, and (H) 4B stained with 400 nM TCR tetramers. Tetramer negative populations are stained with streptavidin-647 only. All yeast are gated on epitope tag positive yeast.
Related to Figure 7, Table S5, Table S6, Table S7, and Table S8.
Figure S4. U2AF2 quantitative RNA expression and affinity measurements for U2AF2 peptide.
(A) Quantitative PCR expression of the U2AF2 transcript expression of tumor over healthy tissue in patients A and B using 18S as the housekeeping gene. Samples are done in technical quadruplicate with standard deviation shown.
(B) Log base 2 quantitative PCR expression of U2AF2 RNA in various human-derived tumors compared to U2AF2 RNA expression in Patient A healthy tissue using the 18S as the housekeeping gene. Samples are done in technical quadruplicate with standard deviation shown. Cell lines shown are listed in the methods section in the appropriate order.
(C) Log base 2 quantitative PCR expression of U2AF2 RNA in various human-derived tumors compared to U2AF2 RNA expression in Patient B healthy tissue using the 18S as the housekeeping gene. Samples are done in technical quadruplicate with standard deviation shown. Cell lines shown are listed in the methods section in the appropriate order.
(D) Surface plasmon resonance traces of increasing concentrations of TCR 2A flown over a chip coated with MMDFFNAQM-HLA-A*02:01 with a range of 93.6 μM to 0.365 μM using 2-fold dilutions. The peaks prior to and after association of the TCR to the peptide-HLA-A*02 generated from flow cell subtraction are removed for simplicity. Only the colored curves labeled with concentrations are used to calculate the Kd.
(E) Curve-fitting to data points generated at various concentrations of TCR labeled in Figure S4D.
Related to Figure 7.
Figure S5. Design of the machine-learning algorithm 2017DL to predict human peptide specificities.
(A) Schematic showing the process to take data from the yeast-display library selections to train a machine learning model, which scores peptides derived from proteins from the Uniprot database or patient-specific exomes. The model is generated from yeast-display selection data utilizing the deep-sequencing round counts per peptide and the composition of the peptide. An exponential curve is fit to each peptide to capture the enrichment over the rounds of selection using a fitness function.
(B) Fitness function to fit an exponential curve to the deep sequencing round counts for peptides selected by a TCR.
(C) Matrix representation of an example peptide, in which each amino acid is represented as a one-hot vector.
(D) The architecture of the machine-learning algorithm utilizing a two-layer convolutional neural network. The input consists of peptide sequences represented as a vector of one-hot vectors and the fitness scores of the peptides determined from the fitness function in Figure S5B. The output is the fitness score.
Related to Figure 7.
Table S1. DMF5 selection data and human target prediction.
The sequences identified from the round 3 deep-sequencing of the F5 10mer library selections after clustering by reverse hamming distance. Using these clusters, predictions were made on the Uniprot database using 2014PWM. The 9 predictions for the ‘GIG’ cluster and top 10 predictions for the ‘DRG’ cluster are listed. Related to Figure 2 and Figure S1.
Table S2. NKI2 selection data by peptide length.
The sequences identified from the round 3 deep-sequencing of the NKI2 library selections listed by peptide length. Related to Figure 3.
Table S3. Patient HLA typing results.
The HLA type of two patients with colorectal adenocarcinoma. ND = Not determined. Related to Figure 4.
Table S4. Orphan TCRs screened on the HLA-A*02:01 library.
The TCRs screened on the HLA-A*02:01 library. TCR sequences were chosen based on clonality in the tumor, phenotypic profile, exclusivity to the tumor, and additionally by related TCR sequences. The number beneath tumor and healthy labels indicate the number of times a paired TCR sequence was seen from this tissue. Related to Figure 5 and Figure 6.
Table S5. Peptide prediction results for TCR 1A.
Peptides tested to stimulate TCR 1A cells. Peptides are derived from the library, 2017PWM and 2017DL predictions and the rank of the peptide from the predictions or library selections are shown. Cells are left intentionally blank. Related to Figure 7 and Figure S5.
Table S6. Peptide prediction results for TCRs 2A and 3B.
Peptides tested to stimulate TCRs 2A and 3B cells. Peptides are derived from the library, 2014PWM, 2017PWM, and 2017DL predictions and the rank of the peptide from the predictions or library selections are shown. Cells are left intentionally blank. Related to Figure 7 and Figure S5.
Table S7. Peptide prediction results for TCR 4B.
Peptides tested to stimulate TCR 4B cells. Peptides are derived from the library, 2017PWM, and 2017DL predictions and the rank of the peptide from the predictions or library selections are shown. Cells are left intentionally blank. Related to Figure 7 and Figure S5.
Table S8. Primers used to generate and deep-sequence pHLA libraries.
Letter codes for nucleotides follow the IUPAC naming system. Related to Figure 1.
Highlights.
Development of a human leukocyte antigen library for TCR ligand identification
Single-cell sequencing and phenotyping of T cells infiltrating human colon cancer
Ligand discovery for four tumor-derived T cell receptors
Identification of a shared non-mutated tumor antigen between two patients
Acknowledgments
We thank Trevor Hinshaw and Chris Bolen for technical assistance, Jonathan Sockolosky, Naresha Saligrama, and Francesco Vallania for helpful discussions, and Luke Lee for providing cell lines. MHG was supported by a Stanford Graduate Research Fellowship and F31 CA216926-01. MTB was supported by a Jane Coffin Childs Postdoctoral Fellowship. JLM was supported by NIH award K01CA175127. This work was supported by K08 DK100739 (AH), R01 AI103867 (KCG), the Bill and Melinda Gates Foundation, the National Institute for Allergy and Infectious Diseases with grants 1U19AI109662, U19AI057229, U54I117925, 1R01AI125197 (PK), Dutch Cancer Society Queen Wilhelmina Award NKI 2013-6122 and the K. G. Jebsen Foundation (TNS), 5P01CA132681-05 (DB), the Howard Hughes Medical Institute (KCG, MMD), and Parker Institute for Cancer Immunotherapy (KCG, MMD).
Footnotes
Author Contributions
MHG, AH, KCG, and MMD conceived of the project and wrote the manuscript. AH and MHG conducted single-cell T cell phenotyping, TCR sequencing, and yeast screening. MHG also conducted data analysis and target validation. SML and JM developed algorithms for analyzing deep-sequencing data. JB performed patient exome sequencing. MTB provided the F5 TCR used to optimize HLA-A2 display and to validate ligand discovery. SF designed yeast-display constructs and conducted yeast-display experiments. XY conducted yeast-display experiments and surface plasmon resonance studies. RG conducted T cell activation experiments for NKI2. DBB performed immunohistochemistry on patient tumor tissue. LVS and RAF provided conceptual insight and technical expertise. AV generated virus for TCR expression. MEB, DB, SRQ, PK, TNS, MMD, and KCG supervised the research. All authors edited the manuscript.
Publisher's Disclaimer: This is a PDF file of an unedited manuscript that has been accepted for publication. As a service to our customers we are providing this early version of the manuscript. The manuscript will undergo copyediting, typesetting, and review of the resulting proof before it is published in its final citable form. Please note that during the production process errors may be discovered which could affect the content, and all legal disclaimers that apply to the journal pertain.
References
- 1.Aakre CD, Herrou J, Phung TN, Perchuk BS, Crosson S, Laub MT. Evolving new protein-protein interaction specificity through promiscuous intermediates. Cell. 2015;163:594–606. doi: 10.1016/j.cell.2015.09.055. [DOI] [PMC free article] [PubMed] [Google Scholar]
- 2.Abelin JG, Keskin DB, Sarkizova S, Hartigan CR, Zhang W, Sidney J, Stevens J, Lane W, Zhang GL, Eisenhaure TM, et al. Mass Spectrometry Profiling of HLA-Associated Peptidomes in Mono-allelic Cells Enables More Accurate Epitope Prediction. Immunity. 2017;46:315–326. doi: 10.1016/j.immuni.2017.02.007. [DOI] [PMC free article] [PubMed] [Google Scholar]
- 3.Adams JJ, Narayanan S, Birnbaum ME, Sidhu SS, Blevins SJ, Gee MH, Sibener LV, Baker BM, Kranz DM, Garcia KC. Structural interplay between germline interactions and adaptive recognition determines the bandwidth of TCR-peptide-MHC cross-reactivity. Nat Immunol. 2016;17:87–94. doi: 10.1038/ni.3310. [DOI] [PMC free article] [PubMed] [Google Scholar]
- 4.Adams JJ, Narayanan S, Liu B, Birnbaum ME, Kruse AC, Bowerman NA, Chen W, Levin AM, Connolly JM, Zhu C, et al. T cell receptor signaling is limited by docking geometry to peptide-major histocompatibility complex. Immunity. 2011;35:681–693. doi: 10.1016/j.immuni.2011.09.013. [DOI] [PMC free article] [PubMed] [Google Scholar]
- 5.Alexandrov LB, Nik-Zainal S, Wedge DC, Aparicio SA, Behjati S, Biankin AV, Bignell GR, Bolli N, Borg A, Borresen-Dale AL, et al. Signatures of mutational processes in human cancer. Nature. 2013;500:415–421. doi: 10.1038/nature12477. [DOI] [PMC free article] [PubMed] [Google Scholar]
- 6.Bentzen AK, Marquard AM, Lyngaa R, Saini SK, Ramskov S, Donia M, Such L, Furness AJ, McGranahan N, Rosenthal R, et al. Large-scale detection of antigen-specific T cells using peptide-MHC-I multimers labeled with DNA barcodes. Nat Biotechnol. 2016;34:1037–1045. doi: 10.1038/nbt.3662. [DOI] [PubMed] [Google Scholar]
- 7.Beringer DX, Kleijwegt FS, Wiede F, van der Slik AR, Loh KL, Petersen J, Dudek NL, Duinkerken G, Laban S, Joosten A, et al. T cell receptor reversed polarity recognition of a self-antigen major histocompatibility complex. Nat Immunol. 2015;16:1153–1161. doi: 10.1038/ni.3271. [DOI] [PubMed] [Google Scholar]
- 8.Bethune MT, Comin-Anduix B, Hwang Fu YH, Ribas A, Baltimore D. Preparation of peptide-MHC and T-cell receptor dextramers by biotinylated dextran doping. Biotechniques. 2017;62:123–130. doi: 10.2144/000114525. [DOI] [PubMed] [Google Scholar]
- 9.Birnbaum ME, Dong S, Garcia KC. Diversity-oriented approaches for interrogating T-cell receptor repertoire, ligand recognition, and function. Immunol Rev. 2012;250:82–101. doi: 10.1111/imr.12006. [DOI] [PMC free article] [PubMed] [Google Scholar]
- 10.Birnbaum ME, Mendoza JL, Sethi DK, Dong S, Glanville J, Dobbins J, Ozkan E, Davis MM, Wucherpfennig KW, Garcia KC. Deconstructing the peptide-MHC specificity of T cell recognition. Cell. 2014;157:1073–1087. doi: 10.1016/j.cell.2014.03.047. [DOI] [PMC free article] [PubMed] [Google Scholar]
- 11.Boder ET, Wittrup KD. Yeast surface display for directed evolution of protein expression, affinity, and stability. Methods Enzymol. 2000;328:430–444. doi: 10.1016/s0076-6879(00)28410-3. [DOI] [PubMed] [Google Scholar]
- 12.Borbulevych OY, Santhanagopolan SM, Hossain M, Baker BM. TCRs used in cancer gene therapy cross-react with MART-1/Melan-A tumor antigens via distinct mechanisms. J Immunol. 2011;187:2453–2463. doi: 10.4049/jimmunol.1101268. [DOI] [PMC free article] [PubMed] [Google Scholar]
- 13.Boulter JM, Glick M, Todorov PT, Baston E, Sami M, Rizkallah P, Jakobsen BK. Stable, soluble T-cell receptor molecules for crystallization and therapeutics. Protein Eng. 2003;16:707–711. doi: 10.1093/protein/gzg087. [DOI] [PubMed] [Google Scholar]
- 14.Brim H, Ashktorab H. Genomics of Colorectal Cancer in African Americans. Next Gener Seq Appl. 2016:3. doi: 10.4172/2469-9853.1000133. [DOI] [PMC free article] [PubMed] [Google Scholar]
- 15.Buhrman JD, Jordan KR, U’Ren L, Sprague J, Kemmler CB, Slansky JE. Augmenting antitumor T-cell responses to mimotope vaccination by boosting with native tumor antigens. Cancer Res. 2013;73:74–85. doi: 10.1158/0008-5472.CAN-12-1005. [DOI] [PMC free article] [PubMed] [Google Scholar]
- 16.Chung IF, Chen CY, Su SC, Li CY, Wu KJ, Wang HW, Cheng WC. DriverDBv2: a database for human cancer driver gene research. Nucleic Acids Res. 2016;44:D975–979. doi: 10.1093/nar/gkv1314. [DOI] [PMC free article] [PubMed] [Google Scholar]
- 17.Cibulskis K, Lawrence MS, Carter SL, Sivachenko A, Jaffe D, Sougnez C, Gabriel S, Meyerson M, Lander ES, Getz G. Sensitive detection of somatic point mutations in impure and heterogeneous cancer samples. Nature biotechnology. 2013;31:213–219. doi: 10.1038/nbt.2514. [DOI] [PMC free article] [PubMed] [Google Scholar]
- 18.Cole DK, Edwards ES, Wynn KK, Clement M, Miles JJ, Ladell K, Ekeruche J, Gostick E, Adams KJ, Skowera A, et al. Modification of MHC anchor residues generates heteroclitic peptides that alter TCR binding and T cell recognition. J Immunol. 2010;185:2600–2610. doi: 10.4049/jimmunol.1000629. [DOI] [PMC free article] [PubMed] [Google Scholar]
- 19.Davis MM, Bjorkman PJ. T-cell antigen receptor genes and T-cell recognition. Nature. 1988;334:395–402. doi: 10.1038/334395a0. [DOI] [PubMed] [Google Scholar]
- 20.Garraway LA, Lander ES. Lessons from the cancer genome. Cell. 2013;153:17–37. doi: 10.1016/j.cell.2013.03.002. [DOI] [PubMed] [Google Scholar]
- 21.Gibbs GM, Roelants K, O’Bryan MK. The CAP superfamily: cysteine-rich secretory proteins, antigen 5, and pathogenesis-related 1 proteins--roles in reproduction, cancer, and immune defense. Endocr Rev. 2008;29:865–897. doi: 10.1210/er.2008-0032. [DOI] [PubMed] [Google Scholar]
- 22.Glanville J, Huang H, Nau A, Hatton O, Wagar LE, Rubelt F, Ji X, Han A, Krams SM, Pettus C, et al. Identifying specificity groups in the T cell receptor repertoire. Nature. 2017 doi: 10.1038/nature22976. [DOI] [PMC free article] [PubMed] [Google Scholar]
- 23.Glanville J, Zhai W, Berka J, Telman D, Huerta G, Mehta GR, Ni I, Mei L, Sundar PD, Day GM, et al. Precise determination of the diversity of a combinatorial antibody library gives insight into the human immunoglobulin repertoire. Proc Natl Acad Sci U S A. 2009;106:20216–20221. doi: 10.1073/pnas.0909775106. [DOI] [PMC free article] [PubMed] [Google Scholar]
- 24.Gonzalez-Galarza FF, Takeshita LY, Santos EJ, Kempson F, Maia MH, da Silva AL, Teles e Silva AL, Ghattaoraya GS, Alfirevic A, Jones AR, et al. Allele frequency net 2015 update: new features for HLA epitopes, KIR and disease and HLA adverse drug reaction associations. Nucleic Acids Res. 2015;43:D784–788. doi: 10.1093/nar/gku1166. [DOI] [PMC free article] [PubMed] [Google Scholar]
- 25.Graubert TA, Shen D, Ding L, Okeyo-Owuor T, Lunn CL, Shao J, Krysiak K, Harris CC, Koboldt DC, Larson DE, et al. Recurrent mutations in the U2AF1 splicing factor in myelodysplastic syndromes. Nat Genet. 2011;44:53–57. doi: 10.1038/ng.1031. [DOI] [PMC free article] [PubMed] [Google Scholar]
- 26.Gros A, Parkhurst MR, Tran E, Pasetto A, Robbins PF, Ilyas S, Prickett TD, Gartner JJ, Crystal JS, Roberts IM, et al. Prospective identification of neoantigen-specific lymphocytes in the peripheral blood of melanoma patients. Nat Med. 2016;22:433–438. doi: 10.1038/nm.4051. [DOI] [PMC free article] [PubMed] [Google Scholar]
- 27.Gros A, Robbins PF, Yao X, Li YF, Turcotte S, Tran E, Wunderlich JR, Mixon A, Farid S, Dudley ME, et al. PD-1 identifies the patient-specific CD8(+) tumor-reactive repertoire infiltrating human tumors. J Clin Invest. 2014;124:2246–2259. doi: 10.1172/JCI73639. [DOI] [PMC free article] [PubMed] [Google Scholar]
- 28.Guda K, Veigl ML, Varadan V, Nosrati A, Ravi L, Lutterbaugh J, Beard L, Willson JK, Sedwick WD, Wang ZJ, et al. Novel recurrently mutated genes in African American colon cancers. Proc Natl Acad Sci U S A. 2015;112:1149–1154. doi: 10.1073/pnas.1417064112. [DOI] [PMC free article] [PubMed] [Google Scholar]
- 29.Han A, Glanville J, Hansmann L, Davis MM. Linking T-cell receptor sequence to functional phenotype at the single-cell level. Nat Biotechnol. 2014;32:684–692. doi: 10.1038/nbt.2938. [DOI] [PMC free article] [PubMed] [Google Scholar]
- 30.Hansen T, Yu YY, Fremont DH. Preparation of stable single-chain trimers engineered with peptide, beta2 microglobulin, and MHC heavy chain. Curr Protoc Immunol. 2009;Chapter 17(Unit17):15. doi: 10.1002/0471142735.im1705s87. [DOI] [PubMed] [Google Scholar]
- 31.Hassan C, Chabrol E, Jahn L, Kester MG, de Ru AH, Drijfhout JW, Rossjohn J, Falkenburg JH, Heemskerk MH, Gras S, et al. Naturally processed non-canonical HLA-A*02:01 presented peptides. J Biol Chem. 2015;290:2593–2603. doi: 10.1074/jbc.M114.607028. [DOI] [PMC free article] [PubMed] [Google Scholar]
- 32.Hiemstra HS, Duinkerken G, Benckhuijsen WE, Amons R, de Vries RR, Roep BO, Drijfhout JW. The identification of CD4+ T cell epitopes with dedicated synthetic peptide libraries. Proc Natl Acad Sci U S A. 1997;94:10313–10318. doi: 10.1073/pnas.94.19.10313. [DOI] [PMC free article] [PubMed] [Google Scholar]
- 33.Johnson LA, Morgan RA, Dudley ME, Cassard L, Yang JC, Hughes MS, Kammula US, Royal RE, Sherry RM, Wunderlich JR, et al. Gene therapy with human and mouse T-cell receptors mediates cancer regression and targets normal tissues expressing cognate antigen. Blood. 2009;114:535–546. doi: 10.1182/blood-2009-03-211714. [DOI] [PMC free article] [PubMed] [Google Scholar]
- 34.Kreiter S, Vormehr M, van de Roemer N, Diken M, Lower M, Diekmann J, Boegel S, Schrors B, Vascotto F, Castle JC, et al. Mutant MHC class II epitopes drive therapeutic immune responses to cancer. Nature. 2015;520:692–696. doi: 10.1038/nature14426. [DOI] [PMC free article] [PubMed] [Google Scholar]
- 35.LeCun Y, Bengio Y, Hinton G. Deep learning. Nature. 2015;521:436–444. doi: 10.1038/nature14539. [DOI] [PubMed] [Google Scholar]
- 36.Li H, Durbin R. Fast and accurate long-read alignment with Burrows-Wheeler transform. Bioinformatics. 2010;26:589–595. doi: 10.1093/bioinformatics/btp698. [DOI] [PMC free article] [PubMed] [Google Scholar]
- 37.Liepe J, Marino F, Sidney J, Jeko A, Bunting DE, Sette A, Kloetzel PM, Stumpf MP, Heck AJ, Mishto M. A large fraction of HLA class I ligands are proteasome-generated spliced peptides. Science. 2016;354:354–358. doi: 10.1126/science.aaf4384. [DOI] [PubMed] [Google Scholar]
- 38.Linnemann C, Heemskerk B, Kvistborg P, Kluin RJC, Bolotin DA, Chen XJ, Bresser K, Nieuwland M, Schotte R, Michels S, et al. High-throughput identification of antigen-specific TCRs by TCR gene capture. Nature Medicine. 2013;19:1534. doi: 10.1038/nm.3359. [DOI] [PubMed] [Google Scholar]
- 39.Malmstrom V, Catrina AI, Klareskog L. The immunopathogenesis of seropositive rheumatoid arthritis: from triggering to targeting. Nat Rev Immunol. 2017;17:60–75. doi: 10.1038/nri.2016.124. [DOI] [PubMed] [Google Scholar]
- 40.Martin M. Cutadapt removes adapter sequences from high-throughput sequencing reads. EMB net journal. 2011;17:10–12. [Google Scholar]
- 41.Masella AP, Bartram AK, Truszkowski JM, Brown DG, Neufeld JD. PANDAseq: paired-end assembler for illumina sequences. BMC Bioinformatics. 2012;13:31. doi: 10.1186/1471-2105-13-31. [DOI] [PMC free article] [PubMed] [Google Scholar]
- 42.McKenna A, Hanna M, Banks E, Sivachenko A, Cibulskis K, Kernytsky A, Garimella K, Altshuler D, Gabriel S, Daly M, et al. The Genome Analysis Toolkit: a MapReduce framework for analyzing next-generation DNA sequencing data. Genome Res. 2010;20:1297–1303. doi: 10.1101/gr.107524.110. [DOI] [PMC free article] [PubMed] [Google Scholar]
- 43.Munson DJ, Egelston CA, Chiotti KE, Parra ZE, Bruno TC, Moore BL, Nakano TA, Simons DL, Jimenez G, Yim JH, et al. Identification of shared TCR sequences from T cells in human breast cancer using emulsion RT-PCR. Proc Natl Acad Sci U S A. 2016;113:8272–8277. doi: 10.1073/pnas.1606994113. [DOI] [PMC free article] [PubMed] [Google Scholar]
- 44.Newell EW, Sigal N, Nair N, Kidd BA, Greenberg HB, Davis MM. Combinatorial tetramer staining and mass cytometry analysis facilitate T-cell epitope mapping and characterization. Nat Biotechnol. 2013;31:623–629. doi: 10.1038/nbt.2593. [DOI] [PMC free article] [PubMed] [Google Scholar]
- 45.O’Callaghan CA, Byford MF, Wyer JR, Willcox BE, Jakobsen BK, McMichael AJ, Bell JI. BirA enzyme: production and application in the study of membrane receptor-ligand interactions by site-specific biotinylation. Anal Biochem. 1999;266:9–15. doi: 10.1006/abio.1998.2930. [DOI] [PubMed] [Google Scholar]
- 46.O’Shea EK, Lumb KJ, Kim PS. Peptide ‘Velcro’: design of a heterodimeric coiled coil. Curr Biol. 1993;3:658–667. doi: 10.1016/0960-9822(93)90063-t. [DOI] [PubMed] [Google Scholar]
- 47.Ott PA, Hu Z, Keskin DB, Shukla SA, Sun J, Bozym DJ, Zhang W, Luoma A, Giobbie-Hurder A, Peter L, et al. An immunogenic personal neoantigen vaccine for patients with melanoma. Nature. 2017 doi: 10.1038/nature22991. [DOI] [PMC free article] [PubMed] [Google Scholar]
- 48.Quinlan AR, Hall IM. BEDTools: a flexible suite of utilities for comparing genomic features. Bioinformatics. 2010;26:841–842. doi: 10.1093/bioinformatics/btq033. [DOI] [PMC free article] [PubMed] [Google Scholar]
- 49.Rajasagi M, Shukla SA, Fritsch EF, Keskin DB, DeLuca D, Carmona E, Zhang W, Sougnez C, Cibulskis K, Sidney J, et al. Systematic identification of personal tumor-specific neoantigens in chronic lymphocytic leukemia. Blood. 2014;124:453–462. doi: 10.1182/blood-2014-04-567933. [DOI] [PMC free article] [PubMed] [Google Scholar]
- 50.Raman MC, Rizkallah PJ, Simmons R, Donnellan Z, Dukes J, Bossi G, Le Provost GS, Todorov P, Baston E, Hickman E, et al. Direct molecular mimicry enables off-target cardiovascular toxicity by an enhanced affinity TCR designed for cancer immunotherapy. Sci Rep. 2016;6:18851. doi: 10.1038/srep18851. [DOI] [PMC free article] [PubMed] [Google Scholar]
- 51.Rammensee H, Bachmann J, Emmerich NP, Bachor OA, Stevanovic S. SYFPEITHI: database for MHC ligands and peptide motifs. Immunogenetics. 1999;50:213–219. doi: 10.1007/s002510050595. [DOI] [PubMed] [Google Scholar]
- 52.Rock EP, Sibbald PR, Davis MM, Chien YH. CDR3 length in antigen-specific immune receptors. J Exp Med. 1994;179:323–328. doi: 10.1084/jem.179.1.323. [DOI] [PMC free article] [PubMed] [Google Scholar]
- 53.Rossjohn J, Gras S, Miles JJ, Turner SJ, Godfrey DI, McCluskey J. T cell antigen receptor recognition of antigen-presenting molecules. Annu Rev Immunol. 2015;33:169–200. doi: 10.1146/annurev-immunol-032414-112334. [DOI] [PubMed] [Google Scholar]
- 54.Rubio-Godoy V, Ayyoub M, Dutoit V, Servis C, Schink A, Rimoldi D, Romero P, Cerottini JC, Simon R, Zhao Y, et al. Combinatorial peptide library-based identification of peptide ligands for tumor-reactive cytolytic T lymphocytes of unknown specificity. Eur J Immunol. 2002;32:2292–2299. doi: 10.1002/1521-4141(200208)32:8<2292::AID-IMMU2292>3.0.CO;2-K. [DOI] [PubMed] [Google Scholar]
- 55.Shi L, Zhang Y, Feng L, Wang L, Rong W, Wu F, Wu J, Zhang K, Cheng S. Multi-omics study revealing the complexity and spatial heterogeneity of tumor-infiltrating lymphocytes in primary liver carcinoma. Oncotarget. 2017 doi: 10.18632/oncotarget.16758. [DOI] [PMC free article] [PubMed] [Google Scholar]
- 56.Stronen E, Toebes M, Kelderman S, van Buuren MM, Yang W, van Rooij N, Donia M, Boschen ML, Lund-Johansen F, Olweus J, et al. Targeting of cancer neoantigens with donor-derived T cell receptor repertoires. Science. 2016;352:1337–1341. doi: 10.1126/science.aaf2288. [DOI] [PubMed] [Google Scholar]
- 57.Sudo T, Kamikawaji N, Kimura A, Date Y, Savoie CJ, Nakashima H, Furuichi E, Kuhara S, Sasazuki T. Differences in MHC class I self peptide repertoires among HLA-A2 subtypes. J Immunol. 1995;155:4749–4756. [PubMed] [Google Scholar]
- 58.Tran E, Turcotte S, Gros A, Robbins PF, Lu YC, Dudley ME, Wunderlich JR, Somerville RP, Hogan K, Hinrichs CS, et al. Cancer immunotherapy based on mutation-specific CD4+ T cells in a patient with epithelial cancer. Science. 2014;344:641–645. doi: 10.1126/science.1251102. [DOI] [PMC free article] [PubMed] [Google Scholar]
- 59.Uhlen M, Fagerberg L, Hallstrom BM, Lindskog C, Oksvold P, Mardinoglu A, Sivertsson A, Kampf C, Sjostedt E, Asplund A, et al. Proteomics. Tissue-based map of the human proteome. Science. 2015;347:1260419. doi: 10.1126/science.1260419. [DOI] [PubMed] [Google Scholar]
- 60.van Buuren MM, Dijkgraaf FE, Linnemann C, Toebes M, Chang CX, Mok JY, Nguyen M, van Esch WJ, Kvistborg P, Grotenbreg GM, et al. HLA micropolymorphisms strongly affect peptide-MHC multimer-based monitoring of antigen-specific CD8+ T cell responses. J Immunol. 2014;192:641–648. doi: 10.4049/jimmunol.1301770. [DOI] [PubMed] [Google Scholar]
- 61.Van der Auwera GA, Carneiro MO, Hartl C, Poplin R, Del Angel G, Levy-Moonshine A, Jordan T, Shakir K, Roazen D, Thibault J, et al. From FastQ data to high confidence variant calls: the Genome Analysis Toolkit best practices pipeline. Curr Protoc Bioinformatics. 2013;43:11 10 11–33. doi: 10.1002/0471250953.bi1110s43. [DOI] [PMC free article] [PubMed] [Google Scholar]
- 62.Van der Maaten L, Hinton G. Visualizing data using t-SNE. Journal of Machine Learning Research. 2008;9:2579–2605. [Google Scholar]
- 63.van Rooij N, van Buuren MM, Philips D, Velds A, Toebes M, Heemskerk B, van Dijk LJ, Behjati S, Hilkmann H, El Atmioui D, et al. Tumor exome analysis reveals neoantigen-specific T-cell reactivity in an ipilimumab-responsive melanoma. J Clin Oncol. 2013;31:e439–442. doi: 10.1200/JCO.2012.47.7521. [DOI] [PMC free article] [PubMed] [Google Scholar]
- 64.Wang Y, Rubtsov A, Heiser R, White J, Crawford F, Marrack P, Kappler JW. Using a baculovirus display library to identify MHC class I mimotopes. Proc Natl Acad Sci U S A. 2005;102:2476–2481. doi: 10.1073/pnas.0409798102. [DOI] [PMC free article] [PubMed] [Google Scholar]
- 65.Zhang P, Feng S, Liu G, Wang H, Fu A, Zhu H, Ren Q, Wang B, Xu X, Bai H, et al. CD82 suppresses CD44 alternative splicing-dependent melanoma metastasis by mediating U2AF2 ubiquitination and degradation. Oncogene. 2016;35:5056–5069. doi: 10.1038/onc.2016.67. [DOI] [PMC free article] [PubMed] [Google Scholar]
Associated Data
This section collects any data citations, data availability statements, or supplementary materials included in this article.
Supplementary Materials
Figure S1. Validation of the HLA-A2*01 library with the DMF5 TCR.
(A) MA2.1 antibody staining for correctly folded HLA-A*02:01 complex with DMF5 TCR wildtype peptide or peptide mimotopes. Histograms show staining by MA2.1 antibody followed by secondary antibody.
(B) The scores of predicted human peptides using the 2014PWM algorithm on cluster 2 of the round 3 sequences for the DMF5 TCR 10mer selection.
(C) The scores of the top 10 peptides identified in Figure S1B.
Related to Figure 1 and Table S1.
Figure S2. Patient tissue immunohistochemistry and TCR repertoire sequencing and phenotyping.
(A) Patient immunohistochemistry using H&E staining, anti-CD4/hematoxylin or anti-CD8/hematoxylin. All representative images are taken using 300x magnification.
Related to Figure 3 and Table S3.
(B) Patient CDR3 length as measured from the Cys to Phe.
(C) Patient distribution of TCR variable α genes in healthy and tumor tissue.
(D) Patient distribution of TCR variable β genes in healthy and tumor tissue.
(E) t-SNE plots of Patient B T cells showing transcriptional profiling by transcript sequencing (left) and cell surface markers by flow cytometry (right). The presence of transcripts is binary based off of deep-sequencing reads (1 = yes, 0 = no) and intensity relates to MFI of cell surface marker.
Related to Figure 3 and Table S4.
Figure S3. Activation of SKW-3 cells according to CD69 Median MFI and TCR tetramer staining of yeast expressing predicted peptide targets.
Data analyzed from Figure 7, but using mean fluorescence intensity of CD69 expression instead of percent cells positive for CD69 expression for (A), (B), (C), and (D). SKW-3 T cells with TCRs (A) 1A, (B) 2A, (C) 3B, or (D) 4B were co-cultured with peptide-pulsed T2 antigen-presenting cells as in Figure 7. The mean fluorescence intensity was measured from anti-CD69 staining of CD3-gated SKW-3 cells in technical triplicate with mean values and standard deviation shown. A representative experiment from biological triplicate is shown. P-values were measured using ordinary one-way ANOVA. Yeast expressing single-chain trimers of the library peptides and predicted target peptides for TCRs (E) 1A, (F) 2A, (G), 3B, and (H) 4B stained with 400 nM TCR tetramers. Tetramer negative populations are stained with streptavidin-647 only. All yeast are gated on epitope tag positive yeast.
Related to Figure 7, Table S5, Table S6, Table S7, and Table S8.
Figure S4. U2AF2 quantitative RNA expression and affinity measurements for U2AF2 peptide.
(A) Quantitative PCR expression of the U2AF2 transcript expression of tumor over healthy tissue in patients A and B using 18S as the housekeeping gene. Samples are done in technical quadruplicate with standard deviation shown.
(B) Log base 2 quantitative PCR expression of U2AF2 RNA in various human-derived tumors compared to U2AF2 RNA expression in Patient A healthy tissue using the 18S as the housekeeping gene. Samples are done in technical quadruplicate with standard deviation shown. Cell lines shown are listed in the methods section in the appropriate order.
(C) Log base 2 quantitative PCR expression of U2AF2 RNA in various human-derived tumors compared to U2AF2 RNA expression in Patient B healthy tissue using the 18S as the housekeeping gene. Samples are done in technical quadruplicate with standard deviation shown. Cell lines shown are listed in the methods section in the appropriate order.
(D) Surface plasmon resonance traces of increasing concentrations of TCR 2A flown over a chip coated with MMDFFNAQM-HLA-A*02:01 with a range of 93.6 μM to 0.365 μM using 2-fold dilutions. The peaks prior to and after association of the TCR to the peptide-HLA-A*02 generated from flow cell subtraction are removed for simplicity. Only the colored curves labeled with concentrations are used to calculate the Kd.
(E) Curve-fitting to data points generated at various concentrations of TCR labeled in Figure S4D.
Related to Figure 7.
Figure S5. Design of the machine-learning algorithm 2017DL to predict human peptide specificities.
(A) Schematic showing the process to take data from the yeast-display library selections to train a machine learning model, which scores peptides derived from proteins from the Uniprot database or patient-specific exomes. The model is generated from yeast-display selection data utilizing the deep-sequencing round counts per peptide and the composition of the peptide. An exponential curve is fit to each peptide to capture the enrichment over the rounds of selection using a fitness function.
(B) Fitness function to fit an exponential curve to the deep sequencing round counts for peptides selected by a TCR.
(C) Matrix representation of an example peptide, in which each amino acid is represented as a one-hot vector.
(D) The architecture of the machine-learning algorithm utilizing a two-layer convolutional neural network. The input consists of peptide sequences represented as a vector of one-hot vectors and the fitness scores of the peptides determined from the fitness function in Figure S5B. The output is the fitness score.
Related to Figure 7.
Table S1. DMF5 selection data and human target prediction.
The sequences identified from the round 3 deep-sequencing of the F5 10mer library selections after clustering by reverse hamming distance. Using these clusters, predictions were made on the Uniprot database using 2014PWM. The 9 predictions for the ‘GIG’ cluster and top 10 predictions for the ‘DRG’ cluster are listed. Related to Figure 2 and Figure S1.
Table S2. NKI2 selection data by peptide length.
The sequences identified from the round 3 deep-sequencing of the NKI2 library selections listed by peptide length. Related to Figure 3.
Table S3. Patient HLA typing results.
The HLA type of two patients with colorectal adenocarcinoma. ND = Not determined. Related to Figure 4.
Table S4. Orphan TCRs screened on the HLA-A*02:01 library.
The TCRs screened on the HLA-A*02:01 library. TCR sequences were chosen based on clonality in the tumor, phenotypic profile, exclusivity to the tumor, and additionally by related TCR sequences. The number beneath tumor and healthy labels indicate the number of times a paired TCR sequence was seen from this tissue. Related to Figure 5 and Figure 6.
Table S5. Peptide prediction results for TCR 1A.
Peptides tested to stimulate TCR 1A cells. Peptides are derived from the library, 2017PWM and 2017DL predictions and the rank of the peptide from the predictions or library selections are shown. Cells are left intentionally blank. Related to Figure 7 and Figure S5.
Table S6. Peptide prediction results for TCRs 2A and 3B.
Peptides tested to stimulate TCRs 2A and 3B cells. Peptides are derived from the library, 2014PWM, 2017PWM, and 2017DL predictions and the rank of the peptide from the predictions or library selections are shown. Cells are left intentionally blank. Related to Figure 7 and Figure S5.
Table S7. Peptide prediction results for TCR 4B.
Peptides tested to stimulate TCR 4B cells. Peptides are derived from the library, 2017PWM, and 2017DL predictions and the rank of the peptide from the predictions or library selections are shown. Cells are left intentionally blank. Related to Figure 7 and Figure S5.
Table S8. Primers used to generate and deep-sequence pHLA libraries.
Letter codes for nucleotides follow the IUPAC naming system. Related to Figure 1.