Abstract
Blockade of angiogenesis can retard tumour growth, but may also paradoxically increase metastasis1,2. Vessel normalization (VN) may resolve this paradox3. VN involves increased pericyte coverage, improved tumour vessel perfusion, reduced vascular permeability, and consequently mitigated hypoxia3. While these processes alter tumour progression, their regulation is poorly understood. Here we show that Type 1 T helper (Th1) cells play a crucial role in VN. Bioinformatic analyses revealed that gene expression features related to VN correlate with immunostimulatory pathways, especially T lymphocyte (TL) infiltration/activities. To delineate the causal relationship, we employed various mouse models with VN or TL deficiencies. While VN disruption reduced TL infiltration as expected4, reciprocal depletion or inactivation of CD4+-TLs decreased VN, indicating a mutually-regulatory loop. Additionally, CD4+-TL activation by immune checkpoint blockade (ICB) increased VN. IFNγ+ Th1 cells are the major population associated with VN. Patient-derived xenograft (PDX) tumours growing in immunodeficient animal hosts exhibited enhanced hypoxia compared to the original tumours in immunocompetent human hosts, which was reduced by adoptive Th1 transfer. Our findings elucidate an unexpected role of Th1 in vasculature and immune reprogramming. Th1 cells may be a marker and a determinant of both ICB and anti-angiogenesis efficacies.
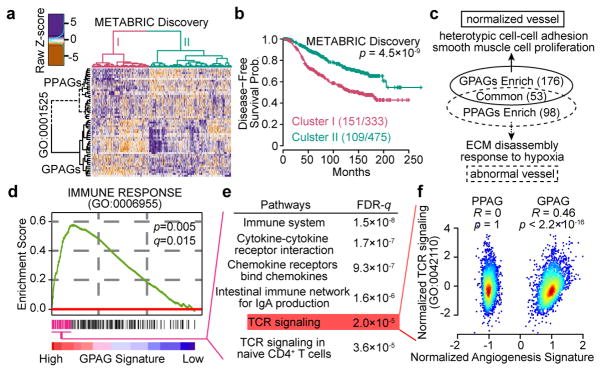
To better understand angiogenesis, we examined angiogenesis-related genes in breast cancer using METABRIC database5. Among 377 genes, 30 positively and 27 negatively correlate with survival, and are defined as good- and poor-prognosis angiogenesis genes (GPAGs and PPAGs), respectively (Supplementary Table 1a,b), which together stratify patients with different prognoses (Fig. 1a,b). Single metrics defined by (ΣGPAGs ΣPPAGs) or Principal Component Analysis are prognostic in multiple breast cancer datasets (Supplementary Table 1c–f), suggesting that different aspects of angiogenesis may play opposing roles in tumour progression.
Figure 1. The dichotomy of angiogenesis-related genes supports the “vessel normalization theory”, and links good prognosis angiogenesis genes to T cell signaling.
a,b). Hierarchical clustering of prognosis-related angiogenesis genes reveals two clusters of patients, and disease-free survival of the two clusters of patients.
c). Pathways associated with GPAGs/PPAGs. Numbers of pathways shown in parentheses.
d). GSEA reveals an association between Immune Response pathway and GPAGs.
e). Top pathways associated with leading subset genes in (d).
f). Scatter plot showing the correlation between TCR signaling genes and GPAG/PPAG signatures in METABRIC Discovery and Validation datasets (N=1992 patients).
P values are determined by log rank tests (b), random permutation (d), hypergeometric test (e), and Student’s t-test (f). FDR or q values are determined by Benjamini-Hochberg adjustment (d,e).
GPAGs are mostly related to heterotypic cell-cell adhesion and smooth muscle cell proliferation (Fig. 1c, Supplementary Table 2a,b). Pericytes and smooth muscle cells share gene expression programs and may be ontologically related6. Pericyte recruitment is often regulated by common pathways as pericyte proliferation, and is pivotal to VN6. Thus, GPAGs may reflect VN. In contrast, PPAGs are mostly related to extracellular matrix (ECM) disassembly and hypoxia (Fig. 1c, Supplementary Table 2a,c), processes regulated by mechanisms opposite to VN7.
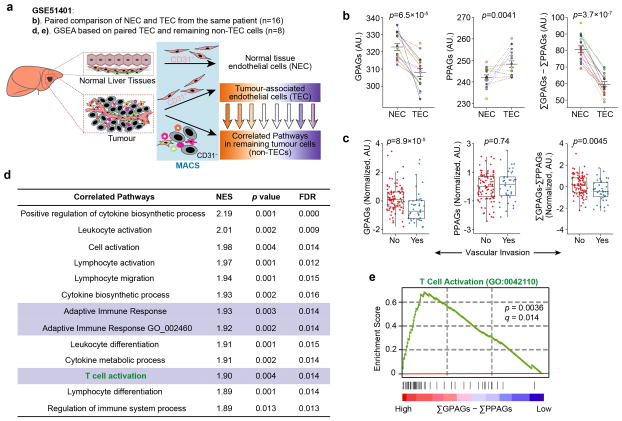
The GPAG-VN connection is further tested in liver cancer. CD31+ tumour-associated endothelial cells (TECs) or the matched CD31+ normal endothelial cells (NECs) from the same patient were profiled (Extended Data Fig. 1a). Compared to NECs, TECs express decreased GPAGs and increased PPAGs (Extended Data Fig. 1b). In GSE20017, (ΣGPAGs ΣPPAGs) inversely correlates with “invasive vasculature” (Extended Data Fig. 1c). Thus, (ΣGPAGs ΣPPAGs) is a VN indicator.
In breast cancer, GPAGs correlate with immunostimulatory pathways (Fig. 1d, Supplementary Table 3), especially T Cell Receptor (TCR) signaling (Fig. 1e,f). Similarly, in GSE51401, (ΣGPAGs ΣPPAGs) in TECs correlated with TCR signatures in non-TECs from the same tumours (Extended Data Fig. 1d,e).
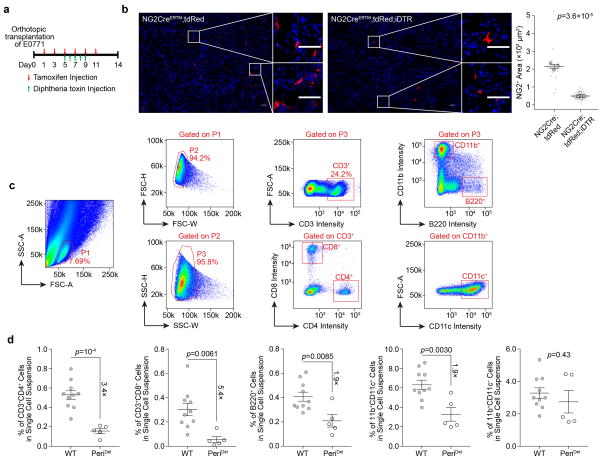
To investigate VN-TLs relationship, we examined mammary tumours in various host strains deficient of pericytes or TLs. We orthotopically transplanted E0771 murine tumour cells into mice expressing both NG2creERTM and cre-inducible diphtheria toxin receptor (PeriDel). Upon tamoxifen and diphtheria toxin treatment, NG2+ pericytes were significantly reduced (Extended Data Fig. 2a,b), which decreases total infiltrating immune cells, consistent with previous findings4. TLs exhibited a particularly dramatic decrease, whereas CD11b+CD11c−cells remained unchanged (Extended Data Fig. 2c,d), suggesting that VN preferentially promotes TL infiltration.
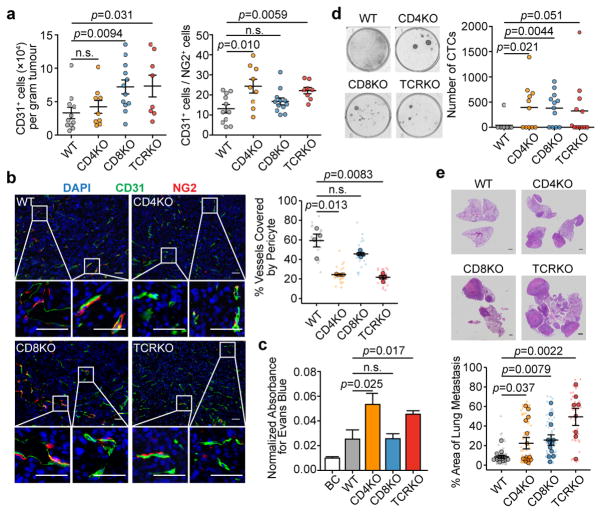
To investigate any reciprocal effects of TLs on VN, we transplanted E0771 cells into animals with CD4 knockout (CD4KO), CD8 knockout (CD8KO) and T-cell receptor knockout (TCRKO, lacking both CD4+ and CD8+-TLs). Tumours were removed at similar time points with similar sizes. Flow cytometry revealed significant effects of CD8KO on TEC frequency, and of CD4KO on TEC:pericyte ratio (Fig. 2a). TCRKO exhibited both phenomena, suggesting that vascular proliferation and VN are distinct processes. Immunofluorescence staining of pericytes and TECs validated these conclusions (Fig. 2b). E0771 tumours growing in CD4KO or TCRKO mice, but not in CD8KO mice, exhibited increased vessel permeability (Fig. 2c), consistent with pericyte deficiency. Circulating tumour cells (CTCs) were increased in all three models including CD8KO (Fig. 2d), suggesting permeability-independent, CD8-specific mechanisms, including 1) increased intravasation due to elevated vascular frequency (Fig. 2a) and 2) increased CTC survival due to loss of cytotoxic TLs. Pulmonary metastases correlated with CTC frequencies, and were increased in all three models. The effects of CD4KO and CD8KO on metastases were additive, as TCRKO mice had the highest metastatic burden (Fig. 2e).
Figure 2. Depletion of CD4+-TLs decreases tumour vessel pericyte coverage and increases metastasis.
a). Flow cytometry quantification of E0771 tumour-infiltrating endothelial cells (CD31+) and pericytes (NG2+) (WT, n=11; CD4KO, n=9; CD8KO, n=12; TCRKO, n=8).
b). Staining and quantification of endothelial cells (green) attached by pericytes (red) (n=4/group; Scale bar, 50μm)
c). Normalized absorbance of Evans blue in tumours (BC (blank control), n=5; WT, n=11; CD4KO, n=11; CD8KO, n=12; TCRKO, n=12).
d). Blood CTC frequencies from tumour-bearing mice (WT, n=11; CD4KO, n=11; CD8KO, n=12; TCRKO, n=12).
e). Lung metastatic area from H&E images (WT, n=14; CD4KO, n=14; CD8KO, n=12; TCRKO, n=8; Scale bar, 1mm).
Mean ± s.e.m shown. Smaller dots are values from individual fields (b) and whole lung sections (e). Outlined circles are mean values taken over multiple fields/sections from the same mouse.
P values were calculated by comparing individual animals using two-tailed unpaired Student’s t-test (a–c,e) or two-tailed unpaired Mann–Whitney U test (d). n.s., not significant.
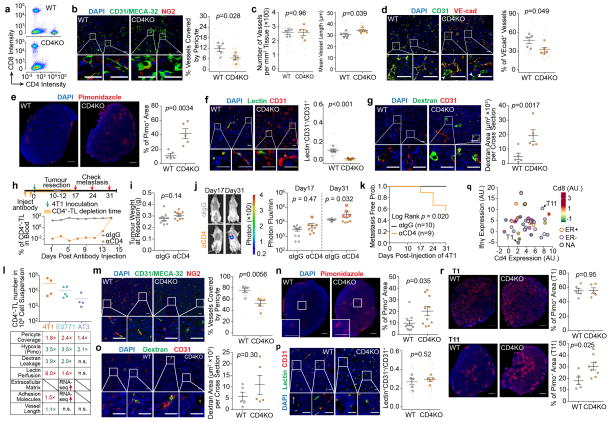
We further validated CD4+-TL-mediated VN effects in other models with varying baseline CD4+-TL frequencies. CD4KO in 4T1 tumour-bearing mice led to decreased pericyte coverage and alterations related to VN disruption, including enhanced hypoxia, increased dextran leakage, and reduced lectin perfusion (Extended Data Figure. 3a–g). We also employed αCD4 antibodies to deplete CD4+-TLs. This can be administered in an acute manner (Extended Data Fig. 3h) to delineate roles of CD4+-TLs in different metastasis stages. A regimen that restricts αCD4 effects to orthotopic tumours reduced later metastasis formation (Extended Data Fig. 3i–k), supporting that anti-metastasis functions of CD4+-TLs begin in orthotopic tumours. Another model, AT3, has a lower baseline TL infiltration (Extended Data Fig. 3l). CD4KO resulted in reduced pericyte coverage and enhanced hypoxia (Extended Data Fig. 3m,n). However, dextran leakage and lectin perfusion efficiency were not altered (Extended Data Fig. 3o,p), which may be because of the already-low CD4+-TL level. Similarly, T11 and T1 are two additional models from a collection of p53-null tumour lines8, with high and low baseline CD4+-TL infiltration, respectively (Extended Data Fig. 3q). CD4KO significantly increased hypoxia in T11, but did not affect the already-high hypoxia level in T1 (Extended Data Fig. 3r).
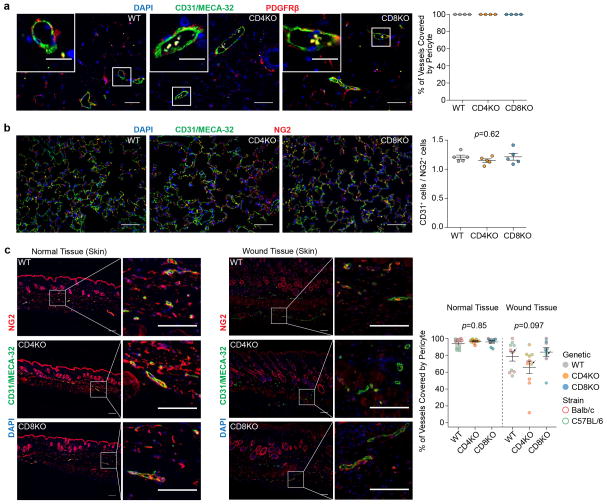
To ask if CD4+-TLs also regulate VN in normal tissues, we examined mammary glands and lungs of tumour-free mice. There was no difference in vascular structures between wild type and CD4KO mice (Extended Data Fig. 4a,b). Wounded tissues trended toward lower pericyte coverage in CD4KO mice (Extended Data Fig. 4c). Since tumour microenvironment may resemble wound-healing9, the VN effects of CD4+-TLs may have initially evolved to cope with wound-healing.
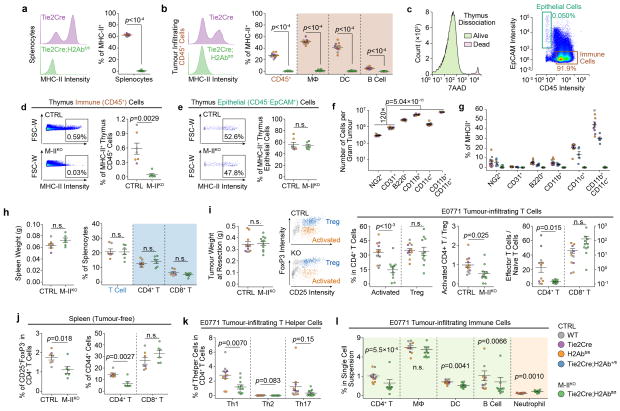
We asked if CD4+-TL activation is required for VN. We conditionally knocked out class II major histocompatibility complex (MHC-II) by combining Tie2cre and H2AbfloxP/floxP (M-IIKO). Because Tie2 is required for post-natal hematopoiesis, MHC-II was deleted in professional antigen-presentation cells, but not in thymus, leaving positive selection intact (Extended Data Fig. 5a–e). Although 5–10% of pericytes and < 1% of TECs also express MHC-II, they only account for 0.1% of all MHC-II+ cells and are unlikely to influence the immune microenvironment (Extended Data Fig. 5f,g). This conditional knockout reduced activated CD4+-TLs, decreased ratio between effector memory and naïve cells, but did not alter total CD4+-TL numbers (Extended Data Fig. 5h–j). Moreover, among CD4+-TL subsets, only IFNγ+ Th1 cells were substantially decreased (Extended Data Fig. 5k).
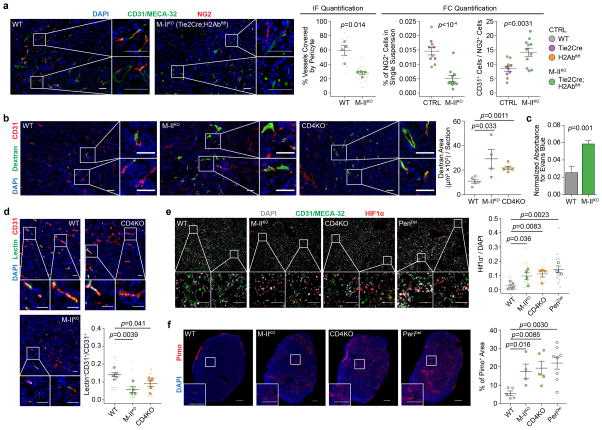
Tumours in M-IIKO mice phenocopied those in CD4KO or PeriDel mice with decreased pericyte coverage (Extended Data Fig. 6a), increased vascular leakiness (dextran and Evans Blue assays, Extended Data Fig. 6b,c), decreased lectin perfusion (Extended Data Fig. 6d), increased hypoxia (nuclear HIF1α- and pimonidazole-staining, Extended Data Fig. 6e,f), and decreased infiltration of immune cells except for neutrophils, which were increased (Extended Data Fig. 5l).
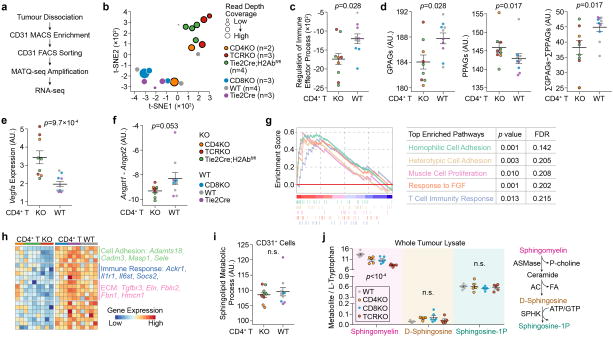
To study molecular mechanisms, we performed RNA-seq on TECs (Extended Data Fig. 7a), the central cell type that integrates signals from TLs, pericytes and cancer cells in this vasculature remodeling process. Indeed, CD4+-TL deficiency caused transcriptomic alterations to TECs, including reduced immune response genes, lower GPAGs, higher PPAGs (Extended Data Fig. 7b–d). It also changed pathways/genes known to regulate vessel normalization10, including increased Vegfa, decreased Angpt1/Angpt2, and decreased adhesion and ECM molecules (Extended Data Fig. 7e–h). Col-IV staining revealed discontinuous TEC ECM in CD4KO mice (Supplementary Videos). We also examined Sphingosine-1-phosphate (S1P) and its precursors, ruling out a role of S1P pathway in CD4+-TL-mediated VN (Extended Data Fig. 7i,j). Thus, CD4+-TLs regulate multiple VN-related pathways in TECs.
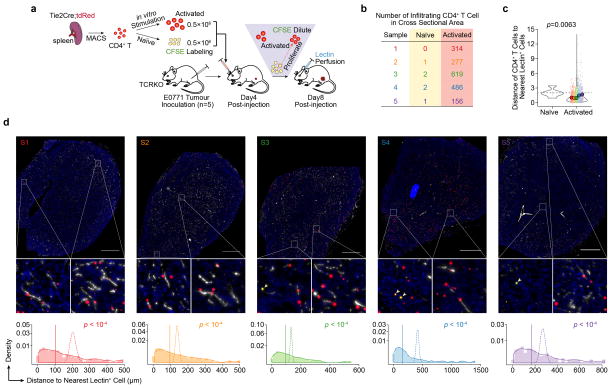
To ask if activated TLs co-localize with TECs, we adoptively transferred stimulated tdRFP+ CD4+-TL and tdRFP+;CFSE+ naïve CD4+-TLs into tumour-bearing TCRKO mice (Extended Data Fig. 8a). Compared to naïve CD4+-TLs (tdRFP+;CFSE+), stimulated CD4+-TLs (tdRFP+;CFSE−) were more frequent in tumours (Extended Data Fig. 8b), and predominantly co-localized with lectin+ vessels (Extended Data Fig. 8c,d), suggesting direct crosstalk between stimulated CD4+-TLs and TECs.
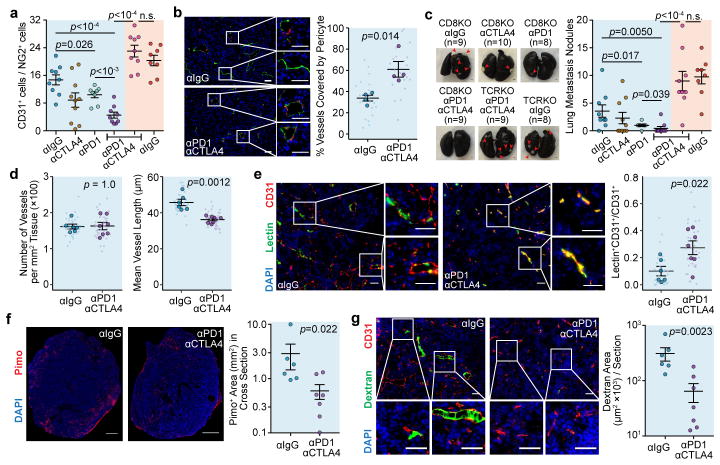
We reasoned that immune checkpoint blockade (ICB) should be immunostimulatory and thereby enhance VN. We used CD8KO mice to separate CD4+-TLs from CD8+-TL-mediated cytotoxicity. Interestingly, even without CD8+ TLs, combinatory inhibition of PD1 and CTLA4, two clinically relevant ICB targets11, significantly delayed orthotopic E0771 tumour growth. In size-matched tumours, ICB led to increased pericyte coverage (Fig. 3a,b), and decreased pulmonary metastasis (Fig. 3c).
Figure 3. ICB therapy increases vessel normalization and decreases metastasis.
a). Tumour-infiltrating endothelial cells:pericyte ratio by flow cytometry.
b). Percentage endothelial attached by pericytes (n=4/group; Scale bar, 50μm).
c). Lung metastasis nodule count by Indian Ink Assay (Scale bar, 1mm).
d–g). Vessel length (d), lectin perfusion efficiency (e), pimonidazole staining (f), and dextran leakage (g) (αIgG, n=6; αPD1αCTLA4, n=7; Scale bar, 50μm (e,g), 1mm (f)).
Mean ± s.e.m shown. Animal numbers used in (a,c) are denoted in (c). P values were calculated by two-tailed unpaired Student’s t-test (a,b) or two-tailed unpaired Mann–Whitney U test (c–g). n.s., not significant.
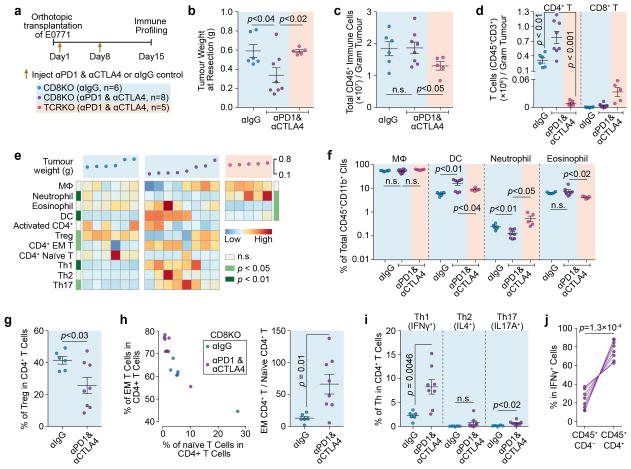
Besides tumour size-matched experiments, we performed time-matched experiments (Extended Data Fig. 9a,b) to understand how a certain duration of ICB alters tumour microenvironment. While total immune cell number appeared unaffected (Extended Data Fig. 9c), CD4+-TLs increased (Extended Data Fig. 9d), accompanied by other alterations, including increased dendritic cells and decreased neutrophils (Extended Data Fig. 9e,f). Among CD4+-TLs, the percentage of regulatory CD4+-TLs (Tregs) decreased, and the effector memory/naïve CD4+-TL ratio increased (Extended Data Fig. 9g,h). Intracellular cytokine staining uncovered Th1 as the major population increased by ICB (Extended Data Fig. 9i,j), accompanied by other VN hallmarks (Fig. 3d–g), indicating Th1-mediated VN.
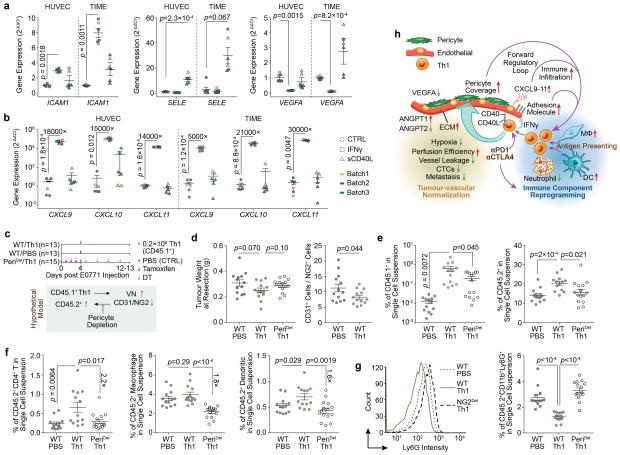
Our data suggest a positive feedback loop between Th1 and VN. Disruption of VN via pericyte depletion decreased TL infiltration (Extended Data Fig. 2). Reciprocally, CD4+-TL knockout/inactivation reduced VN (Fig. 2, Extended Data Fig. 6), whereas activation improved VN (Fig. 3). Molecularly, Th1-charateristic cytokine IFNγ and surface molecule CD40L elevated endothelial adhesion molecules ICAM1 and SELE (Extended Data Fig. 10a), which mediate immune cell infiltration12. IFNγ also decreased endothelial VEGFA, and increased CXCL9, CXCL10 and CXCL11 (Extended Data Fig. 10a,b), which recruit Th113 and stimulate pericyte recruitment14. To test the role of pericytes in this loop, we transferred CD45.1+ Th1 cells into CD45.2+ mice (Extended Data Fig. 10c). This procedure improved pericyte coverage (Extended Data Fig. 10d), and increased infiltration of host CD45.2+ immune cells including CD4+-TLs, macrophages and dendritic cells (Extended Data Fig. 10e,f). Neutrophils exhibited an opposite trend (Extended Data Fig. 10g), similar to previous experiments (Extended Data Fig. 5l, Extended Data Fig. 9e,f). Pericyte depletion attenuated these effects (Extended Data Fig. 10e,f), confirming the role of pericytes (Extended Data Fig. 10h).
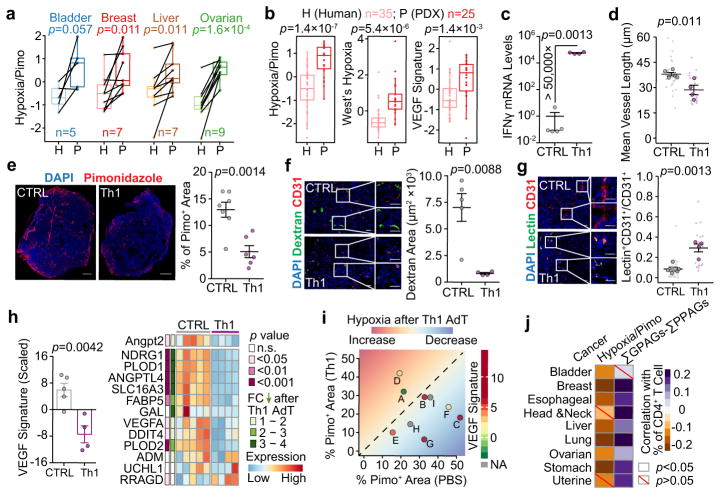
PDX models provide an opportunity to establish the causal role of Th1 in VN for human tumours, because tumours were transferred from immunocompetent (original patients) to immunodeficient (animals) environment. We analyzed gene expression profiles of PDX-original tumour pairs of multiple cancer types. GPAGs and PPAGs were not comparable due to inter-species differences. Mouse stroma cell genes could not be captured by human microarray platforms, or were removed when aligned to human genomes in RNA-seq analyses. However, hypoxia-related signatures in human cells can reflect VN, which were indeed enriched in PDX tumours as compared to the matched or un-matched human tumours (Fig. 4a,b). We first used human MDA-MB-231 tumours for Th1 adoptive transfer. Tumours with Th1 transfer had higher expression of IFNγ (Fig. 4c), confirming successful infiltration. Th1 induced VN, as indicated by decreased hypoxia and vessel leakiness, pruning of large/dilated vessels, and improved perfusion efficiency (Fig. 4d–g). Molecularly, Angpt2 and other VEGF-signature genes15 decreased (Fig. 4h). We also applied this strategy to nine PDX models, seven of which responded to Th1 transfer with reduced hypoxia. The two non-responders expressed VEGF signatures at a lower baseline level, and correspondingly displayed a low starting level of pimonidazole (Fig. 4i), suggesting that the lack of response is due to initially-low VEGF signaling/hypoxia.
Figure 4. Human tumours transplanted into immunocompromised mice (PDX) exhibit enhanced hypoxia features, which can be mitigated by Th1 adoptive transfer.
a). Hypoxia signature in PDX tumours compared to the paired original patient tumour in different cancers.
b). Unpaired comparison of three hypoxia-related gene signatures between breast cancer patients and PDX samples.
c). Quantitative RT-PCR analysis of Ifnγ in MDA-MB-231 tumours with Th1 adoptive transfer.
d–g). Vessel length (d), pimonidazole staining (e), dextran leakage (f), and lectin perfusion efficiency (g) following Th1 adoptive transfer (Scale bar, 1mm (e), 50μm (f,g)).
h). (Left) Scaled VEGF signature. (Right) Relative expression levels of individual genes in each sample. FC, fold change.
i). Percentage of pimonidazole+ area in nine PDX models after Th1 adoptive transfer. AdT, adoptive transfer.
j). Correlation between the percentage of CD4+-TLs with pimonidazole-based hypoxia signature and (ΣGPAGs ΣPPAGs) in different cancers.
Mean ± s.e.m shown; PBS, n=5; Th1, n=4 (c–h). P values were calculated using two-tailed unpaired Student’s t-test (a–h,j). Information on datasets and analytical methods (a,b,i,j), and PDX (i) can be found in Methods and Supplementary Table 4, respectively
Finally, we asked if CD4+-TL-VN connection can be generalized to other cancer types. In TCGA we analyzed nine solid tumour types. In seven, estimated CD4+-TL infiltration (CIBERSORT16) and hypoxia inversely correlated. In eight, CD4+-TL infiltration and (ΣGPAGs ΣPPAGs) positively correlated (Fig. 4j).
Although TLs have previously been linked to angiogenesis17–19, their impact on VN has not been appreciated. Therefore, our finding adds to the growing list of TL functions. Multiple lines of evidence support that stimulated CD4+-TLs, especially Th1, likely mediate VN by localizing to the vicinity of TECs, changing the cytokine environment, and subsequently affecting pericyte recruitment/attachment. VN, in turn, alters the immune landscape by recruiting TLs and decreasing neutrophils. At a molecular level, this mutually-regulatory loop is orchestrated in part by IFNγ and CD40L, via their effects on multiple downstream pathways. Our results argue that ICB efficacies may be achieved partially through Th1-mediated VN. A recent finding demonstrated that IFNγ signaling is essential for therapeutic responses to ICB therapies20. Anti-angiogenesis therapies have also been extensively tested in the clinic21. The clinical outcomes of these therapies may partially depend on their effects on VN and the consequent reprogramming of immune microenvironment. It is conceivable, for instance, that improving VN will increase immune cell infiltration and enhance the efficacies of immunotherapies such as anti-PD1 or anti-CTLA4 treatments. Thus, combinatory interventions that simultaneously perturb both processes may present promising strategies for potential synergy.
METHODS
Cell lines and cell culture
E0771 cells (CH3 Biosystems) were cultured in RPMI-1640 medium (HyClone, supplemented with 10 mmol·L−1 HEPES (Gibco)), 4T1 cells (Michigan Cancer Foundation), AT3 cells (gift of Dr. Scott I. Abrams at Roswell Park Cancer Institute) and MDA-MB-231 cells (ATCC) were cultured in DMEM/High Glucose medium (HyClone). All media contained 10% FBS (Gibco), 100 IU·ml−1 penicillin/streptomycin (Lonza), and 25 ng·ml−1 amphotericin B (Lonza). TIME (telomerase-immortalized microvascular endothelial cells, gift of Dr. Renfang Mao at Methodist Research Institute) and HUVEC (human umbilical vein endothelial cells, gift of Dr. Li Qin at Baylor College of Medicine) were cultured in VEGF endothelial complete medium (LifeLine).
All cells were grown in a humidified incubator at 37°C, with 5% CO2, and were tested regularly for mycoplasma contamination.
Animals used
C57BL/6J (WT, B6), B6.129S2-Cd4tm1Mak/J (CD4KO, B6), B6.129S2-Cd8atm1Mak/J (CD8KO, B6), B6.129S2-Tcratm1Mom/J (TCRKO, B6), B6.Cg-Gt(ROSA)26Sortm14(CAG-tdTomato)Hze/J (ROSA-tdRed, B6), C57BL/6-Gt(ROSA)26Sortm1(HBEGF)Awai/J (ROSA-DTR, B6), B6.Cg-Tg(Cspg4-cre/Esr1*)BAkik/J (NG2ER™Cre, B6), B6.Cg-Tg(Tek-cre)1Ywa/J (Tie2Cre, B6), B6.129X1-H2-Ab1tm1Koni/J (ROSA-H2Ab, B6), BALB/cJ and NOD.Cg-Prkdcscid Il2rgtm1Wjl/SzJ (NSG) (all from Jackson Laboratory), and athymic nude mice (from Envigo Laboratories), B6.SJL-Ptprca/BoyAiTac (CD45.1, B6) (from Taconic) were bred in our facilities. To generate CD4KO and CD8KO mice with Balb/c background, the CD4KO and CD8KO B6 mice were crossed with WT Balb/c mice for 8 generations and 4 generations, respectively.
For retro-orbital injection, the mice were anesthetized using isoflurane-based small animal anesthesia unit. Otherwise, ketamine (100 mg·kg−1)/xylazine (10 mg·kg−1) were used for anesthesia.
6 – 8 week-old female mice were used unless otherwise specified. No randomization or blinding was used to allocate experimental groups.
All animal work was done in accordance with a protocol approved by the Baylor College of Medicine Institutional Animal Care and Use Committee. The tumour weight did not exceed 10% of animal’s body weight. All the tumours used in the project meet this criterion. The information associated with tumour size/weight can be found in source data (Fig. 2a, Fig. 3a,c, Extended Data Fig. 3l, Extended Data Fig. 5i, Extended Data Fig. 9b, Extended Data Fig. 10d, and Supplementary Table 4).
PDX tumours
Breast cancer PDXs were maintained by injecting 1–2mm size tumour pieces into fat pad-cleared mammary glands of NRG mice. The development of PDX lines was conducted under the Institutional Review Board-approved protocols, and was documented in previous studies22. The current study used already-established PDXs that had been de-identified, and therefore, has been granted protocol exemption by the Institutional Review Board of Baylor College of Medicine for not involving human subjects.
In vivo treatment
Mice were injected with 1 mg tamoxifen (Sigma) each day for 4 consecutive days. For diphtheria toxin-mediated cell depletion, 100 μg·kg−1 of diphtheria toxin (Sigma) were injected intraperitoneally as indicated in the appropriate figure legends.
To deplete CD4+-TLs, mice were injected intraperitoneally with 250 μg anti-CD4 (clone GK1.5) or 250 μg isotype-matched control antibody (Rat IgG2b (clone LTF-2; both from BioXcell)) on Day 3 and Day 1 before tumour inoculation.
For immune checkpoint blockade therapy, 125 μg anti-CTLA-4 (clone 9D9) and 125 μg anti-PD-1 (clone RMP1-14), or the same amount of isotype-matched control antibody (mouse IgG2b (clone MPC-11) and rat IgG2a (clone 2A3; all from BioXcell)) were delivered into mice intraperitoneally on Day 1 and Day 8 post-tumour inoculation.
Mammary fat pad injection
E0771 cells were harvested from culture with 2 mg·ml−1 EDTA (Versene, Lonza). 4T1 cells, AT3 cells, and MDA-MB-231 cells were harvested using 0.25% trypsin (HyClone). The cells were washed twice with PBS (Lonza), counted, then resuspended in 1:1 solution of PBS and Matrigel (Phenol Red-Free and growth factor reduced; BD Bioscience). Mice were anaesthetized, and a small incision was made on the shaved abdomen to reveal the mammary gland. 0.5×10⁶ E0771, 0.2×10⁶ 4T1, 0.2×10⁶ AT3 or 106 MDA-MB-231 cells were injected directly into the mammary fat pad. The incision was then closed using wound clips (EZ Clips), which were removed on Day 8 post-injection of cancer cells.
For the primary murine tumour models derived from p53null Balb/c mice (T11 and T1) and patient-derived xenografts, tumours were minced into approximately 1 mm3 fragments and were transplanted directly into fad pads of Balb/c and NSG mice, respectively. The 3 – 4 week-old NSG mice were used for patient-derived xenograft transplantation after clearance of mammary gland epithelium cells.
Primary tumour resection
Primary tumour growth was monitored every two days by measuring tumour length (L) and width (W). Tumour volume (V) was then calculated using the formula, V=π·L·W2/6. E0771 tumours were surgically resected when tumour size reached a volume greater than 500 mm3 (around Day12 – Day14 post injection), while 4T1 tumours were removed when the size was larger than 200 mm3 (around Day9 – Day12 post injection). The lymph nodes were also removed at the time of tumour resection.
Wound closure assay
For wound healing experiments, 8 – 10 week old female mice of different inbred strains (Balb/c and C57BL/6J) with different genetic backgrounds (WT, CD4KO, and CD8KO) were anesthetized and 3 – 5 mm full-thickness wounds were made on the shaved dorsal skin with sharp-blunt scissors. The mice were monitored daily until wound closure was completed (around Day10 – Day12 after wounding). Skin tissues were harvested and fixed with 4% paraformaldehyde (PFA) overnight at 4°C for immunofluorescence analysis.
Bioluminescent imaging and analysis
Mice were injected retro-orbitally with 1.5 mg of D-luciferin (Thermo Fisher) (15 mg·ml−1 in PBS). Imaging was completed within 2 – 4 minutes after injection, using a Caliper Living Imaging system and analysis software v4.2. For the bioluminescence image plots, photon flux was calculated for each mouse by using a rectangular region of interest encompassing the thorax of the mouse in a supine position.
Tumour dissociation
Tumours were cut into small fragments (around 1 mm3) and incubated for 20 minutes with Collagenase Type III (Worthington Biochemical), in RPMI-1640 medium containing 2% FBS (10 ml per gram of tumour tissue) at 37°C.
The tumour pieces were transferred to a tissue digestion C-tube (Miltenyi) and further dissociated enzymatically and mechanically on a gentleMACS Dissociator (Miltenyi). Briefly, the impTumour_03 program was run on the dissociator, followed by a 10-minute incubation at 37°C. Next, the m_Lung_02 program was run to maximize extraction of pericytes and endothelial cells, followed by a 10-minute incubation at 37°C. After a final run of the m_Lung_02 program, the digestion reaction was stopped with albumin-rich buffer (RPMI-1640 medium containing 0.5% bovine serum albumin (BSA)) (Miltenyi). A single cell suspension was obtained by filtering through a 70-μm cell strainer.
Single cell suspensions were centrifuged for 5 minutes at 1,400 g, resuspended in RBC lysis buffer (eBioscience), incubated on ice for 2 minutes, and washed with PBS containing 1.5% FBS (or without FBS if the downstream flow cytometry staining panel included a Ghost Dye (Tonbo)).
Thymus dissociation
Mice were euthanized, and both thymuses overlying the heart were harvested, minced into smaller pieces, and transferred to C-Tubes. Liberase TH/DNase I (RPMI-1640 medium containing 0.05% w/v of Liberase TH and 100 U·ml−1 of DNase I (both from Sigma)) were used for enzyme solution23. The thymus samples were mechanically disrupted using the m_spleen_02 program on the GentleMACS Dissociator, followed by 15 minutes of digestion at 37°C in the above enzyme solution. Following digestion, the samples were again dissociated using the m_spleen_01 program. The reactions were halted using albumin-rich buffer, and single cell suspensions were obtained as described in Tumour dissociation section.
In vitro CD4+-TL stimulation and adoptive transfer
Single cell suspensions of splenocytes were prepared by cutting the spleen into small pieces and forcing them through 70 μm filters. CD4+-TLs were enriched by mouse CD4 MicroBeads (Miltenyi) as per manufacturer’s protocol. The anti-CD3-coated 96-well plate was prepared by an overnight incubation with 100 μl anti-CD3ε antibodies (5 μg·ml−1 in PBS; eBioscience) at 4°C. Next, 2× 10⁵ naïve CD4+-TLs cells were cultured in 100 μl/well of CD4+-TL activation culture medium (RPMI-1640 supplemented with 5% heat inactivated FBS, 100 IU·ml−1 penicillin/streptomycin, and 25 ng·ml−1 amphotericin B, 55 μmol·L−1 β-Mercaptoethanol (Sigma), 10 ng·ml−1 IL-2 (R&D Systems)). For Th1-skewed stimulation, 10 μg·ml−1 anti-IL4 antibody (clone 11B11) and 20 ng·ml−1 IL-12 (both from Tonbo)) were added to the medium. The cells were incubated at 37°C with 5% CO2 for 96 hours.
If cell tracking was required, the CD4+-TLs were labeled with CFSE (Thermo Fisher) using a mouse lymphocyte optimized method24. Mice received intravenous injection of 106 CD4+-TLs unless otherwise noted.
Evans Blue assay and clonogenic assay
The assay was modified based on the published protocols25,26. Tumour bearing mice were injected with 0.5 mg Evans Blue (5 mg·ml−1 in PBS; Sigma) retro-orbitally. After 2 hours to allow the dye to circulate, the mice were euthanized, and a vertical inline incision along the sternum was made to expose the heart and lungs. Whole animal perfusion was performed. An incision was made in the right atrium and 10 ml PBS containing 2 mmol·L−1 EDTA (Millipore) was injected through the left ventricle to remove intravascular Evans Blue dye. The tumours were resected, with the surrounding normal tissues removed. The tumours (0.2 – 0.5 g) were cut into pieces (< 3 mm3), and incubated in 0.5 ml formamide (Sigma) for 24 hours at 56°C to extract the Evans Blue from the tumour. The samples were then centrifuged at 12,000 g for 5 minutes to pellet any remaining tissue fragments. The supernatant was collected and diluted with formamide, to a final concentration of 0.5 gram tumour per ml formamide. The sample absorbance was measured at 655 nm and 750 nm against a blank containing pure formamide, using iMark Microplate Reader (BioRad). The following formula was used to eliminate the effect of residual heme pigment in the blood: Corrected Ab620 = Ab655 nm - (1.426·Ab750 nm + 0.03). For the clonogenic assay, blood was collected by whole animal perfusion into 15 ml EDTA-coated conical tubes and centrifuged at 1,400 g for 5 minutes. The cell pellet was incubated with RBC lysis buffer on ice for 8 minutes, washed twice with PBS, then resuspended in RPMI complete medium (containing 10% FBS, 100 IU·ml−1 penicillin/streptomycin, and 25 ng·ml−1 amphotericin B). After incubating at 37°C with 5% CO2 overnight, the cell culture medium was discarded, the plate was washed three times with PBS, and fresh cell culture medium was added. After culturing for an additional 8 days, the cell culture medium was removed and the plate was washed once with PBS. Then, the cells were fixed with 2% PFA for 20 minutes, stained with 1% Crystal Violet Solution (Sigma) for 1 minute and washed with water. The plate was dried at 20°C, and then scanned at 1,200 dpi, using GelCount (Oxford Optronix). The number of colonies was counted manually and the colony areas were measured using ImageJ. The calibration of CTCs based on clonogenic sizes can be found in Supplementary Table 5.
Lung Metastasis Quantification
Hematoxylin–eosin (H&E) staining and India Ink assay were used to quantify lung metastasis. For H&E staining, mice were euthanized and were injected with 5 ml 10% neutral buffered formalin (NBF) into the trachea. The lungs were harvested, fixed with 10% NBF and paraffin embedded. For each lung sample, six 3-μm paraffin-embedded sections at 300-μm intervals were used for hematoxylin and eosin staining. Images of whole lung sections were captured using PathScan Enabler IV (Meyer), and metastases were quantified using the texture segmentation algorithm of MATLAB v2014b.
For the India Ink assay, mice were euthanized and injected with 5 ml India Ink (15% v/v diluted in PBS; Hardy Diagnostics) into the trachea. The lungs were then harvested and fixed with Fekete’s solution (for 1 L, mix 880 ml 70% ethanol, 80 ml 37% formaldehyde, and 40 ml glacial acetic acid) overnight at 4°C. The lung metastasis nodules were counted manually.
Pimonidazole staining and blood vessel leakiness analysis
For hypoxia studies, 2 mg pimonidazole (Hypoxyprobe) was injected intravenously and was left to circulate for 20 minutes before tumour resection. Staining of tumour sections was performed with a Hypoxyprobe Plus Kit according to supplier’s protocol.
For the evaluation of vessel leakiness, mice were given 1mg of 70-kDa lysine fixable fluorescein labeled dextran (Thermo Fisher) and 50 μg DyLight 649 labeled tomato Lectin (Lycopersicon Esculentum; Vector Labs). After 10 minutes, the mouse was subjected to whole animal perfusion as described in Evans Blue assay. The tumours were carefully excised and cut into two halves along the maximum diameter. Both halves were fixed with 4% PFA overnight at 4°C, and were paraffin embedded or frozen.
Flow Cytometry
Single cell suspensions were prepared as described in Tumour Dissociation section. The cells were incubated for 15 minutes at 4°C with anti-mouse Fc-block CD16/32 antibody (clone 93, eBioscience, 1:100), in PBS/FBS. Cells were subsequently stained with antibodies to detect endothelial cells, pericytes, and immune cells diluted in PBS/FBS, at 4°C for 25 minutes. The following antibodies against mouse antigens were used: anti-NG2 (1E6.4) and anti-EpCAM (caa7-9G8) (both from Miltenyi); anti-CD31 (MEC13.3), anti-CD45.1 (A20), anti-CD45.2 (104), anti-IFNγ (XMG1.2), anti-IL4 (11B11), anti-IL17A (TC11-18H10.1), anti-FoxP3 (MF14), anti-MHC-II (M5/114.15.2) (all from Biolegend); anti-CD25 (eBio7D4), anti-CD3ε (145-2C11), anti-CD4 (GK1.5), anti-CD8 (53-6.7) (all from eBioscience); anti-B220 (RA3-6B2), anti-CD11b (M1/70), anti-CD11c (N418), anti-CD25 (PC61.5), anti-CD44 (IM7), anti-CD45 (30-F11), anti-CD62L (MEL14), anti-F4/80 (BM8) (all from Tonbo); anti-SiglecF (E50-2440, BD Biosciences). For intracellular staining of the regulatory T cells (Tregs) and T helper cells, CD45 MicroBeads (Miltenyi) were used to enrich tumour-infiltrating immune cells. Tregs were detected using Foxp3/Transcription Factor Staining Buffer Set (eBioscience) as per manufacturer’s instructions. For cytokine intracellular staining, 0.5×10⁶ enriched tumour-infiltrating immune cells were resuspened in 0.1 ml RPMI complete medium (RPMI-1640 medium containing 10% heat inactivated FBS, 100 IU·ml−1 penicillin/streptomycin, 55 μmol·L−1 β-Mercaptoethanol, 1× Protein Transport Inhibitor Cocktail (eBioscience)), and were incubated at 37°C with 5% CO2 for 5 hours.
The T helper cells (Th1, Th2 and Th17) were detected using Intracellular Fixation and Permeabilization Buffer Set (eBioscience) as per manufacturer’s instructions.
Labeled cells were analyzed immediately or fixed in 1.5% PFA. 7AAD (eBioscience) or Ghost Dye (Tonbo) was used as viability dyes for fresh or fixed cells, respectively.
Absolute cell numbers were quantified using liquid counting beads (BD Biosciences). Data were acquired using a FACS CantoII (BD Biosciences) and analyzed with either FlowJo v10.0 or FACS Diva v8.0 software.
Cell Sorting and RNA Isolation for RNA-seq
To obtain tumour-associated CD31+ endothelial cells, E0771 breast tumours were dissociated into single cell suspensions by a similar method as described in the Tumour Dissociation section, except that a Mouse Tumour Dissociation kit (Miltenyi) was used instead of Collagenase III, in order to obtain a higher yield and increased viability of CD31+ cells. Also, CD31 MicroBeads (Miltenyi) were used to enrich for tumour endothelial cells via magnetic cell separation as per manufacturer’s protocol. Dead cells and debris were excluded by FCS, SSC and 7AAD staining profiles. All cell sorting experiments were performed using an Arial Cell Sorter (BD Biosciences). The CD31+ cells were sorted directly into TRIzol LS (Thermo Fisher), and RNA was extracted using the standard protocol for TRIzol RNA Extraction.
After RNA purification, MATQ-seq was performed to amplify the whole transcriptome27. The input and yield of each sample was determined by qPCR after 2nd strand synthesis. To obtain similar cDNA yield and decrease PCR bias, we adjusted the PCR cycle number for each sample based on the qPCR results.
Sequencing libraries were prepared from 1 ng of purified double-strand cDNA with the Illumina Nextera XT DNA Library Prep Kit per supplier’s protocol. Cluster generation was performed using the Illumina Nextseq 500/550 high output v2 kits and sequenced on the Illumina Nextseq 500 equipment.
In vitro treatment of IFNγ and soluble CD40 ligand (sCD40L)
The HUVEC or TIME cell lines were plated at 3,000 cells/cm2 in culture plate containing VEGF endothelial complete medium (LifeLine) for 10 hours. The cells were then treated with IFNγ (1,000 U·ml−1; R&D Systems) for 20 hours or sCD40L (100ng·ml−1; Tonbo) for 4 hours before RNA isolation. The expression levels of VEGFA, ICAM1, SELE, and CXCL9–11 were measured using qRT-PCR.
RNA Isolation and qRT-PCR
For cells cultured in vitro, RNA isolation was performed with the Quick-RNA MiniPrep Plus Kit (Zymo). Reverse transcription was performed using the High Capacity RNA-to-cDNA Master Mix (Applied Biosystems), and qPCR was performed using PerfeCTa SYBR Green FastMix (Quanta) in a 7500 Real time PCR system (Applied Biosystems).
The xenograft tumours were snap-frozen with liquid nitrogen immediately after resection, and homogenized with Precellys Lysing kits (Bertin Instruments). Next, total RNA was extracted using standard TRIzol RNA extraction protocol. The cDNA was synthesized with SuperScript III First-Strand Synthesis System (Thermo Fisher), and qPCR was performed using PerfeCTa SYBR Green FastMix in a CFX Connect Real-Time PCR Detection System (BioRad).
Samples were amplified by 40 cycles of 10 seconds at 95°C and 30 seconds at 60°C. Results were calculated by the change-in-cycling-threshold (ΔΔCt) method as follows (relative to the reference control gene B2M and Gapdh, encoding β-2-microglobulin and glyceraldehyde phosphate dehydrogenase, respectively): −ΔΔCt = −(ΔCt Treatment − ΔCt Control), where ΔCt = Ct Target − ΔCt Ref.
The sequences of primers used can be found in Supplementary Table 6.
Immunofluorescence staining
To prepare frozen sections, the fixed tissues were incubated in 30% sucrose in PBS (w/v) overnight, and frozen in optimum cutting temperature gel (Tissue-Tek; Sakura). Sections of 6-μm in thickness were cut on Leica CM1850 cryotome.
For paraffin embedded blocks, 3-μm thick sections were deparaffinized and treated with a heat induced antigen retrieval Tris-EDTA (pH9.0) solution. To reduce the background, the sections were immersed in the 100 mmol·L−1 NH4Cl for 10 minutes and washed with running water for 5 minutes.
Slides were blocked in PBS with 10% normal serum (Jackson Laboratory), 1% BSA, and 0.3% Triton X-100 (Millipore) for 1 hour at 20°C. Primary antibodies were incubated overnight at 4°C in the blocking solution. Secondary antibodies were added into the blocking solution and incubated for 1 hour at 20°C. Nuclei were stained with 1 μg·ml−1 DAPI (4,6-diamidino-2-phenylindole; Thermo Fisher), for 2 minutes at 20°C. Excess antibodies were removed by washing for 5 minutes in PBS with 0.5% Tween-20 (Millipore). The slides were then washed and coverslips were mounted, using ProLong Gold anti-fade reagent (Thermo Fisher). Primary antibodies included: anti-PDGFRβ (ab32570), anti-CD31 (ab28364), anti-Hif1α (EPR16897; all from Abcam); anti-CD31 (clone MEC13.3), anti-mouse panendothelial cell antigen (clone MECA-32), anti-VCAM1 (clone 429; all from Biolegend); anti-Ki-67 (clone M-19; Santa Cruz); anti-NG2 (ab5320; Millipore); anti-VE-cadherin (AF1002; R&D Systems). Secondary antibodies included: Alexa-Fluor-488 Goat anti-Rabbit, Alexa-Fluor-594 Goat anti-Rabbit (both from Jackson Laboratory), Alexa-Fluor-488 Chicken anti-Rabbit, Alexa-Fluor-594 Chicken anti-Goat (both from Thermo Fisher). Stained sections were visualized by a Carl Zeiss Axioskop2 plus microscope using ×10, ×20 or ×40 objectives, or scanned with Zeiss Axioscan.Z1. The whole section imaging was performed by an independent researcher who was blind to sample group allocation.
Image analysis
Hypoxia levels were quantified as pimonidazole+ pixels or Hif1α+ pixels divided by the DAPI+ pixels.
For pericyte coverage quantification, vessels were counted manually in five independent ~ 0.4 mm2 fields at ×20, and percentage of vessels covered by pericytes = pixels of CD31+ cells attached by NG2+ cells/total pixels of CD31+ cells.
For analysis of leakiness in addition to Evans Blue assay, the diffused dextran area per section was quantified using CellProfiler.
Vessel area and density were quantified by analysis of more than 5,000 vessels from each mouse. The vessel density and colocalization were analyzed automatically using CellProfiler. The computational modelling of Th1-skewed CD4+-TLs localization was performed with R programming language. To generate a simulated placement of CD4+-TLs for null hypothesis, two random anchor points were placed on the edge of the tumour section, and a random point located between the two anchor points was chosen. The number of simulated points was equal to the number of actual Th1-skewed CD4+-TLs in the section in each round of simulation. The mean Euclidean distances between simulated points to the nearest lectin+ vascular structure was measured, and mean distances generated from 10,000 rounds of simulation defined a distribution of mean distances one would observe for non-preferentially localized CD4+-TLs in relation to lectin+ tumour-associated vessels. This was then compared to the mean distance distribution between actual CD4+-TLs and lectin+ vessels on each tumour section.
Bioinformatic analysis
The RNA-seq reads were mapped and quantified using the STAR RNA-seq aligner (v2.4.1d)28, and RSEM software package (v1.2.28)29, respectively. Mouse genome and gene annotation (GRCm38.83) was supplied at the genome index generation step. ‘DEseq2’ R package30 was used to normalize the gene expression matrix.
Gene set enrichment analysis (GSEA)31 and KEGG Orthology-Based Annotation System (KOBAS) v2.032 (http://kobas.cbi.pku.edu.cn/) were used to perform the functional enrichment analysis as indicated in the appropriate figure legend and methods text. The enriched GO terms were visualized using REVIGO33 (http://revigo.irb.hr). The single sample GSEA projection (ssGSEA)34 was used to calculate separate enrichment scores for each pairing of a sample and gene set in Molecular Signatures Database (MSigDB). ssGSEA (v7) and GSEA (v15.2) analyses were performed using GenePattern (http://genepattern.broadinstitute.org/). GSEA was performed using 10,000 iterations collapsing probes to the highest value if necessary.
For paired analysis between PDXs and the original patient tumours, a pimonidazole-based hypoxia signature was obtained from a 32-gene set that correlates with higher pimonidazole staining in human tumours35. Bladder cancer data were obtained from GSE67312. Breast cancer data were combined from GSE32531 and GSE41685, and only orthotopic xenograft samples were included. Liver cancer data were obtained from GSE55828. Ovarian cancer data were obtained from GSE56920. For unpaired analysis of breast cancer PDXs, data from GSE34412 were used. In addition to the pimonidazole signature, 2 other hypoxia-related signatures were used: a 26-gene hypoxia signature that predicts benefit from hypoxia-modifying therapy36, and a 13-gene VEGF signature associated with metastasis15. In analyzing the correlation between CD4+-TL number with hypoxia signature and (ΣGPAGs ΣPPAGs) in different solid tumour types, the percentages of CD4+-TLs were estimated by CIBERSORT of the TCGA RNA-seq dataset. TCGA RNA-seq data were download from UCSC Cancer Genome Browser (https://genome-cancer.ucsc.edu/), and used as input for CIBERSORT to estimate the relative abundance of CD4+-TLs (naïve CD4+ T cells, memory resting CD4+ T cells and memory activated CD4+ T cells) among 22 leukocyte compositions. We used 1000 permutation and disabled quantile normalization.
Statistical methods
Sample sizes are denoted in figures or figure legends, and refer to number of animals unless otherwise noted. Data are generally expressed as mean ± s.e.m. In Box-Whisker plots, the upper and lower hinges correspond to the first and third quartiles, and the upper and lower whiskers are highest and lowest values that is within 1.5×IQR (interquartile range) of the hinge.
In most in vivo experiments, group sizes were determined based on the results of preliminary experiments and no statistical method was used to predetermine sample size. Experiments were repeated twice independently, and the data are combined and presented. Extended Data Fig. 3l is the only exception: one representative experiment from two is shown. For the dot plots of immunostaining results, smaller dots without an outline are values from individual fields (~ 0.4 mm2 fields at ×20), and circles that are outlined represent mean values taken over multiple fields from the same mouse, unless otherwise noted. The statistical tests were performed by comparing the individual animals. All in vitro experiments were repeated independently for three times (batches). The P values in these in vitro experiments were determined based on biological replicates (with technical replicates averaged within each biological replicate).
All samples that met proper experimental conditions were included in the analysis. Data were analyzed with Prism 7 software (GraphPad) or R programming language (v3.2.0). Statistical significance was determined using a two-tailed Mann–Whitney U test or Student’s t-test. F-test was conducted prior to Student’s t-test to compare the variance of two samples. Welch’s correction is applied to Student’s t-test if the null hypothesis of equality of variances is rejected. Comparison of tumour-growth curves were assessed by two-way analysis of variance (ANOVA). Survival analyses were evaluated by Kaplan-Meier curves and the log-rank (Mantel-Cox) test. P values lower than 0.05 were considered statistically significant.
Data availability
The RNA-seq data have been submitted to the Gene Expression Omnibus under accession number GSE89758. The source codes and data of bioinformatics analysis were deposited to https://github.com/lintian0616/vesselNormalization. All other source data are included in this article.
Extended Data
Extended Data Figure 1. Evaluation of GPAGs and PPAGs in hepatocellular carcinoma links T cell activity with tumour vessel normalization.
a). Schematic diagram for the bioinformatic analysis. NEC: Normal endothelial cells; TEC: Tumour-associated endothelial cells; MACS: magnetic-activated cell sorting. The numbers of patients are denoted in parentheses.
b). GPAG and PPAG signatures of NECs versus TECs. n= NEC-TEC pairs from 16 patients.
c). Comparison of GPAG and PPAG signatures in tumour with vascular invasion (n=40 patients) or without vascular invasion (n=95 patients).
d). Pathways in the non-TEC cells that positively correlate with higher (ΣGPAGs–ΣPPAGs) in the paired TECs.
e). GSEA mountain plot showing a strong association between (ΣGPAGs–ΣPPAGs) in the TEC and T cell activation signaling in the paired non-TEC cells.
Data are presented as means ± s.e.m for dot plots. Data are obtained from GSE51401 (b, d–e), GSE20017 (c). P values were calculated using two-tailed paired Student’s t-test (b), two tailed unpaired Mann–Whitney U test (c), or a permutation-based approach with Benjamini–Hochberg multiple testing correction (d,e).
Extended Data Figure 2. NG2+ cell-depleted mice display decreased immune infiltration in E0771 tumours.
a). Schematic of the experimental design.
b). Quantification of tumour-infiltrating NG2+ cells (NG2-CreERTM;tdRed, n=3; NG2-CreERTM; tdRed;iDTR, n=4).
c). Flow cytometry gating strategy for tumour-infiltrating leukocytes.
d). Flow cytometric quantification showing the decreased infiltration of TLs (CD3+CD4+ and CD3+CD8+), B cells (B220+), and dendritic cells (CD11b+CD11c+), but the percentage of total CD11b+ cells remains unchanged (WT, n=10; NG2-CreERTM;iDTR, n=5).
Data are presented as means ± s.e.m. P values are determined by two-tailed paired Student’s t-test (b, d).
Extended Data Figure 3. The effect of CD4+-TLs on promoting vessel normalization is cell number dependent.
a). Flow cytometric plots of CD3+ cells of 4T1 tumour harvested from WT and CD4KO mice. Five animals were examined in each group. Representative plots are shown.
b–g). Quantification of tumour vascular normalization markers including pericyte coverage (b), vessel density and vessel length (c), VE-cadherin expression (white arrow heads show vessels without VE-cadherin expression) (d), hypoxia measured by pimonidazole staining (e), lectin perfusion efficiency (f), and dextran leakage (g) (n=5/group; Scale bars, 50μm (d,f,g), 1mm (e)).
h). (Top) Schematic of the experimental design. (Bottom) The two doses of antibody deplete CD4+-TLs for 2 weeks. One point represents one mouse. Whole blood was collected for the flow cytometric analysis.
i). Dot plots showing that tumours were resected at similar size/weight
j). Representative whole animal bioluminescence images showing spontaneous 4T1 metastasis in αIgG or αCD4 treated mice. Dots representing mice with detected metastases are labeled with a red boundary.
k). Kaplan-Meier curves showing the metastasis-free frequency of 4T1 tumour-bearing mice treated with αIgG or αCD4. n=10 and 9 for αIgG and αCD4 groups, respectively (i–k).
l). (Top) Flow cytometry quantification of tumour-infiltrating CD4+-TLs across three murine tumour models (4T1, n=4; E0771, n=5; AT3, n=4). The tumours were resected at similar size/weight (around 1 gram) from the same batch of experiments. (Bottom) A table summarizing the results from vessel normalization assays. The number indicates the fold change increased (red) or decreased (green) in WT mice compared to CD4KO mice. In E0771 model, RNA-seq reveals an increase in extracellular matrix and adhesion molecule gene expression in WT mice over CD4KO mice.
m–p). Quantification of tumour vascular normalization markers (n=5/group; Scale bars, 50μm (m,o,p); n=10/group; Scale bars,1mm (n)).
q). Scatter plot showing the Cd4 and Ifng gene expression levels of different p53−/− murine breast tumour models. The Cd8 gene expression and ER status are denoted by the colors of the dots and dot outlines, respectively. Two models chosen for hypoxia measurement are highlighted.
r). Hypoxia quantification for T1 and T11 tumours in WT and CD4KO background as measured by pimonidazole staining (T1: n=5/group; T11: WT, n=5; CD4KO, n=8; Scale bars,1mm).
Data are presented as means ± s.e.m. Animal numbers used in (i–k) are denoted in (k). P values are determined by two-tailed unpaired Student’s t-test (b–g,i,m–p,r), Fisher’s exact test (j) and Log-Rank test (k).
Extended Data Figure 4. Comparison of pericyte coverage of normal tissues and wound tissues in different T cell deficient backgrounds.
a). Quantification of pericyte coverage of blood vessels in the mammary gland. Since NG2 is also expressed by adipocytes, PDGFRβ was used as the marker for pericyte (n=4/group; Scale bars, 50μm; inset, 20μm).
b). Representative fluorescent images and flow cytometric quantification of pericyte coverage of lung (n=5/group; Scale bars, 50μm).
c). Quantification of pericyte coverage of normal skin tissues and skin wound tissues (WT, n=10; CD4KO, n=10; CD8KO, n=9; Scale bars, 50μm). Different immunodeficient backgrounds are denoted by the colors of the dots, and the strain information is denoted by the colors of point outlines. The points with arrows are the represented images of wound tissues in the left.
Data are presented as means ± s.e.m. P values were calculated using non-parametric one-way ANOVA (Kruskal–Wallis) test (b–c). n.s., not significant.
Extended Data Figure 5. Immune profiling on M-IIKO mice shows that CD4+-TL cell activation is inhibited.
a,b). Flow cytometry quantification validating that M-IIKO mice have decreased MHC-II expression in tumour-infiltrating immune cells (CD45+), including macrophages (Mϕ, CD45+CD11b+Ly6G F4/80+), dendritic cells (DC, CD45+CD11b+Ly6G−F4/80−CD11c+), and B cells (CD45+B220+) (CTRL: n=10; M-IIKO: n=11).
c). Flow cytometry gating of suspension cells dissociated from thymus, characterized as CD45+EpCAM−immune cells and CD45−EpCAM+ epithelial cells.
d,e). Quantification of MHC-II expression of thymus showing that MHC-II expression is inhibited in immune cells but preserved in epithelial cells in M-IIKO mice (CTRL: n=7; M-IIKO: n=6).
f). Quantification of different types of tumour-infiltrating stroma cells (n=10/group).
g). Quantification of MHC-II expression in different cell types (CTRL: n=10; Tie2Cre;H2Ab+/floxP: n=5; M-IIKO: n=11).
h). Quantification of T cells in spleens from 5 – 6 week-old female mice showing the number of T cells is independent of MHC-II expression on Tie2Cre+ cells (CTRL: n=7; M-IIKO: n=6).
i). Quantification of activated CD4+-TLs and effector CD4+-TLs from tumours of similar sizes. (activated CD4+-TL: CD45+CD3+CD4+CD25+FoxP3− Treg: CD45+CD3+CD4+CD25+FoxP3+; Effector memory cell: CD44+CD62L− Naïve CD4+-TL: CD44−CD62L+) (n=11/group).
j). The percentages of CD4+-TL activation markers in spleen showing a similar pattern as in tumour (i) (CTRL: n=7; M-IIKO: n=6).
k). Quantification of different E0771 tumour-infiltrating T helper cells (IFNγ+ Th1, IL4+ Th2 and IL17A+ Th17) (n=11/group).
l). Quantification of E0771 tumour-infiltrating CD4+-TL cells, macrophage, dendritic cells, B cells and neutrophils (CD45+CD11b+Ly6Ghigh) (n=11/group).
Data are presented as means ± s.e.m. The genetic backgrounds of mice are denoted with different colors shown on the right of (l). WT, Tie2Cre and H2AbfloxP/floxP were combined as CTRL group. P values were calculated using two-tailed unpaired Student’s t-test (a–b, d–f, h–k) or two-tailed unpaired Mann–Whitney U test (l). n.s., not significant.
Extended Data Figure 6. Inhibition of MHC-II-mediated CD4+-TL activation phenocopies the depletion of CD4+-TL or NG2+ pericytes with regard to tumour VN and hypoxia.
a). Immunofluorescence quantification of percentage endothelial cells (CD31+/MECA-32+) attached by pericytes (NG2+) (n=4/group), and flow cytometry quantification of endothelial cell to pericytes ratio. (CTRL: n=10; M-IIKO: n=11).
b,c). Quantification of tumour-vasculature leakiness as measured by dextran (WT: n=5; M-IIKO: n=4; CD4KO: n=5; Scale bars, 50μm) and Evans Blue (WT: n=11; M-IIKO: n=8), respectively.
d). Quantification of perfusion efficiency with lectin (WT: n=5; M-IIKO: n=4; CD4KO: n=5; Scale bars, 50μm).
e,f). Quantification of tumour hypoxia with HIF1α (WT: n=5; M-IIKO: n=4; CD4KO: n=4; PeriDel, n=3; Scale bars, 50μm) and pimonidazole (WT: n=5; M-IIKO: n=4; CD4KO: n=5; PeriDel, n=8; Scale bars, 1mm).
Data are presented as means ± s.e.m. P values were calculated using two-tailed unpaired Student’s t-test (a–f).
Extended Data Figure 7. RNA-seq further supports that CD4+-TLs promote tumour vessel normalization.
a). RNA-seq experiment design. FACS: fluorescence-activated cell sorting; MATQ-seq: multiple annealing and tailing based quantitative sequencing.
b). t-Distributed Stochastic Neighbor Embedding (t-SNE) analysis of tumour-associated endothelial cells based on RNA-seq profiles of different transgenic mice. Different genetic backgrounds are denoted with different colors.
c). ssGSEA projection of RNA-seq data validated the down-regulation of Immune Effector Process pathway (GO:0002697) in CD4+-TL deficient group.
d). Analyses on RNA-seq data validated the down-regulation of GPAGs and up-regulation of PPAGs in CD4+-TL deficient group.
e,f). Gene expression analysis of Vegfa and Angpt1/Angpt2 in tumour-associated CD31+ cells from different genetic backgrounds of mice.
g). GSEA mountain plots showing increased biological activities in the tumour-associated vessel isolated from CD4+-TL competent backgrounds.
h). A heatmap summarizing the top 20 genes upregulated in tumour-associated CD31+ cells isolated from CD4+-TL competent genetic background, compared to that from CD4+-TL deficient background.
i). Analysis of sphingolipid metabolic process signature (GO:0006665) for tumour-associated CD31+ cells from different genetic background.
j). Sphingolipid Metabolite Profiling of sphingolipid associated metabolites on whole E0771 tumour lysates from mice of different T cell deficient backgrounds. (WT, n=5; CD4KO, n=5; CD8KO, n=6; TCRKO, n=5). ASMase: acid sphingomyelinase; AC: acid ceramidase; SPHK: sphingosine kinase; P-choline: phosphatidylcholine; FA: fatty acid.
All genotypes are divided into two groups based on CD4 status. CD4KO, TCRKO and conditional KO of H2Ab are deficient of CD4+-TL, and the others are not. The two groups have n= 9 and 10 animals, respectively. Data are presented as means ± s.e.m. Animal numbers used (b–i) are denoted in (b). P values were calculated using two-tailed unpaired Mann–Whitney U test (c–f, i), two-tailed one-way analysis of variance (ANOVA) (j) or permutation (g). n.s., not significant.
Extended Data Figure 8. Spatial relationships between activated CD4+-TLs and lectin+ tumour-associated endothelial cells.
a). Schematic of the experimental design.
b). A table showing the counts of naïve CD4+-TLs (tdRed+CFSE+) and activated CD4+-TLs (tdRed+) in whole cross sectional area of five animals (n=5).
c). The violin plots showing the kernel probability density of the distances of naïve and activated CD4+-TLs to the nearest lectin+ endothelial cells. Smaller dots without an outline are distances of individual CD4+-TL, and larger circles that are outlined represent mean distances taken over all CD4+-TLs in the section from the same mouse. CD4+-TLs from the same mouse are denoted with the same color. The p value was calculated using one sample Student’s t-test by comparing the mean distances of activated CD4+-TLs from individual mouse with the mean distance of all naïve CD4+-TLs (dashed horizontal line) (n=5 mice).
d). (Top) Mosaic scanning images of whole tumour sections. Representative areas are magnified and naïve CD4+-TLs (yellow) are pinpointed with arrowhead. (Bottom) Solid lines show the distribution of distances between CD4+-TLs and lectin+ endothelial cells in whole tumour sections. The mean distances observed are shown as a vertical straight line. For comparison, dashed lines show the probability distribution of mean distances between endothelial cells and computer-simulated random dots. P values were calculated using a permutation based approach. More detailed information about image simulation is described in Method section.
Extended Data Figure 9. ICB therapy promotes Th1 differentiation of CD4+-TLs and induces further immune reprogramming.
a). Schematic of the experimental design.
b). ICB leads to CD4+-TL dependent tumour growth inhibition, measured by tumour weight at Day 15 post E0771 injection.
c,d).Total number of immune cells (c) and T cell (d) in tumours from different groups. Although the number of pan tumour-infiltrating immune cells (CD45+) is not changed, the number of CD4+-TLs increased after immune checkpoint blockade therapy.
e). A heatmap summarizing changes to tumour-infiltrating immune components after ICB therapy. The number of different immune cells (rows) is shown for each tumour (columns) after control or checkpoint blockade treatment. The weight of each tumour is shown (top panel). Row-side annotations show p values comparing between CD8KO (αIgG) and CD8KO (αPD1αCTLA4) groups (far left column), and between CD8KO (αPD1αCTLA4) and TCRKO (αPD1αCTLA4) (far right column) (EM T: effector memory T cells).
f). Quantification of different subsets among CD45+CD11b+ cells showing the effect of ICB on innate immune microenvironment (Eosinophil: CD45+CD11b+SiglecF+).
g,h). Quantification of the percentage of Tregs among total CD4+-TLs, and the ratio of effector memory CD4+-TLs to naïve CD4+-TLs after ICB in CD8 KO mice.
i). Quantification of the percentage of different CD4+ T helper cells.
j). Percentage of IFNγ+ cells in CD4+ or CD4− cells among all the CD45+ tumour-associated immune cells, indicating CD4+-TLs make up the majority of IFNγ+ cells.
Data are presented as means ± s.e.m. Animal numbers used in (b–j) are denoted in (a). P values were calculated using two-tailed unpaired (b–i) or paired (j) Student’s t-test.
Extended Data Figure 10. Molecular and cellular mechanisms that contribute to tumour immunostimulatory reprogramming positive feedback loop.
a,b). Quantitative RT-PCR analysis showing the effect of IFNγ and sCD40L on the mRNA levels of adhesion molecules, VEGFA (a), and T cell attractant chemokines (b). The experiments were repeated independently for three times (batches) with technical duplicates in each time.
c). Schematic of the experimental design and hypothetical model.
d). Tumours resected at Day12 – 13 post E0771 injection have similar size/weight, and the effect of Th1 adoptive transfer on vessel normalization as measured by the CD31+ endothelial cells to NG2+ pericytes ratio.
e). Flow cytometry quantification CD45.1+ adoptive transferred Th1 cells, and CD45.2+ host immune cells.
f). Characterization and quantification of CD45.2+ host immune cells showing that Th1-mediated immune infiltration is partially dependent on pericyte coverage.
g). Effect of Th1 adoptive transfer and pericyte depletion on CD11b+Ly6G+ immune cells demonstrating different pattern with other tumour-infiltrating immune cells as from (f).
h). Schematic summary of CD4+-TL-mediated vessel normalization, and subsequent formation of positive feedback loop through cell-cell interaction, cytokine production and increased pericyte coverage. Checkpoint blockade therapy and antigen presentation enhance Th1-skewed CD4+-TL activation and promote the vessel normalization/immunostimulatory reprogramming positive feedback loop.
Data are presented as means ± s.e.m. Animal numbers used in (d–g) are denoted in (c). P values were calculated using two-tailed unpaired Student’s t-test based on biological replicates (a,b,d–g). Technical replicates are averaged within each biological replicate (a,b).
Supplementary Material
Acknowledgments
We thank D. Weiss for critically editing the manuscript, D. Liang for advice on Th1-skewed differentiation of CD4+-TL; S. Donepudi and F. Jin for their technical support on metabolite profiling. X. H.-F.Z. is supported by Breast Cancer Research Foundation, NCI CA151293, DoD W81XWH-16-1-0073, SGK CCR14298445, and McNair Medical Institute. A.S. and N.P. were supported by the CPRIT Core Facility Support Award RP120092, NCI/2P30CA125123-09. Flow cytometry and cell sorting was performed at the Cytometry and Cell Sorting Core supported by NIH P30 AI036211, P30 CA125123, and S10 RR024574. Mosaic scanning was supported by a grant from the NIH 1S10OD016167.
Footnotes
Author Contributions
L.T. and X.H.-F.Z. developed the concepts, analyzed data and designed the experiments. L.T. performed the experiments. I.S.K, T.W. sorted TECs for RNA-seq; K.S., A.G., H.W. performed MATQ-seq; N.P. performed LC-MS/MS; L.E.D., X.Z. prepared PDX; F.S. assisted epifluorescence imaging. T.L.P., S.A.M., A.S., M.A.M., W.K.D., C.Z., and M.T.L. developed methodology and interpreted the data. X.H.-F.Z., L.T., H.C.L., and A.G. wrote the paper. X.H.-F.Z. supervised the project.
Competing financial interests
The authors declare no competing financial interests.
References
- 1.Ebos JML, et al. Accelerated metastasis after short-term treatment with a potent inhibitor of tumor angiogenesis. Cancer Cell. 2009;15:232–239. doi: 10.1016/j.ccr.2009.01.021. [DOI] [PMC free article] [PubMed] [Google Scholar]
- 2.Paez-Ribes M, et al. Antiangiogenic therapy elicits malignant progression of tumors to increased local invasion and distant metastasis. Cancer Cell. 2009;15:220–231. doi: 10.1016/j.ccr.2009.01.027. [DOI] [PMC free article] [PubMed] [Google Scholar]
- 3.Goel S, Wong AHK, Jain RK. Vascular normalization as a therapeutic strategy for malignant and nonmalignant disease. Cold Spring Harb Perspect Med. 2012;2:a006486. doi: 10.1101/cshperspect.a006486. [DOI] [PMC free article] [PubMed] [Google Scholar]
- 4.Hamzah J, et al. Vascular normalization in Rgs5-deficient tumours promotes immune destruction. Nature. 2008;453:410–414. doi: 10.1038/nature06868. [DOI] [PubMed] [Google Scholar]
- 5.Curtis C, et al. The genomic and transcriptomic architecture of 2,000 breast tumours reveals novel subgroups. Nature. 2012;486:346–352. doi: 10.1038/nature10983. [DOI] [PMC free article] [PubMed] [Google Scholar]
- 6.Armulik A, Genove G, Betsholtz C. Pericytes: developmental, physiological, and pathological perspectives, problems, and promises. Dev Cell. 2011;21:193–215. doi: 10.1016/j.devcel.2011.07.001. [DOI] [PubMed] [Google Scholar]
- 7.Bergers G, Benjamin LE. Tumorigenesis and the angiogenic switch. Nat Rev Cancer. 2003;3:401–410. doi: 10.1038/nrc1093. [DOI] [PubMed] [Google Scholar]
- 8.Herschkowitz JI, et al. Comparative oncogenomics identifies breast tumors enriched in functional tumor-initiating cells. Proc Natl Acad Sci U S A. 2012;109:2778–2783. doi: 10.1073/pnas.1018862108. [DOI] [PMC free article] [PubMed] [Google Scholar]
- 9.Arwert EN, Hoste E, Watt FM. Epithelial stem cells, wound healing and cancer. Nat Rev Cancer. 2012;12:170–180. doi: 10.1038/nrc3217. [DOI] [PubMed] [Google Scholar]
- 10.Jain RK. Molecular regulation of vessel maturation. Nat Med. 2003;9:685–693. doi: 10.1038/nm0603-685. [DOI] [PubMed] [Google Scholar]
- 11.Sharma P, Allison JP. Immune Checkpoint Targeting in Cancer Therapy: Toward Combination Strategies with Curative Potential. Cell. 2015;161:205–214. doi: 10.1016/j.cell.2015.03.030. [DOI] [PMC free article] [PubMed] [Google Scholar]
- 12.Pober JS, Sessa WC. Evolving functions of endothelial cells in inflammation. Nat Rev Immunol. 2007;7:803–815. doi: 10.1038/nri2171. [DOI] [PubMed] [Google Scholar]
- 13.Bromley SK, Mempel TR, Luster AD. Orchestrating the orchestrators: chemokines in control of T cell traffic. Nat Immunol. 2008;9:970–980. doi: 10.1038/ni.f.213. [DOI] [PubMed] [Google Scholar]
- 14.Bonacchi A, et al. Signal transduction by the chemokine receptor CXCR3: activation of Ras/ERK, Src, and phosphatidylinositol 3-kinase/Akt controls cell migration and proliferation in human vascular pericytes. J Biol Chem. 2001;276:9945–9954. doi: 10.1074/jbc.M010303200. [DOI] [PubMed] [Google Scholar]
- 15.Hu Z, et al. A compact VEGF signature associated with distant metastases and poor outcomes. BMC Med. 2009;7:9. doi: 10.1186/1741-7015-7-9. [DOI] [PMC free article] [PubMed] [Google Scholar]
- 16.Newman AM, et al. Robust enumeration of cell subsets from tissue expression profiles. Nat Meth. 2015;12:453–457. doi: 10.1038/nmeth.3337. [DOI] [PMC free article] [PubMed] [Google Scholar]
- 17.Freeman MR, et al. Peripheral blood T lymphocytes and lymphocytes infiltrating human cancers express vascular endothelial growth factor: a potential role for T cells in angiogenesis. Cancer Res. 1995;55:4140–4145. [PubMed] [Google Scholar]
- 18.Qin Z, Blankenstein T. CD4+ T cell--mediated tumor rejection involves inhibition of angiogenesis that is dependent on IFN gamma receptor expression by nonhematopoietic cells. Immunity. 2000;12:677–686. doi: 10.1016/s1074-7613(00)80218-6. [DOI] [PubMed] [Google Scholar]
- 19.Beatty G, Paterson Y. IFN-gamma-dependent inhibition of tumor angiogenesis by tumor-infiltrating CD4+ T cells requires tumor responsiveness to IFN-gamma. J Immunol. 2001;166:2276–2282. doi: 10.4049/jimmunol.166.4.2276. [DOI] [PubMed] [Google Scholar]
- 20.Gao J, et al. Loss of IFN-gamma Pathway Genes in Tumor Cells as a Mechanism of Resistance to Anti-CTLA-4 Therapy. Cell. 2016;167:397–404.e9. doi: 10.1016/j.cell.2016.08.069. [DOI] [PMC free article] [PubMed] [Google Scholar]
- 21.Carmeliet P, Jain RK. Molecular mechanisms and clinical applications of angiogenesis. Nature. 2011;473:298–307. doi: 10.1038/nature10144. [DOI] [PMC free article] [PubMed] [Google Scholar]
- 22.Zhang X, et al. A renewable tissue resource of phenotypically stable, biologically and ethnically diverse, patient-derived human breast cancer xenograft models. Cancer Res. 2013;73:4885–4897. doi: 10.1158/0008-5472.CAN-12-4081. [DOI] [PMC free article] [PubMed] [Google Scholar]
- 23.Xing Y, Hogquist KA. Isolation, identification, and purification of murine thymic epithelial cells. J Vis Exp. 2014:e51780. doi: 10.3791/51780. [DOI] [PMC free article] [PubMed] [Google Scholar]
- 24.Quah BJC, Parish CR. The use of carboxyfluorescein diacetate succinimidyl ester (CFSE) to monitor lymphocyte proliferation. J Vis Exp. 2010 doi: 10.3791/2259. [DOI] [PMC free article] [PubMed] [Google Scholar]
- 25.Radu M, Chernoff J. An in vivo assay to test blood vessel permeability. J Vis Exp. 2013:e50062. doi: 10.3791/50062. [DOI] [PMC free article] [PubMed] [Google Scholar]
- 26.Garcia AN, Vogel SM, Komarova YA, Malik AB. Permeability of endothelial barrier: cell culture and in vivo models. Methods Mol Biol. 2011;763:333–354. doi: 10.1007/978-1-61779-191-8_23. [DOI] [PubMed] [Google Scholar]
- 27.Sheng K, Cao W, Niu Y, Deng Q, Zong C. Effective detection of variation in single-cell transcriptomes using MATQ-seq. Nat Methods. 2017 doi: 10.1038/nmeth.4145. [DOI] [PubMed] [Google Scholar]
- 28.Dobin A, et al. STAR: ultrafast universal RNA-seq aligner. Bioinformatics. 2013;29:15–21. doi: 10.1093/bioinformatics/bts635. [DOI] [PMC free article] [PubMed] [Google Scholar]
- 29.Li B, Dewey CN. RSEM: accurate transcript quantification from RNA-Seq data with or without a reference genome. BMC Bioinformatics. 2011;12:323. doi: 10.1186/1471-2105-12-323. [DOI] [PMC free article] [PubMed] [Google Scholar]
- 30.Love MI, Huber W, Anders S. Moderated estimation of fold change and dispersion for RNA-seq data with DESeq2. Genome Biol. 2014;15:550. doi: 10.1186/s13059-014-0550-8. [DOI] [PMC free article] [PubMed] [Google Scholar]
- 31.Subramanian A, et al. Gene set enrichment analysis: a knowledge-based approach for interpreting genome-wide expression profiles. Proc Natl Acad Sci U S A. 2005;102:15545–15550. doi: 10.1073/pnas.0506580102. [DOI] [PMC free article] [PubMed] [Google Scholar]
- 32.Xie C, et al. KOBAS 2.0: a web server for annotation and identification of enriched pathways and diseases. Nucleic Acids Res. 2011;39:W316–22. doi: 10.1093/nar/gkr483. [DOI] [PMC free article] [PubMed] [Google Scholar]
- 33.Supek F, Bosnjak M, Skunca N, Smuc T. REVIGO summarizes and visualizes long lists of gene ontology terms. PLoS One. 2011;6:e21800. doi: 10.1371/journal.pone.0021800. [DOI] [PMC free article] [PubMed] [Google Scholar]
- 34.Barbie DA, et al. Systematic RNA interference reveals that oncogenic KRAS-driven cancers require TBK1. Nature. 2009;462:108–112. doi: 10.1038/nature08460. [DOI] [PMC free article] [PubMed] [Google Scholar]
- 35.Ragnum HB, et al. The tumour hypoxia marker pimonidazole reflects a transcriptional programme associated with aggressive prostate cancer. Br J Cancer. 2015;112:382–390. doi: 10.1038/bjc.2014.604. [DOI] [PMC free article] [PubMed] [Google Scholar]
- 36.Eustace A, et al. A 26-gene hypoxia signature predicts benefit from hypoxia-modifying therapy in laryngeal cancer but not bladder cancer. Clin Cancer Res. 2013;19:4879–4888. doi: 10.1158/1078-0432.CCR-13-0542. [DOI] [PMC free article] [PubMed] [Google Scholar]
Associated Data
This section collects any data citations, data availability statements, or supplementary materials included in this article.
Supplementary Materials
Data Availability Statement
The RNA-seq data have been submitted to the Gene Expression Omnibus under accession number GSE89758. The source codes and data of bioinformatics analysis were deposited to https://github.com/lintian0616/vesselNormalization. All other source data are included in this article.


