

Abstract
The outcomes of evolution are determined by a stochastic dynamical process that governs how mutations arise and spread through a population. Here, we analyze the dynamics of molecular evolution in twelve experimental populations of Escherichia coli, using whole-genome metagenomic sequencing at 500-generation intervals through 60,000 generations. Despite a declining rate of fitness gain, molecular evolution continues to be characterized by signatures of rapid adaptation, with multiple beneficial variants simultaneously competing for dominance in each population. Interactions between ecological and evolutionary processes play an important role, as long-term quasi-stable coexistence arises spontaneously in most populations, and evolution continues within each clade. We also present new evidence that the targets of natural selection change over time, as epistasis and historical contingency alter the strength of selection on different genes. Together, these results show that long-term adaptation to a constant environment can be a more complex and dynamic process than is often assumed.
Evolutionary adaptation is driven by the accumulation of mutations, but the temporal dynamics of this process are difficult to observe directly. Recently, time-resolved sequencing of microbial evolution experiments1–6, viral and bacterial infections7–9, and cancers10 has begun to illuminate this process. These studies reveal complex dynamics, characterized by rapid adaptation, competition between beneficial mutations, diminishing-returns epistasis, and extensive genetic parallelism. These forces alter patterns of polymorphism11 and influence which mutations ultimately fix12–15. However, it is unclear whether these dynamics are general or, instead, reflect the short timescales and novel environmental conditions of previous studies.
To address this question, we turned to an experiment with the longest frozen “fossil record”: the E. coli long-term evolution experiment (the “LTEE”)16. The 12 LTEE populations have been serially propagated in the same medium for >60,000 generations, with samples preserved every 500 generations (Supplementary Information 1). Previous work has shown that the competitive fitness of each population continues to increase through 60,000 generations, despite a declining rate of improvement17,18. Genome sequences of evolved clones have shown that these fitness gains are accompanied by a steady accumulation of mutations3,4. Parallel genetic changes across replicate populations suggest that there is a common pool of adaptive mutations that has yet to be exhausted in any single population4.
Together, these earlier findings show that the LTEE populations have not yet reached a fitness peak, even after tens of thousands of generations in the same environment. However, the existing data provide only limited information about the population genetic processes that drive these changes. Does the supply of adaptive mutations eventually diminish enough that evolution proceeds via discrete selective sweeps? Are the populations still approaching the same fitness peak as they accumulate mutations from a common pool? Or do more complicated dynamics arise that require more complex models? These questions require more finely resolved information about the genetic diversity within each population through time, to analyze when and in what order the successful mutations occur, the dynamics by which they spread through a population, and what other competing mutations arose that were ultimately eliminated.
Reconstructing the molecular fossil record
To measure the dynamics of molecular evolution, we sequenced mixed-population samples taken at 500-generation intervals across 60,000 generations of evolution in each of the 12 LTEE populations (Supplementary Information 3). This yielded a total of 1431 samples with a median coverage of ~50× (Supplementary Table 1). To distinguish mutations from sequencing errors, we developed a pipeline that leverages the temporal correlations expected in a true mutation trajectory (Supplementary Information 4). This approach allows us to identify a subset of the mutations that reached ~10% frequency in at least 2 sampled timepoints, and to track the frequency of the derived alleles through the rest of the timecourse. Our pipeline identifies both point mutations and indels, including many events mediated by insertion sequence (IS) elements (Supplementary Information 4).
Figure 1 shows the allele frequency trajectories of all mutations identified in each population. Although previous work has shown that fitness gains across the replicate populations are largely similar to one another17,18 (Figure 2a), Figure 1 reveals a wide range of dynamics at the genetic level.
Figure 1. The dynamics of molecular evolution.

Allele frequency trajectories of all de novo mutations detected in the 12 LTEE populations.
Figure 2. Rates of molecular evolution.
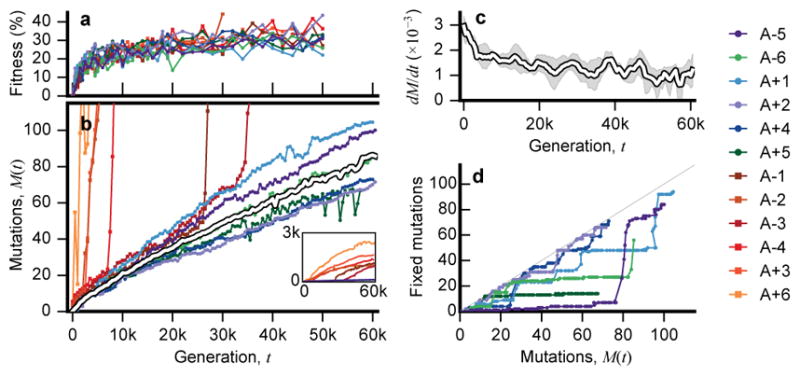
a, Competitive fitness through time (Supplementary Information 2). b, Number of mutations in each population as a function of time, measured by total derived allele frequency, Mp(t). The average of the nonmutator populations is shown in white. c, Average rate of change of Mp(t) for nonmutators in 5,000-generation sliding windows. Shaded region depicts a 95% confidence interval obtained by bootstrapping replicate populations 10,000 times. d, Number of fixed mutations versus Mp(t) in nonmutators.
We analyzed the rate at which mutations accumulate through time by calculating the total derived allele frequency, Mp(t)=Σ fp,m(t), for all mutations m in population p at time t (Figure 2b; Supplementary Information 5.1). This quantity approximates the expected number of mutations in a randomly sampled individual, neglecting mutations that never rise above our detection threshold. Consistent with earlier work3,4, Figure 2 shows that the pace of molecular evolution remains rapid throughout the experiment, even as the rate of fitness improvement declines17,18.
The high temporal resolution of the data reveals striking differences in the rate of molecular evolution over time and across replicate populations. Six populations evolved a mutator phenotype4,19, producing a sudden jump in total derived allele frequency (Fig. 2b). In some of these mutator populations, the rate of molecular evolution later declines (Fig. 2 inset), consistent with evidence from sequenced clones4. In Ara–1, previous work has shown that this deceleration is driven by “antimutator” alleles that arise after the fixation of the initial mutator20. Our results suggest a similar process also occurs in other populations.
In contrast to the mutator lines, the six “nonmutator” populations accumulate mutations at a steadier pace. Their average rate of molecular evolution does decline modestly over time, decreasing from ~20 mutations in the first 10,000 generations to ~10 mutations in the last 10,000 (Fig. 2c). There are also systematic differences between populations that persist over 10,000-generation intervals, suggesting they acquired mutations at slightly different rates (Extended Data Fig. 1).
The rates of mutation accumulation in nonmutator lineages are comparable to previous estimates of bacterial mutation rates21. However, they are incompatible with the timescale of neutral evolution. With an effective population size of Ne~107, new mutations would require Δt ~ 0.1Ne ~ 106 generations to reach the 10% detection threshold by genetic drift alone22. Thus, the mutations in Fig. 1 must have reached observable frequencies through the direct or indirect action of natural selection.
Emergence of quasi-stable coexistence
Once a mutation reaches detectable frequencies, the shape of its allele frequency trajectory contains information about selective forces. We find that the trajectories in Fig. 1 are inconsistent with a “periodic selection” model in which individual driver mutations fix in a sequence of discrete selective sweeps. This model predicts that driver mutations (with any nearly-neutral hitchhikers) should quickly and deterministically fix after reaching observable frequency, which greatly exceeds the drift barrier 1/Nes. By contrast, many mutations in Fig. 1 persist at intermediate frequencies for long periods, often undergoing reversals in frequency that sometimes result in extinction.
Part of this complexity is driven by clonal interference. When beneficial mutations are common, mutations that would otherwise drive selective sweeps can be outcompeted by other lineages carrying superior beneficial mutations23. Further beneficial mutations can draw out this battle, resulting in allele-frequency trajectories with multiple inflection points12,24,25. Yet models of clonal interference predict that one lineage must eventually win, and so on long timescales the number of fixed mutations should grow at the same rate as the total allele frequency Mp(t).
To test this expectation, we developed a hidden Markov model (HMM; Supplementary Information 5.2) to estimate the “fixation time” of each mutation from its allele frequency trajectory, allowing us to estimate the number of fixed mutations through time (Figure 2d). The number of fixed mutations closely tracks Mp(t) in some populations (e.g. Ara+2 and Ara+4), but there is a marked deficit of fixations in others (e.g. Ara–6). Instead of fixing, the “missing” mutations segregate into at least two intermediate-frequency clades that coexist for long periods (Fig. 1).
To investigate these clades, we extended our mutation-trajectory HMM to assign mutations to basal, major, or minor clades, and to infer their frequencies through time (Fig. 3a; Supplementary Information 5.3). This approach leverages correlations in the trajectories of many independent mutations, while accounting for noise in each sample. The results confirm that long-lived clades are common in the LTEE. Figure 3b shows that 9 of the 12 populations have clades that coexist for >10,000 generations, often persisting through generation 60,000. By partitioning the mutations into clades (Fig. 3a), we also see that fixations continue to accumulate within each clade, even when population-wide fixation events have ceased.
Figure 3. Long-term coexistence of competing clades.

a, Output of the clade-aware HMM for population Ara–6. Major and minor clades (solid black lines) are defined by the clade frequencies at the final timepoint, while the basal clade contains mutations shared by major and minor clades. Colored lines indicate mutations within the corresponding clade in each panel; all other mutations are shown in grey. b, Estimated clade frequencies for all 12 populations (major clade in purple, minor clade in pink). Individual mutations are shown in grey.
This striking separation of timescales between inter- and intra-clade fixations cannot be explained by clonal interference26. Instead, long-term coexistence is likely maintained by negative frequency-dependent selection, as has been demonstrated in Ara–227,28. It is not known whether these additional examples of coexistence revealed by our data involve the same glucose/acetate cross-feeding interaction seen in Ara–2, or whether these populations have exploited other opportunities for ecological diversification.
Regardless of the mechanism of coexistence, the metagenomic data show that the balance between the two clades does not remain constant over long timescales. Instead, their relative abundance can shift by at least ~10-fold during their coexistence. The timing and magnitudes of these shifts vary from population to population; they could reflect ongoing selection on the mechanism of coexistence or a general coupling between the ecologically divergent phenotypes and ordinary fitness gains28–30. Further work is needed to distinguish between these scenarios.
Dynamics and fates of new mutations
Most models of molecular evolution do not account for frequency-dependent selection, which complicates efforts to understand the evolutionary dynamics using population-wide data. To overcome this problem, we focused on the dynamics within each clade.
First, using the clade-aware HMM, we estimated the appearance and fixation times of all mutations that fixed in basal or majority clades in the nonmutator populations (Supplementary Information 5.3.1). These are upper and lower bounds, respectively, as they exclude time outside the observable frequency range. From these measurements, we calculated the number of fixed mutations in the basal or majority clade through time (Fig. 4a). These data show that within-clade fixations continue at a steady pace, consistent with the Mp(t) trajectories in Fig. 2b. Although the average rate of fixations declines only modestly during the experiment, there is noticeable temporal variability as mutations often fix in “cohorts” of multiple linked mutations. These cohorts have been observed previously1,29 and are expected in models of clonal interference31,32. However, they could also reflect transiently stable frequency-dependent interactions, as previously observed in Ara–129.
Figure 4. Evolutionary dynamics within clades.
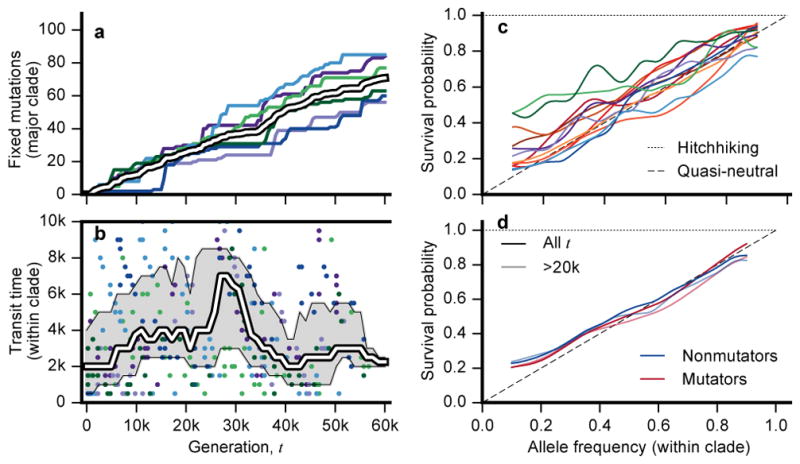
a, Number of mutations fixed within the basal or major clade through time in the nonmutator populations. Colors are the same as Fig. 2, and the ensemble average is in white. b, The transit time of each mutation in (a) as a function of its appearance time. White line shows the median across the six populations in non-overlapping 5-percentile windows, and the interquartile range of each window is in grey. c, Fixation probability as a function of current mutation frequency within its parent clade, along with expectations under quasi-neutral and hitchhiking models. Fixation probabilities are estimated using sliding frequency windows (Supplementary Information 5.3.2). d, Pooled version of (c) for mutator and nonmutator populations. Lighter lines include only timepoints from generation 20,000 and later.
The difference between the appearance and fixation times of each successful mutation (the “transit time”) is a proxy for the strength of selection acting on a lineage. Despite the declining rate of fitness gain (Fig. 2a), we observe a broad distribution of transit times throughout the experiment (Fig. 4b). Even after 50,000 generations, some mutations appear to fix nearly as rapidly as those that occurred in the first 5,000 generations of evolution. This observation suggests that fitness differences between cohorts of mutations can remain high, with selection coefficients at least ~2log|1-Δf|/Δt~1%, even after many beneficial mutations have fixed.
In addition to mutations that fix, many others reach substantial frequencies before going extinct, consistent with clonal interference. To quantify this effect, we estimated the fixation probability of a mutation as a function of its (within-clade) frequency (Fig. 4c,d). As explained above, a mutation can only reach observable frequencies if it is linked to a beneficial driver mutation or is a driver itself. Thus, without clonal interference, all observed mutations should fix in their clade with probability ~1. By contrast, the fixation probabilities in Figs. 4c and 4d are substantially lower, even when restricted to mutations that arose in later generations. Instead, the observed fixation probabilities are more consistent with the quasi-neutral limit, pfix(f)~f, which arises when clonal interference is strong13,25 (Supplementary Information 5.3.2). This quasi-neutrality implies that adaptation in the LTEE is not mutation-limited; instead, clonal interference and hitchhiking remain important even after tens of thousands of generations in the same environment.
Parallelism at the genetic level
Allele frequency trajectories provide evidence for pervasive adaptation in the LTEE, but the dynamics alone provide limited information about which mutations are beneficial drivers and which are neutral or deleterious passengers. However, we can leverage the identities of mutations to learn about the targets of selection, and to ask whether these targets change through time or differ across populations.
Figs. 5a,b show the cumulative distribution of all detected variant types through time. In the mutator populations, this distribution reflects the mutational biases and appearance times of mutator phenotypes. By contrast, we see few temporal changes in the types of mutations in nonmutators, apart from a slight early enrichment of missense mutations (Fig. 5c). Consistent with previous studies3,4, we observe an excess of nonsynonymous relative to synonymous mutations in nonmutators (dN/dS >1; Extended Data Fig. 2), indicating that many observed mutations are adaptive (even those driven extinct by clonal interference). By contrast, dN/dS ≲ 1 in mutators, reflecting a higher proportion of passenger mutations.
Figure 5. Parallelism.

a, b, Cumulative distribution of detected mutations of each type in nonmutator (a) and mutator (b) populations over time (sv = structural variants, including IS-mediated mutations). Bars at right depict the distribution of mutations that fixed within their respective clades. c, Distribution of appearance times for each variant type in nonmutators. d, Fraction of detected mutations of each type that fixed in nonmutator and mutator populations (blue and red, respectively). Error bars denote the 14th and 84th percentiles of the beta posterior distribution; numbers above bars indicate the sample size of mutations of each type. e, f, Fraction of all mutations (excluding synonymous mutations) in nonmutator (e) and mutator (f) populations in genes with multiplicity mi≥m. The grey line is the null distribution, obtained by randomly distributing the mutations across genes. g, Average conditional fixation probability of a mutation as a function of its gene multiplicity (in sliding windows of 0.2 log10 units) in nonmutator (blue) and mutator (red) populations. Shaded confidence intervals denote the 14th and 84th percentiles of the beta posterior distribution of each window. Fixation probabilities of the 20 most-frequently mutated genes are shown as dots.
Because we observe the fates of mutations through time, we can examine how the distribution of variant types differs between the entire pool of detected mutations and the subset that fixed in their respective clades (a generalization of the McDonald-Kreitman test33). This approach allows us to estimate a fixation probability for each class of mutations, conditioned on reaching detectable frequency (Fig. 5d). In nonmutator lines, synonymous mutations have a smaller conditional fixation probability than other variant types (Fig. 5d), as expected if the latter are more likely to be beneficial. Nevertheless, the ratio of conditional fixation probabilities is smaller than dN/dS, suggesting that mutations are strongly influenced by genetic draft (i.e., linkage and associated hitchhiking) once they reach observable frequencies. Consistent with this interpretation, conditional fixation probabilities in mutator lines meet (or slightly exceed) the synonymous expectation, even though dN/dS ≲ 1.
Parallel genetic changes can reveal targets of selection on more finely resolved scales. Although we find some parallelism at the nucleotide level (Extended Data Fig. 3), more information is obtained by grouping mutations into genes and their respective promoter regions. We quantified parallelism in a gene by its effective multiplicity, mi, defined as the observed number of non-synonymous changes ni (including indels and SVs), normalized by gene length. Consistent with previous studies4,34, we find significantly more multi-hit mutations than expected by chance (Supplementary Information 6.3.1), though the excess is more pronounced in nonmutators (Fig. 5e,f).
This excess parallelism could be driven by natural selection or local increases in mutation rate (e.g., due to a nearby IS element). However, we find that multiplicity is positively correlated with conditional fixation probability in nonmutators (p~0.001; logistic regression) and essentially uncorrelated in mutators (p~0.4), suggesting that much of the excess parallelism in nonmutators is driven by selection (Fig. 5g). However, there is substantial variation around this trend, and even for the most recurrently mutated genes, the fixation probability rarely rises above 80%. Thus, while selection plays a large role in driving mutations to detectable frequencies, stochastic forces and interactions among competing lineages also are important in determining their fates.
Signatures of epistasis and historical contingency
We next quantified how signatures of parallelism vary over time and across populations. We first focused on genes mutated ≥ 3 times in nonmutators with multiplicities significant at 5% FDR (Fig. 6a, Supplementary Information 6.3.1). These genes include many previously identified targets of parallel evolution3,4,34. By permuting the appearance times of mutations across these genes (Supplementary Information 6.3.2), we find that mutations in many individual genes are distributed non-randomly (KS test, q<0.05). Some genes (e.g., hslU, Extended Data Fig. 4) are mutated early in the experiment but almost never late, while others (e.g., atoS, Extended Data Fig. 5) show the opposite tendency. Moreover, there is a global enrichment of non-random appearance times, even after removing the individually significant cases (summed KS test, p<0.001). This temporal bias is not restricted to high-multiplicity genes: mutations in 2-hit genes also tend to happen closer together in time than mutations in different genes (p<0.001, Extended Data Fig. 6). As a result, the observed repertoire of adaptive mutations changes over time (Extended Data Fig. 7, Supplementary Information 6.3.2).
Figure 6. Epistasis and contingency.

a, Genes mutated ≥3 times in nonmutators with multiplicities significant at 5% FDR. Circles indicate the appearance time of each mutation, connected by a vertical line for visualization. Each gene is colored according to its median appearance time (hatch-mark). Genes with significantly non-random appearance times are marked by asterisks. b, c, d, The distribution of dispersion configurations of a gene (i.e., the total number of mutations versus the number of different populations in which they appeared) for (b) all genes and (c, d) those with median mutation appearance times before or after t* = 17,500 generations, which was chosen to maximize the number of “missed opportunities” (Supplementary Information 6.3.3).
Genes that accumulate mutations early are expected under a “coupon collecting” model, in which genes with the most strongly beneficial mutations (or with higher mutation rates) are depleted once each population has acquired that mutation. Preferentially late genes might also be consistent with this model in the presence of clonal interference: weakly beneficial mutations that are usually outcompeted early can become successful once their stronger counterparts have fixed (Supplementary Information 6.3.3).
Preferentially late mutations could also reflect global changes in selection pressures with increasing fitness, or new evolutionary paths opened up by earlier substitutions. An example of the latter scenario is the evolution of citrate utilization in Ara–3, in which key mutations became beneficial only after earlier mutations35–37. We lack statistical power to scan for such interactions directly, but this signal of contingency might still be reflected in the distribution of mutations across nonmutator populations (Supplementary Information 6.3.3). Specifically, we expect mutations in a contingent gene to be clustered in a subset of the populations (i.e., those that fixed an unknown potentiating mutation). By contrast, genes in the coupon-collecting model should be over-dispersed, since additional mutations in the same lineage are no longer beneficial33.
We find a few under-dispersed genes that are candidates for historical contingency (e.g. argR has 7 mutations clustered in 3 populations; Extended Data Fig. 8). However, these examples cannot reach genome-wide significance in our limited sample, so we instead focused on the global distribution of dispersion configurations (Fig. 6b). We find a trend toward under-dispersion in genes that were mutated ≤4 times, and signatures of both under- and over-dispersion in genes mutated ≥5 times. This pattern suggests a combination of historical contingency and coupon collecting, with the latter expected to decline over time as targets are depleted, and the former expected to increase as potentiating mutations arise. Consistent with this hypothesis, over-dispersion declines when we focus on genes with later appearance times, and under-dispersion becomes more pronounced (Fig. 6c,d). When summed across genes, this under-dispersion amounts to at least ~16 “missed opportunities” (i.e., populations that would be expected to have produced a mutation in a target gene but did not), more than expected by chance (p~0.003; Extended Data Fig. 9). Similar results are obtained after clustering genes into operons (Supplementary Information 6.4).
Together, these results support the hypothesis that new routes for adaptation are sometimes opened up by earlier mutations. While purely statistical, this evidence implies that some adaptive mutations should be less beneficial (or even deleterious) when transplanted to genetic backgrounds without the corresponding potentiating mutations. This prediction might be tested directly in future work.
Discussion
The evolutionary dynamics that characterize long-term adaptation to a constant environment remain poorly documented empirically. Here, we observed this process directly by sequencing metagenomic samples from 60,000 generations of an ongoing experiment with E. coli. Our time-resolved “molecular fossil record” reveals a complex adaptive process, with clonal interference, genetic draft, and eco-evolutionary feedbacks playing important roles. Our data also suggest that the targets of selection shift over time, as emergent ecological interactions and changing genetic backgrounds create new genetic opportunities for adaptation that were not initially available. Such effects help to explain why the rate of molecular evolution remains so high through 60,000 generations.
Taken together, our results demonstrate that long-term adaptation to a fixed environment can be characterized by a rich and dynamic set of population genetic processes, in stark contrast to the evolutionary “desert” expected near a fitness optimum. Rather than relying only on standard models of neutral mutation accumulation and mutation-selection balance in well-adapted populations, these more complex dynamical processes should also be considered and included more broadly when interpreting natural genetic variation.
Extended Data
Extended Data Figure 1. Between-line variability in the rate of mutation accumulation.

a, coarse-grained mutation gains ΔMp,k (Supplementary Information section 5.1) for the six nonmutator populations, plotted using the same color scheme as Fig. 2. For comparison, the original mutation trajectories Mp(t) are shown in light grey. b, between-line variability in ΣkΔMp,k, with and without the Ara+1 population. Observed values are indicated as symbols, while the solid lines show the corresponding null distribution obtained by randomly permuting ΔMp,k across the six populations.
Extended Data Figure 2. Nonsynonymous vs synonymous mutations.

The ratio of nonsynonymous to synonymous mutations (dN/dS) in the entire pool of detected mutations, as well as the subset that fixed within their respective clades. Symbols denote individual populations, while bars denote pooled estimates across either the nonmutator or mutator populations. In panel a, this ratio is normalized by the relative number of synonymous and nonsynonymous sites. Panel b corrects for the observed spectrum of single-nucleotide mutations in each population.
Extended Data Figure 3. Parallelism at the nucleotide level.
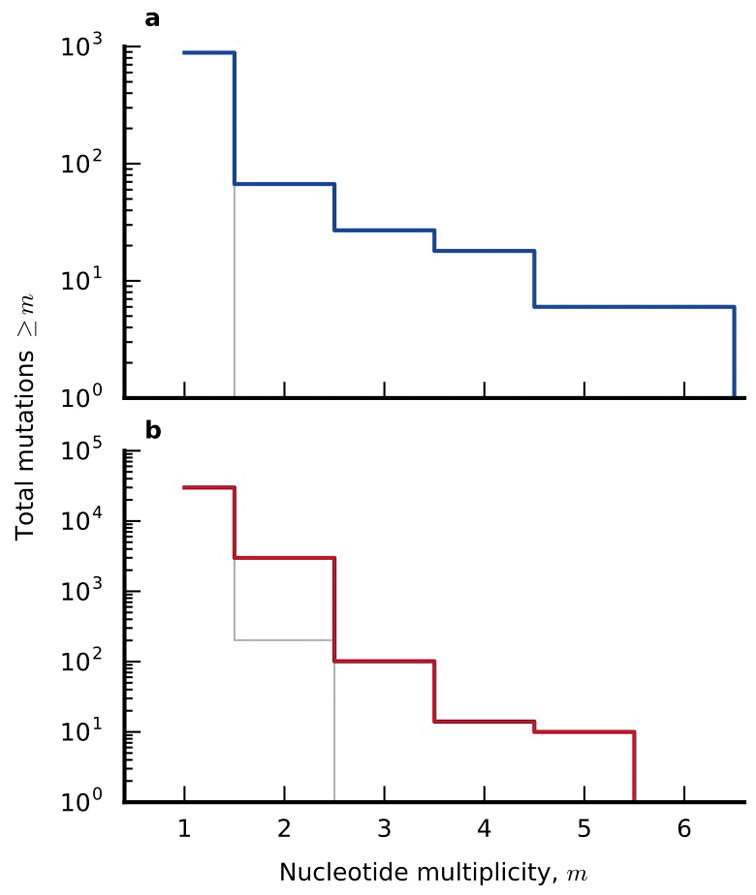
The distribution of nucleotide multiplicity (Supplementary Information section 6.2) for the nonmutator (a) and mutator (b) populations. Observed data are shown in colored lines, while the null expectations are shown in grey for comparison.
Extended Data Figure 4. Mutations in hslU.

Mutations that arose in the hslU gene in the six nonmutator populations. The inferred appearance times are indicated by the star symbols.
Extended Data Figure 5. Mutations in atoS.

Mutations that arose in the atoS gene in the six nonmutator populations. The inferred appearance times are indicated by the star symbols.
Extended Data Figure 6. Temporal similarity among two-hit genes.
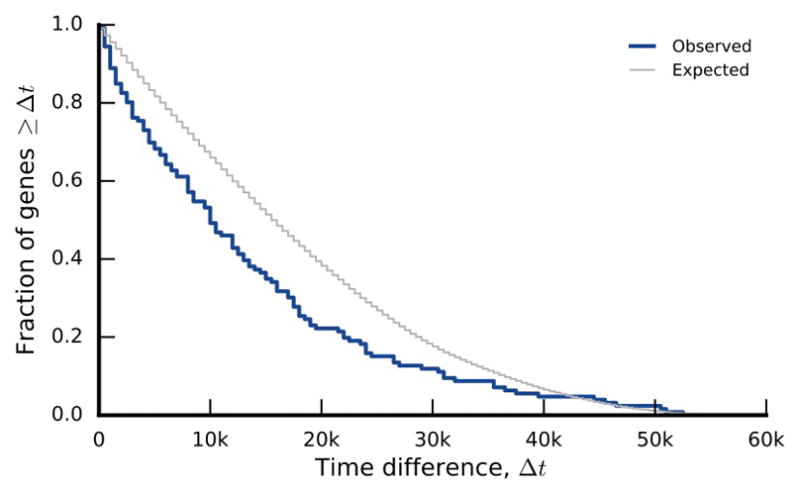
The distribution of the difference between the earliest and latest appearance times in genes with exactly two detected mutations in the nonmutator lines. The null distribution is obtained by randomly permuting appearance times among the 2-hit genes.
Extended Data Figure 7. Realized mutation spectrum in different time windows.

a, Fraction of mutations contributed by each gene in Fig. 6a, including time windows before and after the median appearance time of all mutations in those genes. b, Differences between the early and late distributions in (a) as a function the partition time t*. Dashed line denotes the median appearance time used to divide in (a). Solid line shows the value of the likelihood ratio test (LRT) between these two distributions for different choices of t* (Supplementary Information 6.3.2). Shaded region represents a 95% confidence interval obtained by randomly permuting appearance times across the subset of genes in (a) for 10,000 bootstrap iterations.
Extended Data Figure 8. Mutations in argR.

Mutations that arose in the argR gene in the six nonmutator populations. The inferred appearance times are indicated by the star symbols.
Extended Data Figure 9. Missed opportunities.
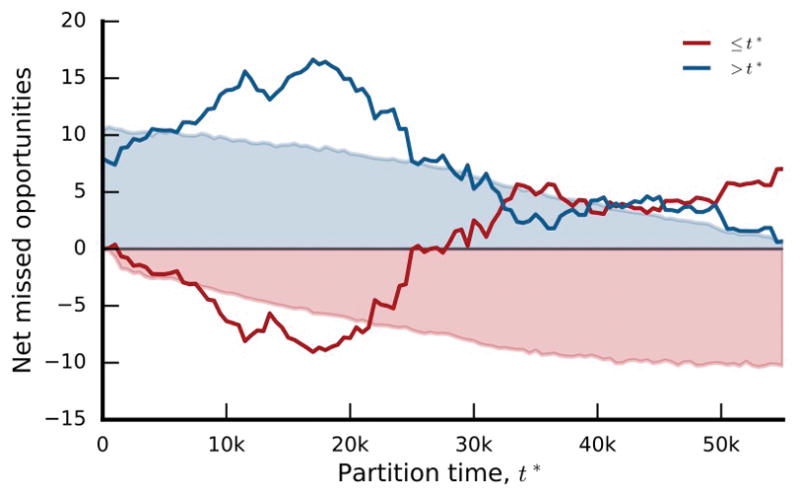
Net missed opportunities in the nonmutator populations as a function of the partition time t*. Lines denote the net missed opportunities for genes with median appearance times before and after t*, as defined by the formula in Supplementary Information section 6.3.3. Shaded regions denote one-sided 95% confidence intervals obtained by bootstrap resampling from the corresponding null model 10,000 times (see Supplementary Information section 6.3.3).
Supplementary Material
Acknowledgments
We thank N. Hajela, A.N. Nguyen Ba, and E. Jerison for assistance. B.H.G. acknowledges support from the US National Science Foundation (DEB-1501580) and the Miller Institute for Basic Research in Science at the University of California Berkeley. R.E.L. acknowledges support from the US National Science Foundation (DEB-1451740) and BEACON Center for the Study of Evolution in Action (DBI-0939454). M.M.D. acknowledges support from the Simons Foundation (Grant 376196), the US National Science Foundation (PHY-1313638), and the US National Institutes of Health (GM104239). Computational work was performed on the Odyssey cluster supported by the Research Computing Group at Harvard University.
Footnotes
The authors declare no competing financial interests.
AUTHOR CONTRIBUTIONS
B.H.G, M.J.M., R.E.L., and M.M.D. designed the project; B.H.G. and M.J.M. conducted the experiments and generated the sequence data; B.H.G. and J.E.B. designed and conducted the bioinformatics analyses; B.H.G. developed theory and statistical methods; B.H.G, M.J.M., J.E.B., R.E.L., and M.M.D. analyzed the data and wrote the paper.
DATA AVAILABILITY STATEMENT
Raw sequencing reads have been deposited in the NCBI BioProject database under accession number PRJNA380528. All associated metadata, as well as the source code for the sequencing pipeline, downstream analyses, and figure generation, are available at GitHub (https://github.com/benjaminhgood/LTEE-metagenomic).
Supplementary Information is linked to the online version of the paper at www.nature.com/nature.
List of Supplementary Files
Extended Data. Extended Data Figures 1–8.
Supplementary Information. Supplementary Methods 1–6, Data Availability statement, Supplementary Figures S1–S20, Supplementary Tables 1–4, and Supplementary References – see contents page for more details.
References
- 1.Lang GI, et al. Pervasive genetic hitchhiking and clonal interference in forty evolving yeast populations. Nature. 2013;500:571–574. doi: 10.1038/nature12344. [DOI] [PMC free article] [PubMed] [Google Scholar]
- 2.Kvitek DJ, Sherlock G. Whole genome, whole population sequencing reveals that loss of signaling networks is the major adaptive strategy in a constant environment. PLoS Genetics. 2013;9:e1003972. doi: 10.1371/journal.pgen.1003972. [DOI] [PMC free article] [PubMed] [Google Scholar]
- 3.Barrick JE, et al. Genome evolution and adaptation in a long-term experiment with Escherichia Coli. Nature. 2009;461:1243–1247. doi: 10.1038/nature08480. [DOI] [PubMed] [Google Scholar]
- 4.Tenaillon O, et al. Tempo and mode of genome evolution in a 50,000-generation experiment. Nature. 2016;536:165–170. doi: 10.1038/nature18959. [DOI] [PMC free article] [PubMed] [Google Scholar]
- 5.Miller CR, Joyce P, Wichman HA. Mutational effects and population dynamics during viral adaptation challenge current models. Genetics. 2011;187:185–202. doi: 10.1534/genetics.110.121400. [DOI] [PMC free article] [PubMed] [Google Scholar]
- 6.McDonald MJ, Rice DP, Desai MM. Sex speeds adaptation by altering the dynamics of molecular evolution. Nature. 2016;531:233–236. doi: 10.1038/nature17143. [DOI] [PMC free article] [PubMed] [Google Scholar]
- 7.Zanini F, et al. Population genomics of intrapatient HIV-1 evolution. eLife. 2015;4:e11282. doi: 10.7554/eLife.11282. [DOI] [PMC free article] [PubMed] [Google Scholar]
- 8.Luksza M, Lassig M. A predictive fitness model for influenza. Nature. 2014;507:57–61. doi: 10.1038/nature13087. [DOI] [PubMed] [Google Scholar]
- 9.Lieberman TD, et al. Parallel bacterial evolution within multiple patients identifies candidate pathogenicity genes. Nat Genet. 2011;43:1275–1280. doi: 10.1038/ng.997. [DOI] [PMC free article] [PubMed] [Google Scholar]
- 10.Nik-Zainal S, et al. The life history of 21 breast cancers. Cell. 2012;149:994–1007. doi: 10.1016/j.cell.2012.04.023. [DOI] [PMC free article] [PubMed] [Google Scholar]
- 11.Neher RA. Genetic draft, selective interference, and population genetics of rapid adaptation. Annual Review of Ecology, Evolution, and Systematics. 2013;44:195–215. [Google Scholar]
- 12.Good BH, Rouzine IM, Balick DJ, Hallatschek O, Desai MM. Distribution of fixed beneficial mutations and the rate of adaptation in asexual populations. Proceedings of the National Academy of Sciences. 2012;109:4950–4955. doi: 10.1073/pnas.1119910109. [DOI] [PMC free article] [PubMed] [Google Scholar]
- 13.Schiffels S, Szöllősi GJ, Mustonen V, Lässig M. Emergent neutrality in adaptive asexual evolution. Genetics. 2011;189:1361–1375. doi: 10.1534/genetics.111.132027. [DOI] [PMC free article] [PubMed] [Google Scholar]
- 14.Good BH, Desai MM. Deleterious passengers in adapting populations. Genetics. 2014;198:1183–1208. doi: 10.1534/genetics.114.170233. [DOI] [PMC free article] [PubMed] [Google Scholar]
- 15.Kryazhimskiy S, Tkacik G, Plotkin JB. The dynamics of adaptation on correlated fitness landscapes. Proceedings of the National Academy of Sciences. 2009;106:18638–18643. doi: 10.1073/pnas.0905497106. [DOI] [PMC free article] [PubMed] [Google Scholar]
- 16.Lenski RE, Rose MR, Simpson SC, Tadler SC. Long-term experimental evolution in Escherichia coli I. Adaptation and divergence during 2,000 generations. American Naturalist. 1991;138:1315–1341. [Google Scholar]
- 17.Wiser MJ, Ribeck N, Lenski RE. Long-term dynamics of adaptation in asexual populations. Science. 2013;342:1364. doi: 10.1126/science.1243357. [DOI] [PubMed] [Google Scholar]
- 18.Lenski RE, et al. Sustained fitness gains and variability in fitness trajectories in the long-term evolution experiment with Escherichia coli. Proceedings of the Royal Society B: Biological Sciences. 2015;282 doi: 10.1098/rspb.2015.2292. [DOI] [PMC free article] [PubMed] [Google Scholar]
- 19.Sniegowski PD, Gerrish PJ, Lenski RE. Evolution of high mutation rates in experimental populations of E-coli. Nature. 1997;387:703–705. doi: 10.1038/42701. [DOI] [PubMed] [Google Scholar]
- 20.Wielgoss S, et al. Mutation rate dynamics in a bacterial population reflect tension between adaptation and genetic load. Proceedings of the National Academy of Sciences. 2013;110:222–227. doi: 10.1073/pnas.1219574110. [DOI] [PMC free article] [PubMed] [Google Scholar]
- 21.Drake JW, Charlesworth B, Charlesworth D, Crow JF. A constant rate of spontaneous mutation in DNA-based microbes. Proceedings of the National Academy of Sciences. 1991;88:7160–7164. doi: 10.1073/pnas.88.16.7160. [DOI] [PMC free article] [PubMed] [Google Scholar]
- 22.Ewens W. Mathematical Population Genetics. Springer; 2004. [Google Scholar]
- 23.Gerrish PJ, Lenski RE. The fate of competing beneficial mutations in an asexual population. Genetica. 1998;102/103:127–144. [PubMed] [Google Scholar]
- 24.Desai MM, Fisher DS. Beneficial mutation-selection balance and the effect of linkage on positive selection. Genetics. 2007;176:1759–1798. doi: 10.1534/genetics.106.067678. [DOI] [PMC free article] [PubMed] [Google Scholar]
- 25.Kosheleva K, Desai MM. The dynamics of genetic draft in rapidly adapting populations. Genetics. 2013;195:1007. doi: 10.1534/genetics.113.156430. [DOI] [PMC free article] [PubMed] [Google Scholar]
- 26.Desai MM, Walczak AM, Fisher DS. Genetic diversity and the structure of genealogies in rapidly adapting populations. Genetics. 2013;193:565. doi: 10.1534/genetics.112.147157. [DOI] [PMC free article] [PubMed] [Google Scholar]
- 27.Rozen DE, Lenski RE. Long-term experimental evolution in Escherichia coli. VIII. Dynamics of a balanced polymorphism. American Naturalist. 2000;155:24–35. doi: 10.1086/303299. [DOI] [PubMed] [Google Scholar]
- 28.Plucain J, et al. Epistasis and allele specificity in the emergence of a stable polymorphism in Escherichia coli. Science. 2014;343:1366. doi: 10.1126/science.1248688. [DOI] [PubMed] [Google Scholar]
- 29.Maddamsetti R, Lenski RE, Barrick JE. Adaptation, clonal interference, and frequency-dependent interactions in a long-term evolution experiment with Escherichia coli. Genetics. 2015;200:619. doi: 10.1534/genetics.115.176677. [DOI] [PMC free article] [PubMed] [Google Scholar]
- 30.Frenkel EM, et al. Crowded growth leads to the spontaneous evolution of semistable coexistence in laboratory yeast populations. Proceedings of the National Academy of Sciences. 2015;112:11306–11311. doi: 10.1073/pnas.1506184112. [DOI] [PMC free article] [PubMed] [Google Scholar]
- 31.Park SC, Krug J. Clonal interference in large populations. Proceedings of the National Academy of Sciences. 2007;104:18135. doi: 10.1073/pnas.0705778104. [DOI] [PMC free article] [PubMed] [Google Scholar]
- 32.Fisher DS. Asexual evolution waves: fluctuations and universality. Journal of Statistical Mechanics: Theory and Experiment. 2013;2013:P01011. [Google Scholar]
- 33.McDonald JH, Kreitman M. Adaptive protein evolution at the Adh locus in Drosophila. Nature. 1991;351:652–654. doi: 10.1038/351652a0. [DOI] [PubMed] [Google Scholar]
- 34.Woods R, Schneider D, Winkworth CL, Riley MA, Lenski RE. Tests of parallel molecular evolution in a long-term experiment with Escherichia coli. Proceedings of the National Academy of Sciences. 2006;103:9107–9112. doi: 10.1073/pnas.0602917103. [DOI] [PMC free article] [PubMed] [Google Scholar]
- 35.Blount ZD, Borland CZ, Lenski RE. Historical contingency and the evolution of a key innovation in an experimental population of Escherichia coli. PNAS. 2008;105:7899–7906. doi: 10.1073/pnas.0803151105. [DOI] [PMC free article] [PubMed] [Google Scholar]
- 36.Blount ZD, Barrick JE, Davidson CJ, Lenski RE. Genomic analysis of a key innovation in an experimental Escherichia coli population. Nature. 2012;489:513–518. doi: 10.1038/nature11514. [DOI] [PMC free article] [PubMed] [Google Scholar]
- 37.Quandt EM, et al. Fine-tuning citrate synthase flux potentiates and refines metabolic innovation in the Lenski evolution experiment. eLife. 2015;4:e09696. doi: 10.7554/eLife.09696. [DOI] [PMC free article] [PubMed] [Google Scholar]
Associated Data
This section collects any data citations, data availability statements, or supplementary materials included in this article.