

This multicenter study showed that the diagnostic performance of myocardial CT perfusion was similar to that of MR perfusion imaging in the detection of coronary artery disease.
Abstract
Purpose
To compare the diagnostic performance of stress myocardial computed tomography (CT) perfusion with that of stress myocardial magnetic resonance (MR) perfusion imaging in the detection of coronary artery disease (CAD).
Materials and Methods
All patients gave written informed consent prior to inclusion in this institutional review board–approved study. This two-center substudy of the prospective Combined Noninvasive Coronary Angiography and Myocardial Perfusion Imaging Using 320-Detector Row Computed Tomography (CORE320) multicenter trial included 92 patients (mean age, 63.1 years ± 8.1 [standard deviation]; 73% male). All patients underwent perfusion CT and perfusion MR imaging with either adenosine or regadenoson stress. The predefined reference standards were combined quantitative coronary angiography (QCA) and single-photon emission CT (SPECT) or QCA alone. Results from coronary CT angiography were not included, and diagnostic performance was evaluated with the Mantel-Haenszel test stratified by disease status.
Results
The prevalence of CAD was 39% (36 of 92) according to QCA and SPECT and 64% (59 of 92) according to QCA alone. When compared with QCA and SPECT, per-patient diagnostic accuracy of perfusion CT and perfusion MR imaging was 63% (58 of 92) and 75% (69 of 92), respectively (P = .11); sensitivity was 92% (33 of 36) and 83% (30 of 36), respectively (P = .45); and specificity was 45% (25 of 56) and 70% (39 of 56), respectively (P < .01). When compared with QCA alone, diagnostic accuracy of CT perfusion and MR perfusion imaging was 82% (75 of 92) and 74% (68 of 92), respectively (P = .27); sensitivity was 90% (53 of 59) and 69% (41 of 59), respectively (P < .01); and specificity was 67% (22 of 33) and 82% (27 of 33), respectively (P = .27).
Conclusion
This multicenter study shows that the diagnostic performance of perfusion CT is similar to that of perfusion MR imaging in the detection of CAD.
© RSNA, 2017
Introduction
Noninvasive detection of flow-limiting coronary artery disease (CAD) is an important aim of cardiovascular medicine (1), most importantly because revascularization has been shown to improve clinical outcome (2), but also because noninvasive imaging tests save economic resources (3). Invasive tests enable identification of flow-limiting CAD via measurement of fractional flow reserve (FFR) and can facilitate therapeutic decision making (2). However, flow-limiting CAD can also be noninvasively assessed with myocardial perfusion imaging, which in the United States is most commonly performed by using single-photon emission computed tomography (SPECT) (4). Magnetic resonance (MR) imaging also enables accurate delineation of myocardial perfusion during adenosine-induced stress and has the important advantage of not exposing patients to ionizing radiation (5–7). The drawback of MR imaging when compared with CT is that coronary MR angiography is not accurate enough to reliably enable noninvasive exclusion of obstructive CAD (8). CT angiography is superior to coronary MR angiography in the identification of patients with CAD (8,9). Moreover, CT angiography is the most accurate noninvasive imaging test with which to reliably assess the presence of obstructive CAD because of its high sensitivity and high negative predictive value when compared with quantitative coronary angiography (QCA) analysis of invasive coronary angiography (ICA) (10–13).
Only recently, with the advent of improved CT hardware, has it become feasible and practical to perform additional myocardial CT perfusion to determine whether anatomic coronary stenoses also result in relevant myocardial perfusion deficits (14–16). In light of these developments, CT might have the potential to enable comprehensive assessment of coronary anatomy and myocardial perfusion in patients with known or suspected to have CAD in a noninvasive manner. With a focus on assessment of myocardial perfusion deficits, we aimed to compare stress myocardial CT perfusion with cardiac stress MR imaging in the detection of flow-limiting CAD. Coronary CT angiography was not included in this analysis of the multicenter Combined Noninvasive Coronary Angiography and Myocardial Perfusion Imaging Using 320-Detector Row Computed Tomography (CORE320) trial (15). The presence of obstructive CAD was prospectively defined in the CORE320 protocol by two reference standards: combined QCA and SPECT (hereafter, QCA and SPECT) and QCA alone (17). Furthermore, SPECT alone was included as an additional reference standard available on request during the review process.
The primary purpose of the present analysis was to compare the diagnostic performance of stress myocardial CT perfusion with that of stress myocardial MR perfusion imaging in the detection of CAD.
Materials and Methods
Study Design
This study was performed at the National Institutes of Health (NIH) and Charité–Universitätsmedizin Berlin as a two-center prospective substudy of the CORE320 multicenter trial to investigate the hypothesis that the diagnostic performance of CT perfusion with whole-heart coverage and single-beat acquisition is similar to that of dynamic myocardial MR perfusion imaging. The sponsor of the main study, Toshiba Medical Systems (Otawara, Japan), was not involved in this subanalysis of the CORE320 study at any stage of the study design, data acquisition, data analysis, or manuscript preparation, nor was it involved in the decision to submit this substudy for publication. No financial support was provided for this substudy, and all costs related to it were the responsibility of the two respective centers (NIH and Charité–Universitätsmedizin Berlin). The CORE320 protocol has been published by Vavere et al (17). In agreement with the CORE320 protocol, this substudy used the two reference standards that were prospectively defined by the study steering committee: QCA and SPECT were used in combination to reflect anatomic and functional disease, while QCA alone was used to reflect anatomic disease (17). Additional analysis with SPECT alone as a reference standard was available on request during the review process. At QCA, detection of coronary artery stenosis of at least 50% was considered to represent CAD for the purpose of this analysis. For combined QCA and SPECT, alignment between coronary artery stenosis and myocardial perfusion territories was performed as defined in the CORE320 protocol by Cerci et al (18). This myocardial territory segmentation model consists of six segments distributed in the basal myocardium (segments 1–6), another six segments in the apical myocardium (segments 7–12), and one segment in the apex (segment 13). The numbers are given in ascending order for the anterior, anteroseptal, inferoseptal, inferior, inferolateral, and anterolateral segments. The apex (segment 13) was excluded in our analysis, as it is not part of a standard MR perfusion protocol. Vascular territory maps were defined for the following vessels: left main, proximal left anterior descending artery, middistal anterior left descending artery, left circumflex artery, right coronary artery, and Ramus branch of the left circumflex artery. Primary territories were aligned to the respective coronary artery under the assumption of the most common right dominant anatomic coronary pattern. Secondary territories were assumed to have a possible blood supply from the respective coronary artery in normal anatomic variations, and tertiary territories were assumed not to be supplied by the coronary artery (18). The myocardial segments and the vascular territories were also used for MR image reading to achieve consistency with the reading technique used for CT perfusion and SPECT images. All criteria of the Standards for Reporting of Diagnostic Accuracy statement can be found in this report. The study protocol and this substudy on the comparison of myocardial CT perfusion with MR perfusion imaging were approved by the institutional review boards of the two institutions and the German Federal Office for Radiation Protection. Each patient gave written informed consent. The primary analysis included patients who underwent each imaging procedure, including SPECT, MR perfusion imaging, CT perfusion, and ICA.
Patient Population
The final patient population consisted of 92 consecutive patients referred to the NIH and Charité–Universitätsmedizin Berlin by outpatient centers and recruited for the CORE320 study (Fig 1). In the main CORE320 study report (15), 381 patients in whom CT perfusion was compared with combined SPECT and QCA were included, while the present study is the MR imaging subanalysis involving 92 patients in whom MR imaging was performed at two study sites prospectively. An analysis including MR imaging in the CORE320 study was not reported before. Mean patient age was 63.1 years ± 8.1 (standard deviation), and 73% of patients were male. Inclusion and exclusion criteria were predefined in the multicenter trial, and exclusion criteria were supplemented by general contraindications for MR imaging. All patients underwent CT, SPECT, and QCA in the CORE320 study, and in the present study, they also gave written informed consent and underwent MR perfusion imaging.
Figure 1:

Flowchart shows exclusion criteria. Of the 117 patients who met the inclusion criteria, 11 were excluded because reference standard findings were not diagnostic (five for SPECT alone, five for ICA alone, one for SPECT and ICA). In the remaining 106 patients, MR images were not diagnostic in 14. Of these 14 patients, four declined or discontinued MR imaging, eight declined MR imaging because of claustrophobia, and two had a contraindication to MR imaging. The final population consisted of 92 patients who completed all imaging examinations.
CT Perfusion and MR Perfusion Imaging
CT perfusion was performed with a 320-row scanner (0.5-mm detector collimation, 350-msec gantry rotation time, Aquilion ONE; Toshiba Medical Systems) as recently described in detail in the study protocol (19). Briefly, CT perfusion began at least 20 minutes after administration of sublingual nitrates for CT angiography. Continuous adenosine infusion was used for stress induction at both sites. Contrast material dose was 50–70 mL administered at a flow rate of 4–5 mL/sec and adjusted for patient weight. At a threshold of 300 HU in the descending aorta, CT perfusion was initiated (19). MR imaging was performed with a 1.5-T imager (MR Avanto or Espree; Siemens Healthcare, Erlangen, Germany). Myocardial perfusion assessment was performed by acquiring three short-axis sections per patient at every heart beat for 60 seconds with a balanced steady-state free-precession sequence (TrueFISP; Siemens Healthcare) at the NIH and with a fast low-angle shot sequence at Charité–Universitätsmedizin Berlin. Detailed MR imaging parameters used for perfusion assessment are summarized in Table E1 (online). Stress induction for MR perfusion imaging was performed by using intravenous adenosine infusion as for CT perfusion at Charité–Universitätsmedizin Berlin and by using a regadenoson bolus at the NIH, as described in Table E1 (online).
Central CT Perfusion and MR Perfusion Image Analysis
Semiquantitative image analysis and visual inspection were performed by using the 12-segment model for MR and CT perfusion described in the study design (18), excluding the true apex. CT perfusion image data were reconstructed every 0.5 second for the dynamic scan to determine arterial input function. CT perfusion rest and stress images were reconstructed with a section thickness of 0.5 mm and a myocardial perfusion kernel (FC03) that excluded edge enhancement and used a validated beam-hardening correction (19). Central CT perfusion image analysis included subjective and semiquantitative parameters. Subjective CT perfusion image analysis was performed to categorize perfusion (ie, normal or mild, moderate, or severe perfusion deficits). Additional categories were infarct with myocardial thinning and artifacts, including beam hardening (19). The same method was used for subjective MR image analysis. CT perfusion also included CT mean myocardial attenuation, transmural perfusion ratio, and myocardial attenuation normalized to the arterial input function for semiquantitative analysis (19). To set up a meaningful protocol for central analysis of the MR perfusion images, several prospective steps were taken by the principal investigators at Charité–Universitätsmedizin Berlin (M.D.) and the NIH (A.E.A.) in close collaboration with the CT perfusion, SPECT, and QCA core laboratory principal investigators (R.T.G., M.D.C., J.M.M.). First, MR perfusion image reading was aligned according to the CT perfusion and SPECT core laboratory prerequisites, as presented in detail in a separate methodologic article by Cerci et al (18). Second, 10 cardiac MR perfusion studies from each of the two sites were read by the two central laboratory MR readers (M.R., B.K., 10 and 2 years of cardiac MR reading experience, respectively) for quality assurance and to provide feedback on the reference standard results in these cases. Moreover, this process trained the readers and enabled them to familiarize themselves with the MR images from each site. In case of discrepancy between the results of these two readers, a final consensus was reached together with a third adjudication reader (M.D., 15 years of cardiac MR reading experience).
Reference Standard Image Analysis and Alignment
The primary reference standard for the diagnosis of CAD was QCA showing stenosis of 50% or more in combination with a corresponding myocardial perfusion defect at SPECT. QCA alone showing stenosis of 50% or more served as the secondary reference standard. This approach was used in CORE320 (17) and for the 92 patients included in this ancillary study. Image analysis was performed in accordance with the study protocol (17,19). The reference standard readings of QCA and SPECT were locked in the central statistical database and remained unchanged from the main study analysis (15). For the myocardial per-territory analysis of the three coronary artery vessels, the MR standard model (20) was adjusted to the CORE320 13-segment model, excluding the apex, and resulted in 12 segments to ensure correct intermodality matching of myocardial territories between CT perfusion and MR perfusion imaging. The alignment included correction of the segment borders in all thirds of the short-axis sections, and midsegments were merged with apical segments.
Statistical Analyses
Since this was a two-center prospective ancillary study of the CORE320 trial, sample size was not defined on the basis of a power analysis, as in the main study (17). To compare the diagnostic performance of CT perfusion with that of MR perfusion imaging, we used the Mantel-Haenzel test stratified by disease status. We used the following diagnostic performance measures to compare CT perfusion with MR perfusion imaging: diagnostic accuracy, sensitivity, specificity, negative and positive predictive values, and negative and positive likelihood ratios, as defined elsewhere (21–23). All data are reported as mean ± standard deviation (normally distributed data), median (data not normally distributed), or proportion with 95% confidence interval (CI). For unclustered data (per-patient analysis), 95% CIs for single proportions and differences of proportions were obtained by using the scoring method described elsewhere (24). Statistical analyses were conducted with SPSS, version 22.0 (SPSS, Chicago, Ill); SAS, version 9.2 (SAS Institute, Cary, NC); and StatXact, version 6.0 (Cytel Software, Cambridge, Mass). The 95% CIs for clustered data were calculated by using a homemade program written in R language (25).
Results
During the study period, 117 patients were eligible for inclusion (Fig 1). Of these, 11 were excluded because SPECT image quality was nondiagnostic (n = 5), because patients declined ICA (n = 5), or both (n = 1). Among the remaining 106 patients, 14 had nondiagnostic MR images for various reasons, with claustrophobia being the most common (n = 8) (Fig 1). Finally, 92 patients who successfully completed all four imaging tests were included in the primary analysis (Fig 1) for comparison of CT perfusion and MR perfusion imaging findings with the reference standard results. The median radiation dose in the 92 patients included was 5.3 mSv (interquartile range, 3.7–6.0) for CT perfusion, 11.9 mSv (interquartile range, 8.0–17.3) for QCA alone, 8.9 mSv (interquartile range, 4.9–9.5) for SPECT alone, and 19.6 mSv (interquartile range, 15.9–25.0) for combined QCA and SPECT.
Patient characteristics are given in Table 1. No serious adverse events occurred during or after either test. Of the analyzable patients, 39% (36 of 92) had coronary artery stenosis of 50% or more at QCA and a corresponding myocardial perfusion defect at SPECT (primary reference standard), while 64% (59 of 92) had CAD as identified by stenosis of 50% or more at QCA alone (secondary reference standard). With SPECT alone as the additional reference standard, prevalence was 53% (49 of 92). Patients older than 65 years accounted for 41% (38 of 92) of the population, and 70% (64 of 92) had a body mass index of 25 or higher.
Table 1.
Characteristics of the 92 Included Patients
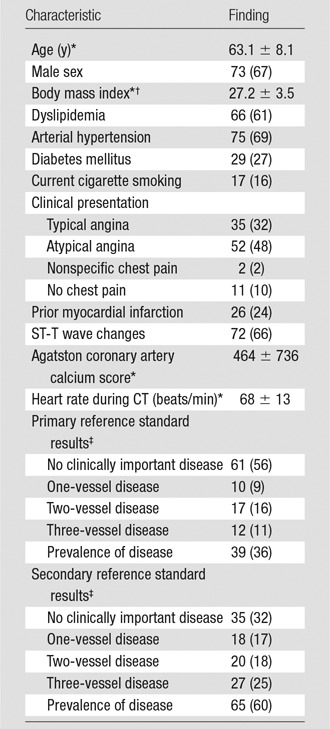
Note.—Unless otherwise indicated, data are percentages, and data in parentheses are the number of patients.
*Data are mean ± standard deviation.
†Calculated as the weight in kilograms divided by the square of the height in meters.
‡The primary reference standard was combined QCA and SPECT. The secondary reference standard was QCA alone (17).
Figure 2 shows representative stress perfusion defects detected with CT perfusion and MR perfusion imaging, with the corresponding images obtained with combined QCA and SPECT. Tables 2–4 enable direct comparison of CT perfusion and MR perfusion imaging data according to the Standards for Reporting of Diagnostic Accuracy with data acquired with the two reference standards and the additionally requested reference standard of SPECT alone. The per-patient accuracy of CT perfusion and that of MR perfusion imaging were not significantly different for combined QCA and SPECT as the reference standard (P = .11) or for QCA alone as the reference standard (P = .27), respectively, while myocardial CT perfusion was more sensitive than MR perfusion imaging with QCA alone as the reference standard (P < .01), and MR perfusion imaging was more specific than CT perfusion with combined QCA and SPECT as the reference standard (P < .01) (Table 5).
Figure 2a:
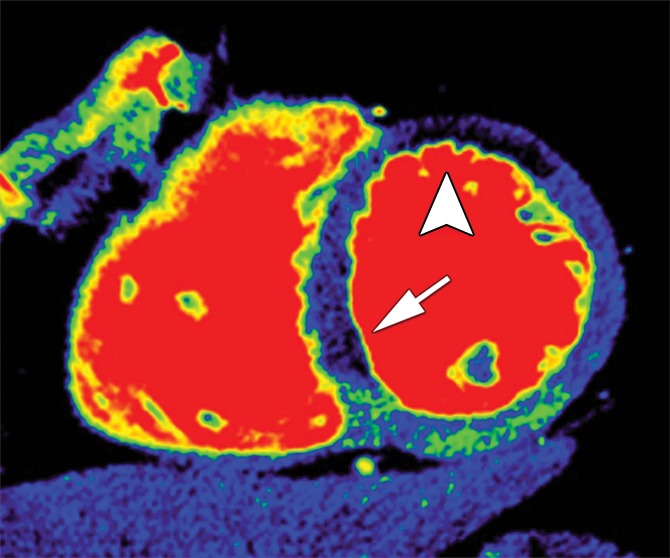
Stress perfusion defects in the left anterior descending coronary artery territory in a 74-year-old woman. Representative true-positive (a) CT perfusion and (b) MR perfusion images show a myocardial perfusion deficit in the anteroseptal wall. Note the anterior deficit (arrowhead) and the septal part (arrow). For visualization of the CT perfusion deficit, a short-axis screen shot with 8-mm section thickness is shown in the rainbow red preset. (c) ICA shows 90% stenosis (*) in the left anterior descending coronary artery. (d) SPECTimage shows a matching perfusion deficit in the anterior wall (arrowhead) and a less pronounced deficit in the septum (arrow).
Table 2.
Direct Comparison of CT Perfusion and MR Perfusion Results at the Per-Patient and Per-Territory Levels in Comparison with Combined QCA and SPECT
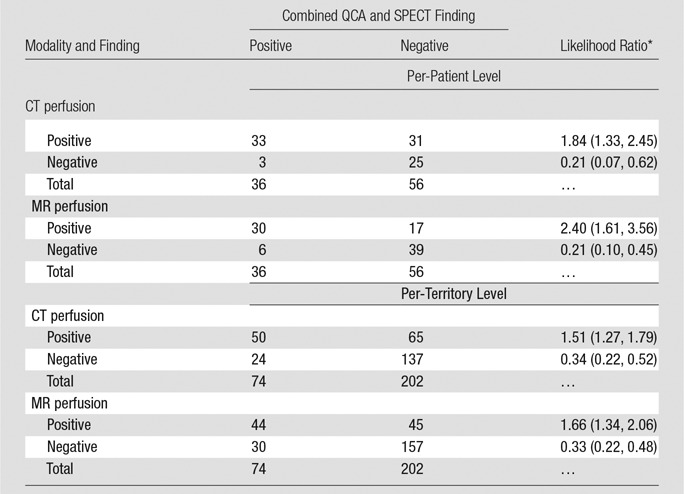
Note.—Patients and territories deemed not interpretable would have been considered nondiagnostic for statistical analysis. However, in none of these cases was inadequate interpretability due to poor image quality.
Table 4.
Direct Comparison of CT Perfusion and MR Perfusion Results at the Per-Patient and Per-Territory Levels in Comparison with SPECT Alone
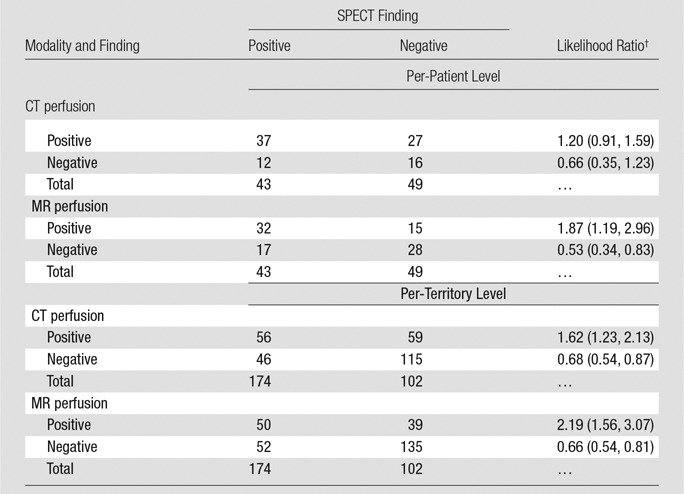
Note.—Patients and territories deemed not interpretable would have been considered nondiagnostic for statistical analysis. However, in none of these cases was inadequate interpretability due to poor image quality.
Table 5.
Diagnostic Performance of CT Perfusion and MR Perfusion Compared with Combined QCA and SPECT, QCA Alone, and SPECT Alone
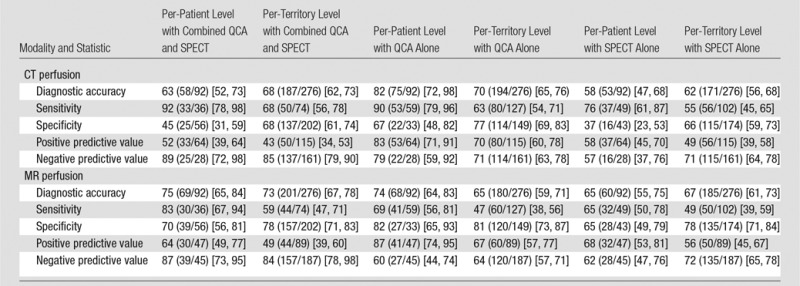
Figure 2b:
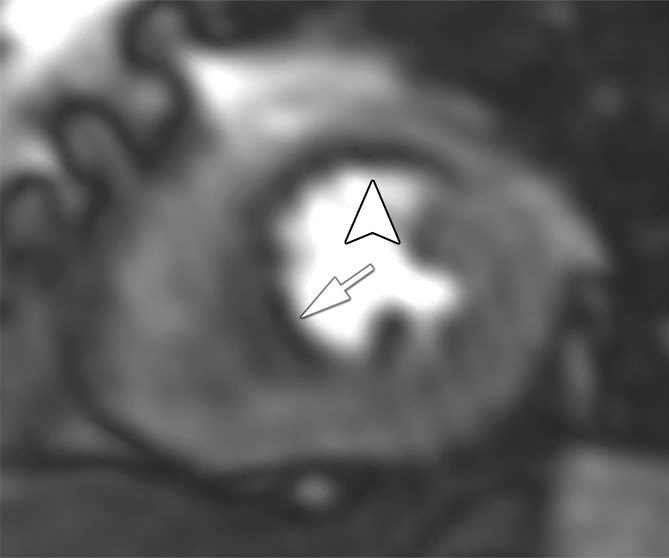
Stress perfusion defects in the left anterior descending coronary artery territory in a 74-year-old woman. Representative true-positive (a) CT perfusion and (b) MR perfusion images show a myocardial perfusion deficit in the anteroseptal wall. Note the anterior deficit (arrowhead) and the septal part (arrow). For visualization of the CT perfusion deficit, a short-axis screen shot with 8-mm section thickness is shown in the rainbow red preset. (c) ICA shows 90% stenosis (*) in the left anterior descending coronary artery. (d) SPECTimage shows a matching perfusion deficit in the anterior wall (arrowhead) and a less pronounced deficit in the septum (arrow).
Figure 2c:
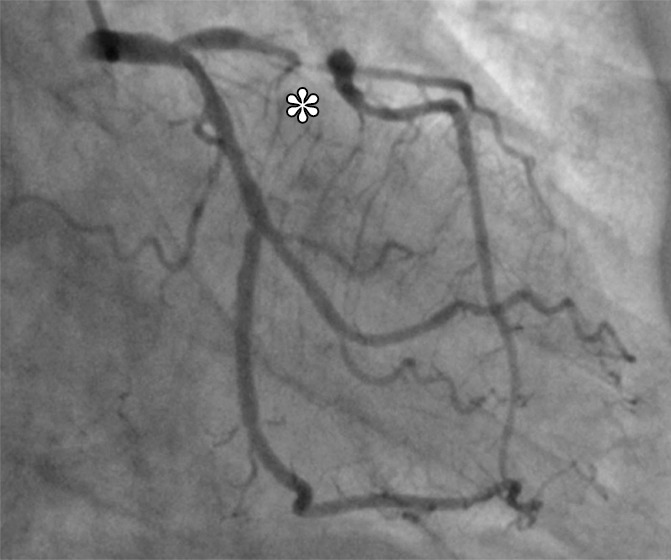
Stress perfusion defects in the left anterior descending coronary artery territory in a 74-year-old woman. Representative true-positive (a) CT perfusion and (b) MR perfusion images show a myocardial perfusion deficit in the anteroseptal wall. Note the anterior deficit (arrowhead) and the septal part (arrow). For visualization of the CT perfusion deficit, a short-axis screen shot with 8-mm section thickness is shown in the rainbow red preset. (c) ICA shows 90% stenosis (*) in the left anterior descending coronary artery. (d) SPECTimage shows a matching perfusion deficit in the anterior wall (arrowhead) and a less pronounced deficit in the septum (arrow).
Figure 2d:
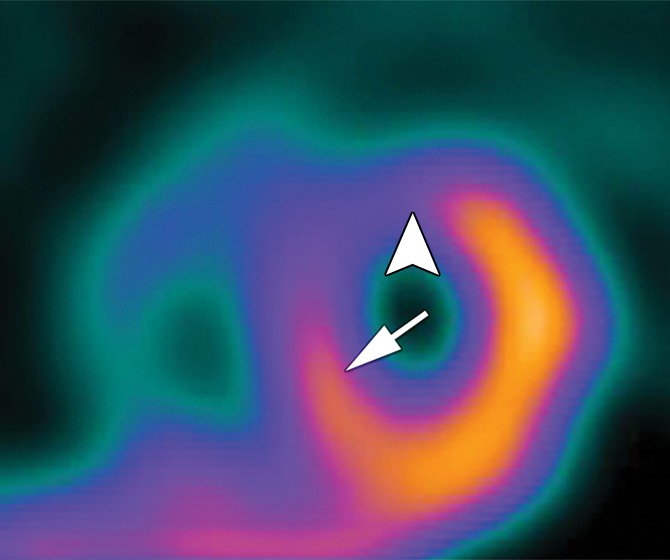
Stress perfusion defects in the left anterior descending coronary artery territory in a 74-year-old woman. Representative true-positive (a) CT perfusion and (b) MR perfusion images show a myocardial perfusion deficit in the anteroseptal wall. Note the anterior deficit (arrowhead) and the septal part (arrow). For visualization of the CT perfusion deficit, a short-axis screen shot with 8-mm section thickness is shown in the rainbow red preset. (c) ICA shows 90% stenosis (*) in the left anterior descending coronary artery. (d) SPECTimage shows a matching perfusion deficit in the anterior wall (arrowhead) and a less pronounced deficit in the septum (arrow).
Table 3.
Direct Comparison of CT Perfusion and MR Perfusion Results at the Per-Patient and Per-Territory Levels in Comparison with QCA Alone
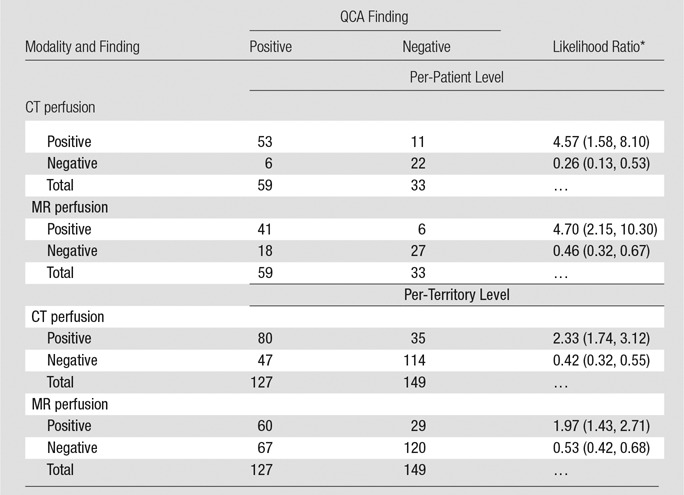
Note.—Patients and territories deemed not interpretable would have been considered nondiagnostic for statistical analysis. However, in none of these cases was inadequate interpretability due to poor image quality.
Also in the per-territory analysis, diagnostic accuracy of CT perfusion and that of MR perfusion imaging when compared with both reference standards were similar (Table 5). The sensitivity of CT perfusion was higher than that of MR perfusion imaging with QCA as the reference standard (63% [80 of 127] and 47% [60 of 127], respectively; P = .013), while the specificity of CT perfusion was lower than that of MR perfusion imaging with combined QCA and SPECT as the reference standard (68% [137 of 202] and 78% [157 of 202], respectively; P = .027). With the additional reference standard of SPECT alone (Table 4), the per-patient accuracy of MR perfusion imaging was superior to that of CT perfusion (P = .001), with improved specificity (P = .004) but not sensitivity (P = .267). Similar results were found on the per-territory level analysis, with better accuracy (P = .031) and improved specificity (P = .019) of MR perfusion imaging compared with that of CT perfusion but similar sensitivity (P = .430) (Table 4).
Discussion
This multicenter trial showed that myocardial CT perfusion and myocardial MR perfusion imaging have comparable diagnostic accuracy in the detection of CAD.
The most important secondary finding was that CT perfusion is more sensitive than MR perfusion imaging with QCA as the reference standard, while MR perfusion imaging is more specific than CT perfusion with combined QCA and SPECT or SPECT alone as the reference standard. Possible explanations for the higher sensitivity of CT perfusion might be its higher spatial resolution, while the higher specificity of MR imaging might be related to the vulnerability of CT perfusion to beam-hardening artifacts mimicking perfusion defects. MR imaging is an accurate myocardial perfusion imaging technique, having been shown to have superior sensitivity but inferior specificity in relation to SPECT in a large multicenter trial (28). Greater sensitivity of MR imaging compared with SPECT has been confirmed in another large single-center study (6). Interestingly, the investigators of the single-center study also showed that, unlike SPECT, MR imaging was equally accurate in men and women (7). We compared CT perfusion with MR imaging in the detection of CAD, as defined by the combination of anatomic disease (QCA) and functional relevance (SPECT). Given the diagnostic accuracy reported for MR imaging (6) and the clinical value of FFR measurement (29), SPECT may not be the perfect reference standard, and this may explain the lower prevalence of CAD seen with the combination of QCA and SPECT as the reference standard versus QCA alone. However, SPECT is the most commonly performed myocardial ischemia imaging test in the United States (4); thus, the current analysis has relevant clinical implications. Moreover, the two prospectively defined reference standards used within the CORE320 trial were requested by the steering committee to remain unchanged for this analysis to achieve consistency in study reporting and to reflect the combination of anatomic and functional disease (combined QCA and SPECT) as the primary reference standard and anatomic disease alone (QCA) as the secondary reference standard. The large difference in prevalence of CAD as defined by these two reference standards is also related to intermediate coronary stenosis, which is defined as a stenosis of at least 50% at QCA that did not result in myocardial perfusion defects at SPECT and thus lower CAD prevalence for combined QCA and SPECT. The additionally requested analysis with SPECT alone as the reference standard showed improved specificity of MR perfusion imaging versus CT perfusion. This clinically relevant finding shows that MR perfusion imaging might have an improved concordance to functionally relevant stenoses that are defined with SPECT alone.
To our knowledge, no other study has directly compared CT perfusion with MR perfusion imaging with the clinically relevant combination of QCA and SPECT as the reference standard. The study by Bettencourt et al (30) compared CT perfusion and MR perfusion imaging with FFR in 101 patients. In terms of diagnostic accuracy, they found a patient-based sensitivity of 68% and a specificity of 93% when comparing CT perfusion with FFR. Their findings are contrary to ours, as we found a higher sensitivity of 92% and a lower specificity of 45% for CT perfusion with combined QCA and SPECT as the reference standard. The MR imaging results also differed between the Bettencourt et al (30) study and ours: whereas they reported a sensitivity of 89% and a specificity of 88%, we found lower sensitivity and specificity of 83% and 70%, respectively, with combined QCA and SPECT as the reference standard. However, these differences should be interpreted with caution because Bettencourt et al used FFR as the reference standard and we used combined QCA and SPECT as the primary reference standard.
Sensitivity might be improved by using dynamic CT perfusion in the first pass. A relatively recent study shows that when MR imaging is compared with dynamic CT perfusion, its sensitivity can reach 100% on the patient level, while its specificity can reach 75% (31). However, another study showed no relevant difference in diagnostic accuracy between single-shot and dynamic CT perfusion (32). The present study probably includes one of the largest patient cohorts that underwent imaging with several myocardial perfusion modalities (SPECT, MR imaging, and CT) and ICA at two different centers, which might also be considered a limitation. At each center, 1.5-T MR imaging was performed by using protocols that reflected the local clinical routine. To make the study more generalizable and to reduce discrepancies, blinded MR data sets that were not part of the study were exchanged between NIH and Charité–Universitätsmedizin Berlin for reading before central core laboratory analysis of imaging data.
Excessive radiation exposure to the patient is a general concern and is not limited to cardiac imaging. While the Coronary Artery Evaluation Using 64-Row Multidetector Computed Tomography Angiography (CORE64) study showed an average effective dose of 19 mSv for CT angiography (33), the subsequent CORE320 trial had a median effective dose of 9 mSv for combined CT angiography and CT perfusion (15). In our patient population, the median radiation dose of CT perfusion was 5.3 mSv. With the advent of a new generation of CT scanners (34), submillisievert CT angiography recently became possible; consequently, CT perfusion using a single-shot technique would be possible with radiation exposure on the same order. While the exposure of dynamic nongated dual-energy CT myocardial perfusion imaging may be as high as 54 mSv (35), recent dynamic CT perfusion protocols have used a dual-source CT range of 4.6–10.0 mSv (36). Taken together, the current CT angiography and CT perfusion protocols of the most recent wide-area coverage or dual-source CT scanner generation result in even lower effective doses.
In patients with stable CAD, FFR-guided coronary intervention in combination with medical therapy appears to improve patient outcome compared with medical therapy alone, as shown in a relatively recent trial (37). CT yields information on coronary artery anatomy, with assessment of the degree of stenosis at CT angiography and its functional relevance, as analyzed with CT perfusion (30). Whether this information can be used to guide patient care decisions like with FFR is a pivotal clinical question that will require randomized trials. Furthermore, noninvasive computed CT FFR shows a promising diagnostic performance in the detection of culprit lesions compared with visual stenosis grading (38).
The limitations of our study include a varying prevalence of CAD, which is a result of the two predefined reference standards of the study protocol (QCA alone or combined QCA and SPECT) and the further requested reference standard (SPECT alone). However, up to now, there is no generally accepted single reference standard for comparison of myocardial perfusion imaging techniques. The limited number of sites and patients should also be mentioned as a limitation. On the individual patient level, however, the present study included probably one of the largest cohorts of patients who underwent myocardial perfusion imaging with several modalities (SPECT, MR imaging, and CT) and ICA. In the end, the sample size was not defined on the basis of a power analysis, as in the main study, because this was a two-center prospective ancillary study of the CORE320 trial. In conclusion, this multicenter study showed that the diagnostic performance of myocardial CT perfusion was similar to that of MR perfusion imaging in the detection of CAD.
Advances in Knowledge
■ Myocardial CT perfusion and MR perfusion imaging have similar diagnostic performance in the detection of coronary artery disease (CAD) when compared with the reference standards of combined quantitative coronary angiography (QCA) and SPECT and QCA alone.
■ CT perfusion has higher sensitivity than MR perfusion imaging when compared with QCA alone.
■ MR perfusion imaging has higher specificity than CT perfusion when compared with combined QCA and SPECT and SPECT alone.
Implications for Patient Care
■ CT perfusion and MR perfusion imaging have comparable diagnostic performance in the detection of CAD and are equally suited for decision making about the functional relevance of coronary stenosis seen at CT angiography.
■ Both CT perfusion and MR perfusion imaging may be suited as alternatives to SPECT in assessment of the functional relevance of coronary stenosis.
■ MR perfusion imaging is more accurate than CT perfusion in the identification of perfusion deficits that are diagnosed with SPECT.
SUPPLEMENTAL TABLE
Received November 10, 2016; revision requested January 4, 2017; revision received May 17; accepted June 2; final version accepted July 20.
Supported by Deutsche Forschungsgemeinschaft (Heisenberg Program DE 1361/14-1) and Toshiba Medical Systems (now Canon) (CORE320 trial, NCT00934037).
M.R. and M.Y.C. contributed equally to this work.
Disclosures of Conflicts of Interest: M.R. disclosed no relevant relationships. M.Y.C. Activities related to the present article: disclosed no relevant relationships. Activities not related to the present article: has an institutional research agreement with Toshiba Medical Systems. Other relationships: disclosed no relevant relationships. A.L.V. Activities related to the present article: disclosed no relevant relationships. Activities not related to the present article: institution received a grant from Toshiba Medical Systems. Other relationships: disclosed no relevant relationships. B.K. disclosed no relevant relationships. J.M.M. Activities related to the present article: disclosed no relevant relationships. Activities not related to the present article: institution received a grant from Toshiba Medical Systems. Other relationships: disclosed no relevant relationships. W.P.B. Activities related to the present article: disclosed no relevant relationships. Activities not related to the present article: is the principal investigator at her institution for a multicenter trial sponsored by Bayer. Other relationships: disclosed no relevant relationships. C.C. Activities related to the present article: disclosed no relevant relationships. Activities not related to the present article: institution received a grant from Toshiba Medical Systems. Other relationships: disclosed no relevant relationships. R.T.G. Activities related to the present article: received a grant from Toshiba Medical Systems. Activities not related to the present article: disclosed no relevant relationships. Other relationships: is employed by Medimmune; is a consultant from ICON Medical Imaging; holds patents 7,853,309, 8,160,338, and 8,615,116. J.L. Activities related to the present article: received a grant from Toshiba Medical Systems. Activities not related to the present article: disclosed no relevant relationships. Other relationships: disclosed no relevant relationships. M.D.C. Activities related to the present article: disclosed no relevant relationships. Activities not related to the present article: received a grant from Spectrum Dynamics. Other relationships: disclosed no relevant relationships. M.P. disclosed no relevant relationships. E.Z. disclosed no relevant relationships. M.L. disclosed no relevant relationships. P.S. Activities related to the present article: disclosed no relevant relationships. Activities not related to the present article: received a grant for the DISCHARGE trial funded by the FP7 Program of the European Commission, receives royalties from Springer Publishing. Other relationships: disclosed no relevant relationships. A.E.A. Activities related to the present article: received nonfinancial support from Siemens; has a clinical trial agreement with Bayer. Activities not related to the present article: disclosed no relevant relationships. Other relationships: disclosed no relevant relationships. M.D. Activities related to the present article: received a grant from Toshiba Medical Systems. Activities not related to the present article: is a consultant for Guerbet; institution received a grant from the European Regional Development Fund, the German Heart Foundation/German Foundation of Heart Research, GE Healthcare, Bracco, Guerbet, Toshiba Medical Systems, German Research Foundation (DFG) and the German Federal Ministry of Education and Research (BMBF), German Research Foundation (DFG); is Principal Investigator of the DISCHARGE trial funded by the FP7 Program of the European Commission; served as a speaker for Toshiba Medical Systems, Bayer-Schering, Guerbet, and Cardiac MR Academy Berlin; received compensation for travel from Toshiba Medical Systems and Guerbet; has institutional master research agreements with Siemens Medical Solutions, Philips Medical Systems, and Toshiba Medical Systems; received royalties from Springer Publishing. Other relationships: disclosed no relevant relationships.
Abbreviations:
- CAD
- coronary artery disease
- CI
- confidence interval
- CORE320
- Combined Noninvasive Coronary Angiography and Myocardial Perfusion Imaging Using 320-Detector Row Computed Tomography
- FFR
- fractional flow reserve
- ICA
- invasive coronary angiography
- NIH
- National Institutes of Health
- QCA
- quantitative coronary angiography
References
- 1.Moscariello A, Vliegenthart R, Schoepf UJ, et al. Coronary CT angiography versus conventional cardiac angiography for therapeutic decision making in patients with high likelihood of coronary artery disease. Radiology 2012;265(2):385–392. [DOI] [PubMed] [Google Scholar]
- 2.Tonino PA, De Bruyne B, Pijls NH, et al. Fractional flow reserve versus angiography for guiding percutaneous coronary intervention. N Engl J Med 2009;360(3):213–224. [DOI] [PubMed] [Google Scholar]
- 3.Min JK, Kang N, Shaw LJ, et al. Costs and clinical outcomes after coronary multidetector CT angiography in patients without known coronary artery disease: comparison to myocardial perfusion SPECT. Radiology 2008;249(1):62–70. [DOI] [PubMed] [Google Scholar]
- 4.Arlington Medical Resources . The Myocardial Perfusion Imaging Market Guide (U.S.) Supplement to the U.S. Imaging Market Guide. Malvern, Pa: Arlington Medical Resources, 2007. [Google Scholar]
- 5.Schwitter J, Arai AE. Assessment of cardiac ischaemia and viability: role of cardiovascular magnetic resonance. Eur Heart J 2011;32(7):799–809. [DOI] [PMC free article] [PubMed] [Google Scholar]
- 6.Greenwood JP, Maredia N, Younger JF, et al. Cardiovascular magnetic resonance and single-photon emission computed tomography for diagnosis of coronary heart disease (CE-MARC): a prospective trial. Lancet 2012;379(9814):453–460. [DOI] [PMC free article] [PubMed] [Google Scholar]
- 7.Greenwood JP, Motwani M, Maredia N, et al. Comparison of cardiovascular magnetic resonance and single-photon emission computed tomography in women with suspected coronary artery disease from the Clinical Evaluation of Magnetic Resonance Imaging in Coronary Heart Disease (CE-MARC) Trial. Circulation 2014;129(10):1129–1138. [DOI] [PubMed] [Google Scholar]
- 8.Schuetz GM, Zacharopoulou NM, Schlattmann P, Dewey M. Meta-analysis: noninvasive coronary angiography using computed tomography versus magnetic resonance imaging. Ann Intern Med 2010;152(3):167–177. [DOI] [PubMed] [Google Scholar]
- 9.Dewey M, Teige F, Schnapauff D, et al. Noninvasive detection of coronary artery stenoses with multislice computed tomography or magnetic resonance imaging. Ann Intern Med 2006;145(6):407–415. [DOI] [PubMed] [Google Scholar]
- 10.Schlattmann P, Schuetz GM, Dewey M. Influence of coronary artery disease prevalence on predictive values of coronary CT angiography: a meta-regression analysis. Eur Radiol 2011;21(9):1904–1913. [DOI] [PubMed] [Google Scholar]
- 11.Dewey M. Coronary CT versus MR angiography: pro CT—the role of CT angiography. Radiology 2011;258(2):329–339. [DOI] [PubMed] [Google Scholar]
- 12.Sakuma H. Coronary CT versus MR angiography: the role of MR angiography. Radiology 2011;258(2):340–349. [DOI] [PubMed] [Google Scholar]
- 13.Achenbach S. Computed tomography coronary angiography. J Am Coll Cardiol 2006;48(10):1919–1928. [DOI] [PubMed] [Google Scholar]
- 14.Rocha-Filho JA, Blankstein R, Shturman LD, et al. Incremental value of adenosine-induced stress myocardial perfusion imaging with dual-source CT at cardiac CT angiography. Radiology 2010;254(2):410–419. [DOI] [PMC free article] [PubMed] [Google Scholar]
- 15.Rochitte CE, George RT, Chen MY, et al. Computed tomography angiography and perfusion to assess coronary artery stenosis causing perfusion defects by single photon emission computed tomography: the CORE320 study. Eur Heart J 2014;35(17):1120–1130. [DOI] [PMC free article] [PubMed] [Google Scholar]
- 16.Rief M, Zimmermann E, Stenzel F, et al. Computed tomography angiography and myocardial computed tomography perfusion in patients with coronary stents: prospective intraindividual comparison with conventional coronary angiography. J Am Coll Cardiol 2013;62(16):1476–1485. [Published correction appears in J Am Coll Cardiol 2014;63(9):944.] [DOI] [PubMed] [Google Scholar]
- 17.Vavere AL, Simon GG, George RT, et al. Diagnostic performance of combined noninvasive coronary angiography and myocardial perfusion imaging using 320 row detector computed tomography: design and implementation of the CORE320 multicenter, multinational diagnostic study. J Cardiovasc Comput Tomogr 2011;5(6):370–381. [DOI] [PMC free article] [PubMed] [Google Scholar]
- 18.Cerci RJ, Arbab-Zadeh A, George RT, et al. Aligning coronary anatomy and myocardial perfusion territories: an algorithm for the CORE320 multicenter study. Circ Cardiovasc Imaging 2012;5(5):587–595. [DOI] [PubMed] [Google Scholar]
- 19.George RT, Arbab-Zadeh A, Cerci RJ, et al. Diagnostic performance of combined noninvasive coronary angiography and myocardial perfusion imaging using 320-MDCT: the CT angiography and perfusion methods of the CORE320 multicenter multinational diagnostic study. AJR Am J Roentgenol 2011;197(4):829–837. [DOI] [PMC free article] [PubMed] [Google Scholar]
- 20.Cerqueira MD, Weissman NJ, Dilsizian V, et al. Standardized myocardial segmentation and nomenclature for tomographic imaging of the heart. a statement for healthcare professionals from the Cardiac Imaging Committee of the Council on Clinical Cardiology of the American Heart Association. Circulation 2002;105(4):539–542. [DOI] [PubMed] [Google Scholar]
- 21.Altman DG, Bland JM. Diagnostic tests. I. Sensitivity and specificity. BMJ 1994;308(6943):1552. [DOI] [PMC free article] [PubMed] [Google Scholar]
- 22.Altman DG, Bland JM. Diagnostic tests. II. Predictive values. BMJ 1994;309(6947):102. [DOI] [PMC free article] [PubMed] [Google Scholar]
- 23.Deeks JJ, Altman DG. Diagnostic tests. IV. likelihood ratios. BMJ 2004;329(7458):168–169. [DOI] [PMC free article] [PubMed] [Google Scholar]
- 24.Altman D, Machin D, Bryant T, Gardner M. Statistics with confidence. London, England: BMJ Books, 2000; 108–110. [Google Scholar]
- 25.Team RDC. R. A Language and Environment for Statistical Computing. The R Project for Statistical Computing Web site. https://www.r-project.org. [Google Scholar]
- 26.Altman D, Machin D, Bryant T, Gardner M. Statistics with confidence. London, England: BMJ Books, 2000; 50–55. [Google Scholar]
- 27.Dang Q, Mazumdar S, Houck PR. Sample size and power calculations based on generalized linear mixed models with correlated binary outcomes. Comput Methods Programs Biomed 2008;91(2):122–127. [DOI] [PMC free article] [PubMed] [Google Scholar]
- 28.Schwitter J, Wacker CM, Wilke N, et al. MR-IMPACT II: Magnetic Resonance Imaging for Myocardial Perfusion Assessment in Coronary artery disease Trial: perfusion-cardiac magnetic resonance vs single-photon emission computed tomography for the detection of coronary artery disease: a comparative multicentre, multivendor trial. Eur Heart J 2013;34(10):775–781. [DOI] [PubMed] [Google Scholar]
- 29.Fearon WF, Bornschein B, Tonino PA, et al. Economic evaluation of fractional flow reserve-guided percutaneous coronary intervention in patients with multivessel disease. Circulation 2010;122(24):2545–2550. [DOI] [PubMed] [Google Scholar]
- 30.Bettencourt N, Chiribiri A, Schuster A, et al. Direct comparison of cardiac magnetic resonance and multidetector computed tomography stress-rest perfusion imaging for detection of coronary artery disease. J Am Coll Cardiol 2013;61(10):1099–1107. [DOI] [PubMed] [Google Scholar]
- 31.Bamberg F, Marcus RP, Becker A, et al. Dynamic myocardial CT perfusion imaging for evaluation of myocardial ischemia as determined by MR imaging. JACC Cardiovasc Imaging 2014;7(3):267–277. [DOI] [PubMed] [Google Scholar]
- 32.Huber AM, Leber V, Gramer BM, et al. Myocardium: dynamic versus single-shot CT perfusion imaging. Radiology 2013;269(2):378–386. [DOI] [PubMed] [Google Scholar]
- 33.Geleijns J, Joemai RMS, Dewey M, et al. Radiation exposure to patients in a multicenter coronary angiography trial (CORE 64). AJR Am J Roentgenol 2011;196(5):1126–1132. [DOI] [PubMed] [Google Scholar]
- 34.Chen MY, Shanbhag SM, Arai AE. Submillisievert median radiation dose for coronary angiography with a second-generation 320-detector row CT scanner in 107 consecutive patients. Radiology 2013;267(1):76–85. [DOI] [PMC free article] [PubMed] [Google Scholar]
- 35.So A, Hsieh J, Imai Y, et al. Prospectively ECG-triggered rapid kV-switching dual-energy CT for quantitative imaging of myocardial perfusion. JACC Cardiovasc Imaging 2012;5(8):829–836. [DOI] [PubMed] [Google Scholar]
- 36.Kim SM, Cho YK, Choe YH. Adenosine-stress dynamic myocardial perfusion imaging using 128-slice dual-source CT in patients with normal body mass indices: effect of tube voltage, tube current, and iodine concentration on image quality and radiation dose. Int J Cardiovasc Imaging 2014;30(Suppl 2):95–103. [DOI] [PubMed] [Google Scholar]
- 37.De Bruyne B, Fearon WF, Pijls NH, et al. Fractional flow reserve-guided PCI for stable coronary artery disease. N Engl J Med 2014;371(13):1208–1217. [DOI] [PubMed] [Google Scholar]
- 38.Ko BS, Wong DT, Nørgaard BL, et al. Diagnostic performance of transluminal attenuation gradient and noninvasive fractional flow reserve derived from 320-detector row CT angiography to diagnose hemodynamically significant coronary stenosis: an NXT substudy. Radiology 2016;279(1):75–83. [DOI] [PubMed] [Google Scholar]
Associated Data
This section collects any data citations, data availability statements, or supplementary materials included in this article.