

Abstract
Objective
To evaluate whether exogenously-induced hyperinsulinemia may increase the development of atherosclerosis.
Approach & Results
Hyperinsulinemia, induced by exogenous insulin implantation in high fat fed (60% fat HFD) ApoE−/− mice, exhibited insulin resistance, hyperglycemia and hyperinsulinemia. Atherosclerosis was measured by the accumulation of fat, macrophage, and extracellular matrix in the aorta. After 8 weeks on HFD, ApoE−/− mice were subcutaneously implanted with control (sham) or insulin pellet, and phlorizin, a SGLT1/2 inhibitor, for additional 8 weeks.
Intraperitoneal glucose tolerance test showed that plasma glucose levels were lower and insulin and IGF1 levels were 5.3 fold and 3.3 fold higher, respectively, in insulin implanted compared to sham-treated ApoE−/− mice. Plasma triglyceride, cholesterol and lipoprotein levels were decreased in mice with insulin implant, in parallel with increased lipoprotein lipase activities. Atherosclerotic plaque by en face and complexity staining showed significant reductions of fat deposits and expressions of VCAM-1, TNFα, IL6 and macrophages in arterial wall while exhibiting increased activation of pAKT and eNOS (p<0.05) comparing insulin implanted vs. sham HFD ApoE−/− mice. No differences were observed in atherosclerotic plaques between phlorizin treated and sham HFD ApoE−/− mice, except phlorizin significantly lowered plasma glucose and glycated hemoglobin levels while increased glucosuria. Endothelial function was improved only by insulin treatment through eNOS/NO activations and reduced pro-inflammatory (M1) and increased anti-inflammatory (M2) macrophages, which were inhibited by eNOS inhibitor.
Conclusions
Exogenous insulin decreased atherosclerosis by lowering inflammatory cytokines, macrophages, and plasma lipids in HFD induced hyperlipidemia, insulin resistant and mildly diabetic ApoE−/− mice.
Keywords: Hyperglycemia, atherosclerosis, insulin resistance, diabetes mellitus
Subject Code: Vascular Disease
Introduction
Hyperinsulinemia is associated with increased risk for cardiovascular diseases (CVDs) 1, 2 which are the major causes of morbidity and mortality among people with insulin-resistance and diabetes. Hyperinsulinemia is present in systemic insulin resistance or exogenous insulin treatments3. The associations of systemic insulin resistance and endogenous hyperinsulinemia with elevated risk of CVDs have been consistently shown even in the absence of diabetes and hyperglycemia4, 5. Clinical evidence to support exogenous induced hyperinsulinemia’s role to increase CVD risk is still uncertain 6. Recent clinical studies suggest exogenous treatment with long acting insulin did not increase CVD events; yet, other studies indicated that improved glycemic control with insulin in type 2 diabetes (T2D) did not reduce CVD events7–9.
Experimentally, insulin at physiological and hyperinsulinemic levels can induce many actions on the vasculature which may have both anti- and pro-atherogenic effects10, 11. Insulin’s potential anti-atherogenic effects include activating endothelial NOS (eNOS) and regulating the expressions of vascular adhesion molecule-112 (VCAM-1) and antioxidant enzymes heme oxygenase-1 (HO-1)12–14. The pro-atherogenic actions of insulin may involve the expressions of PAI-1, endothelin-1 and the migrations and proliferation of smooth muscle cells15–17. Previously, we reported that inhibition of insulin’s actions by deleting insulin receptors on the endothelial cells accelerated atherosclerosis whereas its enhancement with IRS-1 expression prevented or delayed the development of atherosclerosis12, 18. Further, the induction of endogenous hyperinsulinemia in a mouse model of heterogeneous global deletion of insulin receptor did not alter the atherosclerotic process 19. The present study characterized the effect of exogenous insulin to induce hyperinsulinemia and determined its effect in a mouse model of atherosclerosis. Further, we determined whether the normalization of hyperglycemia alone, using sodium glucose co-transporters 1 and 2 (SGLT(1/2)) inhibitor, in the presence of endogenous hyperinsulinemia, can also affect the atherosclerotic process.
Materials and Methods
Materials and Methods are available in the online-only Data Supplement.
Results
Effect of exogenous hyperinsulinemia on atherosclerosis in Apolipoprotein E deficient mice (ApoE−/−) mice on high fat diet (HFD)
Consistant with previous reports18, both sham treated (ApoE−/−) and insulin-implanted ApoE−/− mice, fed on HFD for 16 wks, increased body weights greater than RD-control mice (1.8 fold), similarly, (p<0.01, Fig. 1A). Systemic insulin resistance as assessed by IPITT, were elevated equally by HFD in ApoE−/− or insulin implanted ApoE−/− mice compared to RD fed mice (Fig. 1B, p<0.05). No differences were observed between sham-control and insulin-implanted ApoE−/− mice on HFD in fat distribution which was increased vs. RD fed mice (Suppl. Fig. I. A). However, insulin-implanted HFD ApoE−/− mice exhibited significant lowered fasting plasma glucose (Suppl. Fig. I. B) (87mg/dL vs. 205mg/dL), respectively, elevated fasting plasma insulin (2.6 fold) and IGF-1 levels (2.7 fold), compared to control ApoE−/− mice fed on HFD at 16 weeks (Fig. 1C and Suppl. Fig. I. C). However, insulin-treated HFD ApoE−/− mice showed reduction in plasma cholesterol levels by 33% (p<0.05), but had similar triglyceride levels (TG) compared to ApoE−/− mice on HFD (Suppl. Fig. II).
Figure 1. Effect of exogenous insulin implant-induced hyperinsulinemia on atherosclerosis and its complexity in the ApoE−/− mice fed on HFD.
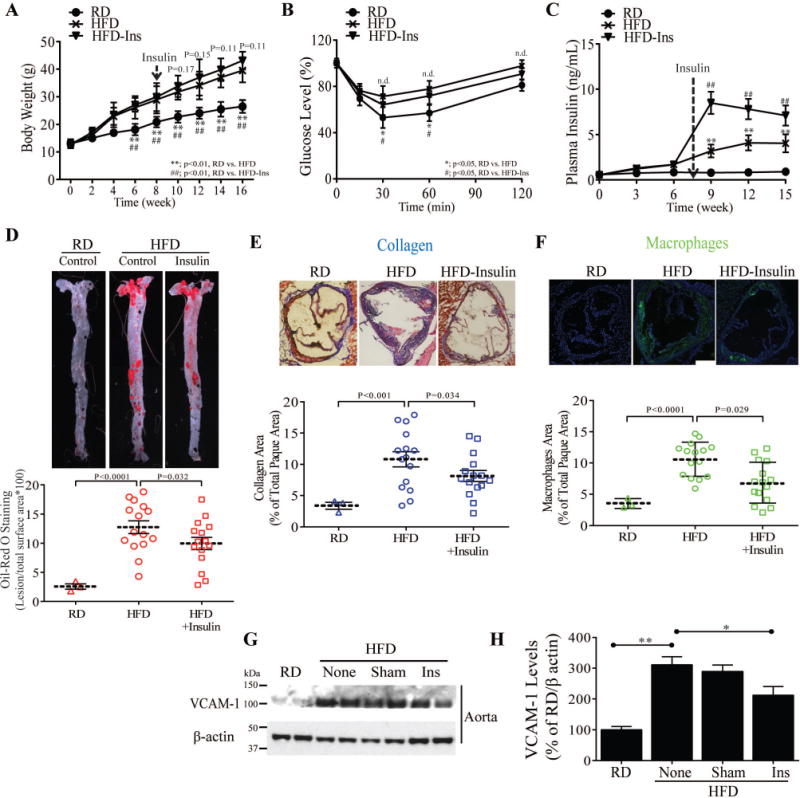
(A) Body weights of experimental animals during HFD feeding (n = 9 for control, n = 9 for insulin treatment). (B) Insulin sensitivity (IPITT) (C) Time course of plasma fasting insulin. (D) en face staining and quantification of aortas as percent of lesion area without or with insulin treatment (n = 10 per group). (E and F) Representative examples and quantification of cross-sections from the aortic sinus stained with trichrome (E) and MAC2(F). (G and H) Immunoblot and densitometry of VCAM-1 levels in aorta from control, insulin treated and phlorizin-treated ApoE−/− mice fed on HFD. All data are presented as mean ± SEM. *p < 0.05, **p < 0.01. P-values for panels A, B, and C were computed using linear mixed effects models to account for the repeated measures within animals over time. P-values for panels A, B, and C were computed using linear mixed effects models to account for the repeated measures within animals over time. P-values for panels D, E, F, and H were computed using general linear model (ANOVA). In all cases, post hoc t-tests with Tukey’s adjustment for multiple comparisons were conducted where overall F-tests were significant to ascertain the location of any significant pairwise differences.
The severity and complexity of atherosclerotic lesions in the aortic roots and descending aorta were analyzed by multiple methods20. After 16 weeks Sudan IV en face staining in HFD sham-treated mice was increased by 6.7 fold (p<0.001), (Fig. 1D) and by 5 fold (p<0.0001) in insulin-implanted HFD vs. RD fed controls. However, the extent of fatty lesions were decreased by 20% (p<0.05) in insulin-implanted, compared with sham-treated HFD-fed ApoE−/− mice (Fig. 1D). Analysis of serial sections throughout the aortic root showed that insulin-implanted ApoE−/− mice exhibited a significant reduction in lesion area stained for collagen (Trichrome) (15%, p<0.05), and macrophage content (MAC2) (26%, p<0.05) compared to sham-treated ApoE−/− mice on HFD (Fig. 1E and F) but no difference was observed in SMC content. The protein expression of VCAM-1 levels a marker for atherosclerosis and down regulated by insulin12, 18,21 were increased in the aorta of HFD-ApoE−/− mice by 307±47% vs. RD fed mice (p<0.01, Fig 1G), which was reduced in the insulin-implanted ApoE−/− mice by 37% (p<0.01) vs. HFD-sham ApoE−/− mice (Fig. 1H).
Effect of lowering glucose levels by phlorizin
To determine the effect of lowering plasma glucose on the extent of atherosclerosis, the action of sodium glucose co-transporters inhibitor (SGLT (1/2)), phlorizin were studied (Suppl. Fig. III). Glycated hemoglobin (HbA1c) and albumin levels in the plasma from HFD-ApoE−/− mice (Fig. 2A) were decreased by treatments with insulin or phlorizin equally (p<0.05) compared to HFD sham-treated mice, almost to the levels of RD mice. However, urinary glucose was increased only in phlorizin-treated ApoE−/− mice, compared to other groups of ApoE−/− mice fed on HFD (Fig. 2B). There were no differences in the body weights between phlorizin-treated or untreated HFD-ApoE−/− mice, although insulin-treated ApoE−/− mice weighed slightly more than other two groups of mice (Suppl. Fig. IV). IP-GTT showed HFD treatment increased plasma glucose to > 400mg/dL at 30 min indicating mild diabetes. The incremental area under the curve and plasma glucose peak levels from insulin-implanted and phlorizin-treated ApoE−/− mice at both 1 and 2 hr were half as those in the HFD-sham-treated ApoE−/− mice (P < 0.001) (Fig. 2C). After adding either sham or phlorizin in drinking water 8 weeks after the initiation of HFD, the extent of the atherosclerosis by en face assessment, macrophage and collagen content and plaque necrosis in the aortic root did not differ in HFD- ApoE−/− mice (Fig. 2D–G). However the severity of atherosclerosis and necrosis were significantly decreased in the insulin-treated ApoE−/− mice (p=0.039, p=0.017, respectively; Fig. 2D and 2F) comparing to sham-treated HFD-ApoE−/− mice with and without phlorizin. However, macrophage proliferation (Ki67 staining) and apoptosis (TUNEL) were not changed by insulin treatment in the aortic wall vs. other conditions (Suppl. Fig. V. C and D)
Figure 2. Effect of lowering HFD-induced plasma glucose levels on atherosclerosis.
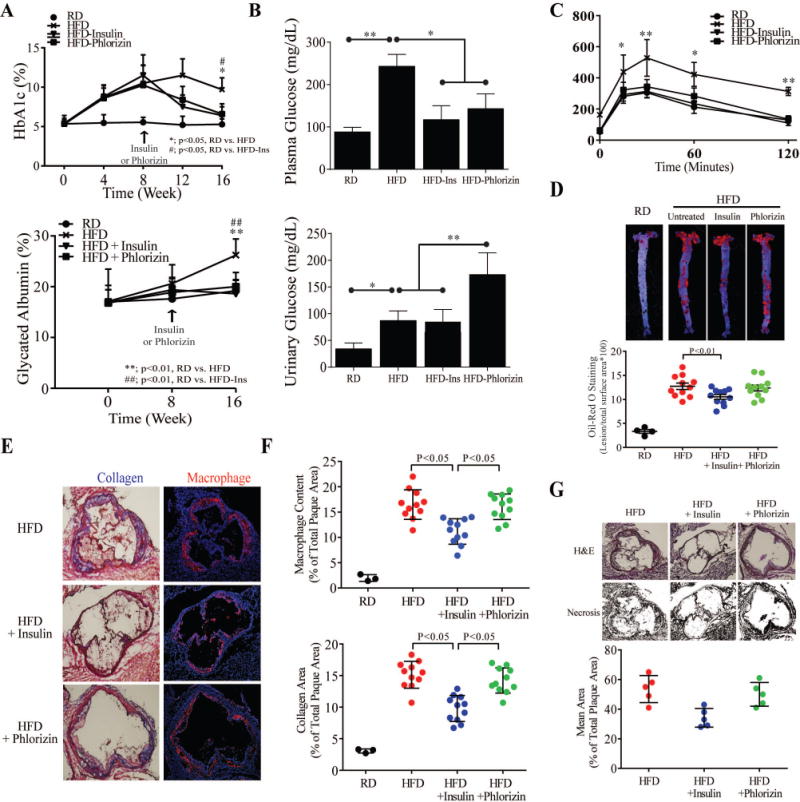
(A) Time-response curves for inhibitory effects of phlorizin on plasma HbA1c (Upper) and glycated albumin (Lower) from ApoE−/− and insulin treated ApoE−/− mice with feeding HFD. (B) Fasting plasma and urinary glucose measurements from control and insulin or phlorizin treated HFD-ApoE−/− mice. (C) Glucose tolerance test (IPGTT) (n = 8 for control, insulin treatment and phlorizin treatment). (D) Oil Red O staining (Upper) and quantification (Lower) of aortas as percent of lesion area from the same condition as A-C (n = 11 per group). (E) Quantification of cross-sections from the aortic sinus stained for collagen (Upper) and macrophages (Lower). (F) Representative sections of hematoxylin and eosin-stained aortic root sections and quantification of necrotic area in a subgroup of 6 control lesions, insulin-treated lesions and phlorizin-treated lesions with statistically identical lesion area. All data are presented as mean ± SEM. *p < 0.05, **p < 0.01. P-values for panels A and C were computed using linear mixed effects models to account for the repeated measures within animals over time. P-values for panels B, D, E, F, and G were computed using general linear model (ANOVA). In all cases, post hoc t-tests with Tukey’s adjustment for multiple comparisons were conducted where overall F-tests were significant to ascertain the location of any significant pairwise differences.
Effect on plasma lipoproteins and inflammatory cytokines
Changes in lipoprotein levels were studied18, 22 and no significant difference in total plasma cholesterol and TG levels between phlorizin-treated or sham-treated HFD-ApoE−/− mice was observed. However, insulin-implanted ApoE−/− mice exhibited reduced total plasma cholesterol by 43% (p<0.05) but not in TG levels (Fig. 3A and B). Lipoprotein profile did not differ between phlorizin-treated or sham-treated HFD-ApoE−/− mice. Insulin-implanted ApoE−/− mice exhibited greater elevation of HDL and diminished levels of VLDL and LDL (Fig. 3C, Suppl. Fig. VI. A and B). Further, LPL activity relative to plasma volume were significantly higher in insulin-implanted ApoE−/− mice than phlorizin-treated or sham-treated HFD-ApoE−/− mice (P < 0.05; Suppl. Fig. VII. A and B). In subcutaneous white adipose tissue (scWAT) and liver, exogenous insulin treatment increased the level of Lpl mRNA, which were not altered by phlorizin-treated or sham-treated HFD-ApoE−/− mice (Suppl. Fig. VII. C and D).
Figure 3. Effect of exogenous insulin and phlorizin on lipoprotein and inflammatory cytokine levels in plasma of HFD-ApoE−/− mice.
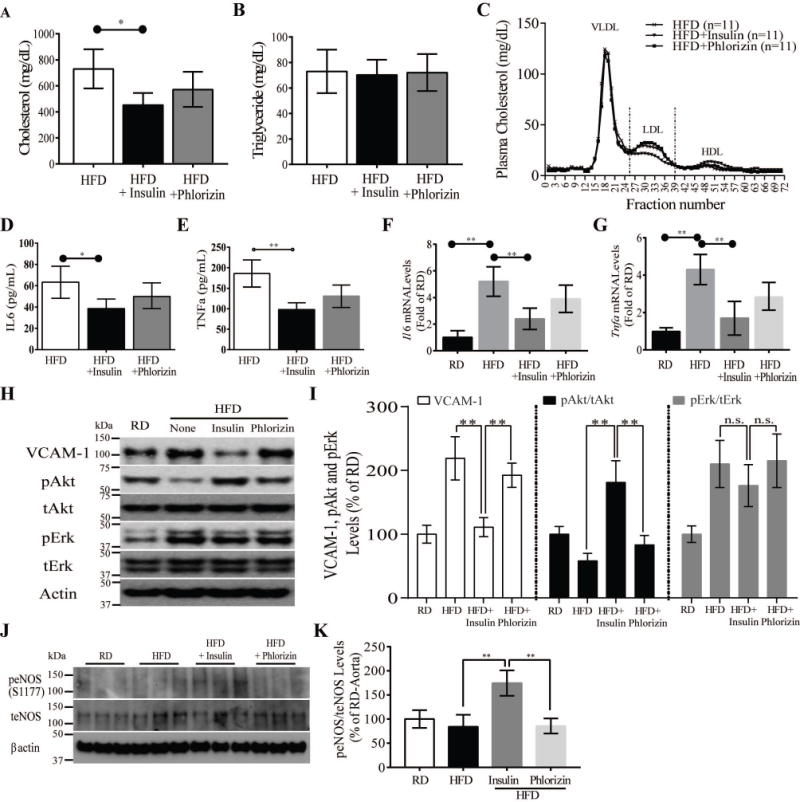
(A and B) Total plasma cholesterol (A) and triglycerides (B) of HFD-fed control, insulin treated and phlorizin-treated ApoE−/− mice (n = 6, respectively). (C) Pooled plasma samples were subjected to fast performance liquid chromatography gel-filtration, and the fractions were assayed for cholesterol concentration. (D and E) TNF-α (D) and IL6 (E) plasma levels from all ApoE−/− mice. (F and G) The gene expressions of the inflammatory markers Il6 mRNA (F) and Tnfα mRNA (G) were measured in pooled aortic arch from all ApoE−/− mice. (H and I) Immunoblot and densitometry of Akt and Erk activity, and VCAM-1 levels in aorta from all ApoE−/− mice. (J and K) Immunoblot and densitometry of eNOS activity in aorta from all ApoE−/− mice. All data are presented as mean ± SEM and representative of three independent experiments. *p < 0.05, **p < 0.01. P-values were computed using general linear model (ANOVA). Post hoc t-tests with Tukey’s adjustment for multiple comparisons were conducted where overall F-tests were significant to ascertain the location of any significant pairwise differences.
Proinflammatory cytokines, interleukin 6 (IL6), and tumor necrosis factor alpha (TNFα) levels in the plasma and aorta were reduced in insulin-implanted ApoE−/− mice by 42%, and 38%, respectively (P<0.001) compared with sham-treated ApoE−/− mice 23–25. Phlorizin treated HFD-ApoE−/− mice did reduce plasma IL6 and TNFα levels although their levels trended lower (Fig. 3D and E). Expression of Il6, Tnfα and Vcam-1 mRNA levels in the aortic roots were also elevated in HFD sham-treated ApoE−/− mice compared to RD fed mice, but they were not reduced in phlorizin-treated HFD-ApoE−/− mice (Fig. 3F–G). Interestingly, Akt activation (pAkt) were significantly increased in insulin-implanted vs. HFD sham-treated and phlorizin treated ApoE−/− mice (Fig. 3H and I) (p<0.01, p<0.01 & p<0.01) respectively. Since nitric oxide (NO) can be induced by insulin and pAkt26, we assessed the activation of eNOS in the aorta, which were increased in insulin-implanted ApoE−/− compared to phlorizin-treated and sham-treated HFD ApoE−/− mice (Fig. 3J and K) (p<0.01).
Changes in circulating and tissue monocytes and macrophages polarization
Similar to previous reports, 27–30 circulating Ly6C+/CCR2+ monocytes, as measured by fluorescence-activated cell sorting (FACS) analysis, were significantly increased by 34% in HFD-sham-treated compared with RD-ApoE−/− mice (p<0.01). However, there were no differences in circulating Ly6C+/CCR2+ monocyte levels amongst HFD-ApoE−/− mice with sham, phlorizin and insulin treatments (Suppl. Fig. VIII). FACS analysis of isolated aortic cells showed that the levels of inflammatory aortic macrophages (F4/80+/CD45+) were significantly elevated by 3.7 fold (p<0.01) in HFD-sham-treated vs. RD-ApoE−/− mice, which were decreased by 47% in insulin implanted ApoE−/− mice (p<0.01, Fig. 4A). No differences in macrophages were noted between phlorizin-treated and sham-treated HFD-ApoE−/− mice (Fig. 4A). FACS analysis of the proportion of macrophages exhibiting pro-inflammatory M1 (CD206−/CD80+) or anti-inflammatory M2 (CD206+/CD80−) cell surface markers showed HFD increased M1 pro-inflammatory macrophages and decreased M2 anti-inflammatory macrophages in the aorta. In contrast, exogenous insulin treatment shifted the macrophage population away from M1 towards M2 subtype, but phlorizin was ineffective (Fig. 4B). In addition, insulin treatment decreased the expression of Ccr7, Cxcl10 and iNos in M1 macrophages (Fig. 4C) and increased M2 related genes such as Arg1, Ccl17 and Cd206 (Fig. 4D). To identify the source of circulating TNFα and IL6, gene expression of Tnfα and Il6 in white adipose tissue (WAT) and brown adipose tissues from the HFD-ApoE−/− mice were studied. Tnfα and Il6 mRNA expressions in subcutaneous WAT (scWAT) was inhibited by exogenous insulin treatment but not by phlorizin treatment (Suppl. Fig. IX). In addition, MAC2-DAB+ and F4/80+ immunostaining macrophages (M1) were abundant in scWAT from both HFD-ApoE−/− mice in the absence or presence of phlorizin treatment but they were decreased in insulin-treated HFD-ApoE−/− mice (Fig. 4E). Flow cytometry showed that M1 subtypes were reduced and M2 subtypes were increased in stromal vascular fraction (SVF) cells isolated from exogenous insulin treated HFD-ApoE−/− mice compared to other groups of mice (Fig. 4F).
Figure 4. Effect of exogenous insulin and phlorizin on HFD-induced macrophge plasticity in aorta and subcutaneous white adipose tissue.
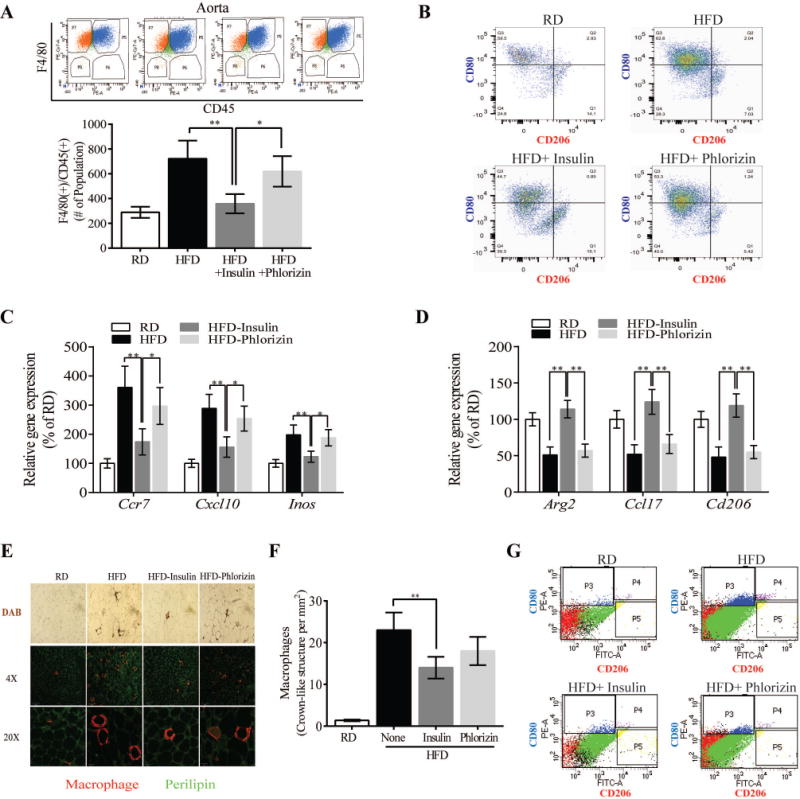
(A) Total number of retrieved F4/80(+)/CD45(+) inflammatory macrophages per aorta in ApoE null mice fed on either RD or HFD in combination with insulin and phlorizin. (B) FACS analysis shows staining of CD80 (M1) or CD206 (M2) in aorta from the mice. Panels show dot plot, and representative percentages indicate each subset as a proportion of total F4/80+/CD11b+/CD45+ macrophages. (C and D) M1 (Ccr7, Cxcl10, and iNos) and M2 (Arg1, Ccl17, and Cd206) genes expression in arota. Data show % in gene expression by RT-qPCR. (E) DAB and immunostaining of adipose tissue macrophages in scWAT. (F) FACS analysis shows staining of CD80 or CD206 in the SVF of scWAT from these mice. Results are pooled from 3 independent experiments with 2–5 mice per group. All data are presented as mean ± SEM and representative of three independent experiments. *p < 0.05, **p < 0.01. P-values were computed using general linear model (ANOVA). Post hoc t-tests with Tukey’s adjustment for multiple comparisons were conducted where overall F-tests were significant to ascertain the location of any significant pairwise differences.
Endothelial function and eNOS/NO signaling on M1/M2 polarization
To determine directly whether NO can affect M1/M2, nitric oxide donor, S-Nitrosoglutathione (GSNO) was added to THP-1 cells in the presence and absence of LPS and interferon-ᵞ(IFN-ᵞ). FACS analysis showed that LPS/IFN-ᵞ treatment increased CD80+/CD206− sub-population, which were inhibited only by GSNO, while insulin or phlorizin’s have no effect (Fig. 5A–C). Moreover, qRT-PCR analysis of pro-inflammatory genes (Tnfα and Il6) and M1 polarized genes (iNos and Ccr7) expression also supported that GSNO inhibits LPS/IFN-ᵞ mediated inflammation and increased in M2 polarization (Fig. 5D and E). To explore the relationship between endothelial eNOS/NO signaling and changing M1 and M2 phenotype, we co-cultured primary lung endothelial cells from ECIRS1 mice which exhibited increased Akt/eNOS signaling and enhanced NO production with THP-1 cells. The induction of M1 (CD80+/CD206−) was decreased and M2 (CD80−/CD206+) was enhanced in EC from ECIRS1 mice after insulin stimulation compared to control EC (Fig. 5F–H). However, the addition of an inhibitor of eNOS activities, L-NAME attenuated the decrease M1 and increase in M2 polarization, suggesting that enhancing eNOS/NO activity in EC can decrease M1/M2 ratio in the aorta (Fig. 5F–H).
Figure 5. Effect of endothelial function via NO production on M1 and M2 macrophagy polarization in vitro.
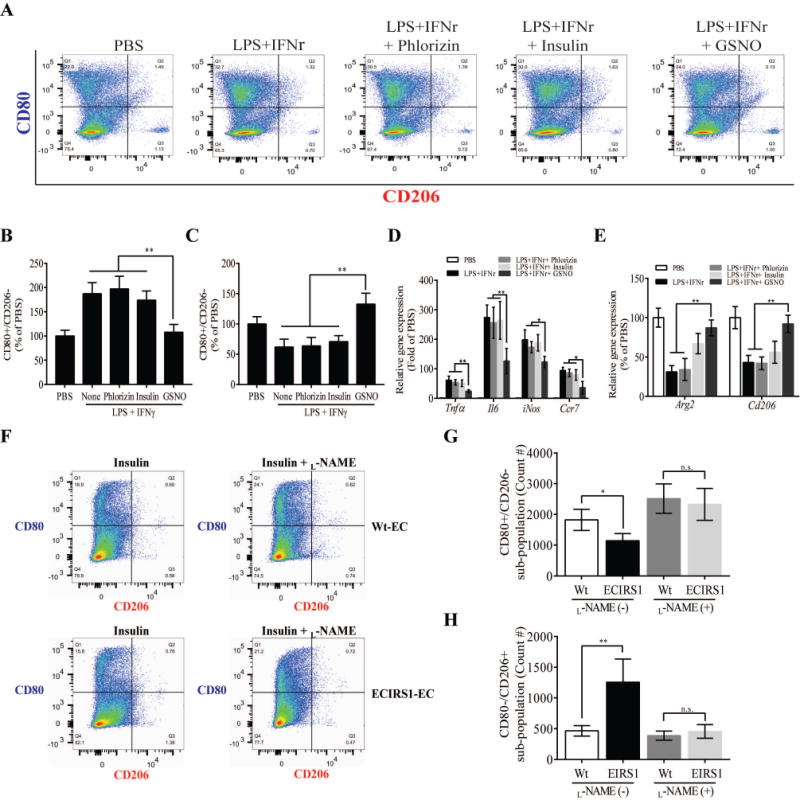
(A) FACS analysis shows staining of CD80 (M1) or CD206 (M2) in THP-1 cells stimulated by LPS and IFNr with Phlorizin, insulin, or GSNO. (B and C) Quantification of FACS analysis for CD80+/CD206- (M1) and CD80−/CD206+ (M2) in THP-1 cells (A). (D) Inflammatory (Tnfα and Il6) and polarized M1 (Ccr7, Cxcl10, and iNos) gene in THP-1 cells under the same condition as (A). (E) Polarized M2 (Arg1, Ccl17, and Cd206) genes expression in THP-1. (F) THP-1 cells were cocultured with EC from either Wt or ECIRS1 mice, stimulated with insulin in the absence or presence of L-NAME treatment. (G and H) Quantification of FACS analysis for CD80+/CD206- (M1) and CD80−/CD206+ (M2). All data are presented as mean ± SEM and representative of three independent experiments. *p < 0.05, **p < 0.01. P-values were computed using general linear model (ANOVA). Post hoc t-tests with Tukey’s adjustment for multiple comparisons were conducted where overall F-tests were significant to ascertain the location of any significant pairwise differences.
Discussion
Hyperinsulinemia due to either endogenous origin such as insulin resistance or exogenous sources as in insulin therapy, has been implicated clinically to enhance the development of atherosclerosis5, 31, 32. Previously we have reported that the severity of atherosclerosis was not affected by endogenously induced hyperinsulinemia in the absence of systemic insulin resistance19. In contrast, we reported here that the effect of exogenously applied insulin decreased the severity of atherosclerosis in ApoE−/− mice on HFD which generated hyperinsulinemia, insulin resistance and hyperglycemia. Unlike the endogenously generated hyperinsulinemic ApoE−/− model, the present study was performed in ApoE−/− mice on HFD which induced weight gain, insulin resistance, elevated levels of abdominal and visceral fat, hyperglycemia and hyperinsulinemia, which were elevated further (2x) by insulin implants. The implanted insulin improved glucose tolerance tests and significantly increased IGF1 levels, but did not affect weight gain or fat mass. The inability of endogenously derived hyperinsulinemia to affect the atherosclerosis in ApoE−/− mice with IR partial deletion, as reported previously, suggests that doubling of plasma insulin levels were not adequate to affect the atherosclerotic process19. The elevation of IGF-1 levels was unlikely to affect the atherosclerotic process since the IGF-1 levels attained by insulin treatment only returned them to normal and physiological levels.
Since multiple metabolic parameters were changed with the insulin implant, due to the metabolic actions of hyperinsulinemia, the explanation for the decrease in atherosclerosis is likely to be complex. Major differences induced by the exogenous insulin implants compared to endogenous induced hyperinsulinemia were lowering of plasma glucose, lipoproteins and inflammatory markers. To test whether the singular effect of glycemic control by implanting insulin in this insulin resistant and diabetic model can affect atherosclerosis, glycemic control was improved using phlorizin, a selective inhibitor of SGLT(1/2), which enhanced glycosuria, decreased HbA1c and glycated albumin, without changes in lipoprotein profile33, 34. Interestingly, lowering plasma glucose alone, did not affect the severity of atherosclerosis in the HFD-fed ApoE−/− mice model. These results suggest that normalizing plasma glucose alone without decreasing fat composition and altering inflammatory process was inadequate to affect the atherosclerosis process in insulin resistance and diabetes. These findings in the ApoE−/− mice are consistent with clinical trials which have shown glycemic control alone may not decrease cardiovascular disease (CVD) in people with T2D2, 7–9. Our study supports Yoon et al who showed that chronic insulin treatment has beneficial effects on dyslipidaemia, IL6 levels and atherosclerosis in Ldlr−/− mice with diet-induced obesity and diabetes35.
Recently, EMPA-REG Outcome study reported that SGLT2 inhibitor treatment reduced cardiovascular mortality and heart failure in patients with T2D, although the incidence of fatal/nonfatal myocardial infarction and nonfatal stroke were not changed. This indicates that the beneficial effect of SGLT2 inhibitor was driven by improvement in the myocardial function, which occurred after a few months of treatments36, 37 rather than reversing atherosclerotic lesion, which will require years to occur38. Contrary to our study, Nagareddy et al39 has reported that lowering glucose levels by SGLT2 inhibitor decreased diabetes-induced monocytosis and myelopoiesis in STZ-induced diabetic and Akita mice and decreased atherosclerotic lesions in STZ-induced Ldlr−/− mice. However, their study differed significantly from our study, since streptozotocin or Akita induced diabetes are insulin deficient models whereas our ApoE−/− mice have hyperinsulinemia and mild diabetes due high fat diet (60%), which mimics T2D40.
Another potential anti-atherosclerotic effect of hyperinsulinemia in the HFD fed ApoE−/− mice could be due to improvement in lipoprotein profile. Insulin implant significantly lowered VLDL and LDL levels and decreased atherosclerosis in ApoE−/− mice41. Interestingly, the levels of atherosclerosis in insulin-treated ApoE−/− mice, was less than those in ApoE−/− mice fed Western diet (WD, 42% of Kcal) although there were no differences in plasma cholesterol levels between these two ApoE−/− models (Suppl. Fig. X). Exogenous insulin implant also significantly reduced various inflammatory circulating cytokines and their expression on the aorta including IL6, TNFα and VCAM-1. Besides the reduction of inflammatory cytokines, our results also suggested that exogenously-treated hyperinsulinemia decreased macrophages in the aorta, but did not affect systemic monocytosis induced by HFD. The improvements of insulin’s anti-inflammatory actions are likely to be mediated via several mechanisms such as decreasing VCAM-1 expression, activation of eNOS in the endothelial cells and altering the M1/M2 ratio toward the anti-inflammatory profile.
In summary, this report demonstrated that exogenously induced hyperinsulinemia, even in the presence of insulin resistance, hyperglycemia and hyperlipidemia, can decrease the severity and complexity of the atherosclerotic process. The anti-atherogenic effect of the exogenously induced hyperinsulinemia is not due to the lowering of plasma glucose alone, but is also related to decreasing LDL and VLDL levels and reductions of inflammatory cytokines. The effect of insulin on improving lipid profile is probably related to its actions in the liver and the activation of lipoprotein lipase as previously reported42, 43. However, insulin also had significant anti-inflammatory actions of inhibiting VCAM-1 and activities eNOS in the endothelium to decrease monocyte uptake into the vascular wall and the expression of the various inflammatory actions. Clinical significance of these findings in rodent models of atherosclerosis and insulin resistance will need to be evaluated further.
Supplementary Material
Highlights.
Lowering glucose using SGLT(1/2) inhibitor did not affect the severity of atherosclerosis in the fed ApoE−/− mice.
Insulin-implanted ApoE−/− mice exhibited greater elevation of HDL and diminished levels of VLDL and LDL.
Exogenous insulin treatment has no effect on circulating monocytes (CCR2/Ly6C) but decreases inflammatory macrophages (F4/80/CD45) in aorta of ApoE−/− mice fed an HFD.
Improved endothelial function through eNOS/NO activations reduced pro-inflammatory (M1) and increased anti-inflammatory (M2) macrophages
Acknowledgments
We are grateful to Dr. Susan Bonner-Weir at the Joslin Diabetes Center for Phlorizin used in this study.
Sources of Funding
The study was supported by NIH grants, R01DK053105 and P30DK036836.
Nonstandard Abbreviations and Acronyms
- CVD
Cardiovascular diseases
- HFD
High Fat Diet
- ApoE−/− mice
Apolipoprotein E deficient mice
- SGLT (1/2)
Sodium glucose co-transporters inhibitor (1/2)
- eNOS
Endothelial NOS
- VCAM-1
Vascular adhesion molecule-1
- TNFα
Tumor necrosis factor alpha
- IL6
Interleukin 6
Footnotes
Disclosures
None
References
- 1.Pyorala K. Relationship of glucose tolerance and plasma insulin to the incidence of coronary heart disease: Results from two population studies in finland. Diabetes care. 1979;2:131–141. doi: 10.2337/diacare.2.2.131. [DOI] [PubMed] [Google Scholar]
- 2.Despres JP, Lamarche B, Mauriege P, Cantin B, Dagenais GR, Moorjani S, Lupien PJ. Hyperinsulinemia as an independent risk factor for ischemic heart disease. The New England journal of medicine. 1996;334:952–957. doi: 10.1056/NEJM199604113341504. [DOI] [PubMed] [Google Scholar]
- 3.Wilcox G. Insulin and insulin resistance. The Clinical biochemist. Reviews. 2005;26:19–39. [PMC free article] [PubMed] [Google Scholar]
- 4.Gast KB, Tjeerdema N, Stijnen T, Smit JW, Dekkers OM. Insulin resistance and risk of incident cardiovascular events in adults without diabetes: Meta-analysis. PloS one. 2012;7:e52036. doi: 10.1371/journal.pone.0052036. [DOI] [PMC free article] [PubMed] [Google Scholar]
- 5.Reaven G. Insulin resistance and coronary heart disease in nondiabetic individuals. Arteriosclerosis, thrombosis, and vascular biology. 2012;32:1754–1759. doi: 10.1161/ATVBAHA.111.241885. [DOI] [PubMed] [Google Scholar]
- 6.Wallia A, Molitch ME. Insulin therapy for type 2 diabetes mellitus. Jama. 2014;311:2315–2325. doi: 10.1001/jama.2014.5951. [DOI] [PubMed] [Google Scholar]
- 7.Gerstein HC, Bosch J, Dagenais GR, Diaz R, Jung H, Maggioni AP, Pogue J, Probstfield J, Ramachandran A, Riddle MC, Ryden LE, Yusuf S. Basal insulin and cardiovascular and other outcomes in dysglycemia. The New England journal of medicine. 2012;367:319–328. doi: 10.1056/NEJMoa1203858. [DOI] [PubMed] [Google Scholar]
- 8.Patel A, MacMahon S, Chalmers J, Neal B, Billot L, Woodward M, Marre M, Cooper M, Glasziou P, Grobbee D, Hamet P, Harrap S, Heller S, Liu L, Mancia G, Mogensen CE, Pan C, Poulter N, Rodgers A, Williams B, Bompoint S, de Galan BE, Joshi R, Travert F. Intensive blood glucose control and vascular outcomes in patients with type 2 diabetes. The New England journal of medicine. 2008;358:2560–2572. doi: 10.1056/NEJMoa0802987. [DOI] [PubMed] [Google Scholar]
- 9.Gerstein HC, Miller ME, Byington RP, Goff DC, Jr, Bigger JT, Buse JB, Cushman WC, Genuth S, Ismail-Beigi F, Grimm RH, Jr, Probstfield JL, Simons-Morton DG, Friedewald WT. Effects of intensive glucose lowering in type 2 diabetes. The New England journal of medicine. 2008;358:2545–2559. doi: 10.1056/NEJMoa0802743. [DOI] [PMC free article] [PubMed] [Google Scholar]
- 10.Jiang ZY, Lin YW, Clemont A, Feener EP, Hein KD, Igarashi M, Yamauchi T, White MF, King GL. Characterization of selective resistance to insulin signaling in the vasculature of obese zucker (fa/fa) rats. The Journal of clinical investigation. 1999;104:447–457. doi: 10.1172/JCI5971. [DOI] [PMC free article] [PubMed] [Google Scholar]
- 11.King GL, Park K, Li Q. Selective insulin resistance and the development of cardiovascular diseases in diabetes: The 2015 edwin bierman award lecture. Diabetes. 2016;65:1462–1471. doi: 10.2337/db16-0152. [DOI] [PMC free article] [PubMed] [Google Scholar]
- 12.Rask-Madsen C, Li Q, Freund B, Feather D, Abramov R, Wu IH, Chen K, Yamamoto-Hiraoka J, Goldenbogen J, Sotiropoulos KB, Clermont A, Geraldes P, Dall’Osso C, Wagers AJ, Huang PL, Rekhter M, Scalia R, Kahn CR, King GL. Loss of insulin signaling in vascular endothelial cells accelerates atherosclerosis in apolipoprotein e null mice. Cell metabolism. 2010;11:379–389. doi: 10.1016/j.cmet.2010.03.013. [DOI] [PMC free article] [PubMed] [Google Scholar]
- 13.Geraldes P, Yagi K, Ohshiro Y, He Z, Maeno Y, Yamamoto-Hiraoka J, Rask-Madsen C, Chung SW, Perrella MA, King GL. Selective regulation of heme oxygenase-1 expression and function by insulin through irs1/phosphoinositide 3-kinase/akt-2 pathway. The Journal of biological chemistry. 2008;283:34327–34336. doi: 10.1074/jbc.M807036200. [DOI] [PMC free article] [PubMed] [Google Scholar]
- 14.Jiang ZY, He Z, King BL, Kuroki T, Opland DM, Suzuma K, Suzuma I, Ueki K, Kulkarni RN, Kahn CR, King GL. Characterization of multiple signaling pathways of insulin in the regulation of vascular endothelial growth factor expression in vascular cells and angiogenesis. The Journal of biological chemistry. 2003;278:31964–31971. doi: 10.1074/jbc.M303314200. [DOI] [PubMed] [Google Scholar]
- 15.Oliver FJ, de la Rubia G, Feener EP, Lee ME, Loeken MR, Shiba T, Quertermous T, King GL. Stimulation of endothelin-1 gene expression by insulin in endothelial cells. The Journal of biological chemistry. 1991;266:23251–23256. [PubMed] [Google Scholar]
- 16.Schneider DJ, Absher PM, Ricci MA. Dependence of augmentation of arterial endothelial cell expression of plasminogen activator inhibitor type 1 by insulin on soluble factors released from vascular smooth muscle cells. Circulation. 1997;96:2868–2876. doi: 10.1161/01.cir.96.9.2868. [DOI] [PubMed] [Google Scholar]
- 17.Nagai M, Kamide K, Rakugi H, Takiuchi S, Imai M, Kida I, Matsukawa N, Higaki J, Ogihara T. Role of endothelin-1 induced by insulin in the regulation of vascular cell growth. American journal of hypertension. 2003;16:223–228. doi: 10.1016/s0895-7061(02)03251-x. [DOI] [PubMed] [Google Scholar]
- 18.Park K, Mima A, Li Q, Rask-Madsen C, He P, Mizutani K, Katagiri S, Maeda Y, Wu IH, Khamaisi M, Preil SR, Maddaloni E, Sorensen D, Rasmussen LM, Huang PL, King GL. Insulin decreases atherosclerosis by inducing endothelin receptor b expression. JCI insight. 2016:1. doi: 10.1172/jci.insight.86574. [DOI] [PMC free article] [PubMed] [Google Scholar]
- 19.Rask-Madsen C, Buonomo E, Li Q, Park K, Clermont AC, Yerokun O, Rekhter M, King GL. Hyperinsulinemia does not change atherosclerosis development in apolipoprotein e null mice. Arteriosclerosis, thrombosis, and vascular biology. 2012;32:1124–1131. doi: 10.1161/ATVBAHA.111.239558. [DOI] [PMC free article] [PubMed] [Google Scholar]
- 20.Li Q, Park K, Li C, Rask-Madsen C, Mima A, Qi W, Mizutani K, Huang P, King GL. Induction of vascular insulin resistance and endothelin-1 expression and acceleration of atherosclerosis by the overexpression of protein kinase c-beta isoform in the endothelium. Circulation research. 2013;113:418–427. doi: 10.1161/CIRCRESAHA.113.301074. [DOI] [PMC free article] [PubMed] [Google Scholar]
- 21.Cybulsky MI, Iiyama K, Li H, Zhu S, Chen M, Iiyama M, Davis V, Gutierrez-Ramos JC, Connelly PW, Milstone DS. A major role for vcam-1, but not icam-1, in early atherosclerosis. The Journal of clinical investigation. 2001;107:1255–1262. doi: 10.1172/JCI11871. [DOI] [PMC free article] [PubMed] [Google Scholar]
- 22.Third report of the national cholesterol education program (ncep) expert panel on detection, evaluation, and treatment of high blood cholesterol in adults (adult treatment panel iii) final report. Circulation. 2002;106:3143–3421. [PubMed] [Google Scholar]
- 23.Ait-Oufella H, Taleb S, Mallat Z, Tedgui A. Recent advances on the role of cytokines in atherosclerosis. Arteriosclerosis, thrombosis, and vascular biology. 2011;31:969–979. doi: 10.1161/ATVBAHA.110.207415. [DOI] [PubMed] [Google Scholar]
- 24.Ohta H, Wada H, Niwa T, Kirii H, Iwamoto N, Fujii H, Saito K, Sekikawa K, Seishima M. Disruption of tumor necrosis factor-alpha gene diminishes the development of atherosclerosis in apoe-deficient mice. Atherosclerosis. 2005;180:11–17. doi: 10.1016/j.atherosclerosis.2004.11.016. [DOI] [PubMed] [Google Scholar]
- 25.Huber SA, Sakkinen P, Conze D, Hardin N, Tracy R. Interleukin-6 exacerbates early atherosclerosis in mice. Arteriosclerosis, thrombosis, and vascular biology. 1999;19:2364–2367. doi: 10.1161/01.atv.19.10.2364. [DOI] [PubMed] [Google Scholar]
- 26.Pitocco D, Zaccardi F, Di Stasio E, Romitelli F, Santini SA, Zuppi C, Ghirlanda G. Oxidative stress, nitric oxide, and diabetes. The review of diabetic studies : RDS. 2010;7:15–25. doi: 10.1900/RDS.2010.7.15. [DOI] [PMC free article] [PubMed] [Google Scholar]
- 27.Carantoni M, Abbasi F, Chu L, Chen YD, Reaven GM, Tsao PS, Varasteh B, Cooke JP. Adherence of mononuclear cells to endothelium in vitro is increased in patients with niddm. Diabetes care. 1997;20:1462–1465. doi: 10.2337/diacare.20.9.1462. [DOI] [PubMed] [Google Scholar]
- 28.de Luca C, Olefsky JM. Inflammation and insulin resistance. FEBS letters. 2008;582:97–105. doi: 10.1016/j.febslet.2007.11.057. [DOI] [PMC free article] [PubMed] [Google Scholar]
- 29.Shoelson SE, Herrero L, Naaz A. Obesity, inflammation, and insulin resistance. Gastroenterology. 2007;132:2169–2180. doi: 10.1053/j.gastro.2007.03.059. [DOI] [PubMed] [Google Scholar]
- 30.Odegaard JI, Chawla A. Mechanisms of macrophage activation in obesity-induced insulin resistance. Nature clinical practice. Endocrinology & metabolism. 2008;4:619–626. doi: 10.1038/ncpendmet0976. [DOI] [PMC free article] [PubMed] [Google Scholar]
- 31.Semenkovich CF. Insulin resistance and atherosclerosis. The Journal of clinical investigation. 2006;116:1813–1822. doi: 10.1172/JCI29024. [DOI] [PMC free article] [PubMed] [Google Scholar]
- 32.Wingard DL, Barrett-Connor EL, Ferrara A. Is insulin really a heart disease risk factor. Diabetes care. 1995;18:1299–1304. doi: 10.2337/diacare.18.9.1299. [DOI] [PubMed] [Google Scholar]
- 33.Blondel O, Bailbe D, Portha B. Insulin resistance in rats with non-insulin-dependent diabetes induced by neonatal (5 days) streptozotocin: Evidence for reversal following phlorizin treatment. Metabolism: clinical and experimental. 1990;39:787–793. doi: 10.1016/0026-0495(90)90120-2. [DOI] [PubMed] [Google Scholar]
- 34.Rossetti L. Glucose toxicity: The implications of hyperglycemia in the pathophysiology of diabetes mellitus. Clinical and investigative medicine. Medecine clinique et experimentale. 1995;18:255–260. [PubMed] [Google Scholar]
- 35.Yoon J, Subramanian S, Ding Y, Wang S, Goodspeed L, Sullivan B, Kim J, O’Brien KD, Chait A. Chronic insulin therapy reduces adipose tissue macrophage content in ldl-receptor-deficient mice. Diabetologia. 2011;54:1252–1260. doi: 10.1007/s00125-011-2055-2. [DOI] [PMC free article] [PubMed] [Google Scholar]
- 36.Zinman B, Wanner C, Lachin JM, Fitchett D, Bluhmki E, Hantel S, Mattheus M, Devins T, Johansen OE, Woerle HJ, Broedl UC, Inzucchi SE. Empagliflozin, cardiovascular outcomes, and mortality in type 2 diabetes. The New England journal of medicine. 2015;373:2117–2128. doi: 10.1056/NEJMoa1504720. [DOI] [PubMed] [Google Scholar]
- 37.Neal B, Perkovic V, Mahaffey KW, de Zeeuw D, Fulcher G, Erondu N, Shaw W, Law G, Desai M, Matthews DR. Canagliflozin and cardiovascular and renal events in type 2 diabetes. The New England journal of medicine. 2017;377:644–657. doi: 10.1056/NEJMoa1611925. [DOI] [PubMed] [Google Scholar]
- 38.Mudaliar S, Alloju S, Henry RR. Can a shift in fuel energetics explain the beneficial cardiorenal outcomes in the empa-reg outcome study? A unifying hypothesis. Diabetes care. 2016;39:1115–1122. doi: 10.2337/dc16-0542. [DOI] [PubMed] [Google Scholar]
- 39.Nagareddy PR, Murphy AJ, Stirzaker RA, Hu Y, Yu S, Miller RG, Ramkhelawon B, Distel E, Westerterp M, Huang LS, Schmidt AM, Orchard TJ, Fisher EA, Tall AR, Goldberg IJ. Hyperglycemia promotes myelopoiesis and impairs the resolution of atherosclerosis. Cell metabolism. 2013;17:695–708. doi: 10.1016/j.cmet.2013.04.001. [DOI] [PMC free article] [PubMed] [Google Scholar]
- 40.Kraakman MJ, Lee MK, Al-Sharea A, Dragoljevic D, Barrett TJ, Montenont E, Basu D, Heywood S, Kammoun HL, Flynn M, Whillas A, Hanssen NM, Febbraio MA, Westein E, Fisher EA, Chin-Dusting J, Cooper ME, Berger JS, Goldberg IJ, Nagareddy PR, Murphy AJ. Neutrophil-derived s100 calcium-binding proteins a8/a9 promote reticulated thrombocytosis and atherogenesis in diabetes. The Journal of clinical investigation. 2017;127:2133–2147. doi: 10.1172/JCI92450. [DOI] [PMC free article] [PubMed] [Google Scholar]
- 41.Ginsberg HN. Insulin resistance and cardiovascular disease. The Journal of clinical investigation. 2000;106:453–458. doi: 10.1172/JCI10762. [DOI] [PMC free article] [PubMed] [Google Scholar]
- 42.Michael MD, Kulkarni RN, Postic C, Previs SF, Shulman GI, Magnuson MA, Kahn CR. Loss of insulin signaling in hepatocytes leads to severe insulin resistance and progressive hepatic dysfunction. Molecular cell. 2000;6:87–97. [PubMed] [Google Scholar]
- 43.Biddinger SB, Haas JT, Yu BB, Bezy O, Jing E, Zhang W, Unterman TG, Carey MC, Kahn CR. Hepatic insulin resistance directly promotes formation of cholesterol gallstones. Nature medicine. 2008;14:778–782. doi: 10.1038/nm1785. [DOI] [PMC free article] [PubMed] [Google Scholar]
Associated Data
This section collects any data citations, data availability statements, or supplementary materials included in this article.