INTRODUCTION
Despite the deleterious consequence of pharyngeal residue on aspiration, malnutrition, and decreased quality of life, it remains unclear how the amount of residue relates to the severity of disease and other outcomes. The perceptual measure of amount of residue is undoubtedly related to a measurement problem. Though several scales for estimating residue on FEES are available, none have demonstrated excellent clinical validity or wide generalizability (1–3). Reliability measures, which are often reported, are not sufficient for a meaningful tool if validity is not also properly evaluated. Consequently, several issues remain with the current perceptual scales for rating residue on FEES, and there is a need to investigate the measurement dimensions of residue, specifically its psychometric properties.
Researchers in the field of voice faced a similar challenge, that is, how to measure ‘how much’ of a perceptual quality existed in a voice disorder (breathy, rough, strained, etc.). They began investigating the use of a continuous scale for measurement, e.g. a visual analog scale (VAS) or direct magnitude estimation (DME) (4–8). A VAS is a perceptual but quantitative estimate of the magnitude of the desired entity. It is typically a 100-millimeter line with a label, or ‘anchor,’ on either end. The rater simply marks the line at the perceived level of magnitude. The rating, then, is a measure of length (in mm) from the left end of the line to the rater’s mark, resulting in a measurement of severity that is a ratio, or continuous, variable. The VAS has become an established measurement tool to measure change over time in pain, mood, and voice (9–13). Similarly, DME uses a modulus as a basis of comparison for ratings along a continuum. A DME is a perceptual rating that is along a continuum with unspecified values. There is a modulus and raters rate the target sample relative to the modulus. The value therefore is a rating of the relative magnitude of the sample in relationship to the modulus (11, 14). The important characteristic that DME has in common with a VAS is that they are both perceptual ratings along an open-ended and undefined continuum. Authors have found that continuous scales such as DME and VAS are more reliable and more valid than ordinal or interval scales such as 5-point, 7-point, 9-point Likert, or categorical scales (14–16). In 2002, Eadie and Doyle used a specialized statistical method for investigating psychometric properties and found that overall voice severity is best rated with a ratio scale that allows for unequal intervals such as a VAS. The authors wrote, “it is vital that more global auditory-perceptual judgments of voice are validly scaled” (14, 17). This research, in part, led to the Consensus Auditory-Perceptual Evaluation of Voice (CAPE-V), a widely used measurement tool for voice disorders based on a VAS (4, 13, 18). The CAPE-V serves as a reference standard in the absence of a gold standard and the excellent investigatory work to verify its psychometric properties makes it a stronger tool for perceptually measuring vocal quality.
The assessment of residue in swallowing disorders, also lacking a gold standard and in need of quantification, may be similarly suited to a VAS. The stark method of boxing a perceptual impression of residue into a category may preclude precision in a clinician’s judgment. The most universally accepted rating scale for pharyngeal residue is an ordinal scale (i.e., mild, moderate, severe). Though popular and widely used, ordinal scales are vulnerable to a number of problems. For one, there is a lack of standardization for how the categories are defined. Two, the degree of precision is limited when choices are in categories. A rater might want to suggest that the amount of residue is on the more severe side of a mild-moderate rating, which is not possible. Three, it is not clear from a categorical perspective if the distance between mild to moderate is the same as moderate to severe. Finally, the statistical tests used for ordinal scales are limited in power.
Residue should be assessed, as voice quality was, to determine its psychometric properties. Such an investigation will help to support the use of a scale with either equal-appearing intervals or an unrestricted continuum. It is a given that no clinical measurement scale can completely resolve all of the relevant issues, that is, validity, reliability, and utility. Nonetheless, the goal of this work was to better understand perceptual judgments of pharyngeal residue and the influence of a VAS versus an ordinal scale on clinician ratings. More specifically, this investigation asked: do VAS ratings of residue severity statistically correlate with ordinal ratings? And if not, which type of instrument provides a better assessment of residue?
METHODS
Speech-language pathologists were asked to rate the overall amount of residue on FEES videos, twice, each time with a different rating method. The local Institutional Review Board reviewed this protocol and deemed it exempt. Specifics about the clinicians, videos, study procedures, and statistics are detailed below.
A) Clinicians
Inclusion criteria were clinicians who were speech pathologists (or students studying to be speech pathologists) who had at least heard of the procedure Flexible Endoscopic Evaluation of Swallowing (FEES) and were over the age of 18. The only exclusion criterion was the inability to understand spoken or written English.” A total of 33 clinicians participated, consisting of roughly equal numbers of students (≤1 year of experience in interpreting FEES and/or MBS studies, n=10), proficient clinicians (2 to <6 years experience, n=8), advanced clinicians (6–10 years experience, n=11), and experts (≥15 years experience with FEES, n=4). In the group of participants, 31 were female, 2 were male, and the average years of experience performing and interpreting FEES was 6.2 (ranging from 0–31). For comparison purposes, the average years of experience performing and interpreting videofluoroscopic swallow studies was 9.8 (ranging from 0–10).
B) Videos
The FEES videos were prospectively collected from patients seen for a swallow evaluation in the outpatient clinic of an urban hospital. The patients in the videos were head/neck cancer patients who had undergone both surgical and radiation/chemoradiation treatment (23.1%), neck surgery patients such as thyroidectomy or anterior cervical discectomy/fusion (10.3%), head/neck cancer treated with only radiation/chemoradiation (7.7%), head/neck cancer treated with only surgery (7.7%), stroke (7.7%), Parkinson’s disease (5.1%), voice or breathing disorders (5.1%), other cancer (2.6%), GERD (2.6%), >2 medical etiologies (17.5%), and other (15.4%). Videos were selected for use in the study if there was a clear view of the larynx/pharynx and if any of the following boluses during the FEES were administered with two drops of green food dye: 5mL thin liquid via spoon, 5mL applesauce via spoon, ¼–½ saltine cracker.
The videos were categorized by consistency and residue severities until an adequate variety of residue presentations were collected to complete the following categories, that is, 25 videos of 5mL thin liquid, 25 videos of 5mL applesauce, and 25 videos of ¼–½ of a saltine cracker. Within each bolus type, there were 5 videos demonstrating no residue, 5 demonstrating trace/coating, 5 demonstrating mild, 5 demonstrating moderate, and 5 demonstrating severe residue. To categorize the videos according to the aforementioned categories of residue severity, two experienced raters independently rated the overall residue severity using a previously published perceptual scale of none, trace/coating, mild, moderate, severe (19). This scale was used due to a lack of any other appropriate scale or gold standard for determining the overall amount of residue of various bolus consistencies on FEES. Disagreements in ratings between the 2 raters were resolved via discussion, resulting in 100% agreement in categorization of the videos.
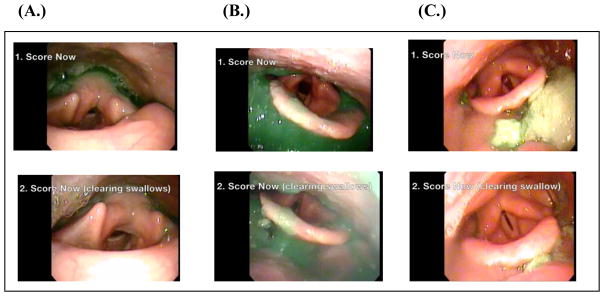
Each video was edited to remove audio and any patient identifiers. The edited videos ranged from 14 to 46 seconds in total length. All videos were presented in the same exact format: a 3-second title listing the bolus amount and consistency (“5mL applesauce”) followed by video that included before, during, and after the swallow. The videos contained instruction titles to “1. Score Now” for the period of time after the first swallow and “2. Score Now (clearing swallow)” for the period of time after the very last clearing swallow(s). The “Score Now” period was defined as the first frame of visualization after white out of the first swallow until either 5 seconds elapsed without a subsequent swallow or until the first frame of a clearing swallow occurred. The “Score Now (clearing swallow)” period was defined as the first frame after all of the clearing swallows stopped until the end of the video. If many clearing swallows occurred, the best visualization after the 5th swallow was taken to keep the videos abbreviated in length. Figure 1 demonstrates 3 example images from videos. If there were no clearing swallows, an instruction title appeared that said: “2. Clearing Swallow N/A.” Each video was numbered to correspond with its rating sheet in the provided packet (see Procedure).
Figure 1.
Images taken from FEES videos as examples of residue for (A) thin liquid residue, (B) applesauce residue, and (C) cracker residue The prompts to score are shown within each frame (1.) after the first swallow and (2.) after all of the clearing swallows were completed.
C) Procedure
The clinicians were recruited via word of mouth. Participation occurred in small groups of ≤5 clinicians. They were not allowed to share impressions or to discuss the videos with each other. As the clinicians viewed each FEES video, they answered two simple questions: (1) “Overall, how much residue do you see?” and (2) “How effective were the clearing swallows (if present)?” No operational definitions of severity were provided to the raters because this study aimed to compare the unprompted internalized scales of each clinician without any priming. The packet for responses contained 81 sheets of paper, one for each of the 81 videos. The first 75 ratings were analyzed for this study, the remaining 6 videos were used for intra-rater analyses in a separate analysis. The rating method for each sheet of paper was randomized to either ordinal or VAS. For the ordinal rating, choices were: none, trace/coating, mild, moderate, or severe for the first question about overall amount of residue and very, somewhat, or not effective for the second question about effectiveness of clearing swallow. The clearing swallow findings are under work and will be reported separately. On the VAS ratings, participants were asked to mark a slash (/) on the 100-mm line according to the impressions of residue severity. The line had small grey text as anchors, “None” on the left and “Severe” on the right. No tick marks were placed anywhere on the line. Figure 2 illustrates a schema of the rating method presentation.
Figure 2.
A representation of the randomized but counter-balanced presentation of rating methods.
The rating method was planned such that every video would receive both an ordinal and a VAS rating after both sessions were completed. In the first session, each clinician viewed the 81 edited FEES videos and rated their impression of residue severity for each video. In the second session about 2 weeks later, they rated the same 81 videos. The type of rating method for residue severity for each video was the opposite of the first session. Both ordinal and VAS rating methods were presented within each session in a randomized order to avoid any habituation or repetitive answering effects whereby participants might have started to give similar responses on one method of rating. In the second session, the order was counterbalanced to change the rating method for each video. Clinicians were not told how many of each severity they would see. Clinicians participated in 2 viewing sessions, ideally separated by at least two weeks. The mean number of days between sessions was 11.9 and the median was 14 (range: 1–34 days). During the sessions, the videos were displayed on a bright 13-inch high retina full-screen computer display that was placed within 5 feet of the clinicians. They were allowed to watch the videos as many times as requested, as well as pausing at requested time points or using slow motion. Only the lead investigator was allowed to control the videos to allow for as much standardization across video demonstration as possible. Sessions ranged from 45 minutes to 1.5 hours.
C) Statistics
Spearman rank correlations were used to examine the strength of association between the continuous and ordinal variables. Based on previous data (20), it was hypothesized that the VAS and ordinal ratings would correlate with a value >0.70. For interpretation purposes, an r value of >0.70 was regarded as a strong correlation (21). Scatter plots and exploratory statistics were used to inspect the data for trends (22). Direct comparisons of VAS to ordinal ratings were plotted against one another using Spearman rank correlations due to the ordinal variable. Upon inspection of the correlations, it was determined that there was a non-linear trend to the plots. Consequently, assessments of linear versus quadratic versus cubic fits were performed using generalized linear modeling. For these assessments, arithmetic means for ordinal ratings 1–5 and geometric means for VAS ratings 1–100 were calculated for each video. While this step converts the ordinal ranking values, it allows for a measure of central tendency and was necessary per the stipulated methodology to allow comparison of the psychometric properties of each scale (11, 17, 23). The r2 value and term coefficients of linear, quadratic, and cubic models for cracker, applesauce, and thin liquid videos were statistically compared to each other to determine statistical differences between r2 values using methods described by McDonald (24). In accordance with previous work, a nonlinear fit of the model would indicate an unequal interval dimension of residue (prothetic) while a linear fit would describe equal intervals of the properties of residue (metathetic) (14, 17, 23, 25). SAS (version 9.4) was used for these analyses.
RESULTS
A total of 2,475 VAS ratings and 2,473 ordinal ratings were collected. Two ordinal ratings were missing. The range for each bolus type and its severity are listed in Table 1. These ranges are useful for standard deviations of what an average clinician may rate residue as and the lower and upper limits of the standard deviations can be overlayed onto the statistical models (Figure 3).
Table 1.
Average Visual Analog Scale (VAS) ratings and median categorical ratings of residue and the lower and upper boundaries of ±1 standard deviation (SD) or interquartile range (IQR).
| Clinician’s Average VAS Rating (and SD) | ||||
|---|---|---|---|---|
| None | Trace | Mild | Moderate | Severe |
| Cracker | ||||
| 2.79mm (0, 6.2mm) | 13.29mm (3.0, 23.6mm) | 21.98mm (5.7, 38.3mm) | 54.55mm (31.8, 77.3mm) | 70.40mm (50.3, 90.5mm) |
| Applesauce | ||||
| 1.69mm (0, 3.5mm) | 11.21mm (3.2, 19.3mm) | 24.07mm (10.1, 38.1mm) | 73.19mm (53.1, 93.3mm) | 84.69mm (71.2, 98.2mm) |
| Thin Liquid | ||||
| 3.22mm (0, 6.79mm) | 3.39mm (0, 7.7mm) | 19.32mm (6.4, 32.2mm) | 17.59mm (4.3, 30.9mm) | 53.81mm (25.4, 82.2mm) |
| Median Ordinal Rating (and IQR) | ||||
|---|---|---|---|---|
| None | Trace | Mild | Moderate | Severe |
| Cracker | ||||
| none (0) | trace (none-mild) | mild (trace-moderate) | moderate (0) | moderate (mild- severe) |
| Applesauce | ||||
| none (0) | trace (0) | mild (trace-moderate) | severe (moderate-severe) | severe (moderate- severe) |
| Thin Liquid | ||||
| none (none-trace) | none (0) | mild (trace-moderate) | mild (trace-moderate) | moderate (trace-severe) |
Figure 3.
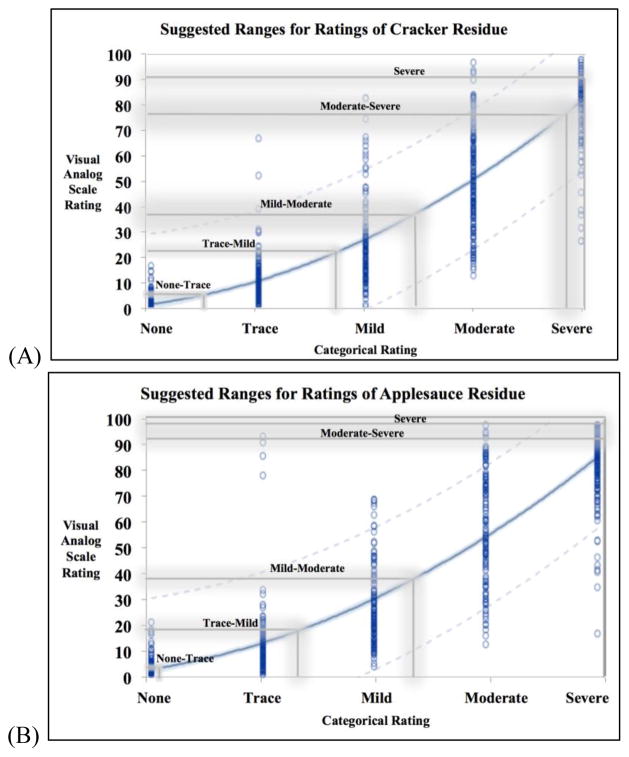
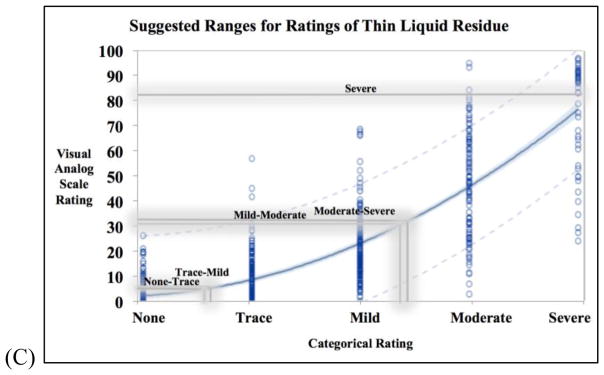
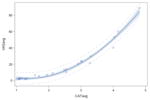
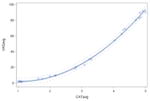
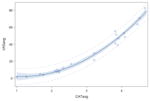
Three curvilinear models for (A) cracker (n=825), (B) applesauce (n=824), (C) thin liquid (n=824) residue ratings to represent the relationship between each visual analog scale (VAS) rating and its counterpart on the ordinal rating scale. Each blue circle is a data point and the 95% confidence limits of the model is indicated by the tight light blue shading along the regressions line. The grey lines are the upper thresholds of 1 standard deviation from all clinician ratings of that cluster of videos.
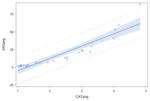
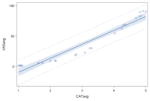
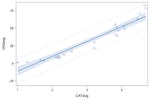
VAS ratings were highly correlated with ordinal ratings for each type of residue severity. Spearman rank correlation coefficients for thin liquid videos, applesauce videos, and cracker videos were r=0.85 (n=824), r=0.92 (n=824), and r=0.90 (n=825), respectively, all of which were significantly different from r=0 (p<0.0001). Table 2 demonstrates the correlations and the r2 values, reflecting the goodness of fit values of the linear models. However, the plots of the data points demonstrated a non-linear curve, requiring further testing in accordance with the statistical methods previously described. The results of the quadratic modeling are detailed in Table 2. In comparing the linear fit of the data to a quadratic fit, the r2 values significantly improved for the thin liquid (p<0.0001), applesauce (p<0.0001), and cracker (p<0.0001) models. In order to investigate if there was a better fit beyond a quadratic model, cubic modeling was also carried out, but the results for goodness of fit were not significantly different from the quadratic models (p>0.05).
Table 2.
Linear versus quadratic modeling of ordinal and visual analog scale ratings of residue as described by Stevens (1975).
| Bolus Type | Equation (p-value) | r2 | Figure | |
|---|---|---|---|---|
| Linear Modeling | Thin Liquid | y= −22.64 + 17.48x p<0.0001 |
0.85 |
|
| Applesauce | y= −32.51 + 22.97x p<0.0001 |
0.93 |
|
|
| Cracker | y= −32.35 + 21.11x p<0.0001 |
0.91 |
|
|
| Quadratic Modeling† | Thin Liquid | y= 14.32 −17.80x + 6.73x2 p<0.0001 |
0.98* |
|
| Applesauce | y= 8.32 −12.33x + 5.88x2 p<0.0001 |
0.99* |
|
|
| Cracker | y= 10.20 −13.94x + 6.03x2 p<0.0001 |
0.98* |
|
Significantly different than respective r2 values of the same bolus type’s linear model r2 value (p<0.0001).
The equations listed here were done on transformed data in accordance with the described psychometric testing. The descriptive text lists other quadratic equations that can be used without transforming data.
Within the quadratic model, ordinal ratings (x-axis) predicted VAS ratings (y-axis) in a curvilinear fashion and vice versa. The following equations are results of the modeling that can be used for conversions from one scale to the other (i.e., VAS to ordinal); these do not rely on any transformation of the data and still account for predictions of unequal spacing: cracker y=(−0.7)+(−1.56x)+(3.67x2), applesauce y=(−1.46)+(−0.07x)+(3.56x2), thin liquid y=(5.08)+(−6.05x)+(4.18x2). For the cracker quadratic model, the standard error was 2.69. For the applesauce quadratic model, the standard error was 2.38 and for the thin liquid quadratic model, the standard error was 1.80.
DISCUSSION
This study investigated the correlation between visual analog scale (VAS) versus ordinal scale ratings of pharyngeal residue on FEES. The findings revealed that clinician ratings on a VAS correlated strongly and significantly with ordinal ratings, confirming preliminary findings from other datasets (20). The strong correlations also highlighted that as VAS ratings of residue increased, so did ordinal ratings of thin liquid, applesauce, and cracker residue. But the relationship was not a 1:1 increase, raising a question about the psychometric differences between the two rating methods. To investigate the measurement dimensions of desired variables, analyses originally proposed by Stevens (17) were undertaken. Other researchers have used these analyses to consider the psychometric properties of vocal quality (4, 5), stuttering (26), and speech naturalness (27). The analysis established by Stevens (17) permits a determination between a metathetic dimension, a property that changes in quality and not quantity along an equally-spaced continuum, and a prothetic dimension, a property that changes in degrees of quantity or magnitude in unequal intervals.
The generalized linear modeling of this study’s data demonstrated that the continua of residue ratings are not evenly spaced and linear, but rather curvilinear. The curvilinear models accounted for a significantly greater proportion of the variance in predicting clinician ratings of residue. The results suggest that residue exists in a prothetic dimension: as residue increases, it changes unevenly on a spectrum of quantity. While this finding may seem self-evident, it has never before been systematically studied and dissuades the use of ordinal or categorical scales when rating residue. Because the scales were not operationalized for the clinicians, it was not clear how they internally defined the interval spacing of each scale. However, their internalized rating had to ultimately be placed on an equal-appearing interval scale and an undefined continuum (Figure 2), and the statistical analyses treated the ratings in such a manner (28). Our findings suggest there is a statistically significant difference between these rating scales and perceptual ratings of residue on FEES are best captured on a continuum.
Figures 3A, 3B, and 3C illustrate the proposed models and the conversion between VAS and ordinal ratings along the uneven severity spectrum. In each figure, there are proposed zones for severity interpretations for each bolus type based on the shaded grey boundaries of these data (representing the upper threshold of +1 standard deviation of all raters’ impressions, see Table 1). Readers should be cautioned to avoid strict interpretation of the boundaries, as overlap is a critical aspect. It is important to emphasize the un-evenness of the ratings’ intervals, which is a critical finding. Our data demonstrated that residue ratings fit best with a curvilinear model, which is in accordance with the Stevens methodology of measurement dimensions (17) that has been frequently replicated. As such, residue should not be measured in equally-spaced intervals (mild/moderate/severe), but rather in a non-linear fashion (on a ratio scale such as a VAS).
It is hoped that this investigation will assist scale development by providing insight into measurement dimensions of pharyngeal residue. Until now, pharyngeal residue has not been examined in this light. The only consideration of a scale truly based on a ratio measurement is an unpublished dissertation investigation involving ratings of residue in the neopharynx of laryngectomy patients. In that study, three raters ranked the amount of residue on a VAS with exemplar pictures to demonstrate the none and severe anchors (M. Coffey, personal communication, April 4, 2016). It would be of great interest if the results of that study’s VAS ratings fit unequal spacing, which would corroborate this study’s findings. That author verbally reported high intra-rater reliability on the VAS, which also supports the present findings (M. Coffey, personal communication, April 4, 2016).
The results of the present research investigation should serve as a starting point for further discussion of how residue is best measured. Multiple limitations must be mentioned. First, a few procedural limitations deserve mention. There was a possibility of response bias of the clinicians who rated videos in small groups of 5. The lead investigator was present at every viewing and only she controlled the videos; very rarely were there requests for replaying the videos, likely because there was a few seconds worth of live video to view of the residue at rest. Another procedural limitation is the number of days between viewing sessions. Ideally, all participants would have had at least 2 weeks time between viewing sessions, but 3 participants only had a 1 day separation due to travel constraints. Second, it is possible that the clinicians included location of the residue into their impression, although this cannot be confirmed. A worthy future study would be to track clinician ratings of residue amount and location to measure the influence of residue location on impressions. That is, a speck of residue on the vocal folds may carry much more significance than a moderate amount of residue in the valleculae. A separate analysis of this data is underway to address this question by investigating the overall amount of residue and PAS score. Moreover, another analysis looked at the penetration-aspiration risk in relationship to the location of residue (29). Third, theories underlying psychometric principles from other fields (psychology, voice) may not directly carry over to deglutology measurement. The audio-perceptual task of rating voice may differ from the visual-perceptual task of rating residue. However, there is strong evidence to suggest that the VAS rating method can be used across many disparate perceptual tasks (12, 26, 27, 30). Fourth, this study used VAS ratings, not formal direct magnitude estimation (DME) ratings, and the results may be skewed due to the slight differences in these measurement techniques. However, several previous studies found DME and VAS ratings to be comparable in determining dimensions of measurement (15, 16, 23). Finally, 5 examples of each type of residue severity for each bolus consistency may not have been enough to adequately represent the range of residue severities, skewing the impressions one way or another depending on the video. But the FEES videos were a relatively large group of stimuli: 75 videos consisting of 25 varying severities for 3 bolus types. The statistical analyses were adequately powered, which further support the result: residue has a strong curvilinear quality and measurement scales should account for this property.
CONCLUSION
It is vital to have a valid and global estimate of the amount of pharyngeal residue to allow for meaningful measurement in the assessment of dysphagia. Perceptual judgments of pharyngeal residue severity in this study were in unequal intervals, an important concept that should be a consideration in future scales. This result suggests that visual analog scale (VAS) ratings of pharyngeal residue on FEES may be more appropriate than ordinal ratings. In ordinal ratings, estimates are restricted to a smaller number of choices, typically only four or five, which precludes precision when rating residue. Further, more study is needed in the area of perceptual estimates of swallowing variables to avoid inappropriate and invalid use of certain scales. Progress in this realm will assist in tracking important variables such as residue for dysphagia assessment.
Acknowledgments
The lead author would like to thank Dr. Elizabeth Hoover and Dr. Wendy Costner for their input and guidance in the development of this research. We are also grateful for the participation in this investigation by speech pathologists across the United States.
Footnotes
Portions of this manuscript were presented at the Dysphagia Research Society in Portland, Oregon on Saturday, March 4, 2017.
Disclosures & Conflicts of Interest
Salary and tuition support was provided to the first and last authors from National Institute on Deafness and Other Communication Disorders of the National Institutes of Health under Award Number R01DC012584 (PI: Kumar).
The Department of Speech, Language, and Hearing of Sargent College (Boston University) also provided financial support for this research via the Dudley Allen Sargent Research Fund.
References
- 1.Neubauer PD, Rademaker AW, Leder SB. The Yale Pharyngeal Residue Severity Rating Scale: An Anatomically Defined and Image-Based Tool. Dysphagia. 2015;30(5):521–8. doi: 10.1007/s00455-015-9631-4. [DOI] [PubMed] [Google Scholar]
- 2.Kaneoka AS, Langmore SE, Krisciunas GP, Field K, Scheel R, McNally E, et al. The Boston Residue and Clearance Scale: preliminary reliability and validity testing. Folia Phoniatr Logop. 2013;65(6):312–7. doi: 10.1159/000365006. [DOI] [PubMed] [Google Scholar]
- 3.Farneti D. Pooling score: an endoscopic model for evaluating severity of dysphagia. Acta Otorhinolaryngol Ital. 2008;28(3):135–40. [PMC free article] [PubMed] [Google Scholar]
- 4.Zraick RI, Liss JM, Dorman MF, Case JL, LaPointe LL, Beals SP. Multidimensional scaling of nasal voice quality. J Speech Lang Hear Res. 2000;43(4):989–96. doi: 10.1044/jslhr.4304.989. [DOI] [PubMed] [Google Scholar]
- 5.Toner MA, Emanuel FW. Direct magnitude estimation and equal appearing interval scaling of vowel roughness. J Speech Hear Res. 1989;32(1):78–82. doi: 10.1044/jshr.3201.78. [DOI] [PubMed] [Google Scholar]
- 6.Gerratt B, JT, Rosenbek J, Wertz R, Boysen A. Use and perceived value of perceptual and instrumental measures in dysarthria management. In: Moore C, Yorkston K, Beukelman Brookes D, editors. Dysarthria and Apraxia of Speech. Baltimore: 1991. pp. 77–93. [Google Scholar]
- 7.Gerratt BR, Kreiman J, Antonanzas-Barroso N, Berke GS. Comparing internal and external standards in voice quality judgments. J Speech Hear Res. 1993;36(1):14–20. doi: 10.1044/jshr.3601.14. [DOI] [PubMed] [Google Scholar]
- 8.Kreiman J, Gerratt BR, Precoda K, Berke GS. Individual differences in voice quality perception. J Speech Hear Res. 1992;35(3):512–20. doi: 10.1044/jshr.3503.512. [DOI] [PubMed] [Google Scholar]
- 9.Ahearn EP. The use of visual analog scales in mood disorders: a critical review. J Psychiatr Res. 1997;31(5):569–79. doi: 10.1016/s0022-3956(97)00029-0. [DOI] [PubMed] [Google Scholar]
- 10.Averbuch M, Katzper M. Assessment of visual analog versus categorical scale for measurement of osteoarthritis pain. J Clin Pharmacol. 2004;44(4):368–72. doi: 10.1177/0091270004263995. [DOI] [PubMed] [Google Scholar]
- 11.Eadie TL, Doyle PC. Direct magnitude estimation and interval scaling of naturalness and severity in tracheoesophageal (TE) speakers. J Speech Lang Hear Res. 2002;45(6):1088–96. doi: 10.1044/1092-4388(2002/087). [DOI] [PubMed] [Google Scholar]
- 12.Carlsson AM. Assessment of chronic pain. I. Aspects of the reliability and validity of the visual analogue scale. Pain. 1983;16(1):87–101. doi: 10.1016/0304-3959(83)90088-X. [DOI] [PubMed] [Google Scholar]
- 13.Kempster GB, Gerratt BR, Verdolini Abbott K, Barkmeier-Kraemer J, Hillman RE. Consensus auditory-perceptual evaluation of voice: development of a standardized clinical protocol. Am J Speech Lang Pathol. 2009;18(2):124–32. doi: 10.1044/1058-0360(2008/08-0017). [DOI] [PubMed] [Google Scholar]
- 14.Eadie TL, Doyle PC. Direct magnitude estimation and interval scaling of pleasantness and severity in dysphonic and normal speakers. J Acoust Soc Am. 2002;112(6):3014–21. doi: 10.1121/1.1518983. [DOI] [PubMed] [Google Scholar]
- 15.Cheng T. University of Hong Kong; Pokfulam, Hong Kong: 2006. Direct magnitude estimation versus visual analogue scaling in the perceptual rating of hypernasality. http://hdl.handle.net/10722/50059. [Google Scholar]
- 16.Yiu EM, Ng CY. Equal appearing interval and visual analogue scaling of perceptual roughness and breathiness. Clin Linguist Phon. 2004;18(3):211–29. doi: 10.1080/0269920042000193599. [DOI] [PubMed] [Google Scholar]
- 17.Stevens SS. Psychophysics. New York, NY: Wiley; 1975. [Google Scholar]
- 18.Helou LB, Solomon NP, Henry LR, Coppit GL, Howard RS, Stojadinovic A. The role of listener experience on Consensus Auditory-perceptual Evaluation of Voice (CAPE-V) ratings of postthyroidectomy voice. Am J Speech Lang Pathol. 2010;19(3):248–58. doi: 10.1044/1058-0360(2010/09-0012). [DOI] [PubMed] [Google Scholar]
- 19.Kelly AM, Leslie P, Beale T, Payten C, Drinnan MJ. Fibreoptic endoscopic evaluation of swallowing and videofluoroscopy: does examination type influence perception of pharyngeal residue severity? Clin Otolaryngol. 2006;31(5):425–32. doi: 10.1111/j.1749-4486.2006.01292.x. [DOI] [PubMed] [Google Scholar]
- 20.Pisegna JM, Langmore S. Measuring Residue: Categorical Ratings Versus a Visual Analog Scale. Dysphagia Research Society Annual Convention; March, 12, 2015; Chicago, IL. 2015. [Google Scholar]
- 21.Higgin J, Green S. The Cochrane collaboration. Wiley; 2008. Cochrane handbook for systematic reviews of interventions. [Google Scholar]
- 22.Rousson V, Gasser T, Seifert B. Assessing intrarater, interrater and test-retest reliability of continuous measurements. Stat Med. 2002;21(22):3431–46. doi: 10.1002/sim.1253. [DOI] [PubMed] [Google Scholar]
- 23.Baylis A, Chapman K, Whitehill TL, Group TA. Validity and Reliability of Visual Analog Scaling for Assessment of Hypernasality and Audible Nasal Emission in Children With Repaired Cleft Palate. Cleft Palate Craniofac J. 2015;52(6):660–70. doi: 10.1597/14-040. [DOI] [PubMed] [Google Scholar]
- 24.McDonald J. Handbook of Biological Statistics. 3. Baltimore, MD: Sparky House Publishing; 2014. [Google Scholar]
- 25.Brancamp TU, Lewis KE, Watterson T. The relationship between nasalance scores and nasality ratings obtained with equal appearing interval and direct magnitude estimation scaling methods. Cleft Palate Craniofac J. 2010;47(6):631–7. doi: 10.1597/09-106. [DOI] [PubMed] [Google Scholar]
- 26.Schiavetti N, Martin RR, Haroldson SK, Metz DE. Psychophysical analysis of audiovisual judgments of speech naturalness of nonstutterers and stutterers. J Speech Hear Res. 1994;37(1):46–52. doi: 10.1044/jshr.3701.46. [DOI] [PubMed] [Google Scholar]
- 27.Southwood M, Weismer G. Listener judgments of the bizarreness, acceptability, naturalness, and normalcy of the dysarthria associated with amyotrophic lateral sclerosis. Journal of Medical Speech-Language Pathology. 1993;1:151–61. [Google Scholar]
- 28.Stokes ME, Davis CS, Koch GG. Categorical data analysis using the SAS system. 2. Cary, NC: SAS Institute; 2000. p. viii.p. 626. [Google Scholar]
- 29.Pisegna JM, Kaneoka A, Langmore S. Danger Zones: Rating Residue in 3 Zones to Identify Those At Risk for Penetration/Aspiration on FEES; February 26, 2016; Phoenix, AZ. Dysphagia Research Society; 2016. [Google Scholar]
- 30.Brunier G, Graydon J. A comparison of two methods of measuring fatigue in patients on chronic haemodialysis: visual analogue vs Likert scale. Int J Nurs Stud. 1996;33(3):338–48. doi: 10.1016/0020-7489(95)00065-8. [DOI] [PubMed] [Google Scholar]


