Abstract
In this study, AP2 DNA-binding domain-containing transcription factor, OglDREB2A, was cloned from the African rice (Oryza glaberrima) and compared with 3000 rice genotypes. Further, the phylogenetic and various structural analysis was performed using in silico approaches. Further, to understand its allelic variation in rice, SNPs and indels were detected among the 3000 rice genotypes which indicated that while coding region is highly conserved, yet noncoding regions such as UTR and intron contained most of the variation. Phylogenetic analysis of the OglDREB2A sequence in different Oryza as well as in diverse eudicot species revealed that DREB from various Oryza species were diversed much earlier than other genes. Further, structural features and in silico analyses provided insights into different properties of OglDREB2A protein. The neutrality test on the coding region of OglDREB2A from different genotypes of O. glaberrima showed the lack of selection in this gene. Among the different developmental stages, it was upregulated at tillering and flag leaf under salinity treatment indicating its positive role in seedling and reproductive stage tolerance. Real-time PCR analysis also indicated the conserve expression pattern of this gene under salinity stress across the three different Oryza species having different degree of salinity tolerance.
Electronic supplementary material
The online version of this article (10.1007/s13205-018-1098-1) contains supplementary material, which is available to authorized users.
Keywords: Abiotic stress, DREB2A, Gene expression, O. glaberrima, Salinity stress
Introduction
Oryza glaberrima, also known as African rice, red rice or rice of Casamance, is another domesticated edible species within the Oryza genus. It belongs to the Poaceae family, tribe Oryzeae and genus Oryza; it is diploid with AA genome (2n = 24 chromosomes), and is an annual, self-pollinated plant (Agnoun et al. 2012). Mostly cultivated in parts of West Africa, O. glaberrima has been reported to display increased tolerance to various types of biotic and abiotic stresses such as traits for blast resistance, drought resistance (Jones et al. 1997a, b), resistance to rice yellow mottle virus, gall midge (Orseolia oryzivora); tolerance to soil acidity, aluminium as well as iron toxicity and weed competitiveness (Agnoun et al. 2012; Ricachenevsky and Sperotto 2016; Wang et al. 2014). Although O. sativa has been studied well for salinity stress tolerance, little is known about the same in O. glaberrima (Awala et al. 2010).
Asian rice (O. sativa) is an important cereal crop that serves as a staple food source for the world’s population (Joseph and Mohanan 2013). Being a glycophyte, its yield is significantly hampered by soil salinity (Flowers and Yeo 1981). However, genetically improved rice lines suitable to grow in high saline soils will improve rice production globally. However, the pre-requisite to develop the salt-tolerant rice genotype is to identify the efficient genes/alleles. Salt-tolerant genes that have been characterized in rice so far are from tolerant rice genotype. Thus, identifying improved or favourable allele from its relatives will be immense helpful. Transcription factors are regulatory in nature as they can induce several genes in downstream that are related to same pathway. Over the past few years, various transcription factors have been discovered in plants that are related to a wide range of abiotic stress responses including salinity. These transcription factors comprise the ethylene responsive element-binding factors (ERF) (Riechmann et al. 2000), MYC as well as MYB (Goodrich et al. 1992), basic-domain leucine-zipper (bZIP) (Uno et al. 2000), WRKY binding (WRKY) (Mare et al. 2004), NAC (He et al. 2005) and DELLA transcription factors (Achard et al. 2006). The DREB transcription factors belong to ERF family containing AP2 domain for DNA binding. One class of ERF family proteins binds to GCC box in the promoters of pathogenesis-related ethylene responsive genes while the second class known as DREB/CBFs binds dehydration responsive element (DRE/CRT) in the promoters of cold and dehydration responsive LEA genes. The DREB proteins are of two classes; DREB1 and DREB2 proteins work predominantly in an ABA-independent pathway with the exception being CBF4 which binds to CRT/DRE elements in ABA-dependent manner.
Through DREB transcription factors and their relation to abiotic stresses through transgenic approaches have also been studied (Khan et al. 2016) in a wide range of plants such as Glycine max (de Paiva Rolla et al. 2014), Arachis hypogaea (Bhatnagar-Mathur et al. 2008), Nicotiana tabacum (Awala et al. 2010), O. sativa (Xiao et al. 2009; Bihani et al. 2011), Triticum aestivum (Saint Pierre et al. 2012), Salvia miltiorrhiza (Wei et al. 2016), it is not studied from O. glaberrima which are considered to be highly tolerant to various abiotic stresses.
Further, there have been few reports of evolutionary origin of DREB in various species such as moso bamboo (Phyllostachys edulis), Zea mays, Brassica oleracea, Hordeum vulgare (Guo et al. 2016; Liu et al. 2013; Thamilarasan et al. 2014; Wu et al. 2015); reports on the evolutionary origin of OglDREB2A and its orthologs in other species have not been reported till date. In the present study, evolutionary relationship of DREB2A in O. glaberrima and its homologs was studied. Further, genomic sequence level conservation among the various Oryza species and expression level conservation between rice, O. coarctata and O. glaberrima in response to salt stress were also studied.
Materials and methods
Plant material and salinity treatment
Seeds of O. glaberrima genotype, ‘RAM100’, were surface sterilized with 0.1% HgCl2 (w/v) and grown for 3 weeks in paper towel. After that, seedlings were grown till maturity under greenhouse conditions in pots. The soil of the pot was having an average (salinity) EC of 0.6 ds/m. The salt stress (EC of ~ 10 ds/m) was applied to the pot-grown plants for 24 h. Simultaneously, control samples were obtained at each developmental stage of the rice plant treated with distilled water. The tissues after harvesting from the salinity stressed as well as control rice plants were immediately frozen and kept at − 80 °C until further use. Further, to study the expression pattern conservation, we also treated O. coarctata (cv. Sundarban), O. glaberrima (cv. RAM100) and O. sativa (cv. FL478) 2-month-old seedlings with 20 ds/m for former species and 10 ds/m for later two species, respectively, based upon our previous study (Mondal et al. 2015, 2018; Ganie et al. 2017).
Sequence retrieval
The coding and the protein sequences of DREB2A from various genotypes of O. glaberrima as well as from O. sativa and O. coarctata were retrieved from the NCBI database (Zhang et al. 2000). The orthologs of DREB2A from 11 Oryza genomes and other plant species were obtained from the Plant Ensembl database (Kersey et al. 2016) using the BLASTp search tool with an expectation value (e value) ≤ 1e−5. Further, PSI-BLAST with BLOSUM62 matrix (Henikoff and Henikoff 1992) was carried out in the NCBI database. All non-redundant sequence hits were taken into consideration for evolutionary analysis and sequence alignment. Duplicate sequences having more than 95% similarity after alignment in CLUSTAL W were removed from further analysis. For DREB2A genes having more than one transcript, the protein sequence derived from the longest transcript was included for carrying out the analysis. Sequences that have been used in this study are tabulated in Table S1.
Identification of SNPs and indels information from Rice SNP Seek Database
The locus id for DREB2A gene sequence was obtained from MSU Rice Genome Annotation Project (Ouyang et al. 2007). Information about indels and SNPs of 3000 rice genotypes was obtained from SNP Seek database using default parameters (Alexandrov et al. 2015) with reference to Nipponbare genome for the locus, LOC_Os01g07120. Separate tables for each of five sub-populations viz, Indica, Japonica, Aus, Aromatic and Admix were downloaded. Number of SNP mismatches and indels for each genotype were calculated and data for each sub-population were recorded. In total, 1789 Indica, 855 Japonica, 201 Aus, 103 Admix and 76 Aromatic varieties were enlisted, and average number of SNPs in each sub-population and sub-populations carrying specific number of indel mutations were calculated and documented.
Multiple sequence alignment and phylogenetic study
The retrieved sequences were manually screened for the presence of AP2 domain in InterProScan (Jones et al. 2014). The protein sequences of the DREB2A orthologs of various species of Oryza as well as species within the Poaceae family were aligned through CLUSTAL X2 (Larkin et al. 2007). To study the sequence level conservation of AP2 domain among the protein sequences, multiple sequence alignment consisting of the DREB2A sequences from O. glaberrima, its orthologs from various species of Oryza as well as other species of Poaceae family was created. Sequence logos were generated using WebLogo (Crooks et al. 2004). For construction of phylogenetic tree, all identified 253 DREB gene sequences were aligned using CLUSTAL W programme incorporated in BioEdit v7.0.5 (Hall 1999) and further aligned fasta file converted into nexus file format using web-based sequence conversion programme (http://sequenceconversion.bugaco.com/converter/biology/sequences/fasta_to_nexus.php, Date of access Nov. 13, 2017). Later on, Bayesian phylogenetic tree analyses was developed using Mrbayes version 3.2.2 (Ronquist and Huelsenbeck 2003), with two independent runs conducted for 900,000 generations and a reversible jump Markov chain Monte Carlo (RJ-MCMC) substitution scheme was used with a discrete gamma distribution model and six substitution types during the run. At every 500 generations a sample tree was saved. The output of Mrbayes was visualized using Figtree (version 1.4.3, http://tree.bio.ed.ac.uk/software/figtree/, Date of Access November 26, 2017).
Selection on the DREB2A gene from O. glaberrima was tested by Tajima’s D (Tajima 1989) using DnaSP5 (Librado and Rozas 2009) that takes into account average pairwise difference between sample sequences (π) and Waterson’s estimator θ based on number of segregating sites (Watterson 1975).
In silico analysis of OglDREB2A protein
The protein sequence of OglDREB2A was used for secondary structure analysis using SOPMA (Geourjon and Deléage 1995). The physical and chemical parameters, theoretical isoelectric point, molecular weight, total number of positive and negative residues, extinction coefficient, half-life, instability index, aliphatic index and grand average hydropathy (GRAVY) were computed using Expasy-Protparam (Gasteiger et al. 2005a, b). The folding state was predicted by FoldIndex Program (Priluskyl et al. 2005). 3D model of the protein was generated in Swiss-Model workspace. The models were analyzed and the best model was selected based on highest sequence identity with the template, best GMQE and best QMEAN score. Higher GMQE and QMEAN scores indicate higher reliability of the built model (Biasini et al. 2014). Ramachandran plot for the protein was constructed in RAMPAGE server (Lovell et al. 2003).
Analysis of motif and intron–exon architecture of DREB2A orthologs
For comparison and visualization of DREB2A orthologs, GSD raw of PIECE was used (Wang et al. 2013), with the input files consisting of the genomic DNA and the coding sequences of rice and various Oryza species. The conserved motifs were also analyzed initially by PIECE and subsequently by MEME (Bailey et al. 2009).
Q-PCR analysis of DREB2A in different tissue and under salinity stress
Total RNA was isolated from 100 mg of tissues of different developmental stages, namely seedling, flag leaf, panicle initiation and milky stages (young grain with white liquid) from both control and treated samples, using TRIZOL reagent. Both quantitative and qualitative values for extracted RNA samples were checked using Nanodrop (Thermo Fisher Scientific, USA) and through gel electrophoresis. The cDNA were prepared using 1 μg of total extracted RNA according to SuperScript® III cDNA synthesis protocol (Invitrogen, India). The diluted cDNA was subjected to the PCR by high-fidelity Taq Polymerase (DSS Takara Bio India Pvt. Ltd., India) with gene-specific primer. The amplification product was gel purified with Gel Extraction Kit (Qiagen India Pvt Ltd, India) and cloned into pGEM-T easy vector (Promega, USA) in Escherichia coli strain DH5α for sequencing. The forward and reverse contigs were joined to make a complete sequence which was used for in silico analysis.
Expression of OgDREB2A transcript was analysed by Q-PCR, using gene-specific forward (GSP-F) and reverse (GSP-R) primers of three different species, i.e. O. coarctata (cv. Sundanban), O. glaberrima (cv. RAM 100) and O. sativa (cv. FL478) (Table S2). The expression of these genes was normalized with species-specific actin gene as an internal control to quantify the expression level of the transcripts (Table S2). The resulting cDNA samples were diluted 60 times (1:60) in RNase-free water and 2 µl of the diluted cDNA was used as template in a total reaction volume of 25 µl using QuantiFast SYBR Green PCR Master Mix (Qiagen, India). Real-time PCR analysis was performed in a 96-well plate using Roche 454 Q-PCR system (Roche, USA). The thermal cycling conditions of 95 °C for 5 min followed by 45 cycles of 95 °C for 15 s, 60 °C for 30 s, and 72 °C for 30 s were used. The Q-PCR amplifications were performed with at least two independent biological replicates and two technical replicates for each biological replicate. The specificity of the PCR reactions was confirmed by melting curve analysis of the amplicons. The comparative 2− Δct [ΔCT = CT, gene of interest − CT, actin] method was used to calculate the normalized fold changes of each transcript in the samples (Schmittgen and Livak 2008). Statistical analyses were conducted using the SAS software (SAS Institute Inc., NC, USA).
Results
Identification of SNPs and indels at DREB2A locus among the 3 k rice cultivars
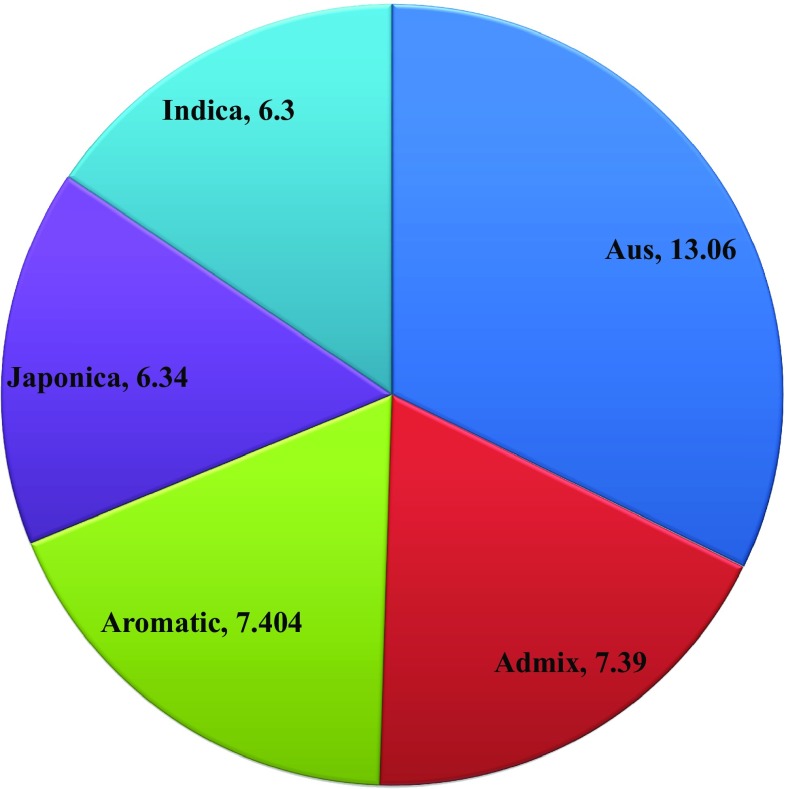
To identify the genetic variation at sequence level among the rice genotypes, we took the advantage of ‘3000 rice genome project’ which possesses a large number of sequenced genomes. Apart from that, we also cloned another 19 sequences of this gene from O. coarctata and O. glaberrima [Submitted to NCBI genbank ID: AIY24737, AMB19639-AMB19657] and taken for this analysis. The gene ID of DREB2A sequence (LOC_Os01g07120) retrieved from the MSU Rice Genome Annotation Project (RGAP-7) was found to be located in chromosome 1. This gene has two splice variants, namely LOC-Os01g07120.1 and LOC-Os01g07120.2. At this locus, variable number of insertion and deletion mutations were found in all the sub-groups such as indica, japonica, admix, aus and aromatic varieties with Nipponbare (a japonica subsp.) as reference. Average number of SNPs found in each of the groups in increasing order is 6.30, 6.34, 7.39, 7.40, 13.06 for Indica, Japonica, Admix, Aromatic and Aus varieties, respectively (Fig. 1). Out of the 3019 genotypes, 651 were not found to have any indels. While rest 2256 genotypes were found to have 1 indel mutation, 7 genotypes contains 2 indels each, 4 genotypes contain 3 indels each, 9 genotypes contain 4 indels each, 19 genotypes contain 5 indels each, 3 genotypes contain 6 indels each, 33 genotypes contain 7 indels each, 14 genotypes contain 8 indels each, 4 genotypes contain 9 indels each, 19 genotypes contain 10 indels each, 4 genotypes contain 12 indels each and 1 genotype contains maximum of 21 indels each (Fig. 2a, b).
Fig. 1.
Average number of SNPs in all five sub-populations of O. sativa sp., namely Indica, Japonica, Admix, Aus, Aromatic represented in the form of a pie chart
Fig. 2.
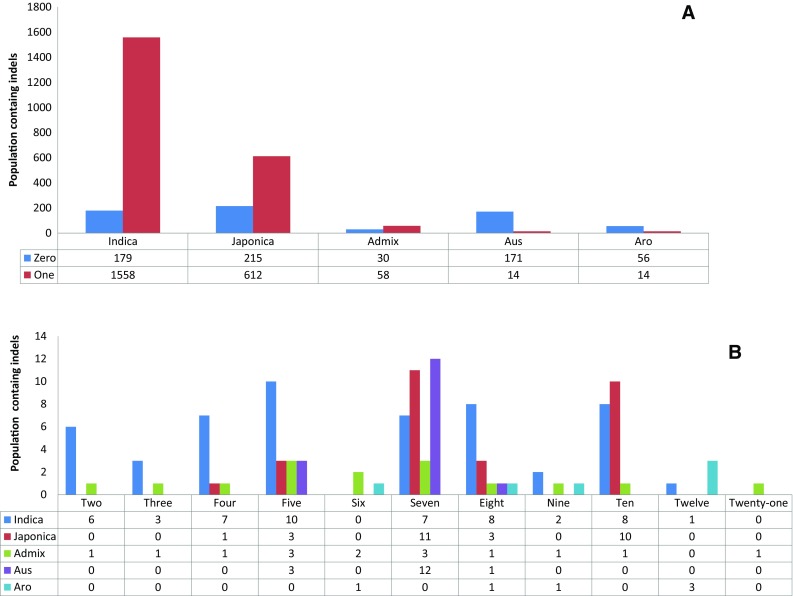
Comparison between five sub-populations of Oryza sativa ssp. Indica, Japonica, Admix, Aus, Aromatic with respect to number of indels carried by each sub-populations (a) for indel number 0 and 1; (b) for indel number 2, 3, 4, 5, 6, 7, 8, 9, 10, 12 and 21
Mapping of SNPs and indels
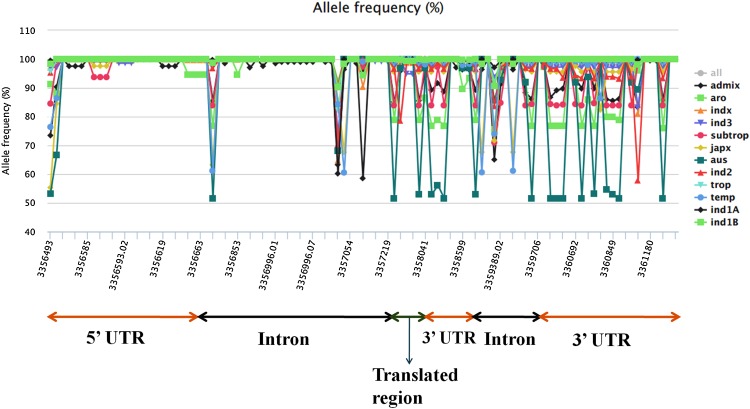
To gain an insight into the genetic variation at DREB2A locus among the 3000 rice genotypes, SNPs and indels present in the coding and noncoding regions of the gene were mapped. The chromosomal region spans a total of 4821 base pairs in Nipponbare containing 33 SNPs with an average of one SNP per 146 base pairs. Out of 33 SNP positions, 4 SNP positions (3357802, 3357862, 3357939 and 3358041) were found to be in translated region, 24 SNP positions were corresponded to the UTRs (3 SNPs in the 5′ UTR and 21 SNPs in the 3′ UTR) region. Rest, five SNP positions corresponded to the intron region connecting the first and second exons. The indel information corresponding to the gene region was also extracted. Out of 69 indel positions, no indel mutations were found in the coding region. But 24 indel positions were mapped into the 5′ UTR, 2 and 10 indels were mapped in the second exon and third exon, respectively, and 33 indel positions were mapped in the intron region. None of the Indel positions were mapped in the region being translated. The positions of indel and SNP corresponding to the specific regions in the DREB2A locus have been represented in Fig. 3.
Fig. 3.
Allele frequency for all SNP and indel positions in the queried region with reference to O. sativa japonica Nipponbare. X-axis represents genomic coordinates and Y-axis represents the allele frequency in percentage. The corresponding 5′ and 3′ UTRs, translated region and intron regions are marked
Multiple sequence alignment, phylogenetic analysis for OglDREB2A protein sequence
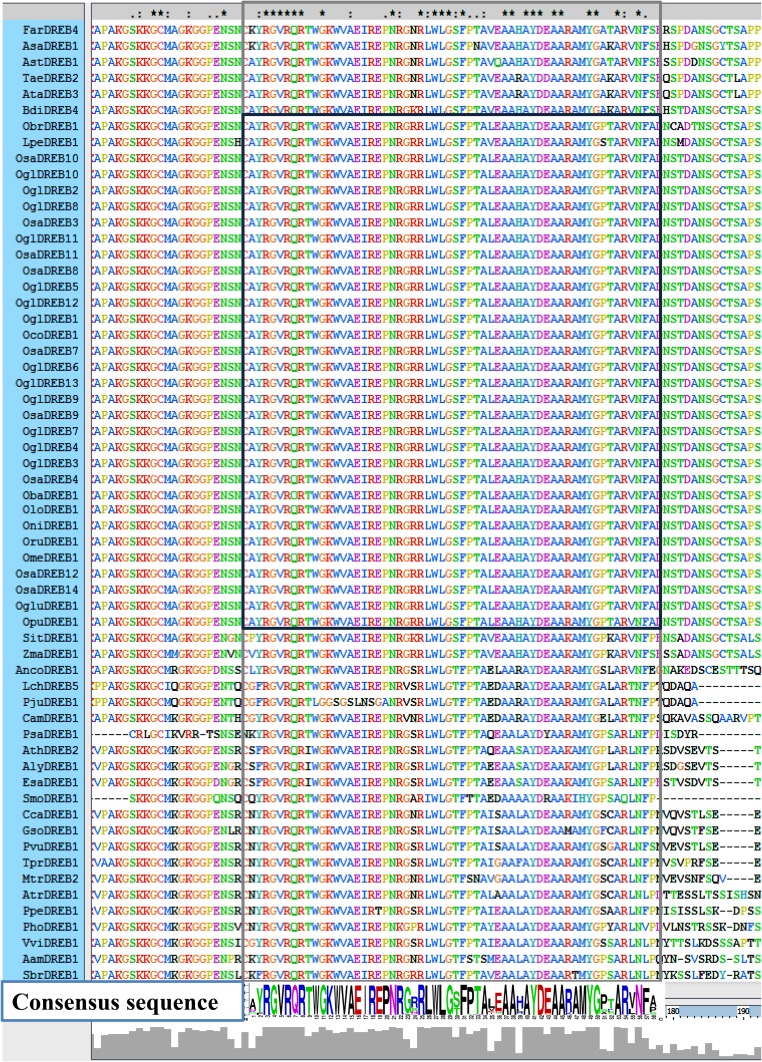
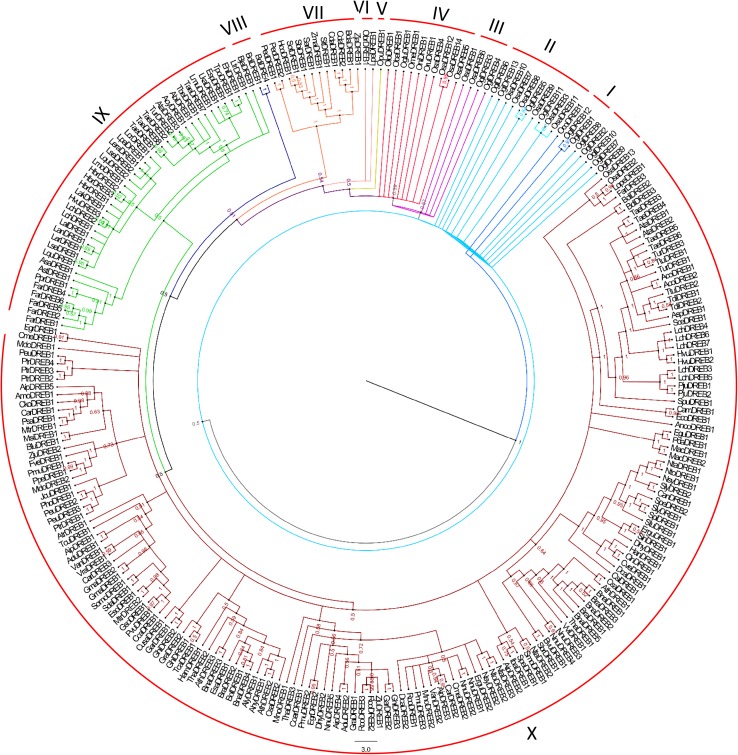
Multiple sequence alignment and consensus sequence for the AP2 domain of DREB2A across the rice species revealed sequence conservation as represented in Fig. 4. We developed a Bayesian phylogenetic tree of 253 different DREB gene identified in 129 species, with a much more robust node support (Fig. 5). Total 2702 number of trees was generated and summarized with sumt burnin = 400 tree. The developed consensus Bayesian phylogenetic tree was well resolved with posterior probability (PP) varied from 0.148 to 1. The phylogenetic tree was grouped into 10 main groups and nomenclature was done from the ancestral to recently evolved DREB gene. At the mid-point of the phylogenetic tree, one gene of O. coarctata (OcoDREB1), showed the ancestral evolution of DREB gene parallely grouped with two other genes of O. glaberrima (OglDREB1, OglDREB12). However, out of thirteen DREB genes of O. glaberrima, nine were grouped with six O. sativa species in Group II while other two genes were grouped in third group that showed the evolution of African and Asian rice DREB gene. Similarly, among all fourteen O. sativa species, four were cultured with six different wild species such as O. rufipogon, O. nivara, O. meridionalis, O. glumaepatula, O. barthii and O. longistaminata while other two were in group X. Among two other Oryza wild species, while O. punctate clustered in Group V, O. brachyantha was clustered in Group VI along with Leersia perrieri which is also a monocot nearest outgroup of the Oryza Species. Interestingly, the result highlighted the evolution and distribution of DREB genes from different wild to cultivated species of Oryza. Group VII to X does not contain any DREB sequences from wild species of rice. Group IX and X showed the highest number of DREB gene clustering, i.e. 42 and 162, respectively, consisting of several other plants.
Fig. 4.
Multiple sequence alignment of AP2 domain of DREB2A proteins performed using CLUSTAL X2. The alignment was developed from complete sequences of DREB2A proteins from eleven Oryza species as well as other members from Poaceae family. AP2 domain-containing region is demarcated by a blue box. The consensus sequence logo for the AP2 domain is shown below the blue box. The abbreviations of the gene name are given in Table S1
Fig. 5.
Bayesian phylogenetic tree. Developed Tree based on 253 different DREB gene sequence. The width colour and node value showed the posterior probability of respective node. The description of protein names have been given in Table S1
Tajima’s D was used to test whether OglDREB2A coding sequence was under any type of selection pressure. For this purpose, a population of 12 genotypes of O. glaberrima was used. Number of segregating sites was 9, nucleotide diversity π was 0.00344 and the Tajima’s D value was − 0.097.
Physical and chemical characteristics of OglDREB2A
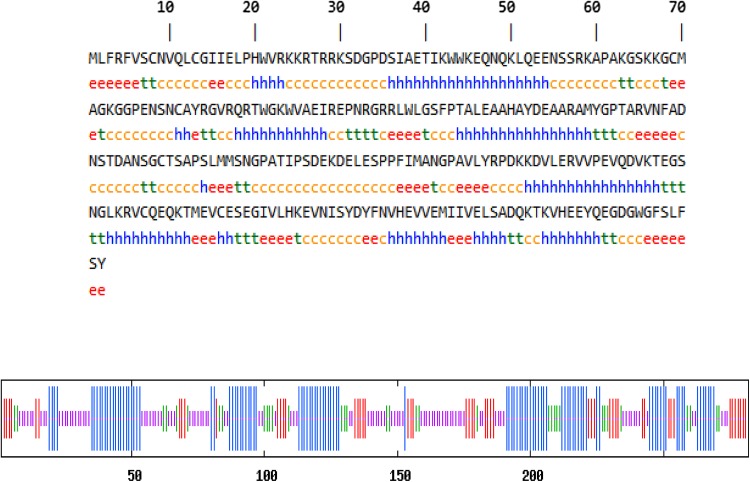
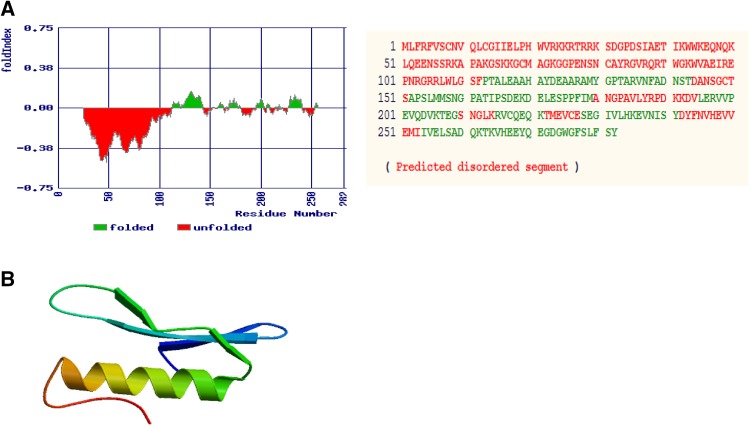
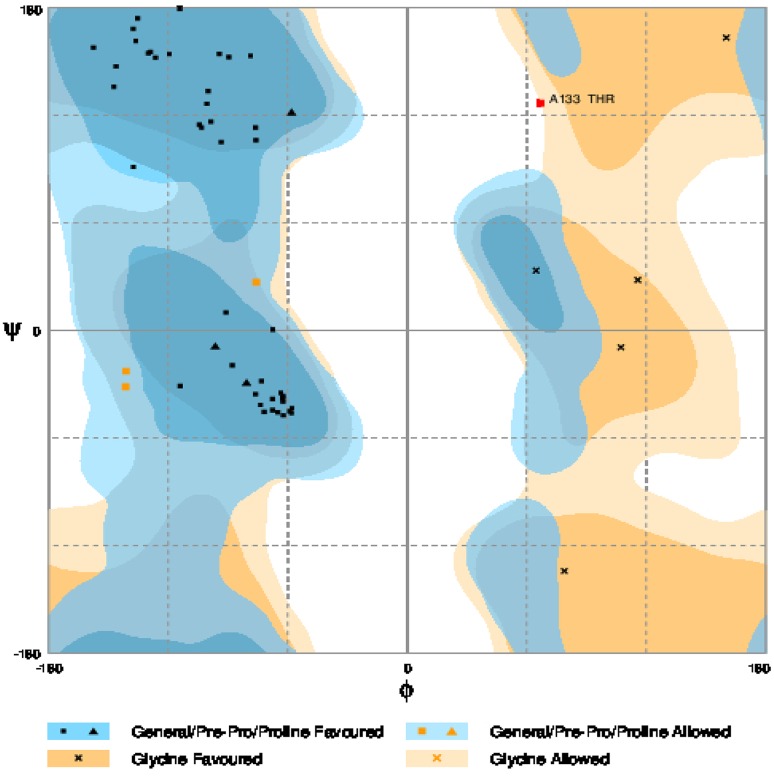
The physical and chemical parameters contribute to the structure as well as function of a protein. The coding sequences of OglDREB2A were found to be 846 bp and the translated protein length corresponds to 281 amino acids, respectively. The predicted secondary structure has 95 alpha helices, 36 β turns, 100 random coils and 50 extended strand (Fig. 6 and Table 1). The in silico folding analysis showed that the protein consists of five unfolded regions; the longest unfolded region being composed of 112 residues and the total number of amino acids forming a part of unfolded region is 181 amino acids out of 281 amino acids that the protein is composed of (Fig. 7a). ProtParam analysis of the protein sequence revealed that it consists of 47% of non-polar hydrophobic and 53% of polar hydrophilic amino acids. The molar extinction coefficient at 280 nm is 45,295 M−1 cm−1 assuming all Cys residues form disulphide bonds and 44,920 M−1 cm−1 assuming all the Cys residues are reduced. The instability index was computed to be 44.34, aliphatic index was found to be 66.26 and grand average of hydropathicity was found to be − 0.670 (Table 2). The 3D structures of proteins are important from the point of view that it aids in the study of protein function, dynamics as well as interaction with ligands. The residues of the 3D protein model, present in the allowed regions of Ramachandran plot were quantified so as to assess the stereochemical quality of the built model. The sequence was similar to seven templates with similarity range from 53.85 to 62.50%. However, the best model was selected based on the highest sequence similarity, GMQE and QMEAN scores. QMEAN is a composite scoring function for the estimation of the global and local model quality. GMQE (Global Model Quality Estimation) is a quality estimation which combines properties from the target-template alignment. The template that has maximum sequence similarity of 62.5% with the query sequence has the highest GMQE score of 0.13 and highest QMEAN score being − 0.57 was that of ATERF1. The pdb file of the model was downloaded (Fig. 7b) and Ramachandran plot in RAMPAGE server revealed that 92.6% of the residues lie in the most favoured regions, 5.6% in the allowed region and only one residue (133 Threonine) lies in the outlier region (Fig. 8).
Fig. 6.
Predicted secondary structure of O. glaberrima DREB2A from the genotype RAM100. Red vertical lines denote extended strand, green vertical lines denote beta turn, blue vertical lines denote alpha helix, violet vertical lines denote random coil. Amino acids taking part in corresponding secondary structures ‘e’ denotes extended strand, ‘t’ denotes beta turn, ‘c’ denotes random coil, ‘h’ denotes alpha helix
Table 1.
SOPMA analysis of Ogl DREB2A
| Number of amino acids | 281 amino acids |
| Alpha helix | 95 amino acids (33.81%) |
| Beta turn | 36 amino acids (12.81%) |
| Extended strand | 50 amino acids (17.8%) |
| Random coil | 100 amino acids (35.6%) |
Fig. 7.
3D model of O. glaberrima DREB2A protein developed in SWISS MODEL. a Predicted folding state of O. glaberrima DREB2A. Positive and negative numbers on Y-axis represent folding and unfolding regions. Numbers on X-axis represent amino acid residue numbers. b The best model was selected based on highest sequence identity with that of the template, best GMQE and QMEAN score. Higher GMQE and QMEAN scores indicate higher reliability of the built model
Table 2.
Protparam analysis of Ogl DREB2A
| Molecular weight (kDa) | 31.6 |
| Theoretical pI | 5.87 |
| Non-polar hydrophobic residues | 47% |
| Polar hydrophilic | 53% |
| Ext. coefficient at 280 nm (Cys oxidized form) | 45,295 mol−1 cm−1 |
| Ext. coefficient at 280 nm (Cys reduced form) | 44,920 mol−1 cm−1 |
| Estimated half-life | 30 h (mammalian reticulocytes, in vitro) |
| > 20 h (yeast, in vivo) | |
| > 10 h (Escherichia coli, in vivo) | |
| Instability index | 44.34 |
| Aliphatic index | 66.26 |
| Grand average of hydropathicity (GRAVY) | − 0.67 |
Fig. 8.
Ramachandran plot for predicted O. glaberrima DREB2A protein model
Intron–exon architecture of DREB2A across the Oryza species
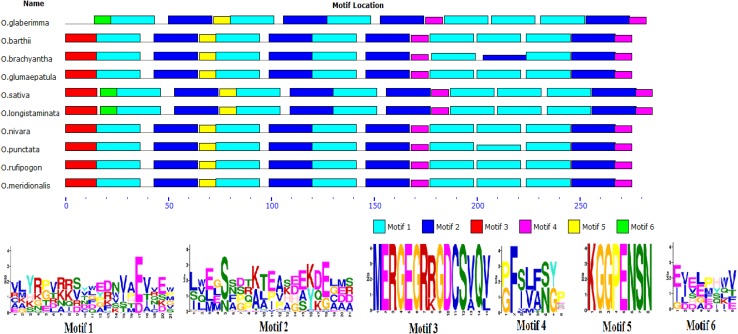
For PIECE analysis in GSDraw, the genomic sequences as well as coding sequences of DREB2A across the various Oryza species were used. The comparative lengths of exons and introns among the Oryza species have been represented in Fig. 9. PIECE analysis in GSDraw revealed that the length of the introns across the various Oryza species varied from a minimum of 545 bp in O. brachyantha to maximum of 625 bp in O. glumaepatula. Very interestingly, we found that OglDREB2A gene sequence is devoid of any introns which is composed of 846 base pairs. In all other Oryza species, the protein coding sequence has been distributed into two exons, the sizes of which ranged either 42 or 47 bp for the first exon, and 778 or 813 bp for the second exon (Fig. 9). Motif analysis revealed that while DREB2A consists of five motifs in O. glaberrima, O. barthii, O. brachyantha, O. glumaepatula, O. nivara, O. punctata, O. rufipogon and O. meridionalis, it had six motifs in O. sativa and O. longistaminata. Interestingly, one of the motifs identified were unique to O. sativa, O. longistaminata and O. glaberrima (Fig. 10).
Fig. 9.
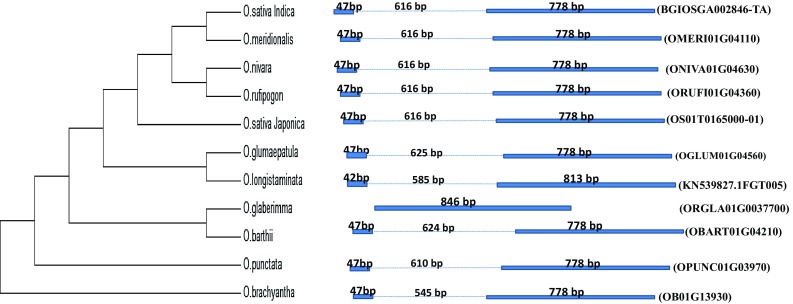
Intron–exon architecture analysis of DREB2A gene sequences of Oryza species using the PIECE webtool. The species are shown in the form of a cladogram and the respective intron exon structures are shown in the right. The solid blue bars indicate exon while the dotted lines indicate introns. The length of each intron and exon are indicated above the respective regions. The gene name for each species is indicated with first bracket
Fig. 10.
Excavation of protein motifs of DREB2A protein sequences from various species of Oryza using MEME webtool. The same genes have been used as mentioned in Fig. 9
Expression analysis of DREB2A in three different Oryza species by Q-PCR
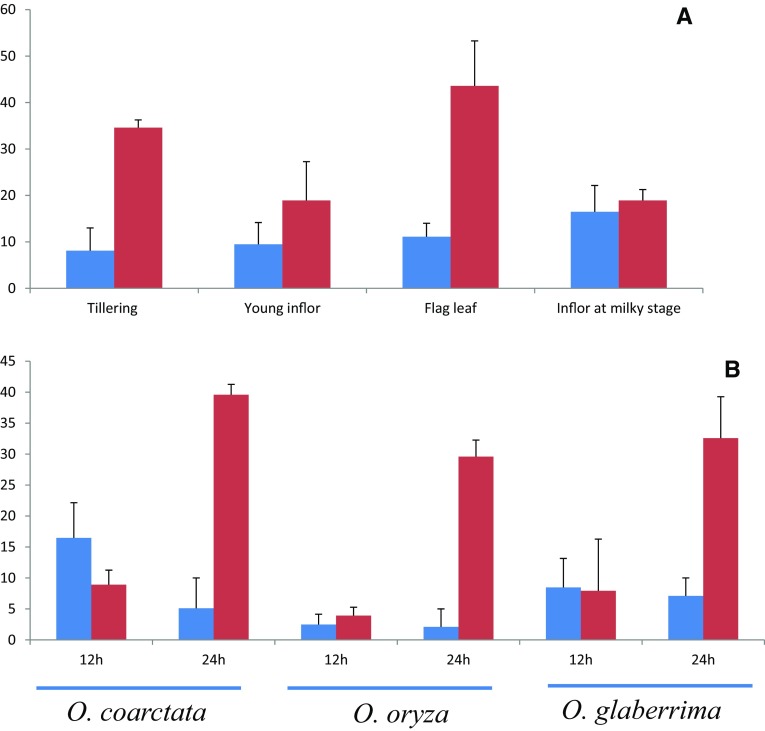
In the present study, two independent OglDREB2A expression studies were conducted. In a first, a quantitative comparison of OglDREB2A expression was made in different tissues at different stage of growth (Fig. 11a). It had been found that overall expression of OglDREB2A was higher under salinity stress at different stages of growth but was more at seedling stage and flag leaf stage. Further to study the interspecific conservation of expression pattern across the species of Oryza, we took three different species, namely O. coarctata, O. sativa and O. glaberrima, and studied the expression of DREB2A under saline conditions. It was found that OglDREB2A transcript was significantly upregulated under salinity after 24 h of treatment in comparison with the control seedlings. Also, the increase of expression levels under salinity stress was more in O. glaberrima than O. sativa but lesser than the halophyte O. coarctata. However, the enhanced expression of DREB2A on application of salt treatment indicates its interspecific functional similarity across the three different Oryza species (Fig. 11b). It is interesting to mention here that intron do not play any significant role in its expression as OglDREB2A is intronless.
Fig. 11.
Normalized fold change (indicated by vertical value) value of OsDREB2A transcripts expression as revealed by Q-PCR analysis. Top panel indicates tissue-specific expression under salinity stress (EC of ~ 10 dS m−1) of O. glaberrima. Bottom panel indicates in three different species of Oryza in 12 and 24 h salt treatment. a O. coarctata (450 mM). b O. staiva (200 mM) and c O. glaberrima (200 mM). Values are the means ± standard errors (n = 3). Different letters above the columns indicate significant difference at P < 0 0.05. The blue bar indicates control treatment and red bar indicates salinity treatment in both the panel
Discussion
DREB2A is a member of the dehydration responsive element-binding transcription factors and plays an important role in regulating the gene expression related to salinity and drought (Liu et al. 1998; Sakuma et al. 2002). In this study, important progress has been made in the estimation of expression of OglDREB2A under salinity stress. Phylogenetic analysis of DREB2A protein sequence of Oryza species and in diverse eudicot species has been carried out to understand the process of evolution in these species. Analysis of intron–exon architecture, in silico physical and chemical analysis provides insight into the evolution and predicted properties of OglDREB2A protein. Further, the selection pressure on the OglDREB2A coding sequence is estimated using Tajima’s D. In addition, analysis of the positions of the SNPs and indels at the corresponding DREB2A loci among the 3019 rice genotypes reveal the extent of sequence variation.
Phylogenetic analysis of Ogl DREB2A
The evolutionary relationship of OglDREB2A along with its orthologs was analysed. Multiple sequence alignment of DREB2A sequences of Oryza species showed a high level of sequence conservation in the AP2 domain while comparatively less sequence conservation with eudicot species. OglDREB2A sequence was clustered along with various rice species in one clade. Another clade was formed at the base of the phylogentic tree composed of sequences of DREB homologs from rice, Oryza coarcatata. The other clades had monocot species and dicot species in separate clusters. The analysis of the intron–exon architectures of the DREB2A gene sequences among Oryza species suggested that the length of the coding regions varied from 825 to 855 bp and intron length varied from 545 to 625 bp. However, OglDREB2A gene was intronless. From the diverse lengths of the introns, it can be suggested that the DREB2A orthologs with introns have evolved relatively more slowly than the OglDREB2A gene which does not have any intron. It has also been hypothesized that long intron region in the gene of DREB2A orthologs of rice species other than O. glaberrima is also correlated to gene essentiality apart from their slow evolution (Shin and Choi 2015). However, relationship between gene essentiality and rate of evolution of proteins is a matter of dispute (Wang and Zhang 2009). It is yet to be known whether the OglDREB2A sequence has lost its intron due to the selection pressure or the intron is left to be introgressed in its sequence by natural selection. Though introns present in a gene impose evolutionary novelties through processes such as exon shuffling, production of splice variants, control of mRNA integrity, promotion or favouring of recombination (Lage et al. 2011), yet the loss of intron in OglDREB2A ORF does not seem to impair its function but must have an evolutionary advantage. However, the clustering of O. glaberrima DREB2A to that of O. barthii suggests that the DREB2A protein sequences between these two species are closely related in accordance with the fact that O. glaberrima has been domesticated from its progenitor O. barthii (Sweeney and McCouch 2007). Motif analysis among the DREB2A protein sequences indicates a conserved array of motifs across all of the Oryza species which is indicative of the fact that the motifs are essential for proper functioning of the protein (Wuchty et al. 2003).
Physical and chemical characteristics of OglDREB2A
Analysis of the protein sequences of OglDREB2A revealed that the AP2 domain are found between 82nd and 139th amino acid residue and have the signature sequence which is 58 residues long. Homology modeling of the DNA-binding domain of OglDREB2A revealed the presence of three antiparallel beta sheets (β 1–3) and an alpha helix (α1) parallel to the beta sheets while the Ramachandran plot assessment of the protein demonstrates the presence of both α-helix and β-sheets along with the residues contributing to their formation in the final protein structure. Val86, Arg87, Glu88 form a part of the first β strand, Trp94 to Glu100 form a part of the second β strand while the third β strand consists of eight residues from Arg105 to Phe112. The alpha helix consists of 14 amino acids from Ala115 to Ala128. Similar structure of DREB2A orthologs from T. aestivum and L. chinensis has been reported which might suggest a functional similarity among these orthologues (Gao et al. 2014; Pandey et al. 2014). The folding state analysis of OglDREB2A suggests that 64.4% of the amino acid residues are in unfolded state in their native conformation and might undergo a conformational change on binding to the DNA. In silico analysis of T. aestivum and A. thaliana DREB2 sequences showed 60.4 and 59.7% of the total residues to be disordered, respectively, in their native state (Pandey et al. 2014). It was also reported that 35.6% of the amino acid residues form a part of random coil which may be the reason that majority of the DREB2A protein is natively unfolded (Dunker et al. 2001). However, the natively unfolded structure of OglDREB2A further needs to be validated by utilizing NMR spectroscopy. Protparam analysis revealed a GRAVY value of − 0.67 which demonstrates the hydrophilic nature of the protein (Smialowski et al. 2007). An instability index of 44.34 suggests that the protein may be unstable (Gasteiger et al. 2005a, b). However, the instability index is based on the primary protein sequence only and does not take into account influence of ligand binding and formation of disulphide bridges which imparts to the stability of the protein (Guruprasad et al. 1990).
Selection on OglDREB2A coding region
To examine the genetic variation in the coding region of OglDREB2A, Tajima’s D test was carried out to determine whether the region is departing from neutrality. The Tajima’s D value, calculated on the basis of difference between number of segregating sites and average number of nucleotide differences was negative (− 0.097). However, the negative value was not statistically significant (P > 0.10) which signifies lack of selection on the coding sequence and population is evolving in accordance to neutral theory of mutation. This states that the variation in the coding sequence of OglDREB2A is not due to natural selection but by genetic drift of mutant alleles that are neutral. These mutations do not impart significant variation within the species at the molecular level (Kimura 1983).
SNP and indel analysis of OsDREB2A gene region
In the present study, a relatively high number of SNPs and Indels are being observed in the UTRs, whereas coding regions do not have any of them which is essential for retaining the proper function. However, the effect of these mutations on the genotypes carrying them needs to be studied. It is known that UTRs interact with various protein complexes to initiate and regulate gene expression (Wilkie et al. 2003). Further, SNPs and indels in the introns may not have any adverse effect on the function of the protein; although mutations in the intron exon junction might bear unfavourable effects on recruiting of splicing machinery (Chorev and Carmel 2012; Romfo et al. 2000; Talerico and Berget 1990). Nonetheless, the indel mutations in the intronic region of a gene might cause a frameshift mutation, however, it has been reported that wherever the first indel causes a frameshift mutation leading to loss of function of the protein there is a tendency of a second frame-shifting indel to balance and restore its function (Hu and Ng 2012).
Expression analysis of OglDREB2A
Rice is more sensitive to salinity stress either at seedling or at reproductive stage (Singh and Flowers 2010). Exposure to salt stress during pollen development and fertilization brings about sterility in rice (Jenks et al. 2007). The upregulation of DREB2A in O. glaberrima in the seedling stage and young inflorescence stage on exposure to salt stress is indicative of the fact that DREB2A could be a part of providing salt stress tolerance at seedling as well as reproduction stage tolerance to O. glaberrima. Further, comparison of the salt-stressed interspecific expression pattern of DREB2A among O. coarctata, O. sativa and O. glaberrima revealed that overall it was upregulated among all the three species but degree of fold change or upregulation varied. For an example, the expression of OglDREB2A was intermediate between the halophyte O. coarctata and the glycophyte O. sativa. Upregulation of OsDREB2A on exposure to high-salinity stress have been already been reported. Overexpression of OsDREB2A resulted salinity stress tolerance in transgenic Arabidopsis and rice (Dubouzet et al. 2003; Wang et al. 2008; Mallikarjuna et al. 2011) indicating that this gene is definitely involved in salinity stress.
In conclusion, we have cloned and characterized a putative OglDREB2A gene from O. glaberrima. Various in silico parameters were used to characterize the gene which showed high degree of similarity with other DREB2A of angiosperms and has a signature of AP2 domain. Having seen its upregulation under salinity stress, sharing of a common ancestor with O. barthii and possessing a high degree of 3D protein structure similarity with ATERF1, as well as its grouping with other DREB2A in phylogenic tree, enable us to conclude that it plays an important role in regulation of salinity stress responses in O. glaberrima.
Electronic supplementary material
Below is the link to the electronic supplementary material.
Acknowledgements
Mr. Abubakar Mohammad Gumi is thankful to Centre for Science and Technology of Non-Aligned and Other Developing Countries, New Delhi, for providing a fellowship to carry out this work. We are also thankful to Dr. K. V. Bhat and Dr. K. C. Bansal for providing the facility and Mr. Showkat Ahmad Ganei for technical help.
Compliance with ethical standards
Conflict of interest
The authors do not have any conflict of interest.
Footnotes
Abubakar Mohammad Gumi and Pritam Kanti Guha contributed equally.
Electronic supplementary material
The online version of this article (10.1007/s13205-018-1098-1) contains supplementary material, which is available to authorized users.
References
- Achard P, Cheng H, De Grauwe L, Decat J, Schoutteten H, Moritz T, Van Der Straeten D, Peng J, Harberd NP. Integration of plant responses to environmentally activated phytohormonal signals. Science. 2006;311:91–94. doi: 10.1126/science.1118642. [DOI] [PubMed] [Google Scholar]
- Agarwal P, Agarwal PK, Joshi AJ, Sopory SK, Reddy MK. Overexpression of PgDREB2A transcription factor enhances abiotic stress tolerance and activates downstream stress-responsive genes. Mol Biol Rep. 2010;37:1125–1135. doi: 10.1007/s11033-009-9885-8. [DOI] [PubMed] [Google Scholar]
- Agnoun Y, Biaou SS, Sié M, Vodouhè RS, Ahanchédé A. The African rice Oryza glaberrima Steud: knowledge distribution and prospects. Inter J Biol. 2012;4:158–168. [Google Scholar]
- Alexandrov N, et al. SNP-Seek database of SNPs derived from 3000 rice genomes. Nucl Acids Res. 2015;43:D1023–D1027. doi: 10.1093/nar/gku1039. [DOI] [PMC free article] [PubMed] [Google Scholar]
- Awala SK, Nanhapo I, Sakagami JI, Kanyomeka L, Iijima M. Differential salinity tolerance among Oryza glaberrima, Oryza sativa and their interspecies including NERICA. Plant Prod Sci. 2010;13:3–10. doi: 10.1626/pps.13.3. [DOI] [Google Scholar]
- Bailey TL, Boden M, Buske FA, Frith M, Grant CE, Clementi L, Ren J, Li WW, Noble WS. MEME Suite: tools for motif discovery and searching. Nucl Acids Res. 2009;37(Suppl 2):W202–W208. doi: 10.1093/nar/gkp335. [DOI] [PMC free article] [PubMed] [Google Scholar]
- Barrett LW, Fletcher S, Wilton SD. Untranslated gene regions and other non-coding elements. In untranslated gene regions and other non-coding elements. Basel: Springer; 2013. pp. 1–56. [DOI] [PMC free article] [PubMed] [Google Scholar]
- Bhatnagar-Mathur P, Vadez V, Sharma KK. Transgenic approaches for abiotic stress tolerance in plants: retrospect and prospects. Plant Cell Rep. 2008;27:411–424. doi: 10.1007/s00299-007-0474-9. [DOI] [PubMed] [Google Scholar]
- BiasiniM Bienert S, Waterhouse A, Arnold K, Studer G, Schmidt T, Kiefer F, Cassarino TG, Bertoni M, Bordoli L, Schwede T. SWISS-MODEL: modeling protein tertiary and quaternary structure using evolutionary information. Nucl Acids Res. 2014;42((Web Server issue)):W252–W258. doi: 10.1093/nar/gku340. [DOI] [PMC free article] [PubMed] [Google Scholar]
- Bihani P, Char B, Bhargava S. Transgenic expression of sorghum DREB2 in rice improves tolerance and yield under water limitation. J Agric Sci. 2011;149:95–101. doi: 10.1017/S0021859610000742. [DOI] [Google Scholar]
- Chen L, Han J, Deng X, Tan S, Li L, Li L, Zhou J, Peng H, Yang G, He G, Zhang W. Expansion and stress responses of AP2/EREBP superfamily in Brachypodium distachyon. Sci Rep. 2016;6:21623. doi: 10.1038/srep21623. [DOI] [PMC free article] [PubMed] [Google Scholar]
- Chorev M, Carmel L. The function of introns. Front Genet. 2012;3:1–5. doi: 10.3389/fgene.2012.00055. [DOI] [PMC free article] [PubMed] [Google Scholar]
- Crooks GE, Hon G, Chandonia JM, Brenner SE. WebLogo: a sequence logo generator. Genome Res. 2004;14:1188–1190. doi: 10.1101/gr.849004. [DOI] [PMC free article] [PubMed] [Google Scholar]
- Da Lage JL, Maczkowiak F, Cariou ML. Phylogenetic distribution of intron positions in alpha-amylase genes of bilateria suggests numerous gains and losses. PLoS ONE. 2011;6:e19673. doi: 10.1371/journal.pone.0019673. [DOI] [PMC free article] [PubMed] [Google Scholar]
- de Paiva Rolla AA, Carvalho JD, Fuganti-Pagliarini R, Engels C, Do Rio A, Marin SR, de Oliveira MC, Beneventi MA, Marcelino-Guimaraes FC, Farias JR, Neumaier N. Phenotyping soybean plants transformed with rd29A:AtDREB1A for drought tolerance in the greenhouse and field. Trans Res. 2014;23:75–87. doi: 10.1007/s11248-013-9723-6. [DOI] [PubMed] [Google Scholar]
- Dubouzet JG, Sakuma Y, Ito Y, Kasuga M, Dubouzet EG, Miura S, Seki M, Shinozaki K, Yamaguchi-Shinozaki K. OsDREB genes in rice, Oryza sativa L., encode transcription activators that function in drought, high salt and cold responsive gene expression. Plant J. 2003;33:751–763. doi: 10.1046/j.1365-313X.2003.01661.x. [DOI] [PubMed] [Google Scholar]
- Dunker AK, Lawson JD, Brown CJ, Williams RM, Romero P, Oh JS, Oldfield CJ, Campen AM, Ratliff CM, Hipps KW, Ausio J, Nissen MS, Reeves R, Kang C, Kissinger CR, Bailey RW, Griswold MD, Chiu W, Garner EC, Obradovic Z. Intrinsically disordered protein. J Mol Graph Model. 2001;19:26–59. doi: 10.1016/S1093-3263(00)00138-8. [DOI] [PubMed] [Google Scholar]
- Dunker AK, Brown CJ, Obradovic Z. Identification and functions of usefully disordered proteins. Adv Protein Chem. 2002;62:25–49. doi: 10.1016/S0065-3233(02)62004-2. [DOI] [PubMed] [Google Scholar]
- Dyson HJ, Wright PE. Intrinsically unstructured proteins and their functions. Nat Rev Mol Cell Biol. 2005;6:197–208. doi: 10.1038/nrm1589. [DOI] [PubMed] [Google Scholar]
- FigTree v1.4.3 2006–2016 (2017). http://tree.bio.ed.ac.uk/software/figtree/. Accessed 26 Nov 2017
- Flowers TJ, Yeo AR. Variability in the resistance of sodium chloride salinity within rice (Oryza sativa L.) varieties. New Phytol. 1981;88:363–373. doi: 10.1111/j.1469-8137.1981.tb01731.x. [DOI] [Google Scholar]
- Ganie SA, Pani DR, Mondal TK. Genome-wide analysis of DUF221 domain-containing gene family in Oryza species and identification of its salinity stress-responsive members in rice. PLoS ONE. 2017;12(8):e0182469. doi: 10.1371/journal.pone.0182469. [DOI] [PMC free article] [PubMed] [Google Scholar]
- Gao Gang, Deng Jiabin, Gou Xuemei, Wang Qian, Yang Ruiwu. Cloning and bioinformation analysis of DREB2 gene from Leymus chinensis Tzvelev (Poaceae: Trticeae) J Res Agric Anim Sci. 2014;2:12–20. [Google Scholar]
- Gasteiger E, Hoogland C, Gattiker A, Duvaud S, Wilkins MR, Appel RD, Bairoch A. protein identification and analysis tools on the ExPASy server. In: Walker John M., editor. The proteomics protocols handbook. New York: Humana Press; 2005. pp. 571–607. [Google Scholar]
- Gasteiger E, Hoogland C, Gattiker A, Duvaud SE, Wilkins MR, Appel RD, Bairoch A. Protein identification and analysis tools on the ExPASy server. New York: Humana Press; 2005. [DOI] [PubMed] [Google Scholar]
- Geourjon C, Deléage G. SOPMA: significant improvements in protein secondary structure prediction by consensus prediction from multiple alignments. Comput Appl Biosci. 1995;11:681–684. doi: 10.1093/bioinformatics/11.6.681. [DOI] [PubMed] [Google Scholar]
- Goodrich J, Carpenter R, Coen ES. A common gene regulates pigmentation pattern in diverse plant species. Cell. 1992;68:955–964. doi: 10.1016/0092-8674(92)90038-E. [DOI] [PubMed] [Google Scholar]
- Guo B, Wei Y, Xu R, Lin S, Luan H, Lv C, Zhang X, Song X, Xu R. Genome-wide analysis of APETALA2/ethylene-responsive factor (AP2/ERF) gene family in barley (Hordeum vulgare L.) PLoS ONE. 2016;11:e0161322. doi: 10.1371/journal.pone.0161322. [DOI] [PMC free article] [PubMed] [Google Scholar]
- Guruprasad K, Reddy BB, Pandit MW. Correlation between stability of a protein and its dipeptide composition: a novel approach for predicting in vivo stability of a protein from its primary sequence. Protein Eng. 1990;4:155–161. doi: 10.1093/protein/4.2.155. [DOI] [PubMed] [Google Scholar]
- Hall TA. BioEdit: a user-friendly biological sequence alignment editor and analysis program for Windows 95/98/NT. Nucleic Acids Symp Ser. 1999;41:95–98. [Google Scholar]
- Hasegawa PM, Bressan RA, Zhu JK, Bhonert HJ. Plant cellular and molecular responses to high salinity. Ann Rev Plant Physiol. 2000;51:463–499. doi: 10.1146/annurev.arplant.51.1.463. [DOI] [PubMed] [Google Scholar]
- He JX, Mu RL, Cao WH, Zhang ZG, Zhang JS, Chen SY. AtNAC2, a transcription factor downstream of ethylene and auxin signaling pathways, is involved in salt stress response and lateral root development. Plant J. 2005;44:903–916. doi: 10.1111/j.1365-313X.2005.02575.x. [DOI] [PubMed] [Google Scholar]
- Henikoff S, Henikoff JG. Amino acid substitution matrices from protein blocks. Pro Natl Aca Sci. 1992;89:10915–10919. doi: 10.1073/pnas.89.22.10915. [DOI] [PMC free article] [PubMed] [Google Scholar]
- Hossain H, Rahman MA, Alam MS, Singh RK. Mapping of quantitative trait loci associated with reproductive-stage salt tolerance in rice. J Agro Crop Sci. 2015;201:17–31. doi: 10.1111/jac.12086. [DOI] [Google Scholar]
- Hu J, Ng PC. Predicting the effects of frame shifting indels. Genome Biol. 2012;13:1–11. doi: 10.1186/gb-2012-13-2-r9. [DOI] [PMC free article] [PubMed] [Google Scholar]
- Huang BL, Zhang XK, Li YY, Li DY, Ma MY, Cai DT, Wu WH, Huang BQ. Cloning and characterization of the dehydration-responsive element-binding protein 2A gene in Eruca vesicaria subsp. sativa. Genet Mol Res. 2016;15:23–29. doi: 10.4238/gmr.15038540. [DOI] [PubMed] [Google Scholar]
- Jenks MA, Hasegawa PM, Mojan Jain S, editors. Advances in molecular breeding toward drought and salt tolerant crops. Springer: Berlin; 2007. p. 812. [Google Scholar]
- Jones MP, Dingkuhn M, Aluko GK, Semon M. Interspecific Oryza sativa L. × O. glaberrima Steud. progenies in upland rice improvement. Euphytica. 1997;94:237–246. doi: 10.1023/A:1002969932224. [DOI] [Google Scholar]
- Jones PM, Mande S, Aluko K. Diversity and potential of O. glaberrima Steud in upland rice breeding. Breed Sci. 1997;47:395–398. [Google Scholar]
- Jones P, Binns D, Chang H-Y, Fraser M, Li W, McAnulla C, McWilliam H, Maslen J, Mitchell A, Nuka G, Pesseat S, Quinn AF, Sangrador-Vegas A, Scheremetjew M, Yong S-Y, Lopez R, Hunter S. InterProScan 5: genome-scale protein function classification. Bioinformatics. 2014;30:1236–1240. doi: 10.1093/bioinformatics/btu031. [DOI] [PMC free article] [PubMed] [Google Scholar]
- Joseph EA, Mohanan KV. A study on the effect of salinity stress on the growth and yield of some native rice cultivars of Kerala state of India. Agric Fish. 2013;2:141–150. [Google Scholar]
- Kersey PJ, Allen JE, Armean I, Boddu S, Bolt BJ, Carvalho-Silva D, Christensen M, Davis P, Falin LJ, Grabmueller C, Humphrey J. Ensembl genomes 2016: more genomes, more complexity. Nucleic Acid Res. 2016;44(D1):D574–D580. doi: 10.1093/nar/gkv1209. [DOI] [PMC free article] [PubMed] [Google Scholar]
- Khan MS. The role of DREB transcription factors in abiotic stress tolerance of plants. Biotech Biotech Equip. 2011;25:2433–2442. doi: 10.5504/BBEQ.2011.0072. [DOI] [Google Scholar]
- Khan MS, Khan MA, Ahmad D. Assessing utilization and environmental risks of important genes in plant abiotic stress tolerance. Front Plant Sci. 2016;7:792. doi: 10.3389/fpls.2016.00792. [DOI] [PMC free article] [PubMed] [Google Scholar]
- Kimura M. Rare variant alleles in the light of the neutral theory. Mol Biol Evol. 1983;1:84–93. doi: 10.1093/oxfordjournals.molbev.a040305. [DOI] [PubMed] [Google Scholar]
- Larkin MA, Blackshields G, Brown NP, Chenna R, McGettigan PA, McWilliam H, Valentin F, Wallace IM, Wilm A, Lopez R, Thompson JD, Gibson TJ, Higgins DG. Clustal W and Clustal X 2.0. Bioinformatics. 2007;23:2947–2948. doi: 10.1093/bioinformatics/btm404. [DOI] [PubMed] [Google Scholar]
- Lata C, Mishra AK, Muthamilarasan M, Bonthala VS, Khan Y, Prasad M. Genome-wide investigation and expression profiling of AP2/ERF transcription factor superfamily in foxtail millet (Setaria italica L.) PLoS ONE. 2014;9:e113092. doi: 10.1371/journal.pone.0113092. [DOI] [PMC free article] [PubMed] [Google Scholar]
- Librado P, Rozas J. DnaSP v5: a software for comprehensive analysis of DNA polymorphism data. Bioinformatics. 2009;25:1451–1452. doi: 10.1093/bioinformatics/btp187. [DOI] [PubMed] [Google Scholar]
- Linares OF. African rice (Oryza glaberrima): history and future potential. Proc Natl Acad Sci USA. 2002;99:16360–16365. doi: 10.1073/pnas.252604599. [DOI] [PMC free article] [PubMed] [Google Scholar]
- Liu Q, Kasuga M, Sakuma Y, Abe H, Miura S, Yamaguchi-Shinozaki K, Shinozaki K. Two transcription factors, DREB1 and DREB2, with an EREBP/AP2 DNA binding domain separate two cellular signal transduction pathways in drought- and low-temperature-responsive gene expression, respectively, in Arabidopsis. Plant Cell. 1998;10:1391–1406. doi: 10.1105/tpc.10.8.1391. [DOI] [PMC free article] [PubMed] [Google Scholar]
- Liu S, Wang X, Wang H, Xin H, Yang X, Yan J, Li J, Tran LSP, Shinozaki K, Yamaguchi-Shinozaki K, Qin F. Genome-wide analysis of ZmDREB genes and their association with natural variation in drought tolerance at seedling stage of Zea mays L. PLoS Genet. 2013;9:e1003790. doi: 10.1371/journal.pgen.1003790. [DOI] [PMC free article] [PubMed] [Google Scholar]
- Lovell SC, Davis IW, Arendall WB, 3rd, de Bakker PI, Word JM, Prisant MG, Richardson JS, Richardson DC. Structure validation by Calpha geometry: phi, psi and Cbeta deviation. Proteins. 2003;50:437–450. doi: 10.1002/prot.10286. [DOI] [PubMed] [Google Scholar]
- Mallikarjuna G, Mallikarjuna K, Reddy MK, Kaul T. Expression of OsDREB2A transcription factor confers enhanced dehydration and salt stress tolerance in rice (Oryza sativa L.) Biotech Lett. 2011;33:1689–1697. doi: 10.1007/s10529-011-0620-x. [DOI] [PubMed] [Google Scholar]
- Mare C, Mazzucotelli E, Crosatti C, Francia E, Cattivelli L. Hv-WRKY38: a new transcription factor involved in cold-and drought-response in barley. Plant Mol Biol. 2004;55:399–416. doi: 10.1007/s11103-004-0906-7. [DOI] [PubMed] [Google Scholar]
- Mizoi J, Ohori T, Moriwaki T, Kidokoro S, Todaka D, Maruyama K, Kusakabe K, Osakabe Y, Shinozaki K, Yamaguchi-Shinozaki K. GmDREB2A; 2, a canonical DEHYDRATION-RESPONSIVE ELEMENT-BINDING PROTEIN2-type transcription factor in soybean, is posttranslationally regulated and mediates dehydration-responsive element-dependent gene expression. Plant Physiol. 2013;161:346–361. doi: 10.1104/pp.112.204875. [DOI] [PMC free article] [PubMed] [Google Scholar]
- Mondal TK, Ganie SA, Debnath AB. Identification of novel and conserved mirnas from extreme Halophyte, Oryza coarctata, a wild relative of rice. PLoS ONE. 2015;10(10):e0140675. doi: 10.1371/journal.pone.0140675. [DOI] [PMC free article] [PubMed] [Google Scholar]
- Mondal TK, Panda AK, Rawal HC, Sharma TR. Discovery of microRNA-target modules of African rice (Oryza glaberrima) under salinity stress. Sci Repo. 2018;8:570. doi: 10.1038/s41598-017-18206-z. [DOI] [PMC free article] [PubMed] [Google Scholar]
- Ouyang S, Zhu W, Hamilton J, Lin H, Campbell M, Childs K, Thibaud-Nissen F, Malek RL, Lee Zheng L, Orvis J, Haas B, Wortman J, Buell CR. The TIGR rice genome annotation resource: improvements and new features. Nucleic Acids Res. 2007;35:D883–D887. doi: 10.1093/nar/gkl976. [DOI] [PMC free article] [PubMed] [Google Scholar]
- Palao CDC, Viña CBD, Gregorio GB, Singh RK. A new phenotyping technique for salinity tolerance at the reproductive stage in rice. Oryza. 2013;50:199–207. [Google Scholar]
- Pandey B, Sharma P, Saini M, Pandey DM, Sharma I. Isolation and characterization of dehydration-responsive element-binding factor 2 (DREB2) from Indian wheat (Triticum aestivum L.) cultivars. Aust J Crop Sci. 2014;8:44–57. [Google Scholar]
- Ponnamperuma FN. Role of cultivar tolerance in increasing rice production in saline lands. In: Staples RC, Toenniessen GH, editors. Salinity tolerance in plants: strategies for crop improvement. New York: Wiley; 1984. pp. 255–271. [Google Scholar]
- Priluskyl J, Felder CE, Zeev-Ben-Mordehai T, Rydberg EH, Man O, Beckmann JS, Silman I, Sussman JL. FoldIndex©: a simple tool to predict whether a given protein sequence is intrinsically unfolded. Bioinform. 2005;21:3435–3438. doi: 10.1093/bioinformatics/bti537. [DOI] [PubMed] [Google Scholar]
- Ramírez-Soriano A, Ramos-Onsins SE, Rozas J, Calafell F, Navarro A. Statistical power analysis of neutrality tests under demographic expansions, contractions and bottlenecks with recombination. Genetics. 2008;179:555–567. doi: 10.1534/genetics.107.083006. [DOI] [PMC free article] [PubMed] [Google Scholar]
- Ricachenevsky FK, Sperotto RA. Into the wild: Oryza species as sources for enhanced nutrient accumulation and metal tolerance in rice. Front Plant Sci. 2016;7:974. doi: 10.3389/fpls.2016.00974. [DOI] [PMC free article] [PubMed] [Google Scholar]
- Riechmann JL, Heard J, Martin G, Reuber L, Jiang C, Keddie J, Adam L, Pineda O, Ratcliffe OJ, Samaha RR, Creelman R, Pilgrim M, Broun P, Zhang JZ, Ghandehari D, Sherman BK, Yu G. Arabidopsis transcription factor: genome wide comparative analysis among eukaryotes. Science. 2000;290:2105–2110. doi: 10.1126/science.290.5499.2105. [DOI] [PubMed] [Google Scholar]
- Romfo CM, Alvarez CJ, van Heeckeren WJ, Webb CJ, Wise JA. Evidence for splice site pairing via intron definition in Schizosaccharomyces pombe. Mol Cell Biol. 2000;20:7955–7970. doi: 10.1128/MCB.20.21.7955-7970.2000. [DOI] [PMC free article] [PubMed] [Google Scholar]
- Ronquist F, Huelsenbeck JP. MRBAYES 3: Bayesian phylogenetic inference under mixed models. Bioinformatics. 2003;19:1572–1574. doi: 10.1093/bioinformatics/btg180. [DOI] [PubMed] [Google Scholar]
- Sadhukhan A, Kobayashi Y, Kobayashi Y, Tokizawa M, Yamamoto YY, Iuchi S, Koyama H, Panda SK, Sahoo L. VuDREB2A, a novel DREB2-type transcription factor in the drought-tolerant legume cowpea, mediates DRE-dependent expression of stress-responsive genes and confers enhanced drought resistance in transgenic Arabidopsis. Planta. 2014;240:645–664. doi: 10.1007/s00425-014-2111-5. [DOI] [PubMed] [Google Scholar]
- Saint Pierre C, Crossa JL, Bonnett D, Yamaguchi-Shinozaki K, Reynolds MP. Phenotyping transgenic wheat for drought resistance. J Exp Bot. 2012;63:1799–1808. doi: 10.1093/jxb/err385. [DOI] [PubMed] [Google Scholar]
- Sakuma Y, Liu Q, Dubouzet JG, Abe H, Shinozaki K, Yamaguchi-Shinozaki K. DNA-binding specificity of the ERF/AP2 domain of Arabidopsis DREBs, transcription factors involved in dehydration- and cold-inducible gene expression. Biochem Biophys Res Commun. 2002;290:998–1009. doi: 10.1006/bbrc.2001.6299. [DOI] [PubMed] [Google Scholar]
- Sakuma Y, Maruyama K, Osakabe Y, Qin F, Seki M, Shinozaki K, Yamaguchi-Shinozaki K. Functional analysis of an Arabidopsis transcription factor, DREB2A, involved in drought-responsive gene expression. Plant Cell. 2006;18:1292–1309. doi: 10.1105/tpc.105.035881. [DOI] [PMC free article] [PubMed] [Google Scholar]
- Saleh J, Maftoun M. Interactive effect of NaCl levels and zinc sources and levels on the growth and mineral composition of rice. J Agric Sci Tech. 2008;10:325–336. [Google Scholar]
- Sazegari S, Niazi A, Ahmadi FS. A study on the regulatory network with promoter analysis for Arabidopsis DREB-genes. Bioinform. 2015;11:101–108. doi: 10.6026/97320630011101. [DOI] [PMC free article] [PubMed] [Google Scholar]
- Schmittgen TD, Livak KJ. Analyzing real-time PCR data by the comparative CT method. Nat Protoc. 2008;3:1101–1108. doi: 10.1038/nprot.2008.73. [DOI] [PubMed] [Google Scholar]
- Shafeinie A, Mohammadi V, Alizadeh H, Zali AA. Overexpression of Arabidopsis dehydration-responsive element-binding protein 2A confers tolerance to salinity stress to transgenic canola. Pak J Biol Sci. 2014;17:619–629. doi: 10.3923/pjbs.2014.619.629. [DOI] [PubMed] [Google Scholar]
- Shin SH, Choi SS. Lengths of coding and noncoding regions of a gene correlate with gene essentiality and rates of evolution. Genes Genome. 2015;37:365–374. doi: 10.1007/s13258-015-0265-6. [DOI] [Google Scholar]
- Sié M, Dogbe SY, Coulibaly M. Selection of interspecific hybrids (O. sativa x O. glaberrima or lowland NERICAs) and intraspecifics adapted to rainfed lowland growing conditions. Int Rice Comm Newslett. 2005;54:47–51. [Google Scholar]
- Singh RK, Flowers TJ. The physiology and molecular biology of the effects of salinity on rice. In: Pessarakli M, editor. Third Edition of “Handbook of Plant and Crop Stress”. Taylor and Francis: Publisher; 2010. pp. 899–939. [Google Scholar]
- Smialowski P, Martin-Galiano AJ, Cox J, Frishman D. Predicting experimental properties of proteins from sequence by machine learning techniques. Curr Protein Pept Sci. 2007;8:121–133. doi: 10.2174/138920307780363398. [DOI] [PubMed] [Google Scholar]
- Song X, Li Y, Hou X. Genome-wide analysis of the AP2/ERF transcription factor superfamily in Chinese cabbage (Brassica rapa ssp. pekinensis) BMC Genome. 2013;14:573. doi: 10.1186/1471-2164-14-573. [DOI] [PMC free article] [PubMed] [Google Scholar]
- Sweeney M, McCouch S. The complex history of the domestication of rice. Ann Bot. 2007;100:951–957. doi: 10.1093/aob/mcm128. [DOI] [PMC free article] [PubMed] [Google Scholar]
- Tajima F. Statistical method for testing the neutral mutation hypothesis by DNA polymorphism. Genet. 1989;123:585–595. doi: 10.1093/genetics/123.3.585. [DOI] [PMC free article] [PubMed] [Google Scholar]
- Talerico ME, Berget SM. Effect of 5′ splice site mutations on splicing of the preceding intron. Mol Cell Biol. 1990;10:6299–6305. doi: 10.1128/MCB.10.12.6299. [DOI] [PMC free article] [PubMed] [Google Scholar]
- Tamura K, Stecher G, Peterson D, Filipski A, Kumar S. MEGA6: molecular evolutionary genetics analysis version 6.0. Mol Biol Evol. 2013;30:2725–2729. doi: 10.1093/molbev/mst197. [DOI] [PMC free article] [PubMed] [Google Scholar]
- Thamilarasan SK, Park J, Jung H, Nou I. Genome-wide analysis of the distribution of AP2/ERF transcription factors reveals duplication and CBFs genes elucidate their potential function in Brassica oleraceae. BMC Genome. 2014;15:422. doi: 10.1186/1471-2164-15-422. [DOI] [PMC free article] [PubMed] [Google Scholar]
- Uno Y, Furihata T, Abe H, Yoshida R, Shinozaki K, Yamaguchi-Shinozaki K. Arabidopsis basic leucine zipper transcription factors involved in abscisic-acid-dependent signal transduction pathway under drought and high salinity conditions. Proc Natl Acad Sci USA. 2000;97:11632–11637. doi: 10.1073/pnas.190309197. [DOI] [PMC free article] [PubMed] [Google Scholar]
- Wang Z, Zhang J. Why is the correlation between gene importance and gene evolutionary rate so weak? PLoS Genet. 2009;5:e1000329. doi: 10.1371/journal.pgen.1000329. [DOI] [PMC free article] [PubMed] [Google Scholar]
- Wang Q, Guan Y, Wu Y, Chen H, Chen F, Chu C. Overexpression of a rice OsDREB1F gene increases salt, drought, and low temperature tolerance in both Arabidopsis and rice. Plant Mol Biol. 2008;67:589–602. doi: 10.1007/s11103-008-9340-6. [DOI] [PubMed] [Google Scholar]
- Wang Y, You FM, Lazo GR, Luo MC, Thilmony R, Gordon S, Kianian SF, Gu YQ. PIECE: a database for plant gene structure comparison and evolution. Nucleic Acids Res. 2013;41((Database issue)):D1159–D1166. doi: 10.1093/nar/gks1109. [DOI] [PMC free article] [PubMed] [Google Scholar]
- Wang M, Yu Y, Haberer G, Marri PR, Fan C, Goicoechea JL, Zuccolo A, Song X, Kudrna D, Ammiraju JS, Cossu RM, Maldonado C, Chen J, Lee S, Sisneros N, de Baynast K, Golser W, Wissotski M, Kim W, Sanchez P, Ndjiondjop MN, Sanni K, Long M, Carney J, Panaud O, Wicker T, Machado CA, Chen M, Mayer KF, Rounsley S, Wing RA. The genome sequence of African rice (Oryza glaberrima) and evidence for independent domestication. Nat Genet. 2014;46:982–988. doi: 10.1038/ng.3044. [DOI] [PMC free article] [PubMed] [Google Scholar]
- Watterson GA. On the number of segregating sites in genetical models without recombination. Theor Popul Biol. 1975;7:256–276. doi: 10.1016/0040-5809(75)90020-9. [DOI] [PubMed] [Google Scholar]
- Wei T, Deng K, Liu D, Gao Y, Liu Y, Yang M, Zhang L, Zheng X, Wang C, Song W, Chen C. Ectopic expression of DREB transcription factor, AtDREB1A, confers tolerance to drought in transgenic Salvia miltiorrhiza. Plant Cell Physiol. 2016;57:1593–1609. doi: 10.1093/pcp/pcw084. [DOI] [PubMed] [Google Scholar]
- Wilkie GS, Dickson KS, Gray NK. Regulation of mRNA translation by 5′- and 3′-UTR-binding factors. Trends Biochem Sci. 2003;28:182–188. doi: 10.1016/S0968-0004(03)00051-3. [DOI] [PubMed] [Google Scholar]
- Wu H, Lv H, Li L, Liu J, Mu S, Li X, Gao J. Genome-wide analysis of the AP2/ERF transcription factors family and the expression patterns of DREB genes in Moso Bamboo (Phyllostachys edulis) PLoS ONE. 2015;10(5):e0126657. doi: 10.1371/journal.pone.0126657. [DOI] [PMC free article] [PubMed] [Google Scholar]
- Wuchty S, Oltvai ZN, Barabási AL. Evolutionary conservation of motif constituents in the yeast protein interaction network. Nat Genet. 2003;35:176–179. doi: 10.1038/ng1242. [DOI] [PubMed] [Google Scholar]
- Xiao BZ, Chen X, Xiang CB, Tang N, Zhang QF, Xiong LZ. Evaluation of seven function-known candidate genes for their effects on improving drought resistance of transgenic rice under field conditions. Mol Plant. 2009;2:73–83. doi: 10.1093/mp/ssn068. [DOI] [PMC free article] [PubMed] [Google Scholar]
- Zhang Z, Schwartz S, Wagner L, Miller W. A greedy algorithm for aligning DNA sequences. J Comput Biol. 2000;7:203–214. doi: 10.1089/10665270050081478. [DOI] [PubMed] [Google Scholar]
Associated Data
This section collects any data citations, data availability statements, or supplementary materials included in this article.


