

SUMMARY
Species that are highly reliant on their visual system have a specialized retinal area subserving high-acuity vision, e.g., the fovea in humans. Although of critical importance for our daily activities, little is known about the mechanisms driving the development of retinal high-acuity areas (HAAs). Using the chick as a model, we found a precise and dynamic expression pattern of fibroblast growth factor 8 (Fgf8) in the HAA anlage, which was regulated by enzymes that degrade retinoic acid (RA). Transient manipulation of RA signaling, or reduction of Fgf8 expression, disrupted several features of HAA patterning, including photoreceptor distribution, ganglion cell density, and organization of interneurons. Notably, patterned expression of RA signaling components was also found in humans, suggesting that RA also plays a role in setting up the human fovea.
In Brief
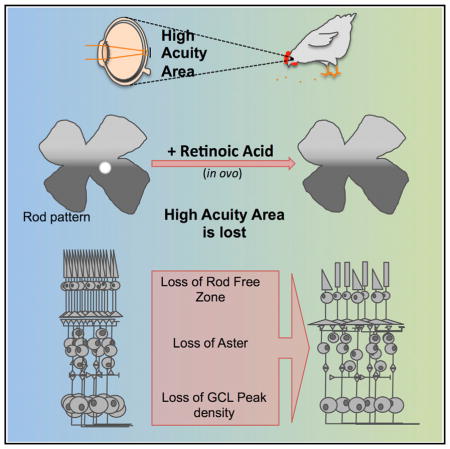
Molecular mechanisms underlying the development of the region of the retina responsible for high-acuity vision (the fovea) are largely unknown. Da Silva and Cepko reveal that localized suppression of retinoic acid (RA) signaling regulates chick high-acuity area formation through Fgf8. RA may also control human fovea development.
INTRODUCTION
Vertebrates that use vision as their major sensory modality have local retinal specializations that endow them with high-acuity vision. These areas have a high density of photoreceptors (PRs) and specialized circuitry as two of the adaptations that contribute to high acuity. Among mammals, only some primates possess a high-acuity area (HAA), the fovea, which is used during daylight conditions subserving sharp color vision. The macula, the central retinal region where the fovea is located, is particularly prone to degenerative diseases, including age-related macular degeneration, and lesions in this region result in debilitating visual impairment. Although analyses of human and primate fetal retinas have provided insight into the morphological processes that occur during the formation of the fovea (Mann, 1928; Hendrickson and Kupfer, 1976; Abramov et al., 1982; Hendrickson and Yuodelis, 1984; Hendrickson, 1992; Provis et al., 1998), the molecular mechanisms underlying its formation remain unknown.
In diurnal species, HAAs are characterized by a high density of cone PRs, the type of PR that enables color vision, as well as light detection in the higher light intensities found during the day. HAAs often have no rod PRs, the type of PR active in dim light. In addition, HAAs are characterized by a higher density of retinal ganglion cells (RGCs), the output retinal neurons, relative to areas outside of the HAA. An area of high RGC density is often found centrally, and is thus referred to as an area centralis, and is frequently used to define an HAA (Walls, 1942; Hughes, 1977; Moore et al., 2012). These cellular features contribute to the enhanced spatial resolution achieved by the specific circuitry of this area, which has been characterized in primates as the midget system (Wassle and Boycott, 1991; Dacey, 1993). Other features of HAAs can include a depression in the retinal surface (a “pit”) (Walls, 1942), differential vascularization (Provis et al., 2013), and a radial cellular arrangement found in the inner nuclear layer (INL) of the retina, termed the “aster” (Morris, 1982; Inzunza et al., 1989).
Similarly to humans, birds are often highly dependent upon vision, and the chicken has a retinal region termed the rod-free zone (RFZ) that is completely devoid of rods (Bruhn and Cepko, 1996). The RFZ is located in the same area as the area centralis (Slonaker, 1897; Ehrlich, 1981; Straznicky and Chehade, 1987) and the aster (Morris, 1982), supporting its role as an HAA. Given the absence of an HAA in mice and other non-primate mammals, the chick provides a tractable system for studying HAA development. To date, the only manipulations known to affect the chick RFZ are surgical ablations of early retinal tissue, and viral misexpression of the ventrally restricted transcription factor, Vax (Schulte et al., 2005). However, these manipulations led to changes that were not specific to the RFZ as they disturbed the distribution of rods across the entire retina.
Retinoic acid (RA) is a biologically active derivative of vitamin A. It is a critical morphogen during embryonic development, regulating diverse cellular processes, including tissue patterning and organogenesis (Cunningham and Duester, 2015; Rhinn and Dolle, 2012; Maden, 2002). Cellular RA levels are tightly controlled spatially and temporally by the coordinated activity of RA-synthesizing enzymes, retinaldehyde dehydrogenases (RALDHs members RALDH1 to RALDH3), and RA-catabolizing enzymes (members CYP26A1 to CYP26C1). RA binds to the RA receptor (RAR), which forms a heterodimer with the retinoid X receptor, both of which are members of the nuclear receptor family. They bind to conserved consensus motifs present in DNA regulatory regions, termed RA response elements (RAREs). Whereas RARs are generally ubiquitously expressed and act in a redundant manner, Raldhs and Cyp26s genes exhibit distinct expression patterns that are highly correlated with the activity of RARE-based reporter transgenes (Rossant et al., 1991; Perz-Edwards et al., 2001), suggesting that they are key regulators of RA signaling.
RA has been shown to be critical for early eye development in several species (Wilson et al., 1953; Hyatt et al., 1992; Sen et al., 2005; Mark et al., 2009), and RA-synthesizing and -degrading enzymes are expressed in the very early retina in conserved patterns (McCaffery et al., 1992; Mey et al., 2001; Peters and Cepko, 2002). RA-regulatory enzymes also exhibit specific and dynamic expression patterns at the later stages of retinal development when HAA patterning may be occurring, suggesting an additional role of RA during HAA development. RA can promote the differentiation of rods in cell cultures of dissociated embryonic rat and chick retinas (Stenkamp et al., 1993; Kelley et al., 1994), and in vivo studies from zebrafish have also implicated RA in PR determination and differentiation (Hyatt et al., 1996; Stevens et al., 2011; Mitchell et al., 2015). However, the precise role of RA on PR development has not been fully resolved. The maintenance of Raldh1 and Raldh3 expression in the neural retina during the period of neurogenesis has been attributed to a role of RA in the migration of cells of the underlying periocular mesenchyme (Matt et al., 2005). In addition, it has been shown that RA is involved in the formation of the retinotectal map through regulation of topographic guidance molecules within RGCs, which are patterned along the dorsoventral axis (Sen et al., 2005). However, the contribution of RA signaling to HAA patterning has not yet been investigated.
Here we show that RA signaling regulates the patterning of the chick HAA. Cyp26a1 and Cyp26c1 exhibit specific expression patterns during the period of PR and RGC genesis, creating a zone that lacks RA signaling in a highly circumscribed area. By experimentally creating a transient increase of RA levels in vivo during this period, we were able to induce rods in the RFZ without affecting the overall retinal distribution of rods. In addition, this manipulation led to abnormal aster formation and loss of the high density of cells within the ganglion cell layer (GCL). We found that RA regulates fibroblast growth factor 8 (Fgf8), which is expressed in an overlapping domain with Cyp26a1/c1 during the period of HAA patterning, and Fgf8 knock down by RNAi recapitulated the effects of RA manipulation. Moreover, Raldhs and Cyp26a1 expression patterns were found to be conserved in human embryonic tissue at equivalent stages of retinal neurogenesis. These findings provide a framework for the molecular mechanisms underlying the patterning of HAAs, and point to a common, and possibly conserved, molecular mechanism regulating HAA formation.
RESULTS
RA Synthesis and Degradation Enzymes Exhibit Dynamic Expression Patterns
To characterize the spatiotemporal expression patterns of enzymes for RA synthesis (RALDH1 and RALDH3) and degradation (CYP26A1 and CYP26C1) during the period of PR genesis (Hamburger-Hamilton [HH] 27–30, or embryonic day [E] 5–6) (Prada et al., 1991; Belecky-Adams et al., 1996), in situ hybridizations (ISH) were performed on retinal flat mounts. Raldh1 RNA was observed in a dorsal domain extending to the dorsoventral border, also known as the “equator.” At HH27, Raldh3 was confined to a more restricted ventral region. Its expression expanded dorsally by HH28–30 without crossing the equator (Figure 1A). As described previously, Cyp26a1 is expressed in a domain along the equator at HH28–30 (Sen et al., 2005). However, we detected a previously unrecognized circular region that did not express Cyp26a1 located nasal to the optic nerve head (ONH), within the equatorial domain that emerged at HH28 (Figures 1B, 1B″, and 1B‴). Interestingly, at HH27, this Cyp26a1-negative region also exhibited a small central spot where Cyp26a1 was expressed, generating a peculiar bull’s eye pattern (Figures 1B, 1B′, S1A, and S1B). The bull’s eye expression was transient, as it was no longer detected at HH28, whereas the stripe along the equator was maintained up to at least HH30. Cyp26a1 expression also was observed in the optic fissure during this period (Figures S1A and S1B).
Figure 1. Expression of RNA for RA Synthetic and RA Degradative Enzymes, and Fgf8, in the Chick Retina during Retinogenesis.

(A) Flat-mount double ISH for Raldh1, expressed dorsally, and Raldh3, expressed ventrally, at HH27–30.
(B) Flat-mount ISH for Cyp26a1 at HH27–30. Cyp26a1 is expressed in a stripe along the equator at the intersection of the dorsal and ventral domains. The white arrow points to a particular region within the stripe located nasal to the ONH where a pattern resembling a bull’s eye is visible at HH27 (B′) but disappeared at HH28–29 (B″ and B‴).
(C) Flat-mount ISH for Cyp26c1 at HH27–29 reveals a distinct circular expression pattern located centrally and nasal to the ONH.
(D) Schematic representation of an E5 (HH25) retina co-electroporated with RARE-lacZ and CAG-RFP. The retinas are positioned in the electroporation chamber such that the back of the eye was electroporated and then cultured 2 days in vitro (2 DIV).
(E) Representative image of an electroporated E5 plus 2 DIV explant exhibiting the pattern of RARE-lacZ signaling by X-gal staining, left panel. Note the presence of a RARE-lacZ-negative spot located centrally and nasal to the ONH (arrow) and a faint stripe along the equator (arrowheads), both RFP positive, as shown in the right panel. Note that elsewhere the X-gal staining masked the RFP fluorescent signal.
(F) Flat-mount ISH and retinal cross-section fluorescent ISH (FISH) for Fgf8 at HH27, counterstained with DAPI. Note the presence of a spot located centrally and nasal to the ONH and a stripe across the equator. The retinal cross-section shows Fgf8 expression across the ONBL of the retina, mostly in the inner region of the ONBL. Dashed lines mark the edges of the retinal tissue.
(G) Plot of the diameter of the spot domains of Fgf8, Cyp26c1, and Cyp26a1 bull’s eye over time. Cyp26a1 bull’s eye diameter was maintained until it ceased after HH27, while both Fgf8 and Cyp26c1 spots increased with time at a similar rate.
Scale bars, 500 μm in all, except 50 μm in the Fgf8 fish, right panel of (F). *ONH; for all figures: D, dorsal; V, ventral; T, temporal; N, nasal; ONBL, outer neuroblastic layer; GCL, ganglion cell layer; ONL, outer nuclear layer. Retinas are oriented consistently in all figures. See also Figures S1 and S2.
Expression of Cyp26c1 during HH27–29 was even more circumscribed than that of Cyp26a1, with a strong expression domain in a single spot located nasal to the INH in the central retina (Figures 1C and 1C′). This distinctive pattern was present at HH23 and remained until HH30, although it was downregulated after HH29 (Figure S1C). Compared with the Cyp26a1 bull’s eye, the Cyp26c1 circular domain was larger, on average 1.8-fold larger at HH26–27, and it increased over time (Figure 1G).
Expression of Cyp26b1 was not detected during the period of HH25–30, although some expression was seen in the retina at earlier stages, HH23–24, consistent with a previous report (Reijntjes et al., 2003) (Figure S1D). These results suggest a compartmentalization of RA signaling during the period of PR and RGC genesis.
RA Signaling Exhibits a Dynamic and Restricted Pattern
To characterize RA signaling in the chick retina during HH26–29 stages, we used a RARE reporter where the expression of lacZ is driven by the canonical RARE (de Thé et al., 1990; Wagner et al., 1992). HH25–26 retinas were co-electroporated with the RARE reporter plasmid and an electroporation control plasmid expressing RFP under the ubiquitous CAG promoter (Figure 1D). Retinal explants were cultured for 2 days in vitro and stained with X-gal. X-gal staining was observed throughout the neural retina, except in a circular region located central and nasal to the ONH (Figure 1E, arrow), in a location consistent with the circular domain of Cyp26a1 and Cyp26c1 expression (compare Figures 1B, 1C, and 1E). A lightly labeled stripe of X-gal stain also was observed along the equator (Figure 1E, arrowheads), in correlation with the Cyp26a1 stripe. The Cyp26a1 bull’s eye area was smaller than the X-gal-free spot (220.0 ± 8.8 μm in diameter for Cyp26a1 at HH27 versus 385.5.0 ± 14.8 μm for X-gal-free spot). However, the diameter of the circular Cyp26c1 domain closely matched the X-gal-free spot (365.7 ± 25.7 versus 385.5 ± 14.8 μm on average for Cyp26c1 and X-gal-free area). The X-gal-free spot was not caused by absence of electroporation as RFP fluorescence was detected after X-gal staining (Figure 1E).
To test if the lack of RA signaling in the X-gal-free spot was due to absence of RARs and/or signaling capacity, the assay was repeated in the presence of added all-trans RA (atRA). Incubation of retinal explants with atRA resulted in X-gal staining throughout the retina. High levels of atRA were required, in agreement with the presence of degradative enzymes in this area (Figure S1E). This observation demonstrated that RARs and signaling capacity were present in this domain. As Cyp26a1 is known to be upregulated by RA in a feedback loop, we also observed a strong upregulation of Cyp26a1 expression (Figure S1F). In addition, explant incubation with 20 μM Liarozole, a cytochrome P450/Cyp26s protein inhibitor (Van Wauwe et al., 1992), induced loss of the X-gal-free spot (Figure S1G). These data indicate that the activity of CYP26s enzymes is responsible for the RA signaling pattern during PR genesis.
Spatiotemporal Fgf8 Expression Pattern Is Correlated with the HAA
RA signaling and FGF8 activity are often observed in the same embryonic structures where they can regulate patterning (Cunningham and Duester, 2015). We examined Fgf8 expression by flat-mount ISH. As previously reported (Crossley et al., 2001), Fgf8 expression was confined to a circular region located central and nasal to the ONH at HH23, with a broad stripe of lower expression along the equator extending temporally (Figures 1F and S2A). During subsequent stages, the central spot of Fgf8 expression became larger (Figure 1G) and more elongated along the anterior-posterior axis, reaching a peak by HH28, coincident with the loss of the Cyp26a1 bull’s eye pattern (Figures S2A–S2C). Concurrently, the stripe along the equator became thinner and more defined. Analysis of Fgf8 expression on cross-sections revealed Fgf8 ISH signal in the outer neuroblastic layer (ONBL) of the retina, where progenitor cells reside (Figure 1F). Although the Fgf8 signal faded after HH28 (Figure S2), it was still detected at HH35–36 (Figure S2D). At later stages, HH38, Fgf8 was detected in a subset of retinal cells, likely Mueller glia (Figure S2E), consistent with previous reports (Vogel-Höpker et al., 2000).
To determine if there was overlap of the expression patterns of the Cyp26a1 bull’s eye spot, the Cyp26c1 domain, and the Fgf8 spot, as well as to determine how these patterns changed over time, a series of single and double ISH were carried out. The sizes of the diameters of these domains were recorded from single ISH performed at different times (Figure 1G). The Fgf8 and Cyp26c spots expanded at comparable rates, with the Fgf8 domain always slightly larger than Cyp26c1, while the Cyp26a1 spot was smaller and stable before it disappeared. Double ISH showed that Fgf8 expression was in the central region between the Raldh1 and Raldh3 expression domains (Figures 2A and 2F). In addition, the Fgf8 spot was coincident with the Cyp26a1 bull’s eye at HH27, and filled the Cyp26a1-negative circular area by HH28 (Figures 2B and 2F). The equatorial Fgf8 stripe partially co-localized with the Cyp26a1 band, with Cyp26a1 being expressed further dorsally compared with Fgf8 (Figures 2B, 2F, and S3). We also observed a clear co-localization between Fgf8 and Cyp26c1 expression domains at HH27, with most cells positive for both transcripts detected within the ONBL (Figures 2C and 2F). The spatial and temporal correlation between the expression domains of Fgf8 and Cyp26s genes suggested a functional interplay between these two signaling pathways. To investigate a possible regulatory interaction, we examined the spatial relationship between RARE signaling and Fgf8 expression. The X-gal-free region was coincident with the Fgf8 spot (Figures 2D and 2F), indicating a potential antagonistic relationship between RA signaling and Fgf8 expression. Measurements of the diameters of the expression domains of Fgf8 and Cyp26c1, and the X-gal-free region in explants, further confirmed a tight correlation among the three patterns (Figure 2E).
Figure 2. Correlation of RA Enzymes and RARE-Free Spot with Fgf8 Expression at HH27–28.

(A) Flat-mount ISH of Raldh1, Raldh3 (both blue), and Fgf8 (orange) at HH27. Fgf8 expression along the equator partially filled the central gap region between dorsal Raldh1 and ventral Raldh3. High magnification of central retina before (single) and after Fgf8 probe revelation (double), bottom two panels. Raldh1 expression abutted the Fgf8 domain with no overlap between these two regions.
(B) Flat-mount ISH of Cyp26a1 (blue) and Fgf8 (orange) at HH27–28, and double-fish (Fgf8 green, Cyp26a1 red, DAPI counterstained) at HH28. Note the overlap between Fgf8 spot and Cyp26a1 bull’s eye domains at HH27, with the Fgf8 area being larger than Cyp26a1, consistent with measurements plotted in Figure 1G. Conversely, Fgf8 stripe and Cyp26a1 stripe domains partially co-localized (see also Figure S3). At HH28, when the Cyp26a1 bull’s eye domain had ceased, the Fgf8 spot filled the Cyp26a1-negative spot region almost completely, as detected by chromogenic ISH in central panels and double fish on the cross-section along the dorsoventral axis, capturing the region depicted by the dotted line (1).
(C) Flat-mount ISH for Cyp26c1 (blue) and Fgf8 (orange), and double fish (Fgf8 green, Cyp26c1 red, DAPI counterstained) at HH27. Note the overlap between the Fgf8 spot and the Cyp26c1 region. Double fish on cross-section along the dotted line (2) shows co-localization at the cellular level between the two genes (insets, dashed lines represent single nuclei stained by DAPI).
(D) X-gal-stained (blue) E5 plus 2 DIV explant co-electroporated with RA reporter (RARE-lacZ) and CAG-RFP followed by ISH for Fgf8 (purple). Fgf8 spot fills RARE-free spot (high magnification of the boxed area).
(E) Diameter of Fgf8 spot, Cyp26c1, and RA-free domains measured in E5 plus 2 DIV explants are similar.
(F) Schematic representation of individual expression patterns of RA pathway components and Fgf8 at HH27 and HH28, and composite of all genes at HH27 with corresponding explant at equivalent stage illustrating RA signaling activation.
Scale bars, 500 μm in all, except 50 μm in right panels of (C). See also Figure S3.
RA Signaling Reduces Fgf8 Expression in the Chick Retina
To evaluate if Fgf8 expression is regulated by RA activity, we performed local unilateral injections of atRA. The right (R) retinas of HH25 embryos were injected with 50 mM atRA in vivo and the contralateral left (L) retinas served as non-treated controls. Fgf8 expression was evaluated by ISH and by real-time qPCR at HH27–28 (Figure 3). Pharmacological manipulations provide an acute change in RA signaling, minimizing phenotypes potentially due to RA activity during earlier developmental stages. Injections of vehicle alone (DMSO) showed no effect on Fgf8 expression by both methods. However, Fgf8 transcript levels were reduced in atRA-injected retina, with both spot and stripe regions affected (Figures 3B and 3C), as visualized by ISH, and a −0.62-fold decrease in the R eye relative to the L eye, by qPCR. Injection of Liarozole, and co-injection of atRA plus Liarozole, induced a similar decrease in Fgf8 expression (Figures 3B and 3C). To evaluate if the RA manipulation also affected the expression of its own degradative and synthetic enzymes, we analyzed the expression of these genes by qPCR. As expected, treatment with atRA upregulated Cyp26a1 (Figures 3C and S1F), consistent with the feedback loop of Cyp26a1 by RA. Liarozole treatment was not sufficient to alter expression of Cyp26a1/c1 or Raldh1/3, suggesting that Fgf8 is more sensitive to RA levels than any of the RA enzymes tested. Combination of atRA plus Liarozole had a stronger effect than atRA in inducing upregulation of Cyp26a1/c1 expression, with concomitant downregulation of Raldh1/3 (Figure 3C). Overall, these results demonstrate a role of RA signaling on Fgf8 expression in the chick retina at HH25–28.
Figure 3. Repression of Fgf8 Expression by atRA in the Chick Retina.

(A) Schematic of the timeline of in vivo manipulation of RA signaling by administration of either atRA (50 mM); Liarozole, Cyp26s inhibitor (20 mM), a 1:1 mixture of atRA and Liarozole (25:10 mM, final concentration, respectively) and DMSO and tissue harvest. A single injection of the drug(s) was made into the vitreous of the right (R) eye of HH25 embryo in ovo during PR genesis. Both R and uninjected left (L) retinas were harvested 16 hr later and processed for either Fgf8 ISH or RNA extraction. Red bar depicts transient action of the injected drugs.
(B) Flat-mount ISH for Fgf8 of the R and corresponding L eye of the same embryo. Fgf8 expression was downregulated in eyes injected with atRA, Liarozole, and atRA + Liarozole compared with DMSO-injected condition, or corresponding L eyes.
(C) Bar graph of qPCR analyses for Fgf8, Cyp26a1, Cyp26c1, Raldh1, and Raldh3 to quantify gene expression alterations in response to the indicated pharmacological treatment. Results are represented as expression fold change comparing the R eye relative to the L eye of the same embryo. Fgf8 was downregulated in the R eye of all conditions except for control DMSO. atRA treatment induced an increase in Cyp26a1, and the combination of atRA + Liarozole induced an increase of both RA-degradative enzymes with concomitant reduction of RA-synthesizing enzymes.
For all statistical analyses, ns, not significant; *p < 0.05, **p < 0.005, ***p < 0.0001; n = 3, one-way ANOVA multicomparison with DMSO as control applying false discovery rate (FDR) correction. The y axis is in log scale. Scale bar, 500 μm.
RA Regulates Patterning of the HAA
To address if RA regulates HAA patterning, unilateral injections were again performed into the vitreous of R retinas of HH25 embryos, with assessment of the expression pattern of the specific rod marker, Rhodopsin, at E19 by flat-mount ISH (Figures 4A and 4B). Injection of DMSO had no effect on the rhodopsin pattern (Figures 4C, 4G, and 4H). However, a single injection of atRA plus Liarozole induced Rhodopsin expression in cells located in the RFZ (Figures 4D and 4G). The position of the RFZ in the retina was unchanged, which allowed for unambiguous identification. Importantly, injection of atRA plus Liarozole (Figure S4B) at HH25 had no effect on the density of rhodopsin-expressing cells in regions outside of the RFZ, in both dorsal and ventral domains (Figures 4D and 4H). A single addition of atRA or Liarozole induced a similar specific phenotype in the RFZ (Figures 4E, 4F, S4A, and S4B, and data not shown).
Figure 4. Manipulation of RA Altered Rod PR Patterning in the HAA.

(A) Schematic of the timeline of in vivo manipulation of RA signaling and subsequent tissue harvest. Retinas were harvested at E19, when rhodopsin expression was detectable.
(B) Graphic representation of E19 retinas processed for flat-mount rhodopsin ISH highlighting the pattern of rods across the retina, the high ventral/low dorsal gradient, and the presence of an RFZ, characterizing the HAA.
(C) Flat-mount ISH for rhodopsin of a DMSO-injected eye and high magnifications of boxed regions in the dorsotemporal, ventrotemporal, central equator, and RFZ. Note the high ventral/low dorsal rod gradient and a distinct RFZ.
(D) Flat-mount ISH for rhodopsin of an atRA + Liarozole-treated retina. Note the presence of rhodopsin-positive (+) cells in an otherwise rod-free area, without affecting the overall high ventral/low dorsal rod distribution.
(E and F) High magnification of the RFZ of flat-mount rhodopsin ISH of an atRA- and Liarozole-treated retinas, respectively. Both treatments induced rhodopsin+ cells in an otherwise rod-free area.
(G) Plot representing mean ± SEM density of rhodopsin+ cells in 100 μm2 in the RFZ for each condition (*p < 0.05, ***p < 0.0001 compared with DMSO, n = 7, 5, 4, and 7, Kruskal-Wallis test with FDR correction).
(H) Quantification of rhodopsin+ cells plotted as mean ± SEM in equivalent dorsotemporal (DT) or ventrotemporal (VT) regions in DMSO- and atRA + Liarozole-treated retinas showed no significant (ns) difference between the two conditions (n = 3, Student’s t test, one-tail).
Scale bars, 500 μm in all, except 50 μm in DT and VT, and 2 mm in whole retinas. See also Figure S4.
To confirm that the rhodopsin-positive cells that appeared in the RFZ were rods, we probed these injected retinas with another rod-specific marker, PDE6γ. In uninjected control retinas, PDE6γ expression recapitulated the Rhodopsin pattern at E18, with a clear absence in the RFZ and dorsoventral gradient of expression (Figure S4C). By double fish, Rhodopsin and PDE6γ 100% co-localized. Following injection of atRA and atRA plus Liarozole, PDE6γ-positive cells were observed in the RFZ (Figures S4D and data not shown).
We next asked whether RA could regulate other non-PR aspects of an HAA (Figure 5A). As HAAs include a higher density of cells in the GCL (Walls, 1942; Hughes, 1977), we evaluated the density of GCL cells following injection of atRA. Flat-mounted retinas were stained with DAPI and analyzed by confocal microscopy, which confirmed that a peak of cell density in the GCL is aligned with the RFZ (Figure S4E). Uninjected retinas had a density of GCL cells that was 1.59 ± 0.07-fold higher than that of neighboring retinal regions, 2 mm away from the HAA (Figures 5B and 5C). Injections of atRA, Liarozole, or atRA plus Liarozole, led to loss of the higher density of cells within the GCL in this region, making it indistinguishable from the more peripheral regions (Figures 5B and 5C).
Figure 5. Manipulation of RA Alters GCL Composition and Aster Structure in the HAA.

(A) Graphic representation of a flat-mount retina assayed for rhodopsin ISH and corresponding cross-section through the HAA illustrating the laminar organization of retinal layers and hallmarks of the HAA, such as RFZ, aster, and high cellular density in GCL.
(B) Analysis of the GCL composition by imaging DAPI-stained nuclei at the GCL level on flat-mount retinas. Representative orthogonal view of x-z axis projection of confocal z stacks inside and outside of HAA in DMSO- and atRA + Liarozole-treated retinas and corresponding high magnifications of boxed areas.
(C) Scatterplot quantifying ratio of mean ± SEM GCL cellular density inside versus outside HAA (**p < 0.005, ***p < 0.0005, ****p < 0.0001, with n = 6, 4, 4, and 8, one-way ANOVA multicomparison using DMSO as control and applying FDR correction).
(D) The aster structure revealed by WGA-TRITC staining and confocal imaging focusing on the INL of DMSO- and atRA + Liarozole-treated retinas. Note that cells were oriented in a radially symmetric manner converging toward the center of the image.
(E) Representation of the orientation of the cells constituting the aster by the SteerableJ algorithm. The algorithm finds vectors defined by the cellular WGA staining and color codes (cc) them according to angle orientation, SteerableJ cc. The vectors in atRA + Liarozole-injected retina were more randomly oriented compared with the organized orientations in DMSO control.
(F) Quantification of the aster arrangement by an algorithm developed to calculate the radial symmetry likelihood, RSL (0 < RSL < 1; 0, no radial symmetry and 1, optimal radial symmetry) (see STAR Methods for details), for the same DMSO- and atRA + Liarozole-treated retinas shown in (D and E). The brightest points correspond to the center of the radial symmetry. The corresponding RSL value for each retina is shown.
(G) Scatter dot plot of mean ± SEM RSL values of treated retinas (**p < 0.005. ***p < 0.0005, n = 6, 5, 4, and 5, respectively, one-way ANOVA multicomparison using DMSO as control and FDR corrected).
ONL, outer nuclear layer; OPL, outer plexiform layer; INL, inner nuclear layer; IPL, inner plexiform layer. Scale bars, 10 μm in (B), and 50 μm in (D–F). See also Figure S5.
The INL radial structure, the aster, is also common to bird species with HAAs (Morris, 1982; Inzunza et al., 1989). It can be revealed by wheat germ agglutinin (WGA) immunostaining and confocal microscopy of flat-mounted retinas. We confirmed that the aster in the chick retina is aligned with the RFZ and the peak of GCL cell density. In retinas treated with atRA, Liarozole, and atRA plus Liarozole, the aster lost its typical radial symmetry (Figures 5D, 5E, and S5), as assessed qualitatively using the SteerableJ algorithm (see STAR Methods). To quantify this phenotype, we developed an algorithm to measure the degree of radial symmetry (RSL value, see STAR Methods). Compared with control retinas, all treatment conditions showed a decrease in the aster RSL value (Figures 5F and S5). Taken together these data indicate that RA plays a role in the patterning of the chick HAA across the three major retinal layers, GCL, INL, and ONL.
Fgf8 Downregulation Affects the RFZ and Aster Structure
We next tested whether FGF8 also can regulate HAA patterning. A small hairpin RNA (shRNA) targeting the Fgf8 transcript (Abzhanov et al., 2007) was delivered by electroporation of a replication-competent RCAS viral vector plasmid encoding shFgf8 (RCAS:shFgf8). A control plasmid expressing RFP broadly, CAG-RFP, was used to label electroporated areas. Both plasmids were delivered at the optic cup stage (HH11), when electroporation efficiency is high, and retinas were examined for RFP 2 days later (Figure 6A). As a control, shRNA against GAPDH was used (RCAS:shGAPDH). Transient expression of RCAS leads to the production of virus which can spread throughout the retina, increasing the probability that cells in the HAA would be infected. However, this also leads to widespread downregulation of Fgf8 outside of the HAA and in tissues beyond the neural retina, including other ocular tissues, such as the retinal pigment epithelium (RPE). Low levels of infection also were observed in the contralateral L eye due to viral spread. Interestingly, RCAS:shFgf8 resulted in complete loss of pigment from the RPE of the electroporated R eye and areas of RPE depigmentation in the L eye, in correlation with electroporation efficiency and viral spread (Figure S6A). Knockdown of Fgf8 in the strongly infected electroporated eye resulted in pleiotropic effects, including a slightly smaller eye and overall reduction of rhodopsin (Figure S6B). By contrast, the neural retina below the regularly pigmented RPE of the less-infected L eye presented normal rhodopsin expression, enabling the scoring of rhodopsin-positive cells in these areas. Immunostaining for the gag viral protein demonstrated that the RFZs of these retinas were infected (lower panels in Figure 6B). In RCAS:shFgf8-infected retinas there was loss of an RFZ, as rhodopsin-positive cells were present, similar to the phenotype observed after atRA/Liarozole injections (Figures 4, 6B, and 6C). In addition, Fgf8-knockdown reduced the aster radial symmetry in both R and L retinas (Figures 6D and S6C). The reduction in RSL values following RA treatments and Fgf8 knockdown was similar, with no significant difference among these four conditions. Overall, these data are consistent with Fgf8 mediating the RA-dependent patterning of the HAA.
Figure 6. Fgf8 Levels Regulate HAA Patterning.

(A) Schematic of the timeline of in vivo manipulation of Fgf8 and subsequent tissue harvest. Fgf8 levels were manipulated by electroporation of a mixture of two plasmids: replication-competent avian retroviral vector RCAS encoding shRNA (RCAS:shRNA) for Fgf8 or control GAPDH, and a co-electroporation plasmid, CAG-RFP. Electroporation efficiency was checked in ovo after 2 days. RCAS transduction is stable, and thus effects are persistent, as denoted by the red bar. Image of an electroporated eye showing robust RFP signal at E4 in ovo.
(B) Knockdown of Fgf8 by shRNA-induced rhodopsin+ cells in the RFZ compared with control RCAS:shGAPDH-electroporated retinas. Viral infection is shown by anti-viral gag immunostaining, lower panels.
(C) Scatter dot plot of mean ± SEM of rhodopsin+ cells in 100 μm2 in the RFZ in shFgf8-compared with shGAPDH-electroporated retinas (*p = 0.05, n = 3, Mann-Whitney test, one-tail).
(D) Structural analysis of the aster by WGA-TRITC staining by SteerableJ cc and RSL algorithms (mean ± SEM of RSL in shFgf8-compared with shGAPDH-electroporated retinas, ***p = 0.0005, n = 6, Student’s t test, one-tail). Corresponding RSL value for each retina is shown.
Scale bars, 500 μm in (A), 200 μm in (B), and 50 μm in (D). See also Figure S6.
RA Enzyme Expression Patterns in Human Retinas
We asked whether RA might also be involved in the patterning of the human HAA, the fovea. The expression patterns of Aldh1a1 (equivalent to chick Raldh1), Aldh1a3 (equivalent to chick Raldh3), Cyp26a1, and Cyp26c1 were determined using ISH of embryonic human retinas. The stages examined were Carnegie stages (CS) 22–23 (7–8 weeks of gestation [WG]) up to 9WG (Figures 7A and S7 and data not shown), a period of retinal neurogenesis (Mann, 1964; Provis et al., 1998; Hendrickson et al., 2008). In addition, a recent study described the presence of immature cones at 8WG only in the presumptive fovea (Hendrickson and Zhang, 2017), implying that the signaling events for foveal patterning occurs before 8WG. The expression patterns of Aldh1a1 and Aldh1a3 during this period are similar to those found in chicks (Figure 1A) and in mammals examined so far, with Aldh1a1 expressed dorsally and Aldh1a3 expressed ventrally (Figures 7B and 7D, and data not shown). Remarkably, ISH on cross-sections along the dorsoventral axis of CS22 human retina revealed localized expression of Cyp26a1 in a subset of sections close to the temporal side in the ONBL (Figures 7C and S7B). This layer expresses Chx10, a retinal progenitor cell marker (Figure 7C) (Burmeister et al., 1996). Using flat-mount ISH for Cyp26a1, we observed an expression domain with a spot-like appearance located centrally and around 1.4 mm temporal to the ONH, correlating with the location of the future fovea (Figure 7D), and consistent with a previous study reporting the incipient fovea to be around 2 mm temporal to the ONH at 8WG (Hendrickson, 2016). Furthermore, this expression pattern is dynamic since Cyp26a1 expression was not seen at the CS23 stage (Figure S7C) or any other later time up to 9WG (data not shown). Cyp26c1 expression was not detected in the human retina at these stages (data not shown). Expression at this particular embryonic time, its transient nature, and the highly localized circular pattern of Cyp26a1 expression in human retinas resembles the expression of the Cyp26a1 circular domain in the chick retina, consistent with localized degradation of RA in the human retina playing a role in foveal patterning.
Figure 7. Conserved Expression Pattern of RA Signaling Enzymes in Human Embryonic Retina during Retinogenesis.

(A) Front view of an embryonic Carnegie stage (CS) 22 human eye depicting plane of section along the dorsoventral axis used on subsequent cross-sections.
(B) Double chromogenic ISH on a cross-section of CS22 retina for RA-synthesizing enzymes Aldh1a1 (purple), expressed dorsally, and Aldh1a3 (orange), expressed ventrally.
(C) ISH on CS22 cross for Cyp26a1 and Chx10, DAPI counterstained. Note the spatially restricted Cyp26a1 signal present in the ONBL in the central retina, more noticeable in the magnified boxed area. Chx10 ISH in an adjacent section serves as control for labeling mostly the ONBL, where retinal progenitor cells are located.
(D) Flat-mount triple ISH for Cyp26a (revealed first, left panel and high magnification of the boxed area), and Aldh1a1 and Aldh1a3 (revealed second, right panel) shows a discrete expression domain of the RA-degrading enzyme in a central spot temporal to the ONH, spatially coinciding with the localization of the future fovea, with RA-synthesizing enzymes on the dorsal and ventral retinal poles. Note that the cut made along the temporal axis passed through the Cyp26a1 domain preventing a clear visualization of a circular domain. *lens side of the eye. Arrow points to the ONH. INBL, inner neuroblastic layer. Scale bars, 500 μm in all, except 200 μm in high magnification of boxed areas in (B–D). See also Figure S7.
DISCUSSION
Despite the critical role of HAAs for vision, the molecular mechanisms regulating their formation have been largely unexplored. Here, we identify the suppression of RA signaling by CYP26s degradative enzymes as a critical step for HAA formation in the chick. The highly specific expression patterns of RA-synthesizing and -degradative enzymes also were found in the presumptive human fovea at equivalent developmental stages, suggesting that a common mechanism regulates HAA development in birds and mammals.
RA Regulates HAA Formation during Chick Development
RA signaling influences several aspects of retinal development across multiple species. RA manipulation in a discrete time window revealed an additional role of RA in patterning an HAA. The transient increase of RA during the period when RA signaling was repressed in the HAA anlage led to the induction of rods in an otherwise RFZ. Importantly, rods were not induced outside of the HAA following RA administration, consistent with the notion that transient RA addition affected a local patterning event, and not a more global influence on PRs across the retina. Additional support of a discrete patterning effect is the observation of changes in the patterning of an INL structure, the aster, as well as the density of cells in the GCL. Both of these additional HAA features were altered so as to resemble the surrounding non-HAA areas.
The increase in rods and decrease in cells of the GCL following RA injection raise several questions regarding proliferation and fate determination. The birth dates of RGCs typically precede those of rods (Cepko, 2014). It is possible that, as fewer RGCs were produced, a larger pool of mitotic cells resulted, which could then supply more late-born cells, such as rods, a mechanism that has been suggested by comparative studies of primates with different densities of rods (Dyer et al., 2009). It is also possible that the pool of cells fated to be cones, which are normally produced early, might have been diverted to the rod fate, in line with a zebrafish study (Stevens et al., 2011). This is an attractive model, since these two PR types have inverse ratios within and outside of most HAAs. The number of rods that was induced was insufficient to allow for a quantitative assessment of a decrease in cones, which are abundant in the chick retina. However, greater definition of the regulatory networks that control rod and cone fate may allow a deeper understanding of the role of RA in these fate choices (Cepko, 2015). Of relevance to such networks is the presence of a RARE in the promoter region of Nrl, a transcription factor required for rod development in the mouse (Mears et al., 2001). Furthermore, RA activates Nrl expression in mammalian cell cultures (Khanna et al., 2006). Although Nrl is not encoded by the chick genome, MafA, a member of the same Maf family as Nrl, is expressed in a pattern consistent with a role in chick rod development and can substitute functionally for Nrl in mouse (Kim et al., 2016).
The specific effects on the HAA pattern likely reflect the injected RA’s ability to override CYP26s enzymatic activity specifically within the developing HAA. An unresolved question is whether progenitor cells that give rise to an HAA are equivalent to other retinal progenitor cells, prior to the influence of modulated RA levels. It is possible that the HAA progenitor pool is already primed by early patterning cues to respond to lack of RA in a manner that yields progeny that give rise to HAA-specific features. Such prepatterning could be established, for instance, by the same patterning mechanisms that establish the Cyp26s genes expression domains.
RA/Fgf8 Crosstalk in the Retina
Fgf8 expression and function at early stages in retinal development have been investigated in several previous studies, where it has been seen to play a role in converting presumptive RPE to neural retina fate, and in the initiation of retinal neurogenesis (Vogel-Höpker et al., 2000; Crossley et al., 2001; Martinez-Morales et al., 2005). However, the striking pattern of Fgf8 expression in the HAA anlage during the period of PR and RGC genesis had not been previously reported. The pattern of expression of the Cyp26s genes and Fgf8 within the anlage suggests cross-regulatory relationships between RA and Fgf8, as occurs repeatedly throughout development (Cunningham and Duester, 2015). There is a RARE upstream of the Fgf8 promoter, which raises the possibility of a direct inhibitory role of RA on Fgf8 expression, similar to what has been described for anteroposterior body axis extension (Kumar and Duester, 2014). Alternatively, RA could repress Fgf8 expression indirectly by activating a repressor of Fgf8. Interestingly, in the mouse, Fgf8 has only been detected at very early stages in the optic stalk (Crossley and Martin, 1995) and has not been observed in the neural retina at later time points (Lovicu and Overbeek, 1997, and data not shown) consistent with a specific role of RA-Fgf8 signaling in HAA patterning. In addition, it is possible that FGF8 also regulates RA signaling by tuning the spatial expression of the Cyp26s genes. While the initiation of the Cyp26a1 central expression domain within the bull’s eye seems to be independent of FGF8, its downregulation begins after HH27, coincident with the peak of Fgf8 expression, suggesting a potential negative regulation of Cyp26a1 by FGF8.
A Potential Conserved Mechanism for HAA Formation
Our data indicate that local suppression of RA signaling is critical for HAA formation. This role was suggested by the focal circular expression of Cyp26a1 and Cyp26c1 in the HAA anlage. Moreover, and contrary to Raldhs, retinas from species with different types of vision exhibit specific Cyp26s gene expression patterns and dynamics. As we report here, Cyp26a1 is expressed in a central spot in humans and chicks, two species with high-acuity vision endowed by a central HAA, but has not been seen in a spot pattern in mouse (Luo et al., 2006), which does not have an HAA. Moreover, this Cyp26a1 spot is dynamic, emerging at HH23 and lasting until HH27 in the chick, and similarly is transient in the human retina, as it is not seen after CS22. Cyp26c1 expression in chick also localizes to a central circular domain that overlaps with the Cyp26a1 bull’s eye spot, while in humans we have not detected Cyp26c1 expression. The chick retina also exhibits a stripe of Cyp26a1 along the equator, and this domain persists beyond that of the central spot. In mouse, both Cyp26a1 and Cyp26c1 are expressed along the equator, resulting in a broad RA-free streak (Luo et al., 2006). This conserved equatorial pattern of Cyp26a1 suggests that it might regulate a shared aspect of retinal patterning between chick and mouse, such as RGC production and/or topographic map formation. In keeping with this notion, the broad equatorial RA-free streak in mice coincides with a moderately increased density of RGCs in this region. Investigation of the Cyp26s spot and stripe patterns in bi-foveated bird species, with a central and a temporal HAA, e.g., birds of prey (Slonaker, 1897; Fite and Rosenfield-Wessels, 1975), and pigeons who possess a second HAA in the dorsal area (Querubin et al., 2009; Rodrigues et al., 2016), will also prove interesting insights regarding the function of such patterns.
Considering all of the domains of patterned expression of Cyp26s genes among chick, mouse, and human, our findings support a model where the common ancestor of birds and mammals had an HAA patterned by an RA-free spot. The differential dynamics of the Cyp26a1 stripe and bull’s eye in chick suggest the existence of different regulatory elements responsible for these two expression domains. Similarly, Cyp26c1 and Cyp26a1 expressions likely are regulated by different elements. Interestingly, Cyp26a1 and Cyp26c1 genes are located adjacent to each other in human, chick, and mouse. This synteny seems to be conserved among many vertebrates and is predicted to be due to whole-genome duplication (Nelson et al., 2013). Duplication would allow for the evolution of different patterns of expression, with one pattern being the equatorial stripe, and another being the central spot for the formation of an HAA. Although broader comparative studies and further description of enhancer regulatory elements will be required, the patterns that could have evolved would include one in which mice kept the stripe domain for both enzymes, and lost the circular one for both. Chickens might have kept both the stripe and circular domains of Cyp26a1, but lost the stripe for Cyp26c1, and humans might have lost both domains of Cyp26c1, and retained only the circular expression of Cyp26a1.
Therapeutic Implications
A deeper understanding of the developmental mechanisms underlying HAA formation may provide insights that will translate into future therapies. RA is commonly used to induce the formation of PRs from induced pluripotent stem cells (iPSCs) or embryonic stem cells (ESCs) (Osakada et al., 2008). However, given that most PR cells in these cultures are rods (Osakada et al., 2008; Gonzalez-Cordero et al., 2013) and the role of RA in inducing rods, perhaps at the expense of cones, addition of RA may be counter-productive to the formation of cones. In addition, there are remarkable ESC- or iPSC-derived organoids that self-organize into multilayered neural retinas (Eiraku et al., 2011; Nakano et al., 2012; Gonzalez-Cordero et al., 2013). However, even within organoids derived from human ESCs, formation of a fovea-like structure has not been reported (Nakano et al., 2012). In these organoid cultures, RA is added to the medium, which may inhibit the formation of a fovea. Timed and local inhibition of RA synthesis, and/or local application of Fgf8, may be a more productive step for induction of a fovea.
STAR ★ METHODS
KEY RESOURCES TABLE
| REAGENT or RESOURCE | SOURCE | IDENTIFIER |
|---|---|---|
| Antibodies | ||
| 3C2 | Sen et al., 2005 | Also available at DSHB, AMV-3C2; RRID: AB_528098 |
| Biological Samples | ||
| Human foetal tissue | HDBR-Wellcome Trust | http://www.hdbr.org |
| Chemicals, Peptides, and Recombinant Proteins | ||
| atRA | Tocris | Cat#0695 |
| Liarozole | Tocris | Cat#2705 |
| WGA-TRITC | ThermoFisher Scientific | Cat#W849 |
| Fluoromount-G | SouthernBiotech | Cat#0100-01 |
| Fast Green FCF | Sigma | Cat#F7252 |
| Penicillin/Streptomycin | Gibco | Cat#15140122 |
| T7 RNA polymerase | Roche | Cat#10881767001 |
| T3 RNA polymerase | Roche | Cat#11031163001 |
| Critical Commercial Assays | ||
| DIG RNA labeling Mix | Roche | Cat#11277073910 |
| Fluorescein RNA labeling Mix | Roche | Cat#11685619910 |
| TSA Plus Cy3 and Fluorescein | Perkin Elmer | Cat# NEL753001KT |
| Brilliant III Ultra-Fast SYBR Green QPCR Master Mix | Agilent technologies | Cat# 600882 |
| RNeasy Micro Kit | Qiagen | Cat# 74004 |
| SuperScript III Reverse Transcriptase | Thermo Fisher | Cat# 18080093 |
| Experimental Models: Organisms/Strains | ||
| Chick embryos | Charles River | http://www.criver.com/products-services/manufacturing-production/avian-vaccine-services/spf-eggs |
| Oligonucleotides | ||
| Human Aldh1a1 ish probe sequence: gtttgttcatccaatcgtatccgagtatgcaaataaactttagcccgtgcagataaaaaaggaacaaataaagccaagtgctctatcagaaccaaattgctgagccagtcacctgtgttccaggagccgaatcagaaatgtcatcctcaggcacgccagacttacctgtcctactcaccgatttgaagattcaatatactaagatcttcataaacaatgaatggcatgattcagtgagtggcaagaaatttcctgtctttaatcctgcaactgaggaggagctctgccaggtagaagaaggagataaggaggatgttgacaaggcagtgaaggccgcaagacaggcttttcagattggatccccgtggcgtactatggatgcttccgagagggggcgactattatacaagttggctgatttaatcgaaagagatcgtctgc |
This paper | N/A |
| Human Aldh1a3 ish probe sequence: tgcacggcagcctccagggtgttcgtggaggagcaggtctactctgagtttgtcaggcggagcgtggagtatgccaagaaacggcccgtgggagaccccttcgatgtcaaaacagaacaggggcctcagattgatcaaaagcagttcgacaaaatcttagagctgatcgagagtgggaagaaggaaggggccaagctggaatgcgggggctcagccatggaagacaaggggctcttcatcaaacccactgtcttctcagaagtcacagacaacatgcggattgccaaagaggagattttcgggccagtgcaaccaatactgaagttcaaaagtatcgaagaagtgataaaaagagcgaatagcaccgactatggactcacagcagccgtgttcacaaaaaatctcgacaaagccctgaagttggcttctgccttagagtctggaa |
This paper | N/A |
| Human Cyp26a1 ish probe sequence: agcgcggcctcctggtctaccccgaggtgaagcgcctcatgttccgaatcgccatgcgcatcctactgggctgcgaaccccaactggcgggcgacggggactccgagcagcagcttgtggaggccttcgaggaaatgacccgcaatctcttctcgctgcccatcgacgtgcccttcagcgggctgtaccggggcatgaaggcgcggaacctcattcacgcgcgcatcgagcagaacattcgcgccaagatctgcgggctgcgggcatccgaggcgggccagggctgcaaagacgcgctgcagctgttgatcgagcactcgtgggagagggga |
This paper | N/A |
| Human Chx10 ish probe sequence: Cttcgcgaagcgggaagcccggcgggggggtggggggagctaaagacctgcggcctcagcccctccaaagaacagggagatgacggggaaagcaggggaagcgctgagcaagcccaaatccgagacagtggccaagagtacctcggggggcgccccggccaggtgcactgggttcggcatccaggagatcctgggcttgaacaaggagcccccgagctcccacccgcgggcagcgctcgacggcctggcccccgggcacttgctggcggcgcgctcagtgctcagccccgcgggggtgggcggcatggggcttctggggcccggggggctccctggcttctacacgcagcccaccttcctggaagtgctgtccgacccgcagagcgtccacttgcagccattgggcagagcatcggggccgctggacaccagccagacggtcagctcggattctgaagatgtttcctccagcgatcgaaaaatgtccaaatctgctttaaaccagaccaagaaacggaagatgcggcgacacaggacaatctttacctcttaccagctagaggagctggagaaggtattctacgaagcccactacccagacgtctatgcccgggagatgctggccatgaaaacggagctgccggaagacaggatacaggtctgggttccgaaccgttcaagccaagtggaagaagcgggagaagtgctggggccggaccagtgtcatggcggaataagggctctaaggggccatggtgcggcactccatccccctggccgaagtccatccttcaagtcacccaaggagggcatcatgggacttctgtgcccc |
This paper | N/A |
| Chick Raldh1 ish probe caacatgaagaagcaaggctcacccagcaatcctgctcctgttttgccagcactgccagaaccactcaaagatctgaaaattaagtacactaagatatttataaacaatgaatggcatgattcagtcagcggtaaaaaatttgaagtctttaaccccgcaaatgaggagaaaatctgtgaggttgcagaaggtgacaaggcagatatagacaaggctgtgaaagcagctagaaaagcttttgagctcggatcaccctggcgtaccatggatgcttcagaacgaggaaggctcttgaacaaactagctgatttagttgaaagagatcgactgactttagctacaatggaagctattgatggtggtaaactcttttctactgcctacctaatggatttaggtgcttgtattaaaacaatacgctactgtgcaggctgggctgataaaatccatggtcgaactgttccaatggatggaaactttttcacatttacaagacatgagcctgttggtgtgtgtggacaaattattccttggaacttcccattggttatgtttatctggaagatcgcccctgcactttgttgtggaaacacggtggttgtcaaaccagcggaacaaacacctctgagtgccctttacatgggatcc |
Sen et al., 2005 | N/A |
| Chick Raldh3 ish probe atggccgcggtcaacggtgctgtggagaacgggccgcctgacaagaaggggccgccgctgccacggcctctgaggggtttggaggtgaagtacaccaagatatttataaacaatgaatggcacgagtctaccagtggaaagaagttccctacctacaatccctcgacgctagagaaaatctgtgatattgaggaaggagacaagcctgatgtggataatgcagtggaagcagcaaaggcagcattccagagagggtctcagtggagacaaatggatgccttaagcaggggacggctcctacacaaactggctgatcttctagagcgagacagagtcatcctggcaactttagaaacaatggacacgggaaaaccttttctgcaggcttatttcattgacctggaaggttgtataaagacactccgatattatgctggatgggctgataaaatccagggcaggactatccctgtggatgaaaactttgtctgtttcaccaggcatgaaccgatgggtgtttgtggagctataactccatggaacttcccattgctgatgctggtttggaagatggcaccggcgctgtgctgtggaaacactttggttattaaaccagctgaacaaactcctctcacatcactgtacattggctctctgattaaggaggtgggcttccctccaggtgtggtgaacattgtgccaggctatggccccacagctggagcagccatctctacccatcagagcattgataaaattgcttttactggatcaacaaaggttggaaaactgatcaaggaagctgcttctaaaagcaacctgaaaagggtgacattagagctcggaggcaaaaacccctgcatcgtgtgtgcagatgcagacttggacttggcagtggaatgtgcccatcaaggtgtgttcttaaatcaggggcagtgctgcacagctgcctcacgagtgtttgtggaagagcagatatatccggagtttgtcaagcgcagcgtggagtatgccaagaagagacttgttggagacccctttgatgccagaactgagcaagggccccagattgaccagaaacagtttgataagatcctggagctgatagaaagtgggaagaaagaaggtgctaagctggagtgtggtggtcttgccattgaagacagaggcctgtttataaaacccactgtgttttcagaggtcaccgacaacatgcgcattgccaaagaagagatttttgggccagttcagcctattatgaagttcaagagtatagaagaggtcataagaagagccaacaataccgagtacggactcacagctgcagtgttcacaaagaatctggacagagcattaacattagcttctgctttgcagtcaggaactgtctggatcaattgttacaatgctctgtatgcgcaggctccctttggtggctttaaaatgtcaggaaatggcagagaacttggtgaatatgctttggcagaatatactgaagtcaaaacagtcaccattaaactgtcccagaagagtccatgaaaacaggaggcctaaaaatgctgacattctgaatgtgacacactggggacgtgt |
Sen et al., 2005 | N/A |
| Chick Cyp26a1 ish probe atgggcttctccgctctggtcgccagcgccctgtgcaccttcctgctgcccctgctgctcttcctggccgccgtccggctctgggacctgtactgcgccagcggccgcgaccccagctgtccgctgccgttgcccccgggcaccatggggctgcccttcttcggggagacgctgcagatggtgctgcagcggcggaaattcctgcagatgaagcgcaggaaatacggcttcatctacaagactcacctctttgggcggcccactgtgcgggtgatgggcgctgagaatgtgcggcacatcctgctgggcgagcaccgcctggtctccgtgcagtggcccgcctcggtgcgcaccatcttgggctcgggctgcctctccaaccttcacaacgggcagcacaaacaccgcaaaaaggtgatcatgcaggccttctcccgggacgccctgcagcactacgtgcctgtcatccaagaggaggtgagtgcctgcctggcacagtggctgggtgccgggccctgcctgctggtgtatcccgaggtgaagcgcctcatgttccgcatcgccatgcgcatcctgctgggcttccagccccgccaggccagccctgatggtgagcagcagctggtggaggccttcgaggagatgatccgcaacctcttctccctccccatcgatgtgcctttcagtgggctctaccggggcctgagggcgcgcaacatcatccatgccaagattgaggagaacatccgtgccaagatggcccgcaaggagcccgagggtggctacaaggatgcactgcagctgctgatggagcacacacagggtaatggagagcagctcaacatgcaggagctgaaggagtctgccacagagctgctgtttggaggtcatgaaaccactgccagtgctgctacatcactgattgccttcctagggctccaccatgatgttctgcagaaagtgaggaaggagctgcaagtaaaggggttactgtctggtcccaaccaagagaagcaattggacatggaggtcttggagcagctgaagtacacaggctgtgttatcaaggaaaccctcaggctgagccctcccgttcctggaggattccgaattgcactcaagacccttgagctgaatggttaccagatccccaaaggctggaatgttatttacagtatctgcgatacccacgatgtggccgatctctttaccgacaaggacgagttcaacccggaccgcttcatgtctccgtctccggaggactcctctaggttcagtttcattcctttcggtgggggcttgaggagctgcgtaggcaaagagtttgcaaaagtccttctaaaaatatttacggtggagctggcgcggagctgtgactggcagctgttaaatggacctcctacaatgaaaacgggccccatagtgtaccctgtggacaatctgcctgccaaattcataggtttcagcggccaaatctgagtgctcaacgcttgcctcaggctggatttctgtataacatctcatatgtacatagtaactttttatagtaacgaaggcctttaaatatttaaacttgtaaatgtacagtagttatttatgtctaagtatttcaaaaggctgtgacatttttccccaagcactacaatt |
Sen et al., 2005 | N/A |
| Chick Cyp26c1 ish probe sequence: ccacaaacctgtggtgaataaatgtttggaaaatgttcatttctgaacaggcctgcttcgtgagggcatgtcctgtgctcctgctggtgctggcacatagtggagggacattgcatggggccatggtggctgtcacagggcagccgtgaccctgccccagccctgctctgtgtccaagcactgaccagtggctctgggggcaccgcagtggtgcctggggctgagcccaggagctgaggacttattttcagatggcttttgagtgcctcactggggtatgagtctctcctctgtacaatgatgtgagtcccgctgcttgtgctccaaatgtccggtgtcagtgctgggctgaaagccaccctgcccgggccggttcccatcacacacctatgctgggacacgcagcggagcacagcgctgcctggggcagaaatgtggctcccaaacgtggtaggtcagatctggaagaggttgaaccgcgggactgagttaagtgctgttggcagttcgaccccattgtgaaccagagcctctgcccctcctgacctt |
This paper | N/A |
| Remainder of chick in situ probes sequences, see Table S1 | N/A | |
| Primers used for qPCR, see Table S1 | N/A | |
| Recombinant DNA | ||
| pRARE-lacZ | Wagner et al., 1992 | N/A |
| pRCAS:U6-Fgf8-hairpin | Abzhanov et al., 2007 | N/A |
| U6-GAPDH-hairpin | Billings et al., 2010 | N/A |
| pRCAS:U6-GAPDH-hairpin | Harpavart and Cepko, 2006 | N/A |
| CAG-RFP | Billings et al., 2010 | N/A |
| Software and Algorithms | ||
| SteerableJ | Jacob and Unser, 2004 | N/A |
| rsl algorithm | This paper | https://github.com/HMS-IDAC/RadialSymmetryLikelihood |
| GraphPad Prism 7.0 | GraphPad | N/A |
CONTACT FOR REAGENT AND RESOURCE SHARING
Further information and requests for reagents may be directed to, and will be fulfilled by, the Lead Contact, Constance L. Cepko (cepko@genetics.med.harvard.edu).
EXPERIMENTAL MODEL AND SUBJECT DETAILS
Chick Embryos
Fertilized White Leghorn eggs (Charles River) were incubated at 38°C with humidity around 40%. Embryos were staged according to Hamburger and Hamilton (Hamburger and Hamilton, 1951). For in ovo manipulations, embryos were lowered at embryonic day 2 (E2), windowed at the time of manipulation, taped and returned back to the incubator for the necessary amount of time until desired developmental stage was achieved.
Human Tissue
The human embryonic and fetal material was provided by the Joint MRC Wellcome Trust Human Developmental Biology Resource (http://www.hdbr.org) at the IGM, Newcastle Upon Tyne, UK. All human protocols were reviewed and approved by the Institutional Review Board of Harvard.
METHOD DETAILS
In Vitro Electroporation and Histochemical lacZ Staining
Hamburger and Hamilton (HH) stages 25–26 (corresponding to embryonic day 5(E5)) chick retinas were dissected and electroporated with RARE reporter (800ng/μl, final concentration) and the control electroporation plasmid CAG-RFP (150ng/μl, final concentration) as previously described (Billings et al., 2010) with the following modification. In brief, electroporations were conducted with a NEPA21 type II Nepagene electroporator and retinas were cultured in 10% FBS, 45% DMEM, 45% F12 and 100U/ml penicillin/streptomycin (Gibco). After 2 days in culture, explants were first imaged for RFP fluorescence signal to assess overall retinal electroporation, washed in 1X PBS and fixed with 4% (w/v) paraformaldehyde (PFA) for 15min at RT. Retinas were washed 2 times in 1X PBS and further processed for lacZ staining by incubation with X-gal substrate in staining solution as the standard method (Gierut et al., 2014). In brief, retinas were preincubated for 30 min in Buffer A (100mM of sodium phosphate, 2mM magnesium chloride and 5mM EGTA), then moved to Buffer B (100mM sodium phosphate, 2mM magnesium chloride, 0.01% sodium deoxycholate, 0.02% NP-40) for 5 min and then finally incubated in Developer Buffer (same as Buffer B with addition of 5mM potassium ferricyanide, 5mM potassium ferrocyanide and 1mg/ml of X-gal). Retinas were then washed twice in 1XPBS, fixed for 5min with 4% PFA, mounted with Fluoromount-G (SouthernBiotech) and imaged for brightfield and epifluorescence on a Leica MZFLIII coupled to a Nikon DXM1200F camera or on a Leica M165FC stereo-microscopes.
In Vivo Electroporation
HH11 chick embryos were electroporated in the optic cup with the plasmids RCAS:shFgf8 (1μg/μl, final concentration) mixed with CAG-RFP (0.8μg/μl, final concentration) or with RCAS:shGAPDH (1μg/μl, final concentration) mixed with CAG-RFP. Briefly, a glass capillary loaded with the plasmid combination plus 0.1% Fast Green was used to fill the right embryonic optic cup. A sharp tungsten negative electrode punctured the embryo dorsoventrally just medially to the right optic cup while the positive electrode was placed extra embryonically next to the right optic cup. A drop of PBS was added on top of the embryo to help electroporation efficiency. Electroporations were conducted with a NEPA21 type II Nepagene electroporator using 3 Transfer pulses of 7V with 50 milliseconds pulse length and 950 milliseconds interpulse interval followed by 3 Poring pulses of 2V with 650 milliseconds of duration spaced by 650 milliseconds of interpulse interval. The eggs were taped and returned to the incubator until developed to the desired stage.
Flat Mount In Situ Hybridization
Chromogenic flat mount ish was performed as described previously (Bruhn and Cepko, 1996) with some modifications as described in (Chen and Cepko, 2002). Double ish was carried out with digoxigenin (DIG)-labeled RNA probes combined with Fluorescein (Fluo)-labeled probes (see detailed list of probes used, comprising previously and newly designed probes). RNA probes were generated using DIG- or Fluorescein-RNA labeling Mix and transcribed using either T3 or T7 RNA polymerases (Roche). The first probe revealed was DIG-labeled and detected with NBT/BCIP stock solution mix (Roche) while the second probe revealed was Fluo-labeled and detected with INT/BCIP stock solution mix (Roche). Retinas were fixed with 4%PFA for 10 minutes at RT, mounted and imaged after the first probe was developed and subsequently heated at 65°C for 2 hours to kill the first anti-DIG-AP enzyme. To detect the second probe the heat-inactivated retinas were blocked again and proceed for anti-Fluo antibody incubation. Retinas were mounted and imaged again. For fluorescent ish (fish) flat mounted retinas were treated similarly to the chromogenic procedure with extra bleach and acetylation steps. PDE6γ–DIG labeled probe was revealed first with Cy3-tyramide and the Rhodopsin-Fluo labeled probe was detected secondly with Fluorescein-tyramide TSA Plus amplification kit (1:100, Perkin Elmer). Retinas were counterstained with DAPI. Imaging of flat mount chromogenic ish was done using a BZ-X700 Keyence microscope and fish signals were imaged using a Zeiss LSM 780 Confocal. Chromogenic flat mounted retinas were processed using BZ-II Analyzer version 2.2 software program from Keyence for adjusting color balance, sharpness and contrast.
Pharmacological Treatments
In in vitro cultures, various amounts, as described in the main text, of all-trans RA (atRA, Tocris, stock solution of 50mM diluted in Dimethyl sulfoxide (DMSO)) or the Cyp26s protein inhibitor Liarozole (Tocris, stock solution of 20mM diluted in DMSO) were added to the media from the beginning of the culture and throughout the duration of the experiment. RA was handled carefully and kept protected from light as much as possible. The in vivo injections were performed at E5 (around HH25) on chick retinas in eggs previously lowered at E2. Embryos were immobilized by applying a negative pressure through a 200μl tip sustained by a micromanipulator along the metencephalon region of the embryo without rupturing any extra-embryonic membrane or any major blood vessel. This allowed for feasible and reproducible injections since a more targeted site of needle perforation in the embryo could now be achieved without a major distruption of the embryo. A needle capillary was filled with either 50mM of atRA, 20mM of Liarozole, a combination mixture of RA plus Liarozole (final concentration 25mM/10mM, respectively) or vehicle (DMSO) together with 0.1% Fast Green for visualization of injected solution. In all the in ovo experiments only the right (R) eye was injected in the vitreous cavity with a single high dose of the specific drug at a ventrotemporal puncture site until half the eye was filled. The left (L) eye was left untouched. The injected embryos were returned to the incubator until the desired developmental stage. Both R and L retinas of the same embryos were treated and processed at the same time under the same conditions and imaged with the same settings for accurate comparisons. Of note, injection of such high doses of atRA into the allantoid or by dropping the solution on top of the embryo caused lethality. The localized injection into the eye was necessary for embryo survival.
Histological WGA Staining, Imaging and Aster Analysis
Retinas pharmacologically treated and processed for flat mount ish against rhodopsin were stained with 10μg/ml (final concentration) of wheat germ agglutinin (WGA)-TRITC conjugated (Life Technologies) by incubation O/N at 4°C for visualization of the aster structure present in the INL and counterstained with DAPI. Confocal Z stacks were acquired using Zeiss LSM780 to capture both the aster and the GCL directly underneath the RFZ. Confocal Z stacks outside the RFZ, along the central equator, approximately 2mm from the aster towards the temporal axis also were taken. Orthogonal maximum projections along either XZ or YZ axes allowed visualization of DAPI-stained cell bodies in the GCL.
For better visualization of the aster structure labeled by WGA-TRITC an imageJ plugin called SteerableJ was used on single confocal 5.3μm Z stacks using 4th order and sigma 2.0 as settings (Jacob and Unser, 2004). The software detects ridges on the raw image and color-codes them based on their degree of orientation. For quantification of the aster arrangement and to perform statistical analysis we developed an algorithm using MatLab to calculate the Radial Symmetry Likelihood (rsl) for a given aster structure, based on previous methods (Loy and Zelinsky, 2003; Cicconet et al., 2013). Briefly, the designed algorithm detects ridges/tangents on the raw image, extends those tangents in both directions and then calculates how well localized is the peak intersection of all accumulated tangents. rsl is then determined by: rsl= 1 – average (A), where A is the normalized accumulation of identified tangents. rsl coefficient then varies between 0 and 1, with 1 being the maximum value indicating a perfect radial symmetry and 0 corresponding to random arrangement with no radial symmetry. rsl can be understood as a measure of how narrow is the distribution of peak intersection. The narrower the peak, the closer to 1 is the rsl value, which would mean that the majority of those tangents would be intersecting each other in a narrow focal point. Note that the aster structure has a central node (Morris, 1982) where cells are arranged randomly. This means that a rsl of 1 will never be achieved in any biological sample. The output image result of this algorithm can also be used to interpret the likelihood coefficient in a qualitative way (see Figures 5F, 6D, and S5). The image represents the normalized probability space from which the radial symmetry likelihood is computed. The brighter signal corresponds to the highest peak of intersection. The narrower the bright signal the higher the radial symmetry. Both algorithms were applied to images acquired with 25X objective imaged with Zeiss LSM 780 confocal.
Quantitative Real-Time PCR
Retinas pharmacologically treated were harvested 16 hours after addition of compounds and RNA was purified from spatially defined regions of the retina: dorsal, ventral and central midline regions. RNA from both untreated (L eye) and treated (R) eye was purified using RNeasy Qiagen Micro Kit according to manufacturer’s instructions. 250ng-1μg of total RNA was then reverse-transcribed with oligo-dT primers using MMLV reverse transcriptase Superscript III (ThermoFisher). Quantitative real-time PCR were performed using Brilliant III Ultra-Fast SYBR Green Mix (Agilent Technologies) on a Bio-Rad CFX96 Real-Time System. Relative gene expression levels were determined for the genes Raldh1 in dorsal region, Raldh3 in ventral region and Fgf8, Cyp26a1 and Cyp26c1 in central region normalized to GAPDH (see primer details on STAR Methods). For each condition, 3 biological replicates were performed and 3 technical replicates where run on the same plate for each primer set. Control experiments with no MMLV reverse transcriptase were also carried out. One-way ANOVA statistical analyses were performed on ΔΔCT values.
QUANTIFICATION AND STATISTICAL ANALYSIS
Statistical parameters including sample sizes (n=number of retinas per group), the statistical test used and statistical significance are reported in the Figure Legends. Values reported are mean ± SEM. A minimum of 3 retinas per group was used for all statistical analysis. Calculation of cell density shown in Figure 5D plot was determined by counting the number of cell bodies in 100μm length inside and outside the HAA for the same retina. The ratio of cell density in GCL inside/outside HAA was then calculated. For qRT-PCR data, 3 biological replicates for each pharmacological treatment condition were performed and 3 technical replicates were run for the same condition for each primer set. Statistical analyses were peformed on ΔΔCT values. Data were judged to be statistically significant when p<0.05. In figures asterisks denote statistical significance *p<0.05, **p<0.005, ***p<0.0005. All statistical analysis was performed using GraphPad PRISM 7.0 software.
DATA AND SOFTWARE AVAILABILITY
The RSL algorithm reported in this paper is available at https://github.com/HMS-IDAC/RadialSymmetryLikelihood.
Supplementary Material
Figure S1- Time course of expression of RA degrading enzymes, Cyp26a1, Cyp26c1 and Cyp26b1, during retinogenesis and RARE activity following addition of atRA, related to Figure 1.
(A) Flat mount chromogenic ish of Cyp26a1 from HH23 to HH30. Note the dynamic expression of the bull’s eye domain, which ceases after HH27, more apparent in the magnified images. The stripe domain is maintained at least until HH30. (B) Further magnification focusing on the bull’s eye domain of Cyp26a1, illustrating the transient expression of this domain. Note that Cyp26a1 is also expressed along the optic fissure (arrows). (C) Flat mount ish for Cyp26c1 from HH23 to HH30. Note the discrete circular domain of Cyp26c1 expression in a central spot and slightly nasal to optic nerve head at HH23 that lasts at least until HH30. This pattern seems to expand with time and fades after HH29. (D) Whole mount and flat mount ish for Cyp26b1 at stated time points. At HH23 a faint domain of expression was observed in the nasal pole of the retina, arrow. At HH24 some expression was still detected at the most peripheral retina of the nasal region and at HH27 no expression was detected. (E) Dose-dependent response of the RA reporter to increasing amounts of atRA added in the culture medium of E5 plus 2div explants. Note the gradual loss of the RA-signaling free spot with higher doses of atRA. (F) Retina explant cultured for 16 hours in vitro and processed for Cyp26a1 ish. Note the increase of Cyp26a1 expression throughout the whole retina in response to 5μM atRA added to the medium. Both control and treated retinas were processed together and stained for the same amount of time. (G) RARE-reporter response of E5 plus 2div explant incubated with 5μM of Liarozole, a Cyp26s proteins inhibitor. Note the loss of the RARE-signaling-free spot. Scale bar, 500μm. D, dorsal; V, ventral; N, nasal; T, temporal. All images are oriented consistently.
Figure S2 – Time-course expression of Fgf8 during retinogenesis, relative to Cyp26a1, related to Figure 1
(A) Flat mount chromogenic ish of Fgf8 from HH23 to HH30. Note the presence of a spot located centrally and nasal to the optic nerve head and a stripe across the equator. (B) Fgf8 ish time course focusing on the spot domain of expression and (C) relationship with Cyp26a1 bull’s eye domain. Note that the Fgf8 spot increased in size over time. The Fgf8 spot became stronger with time until it reached the peak of intensity at HH27/HH28, coincident with the loss of the Cyp26a1 bull’s eye. (D) Fgf8 transcripts were still detected at HH35-36 in a patterned manner. (E) Fish for Fgf8 counterstained with DAPI on a HH38 retina cross section showed expression of Fgf8 in the central retina in a subset of cells with their cell bodies located in the center of the INL, likely Mueller glial cells. Scale bar, 500μm in (A), (B), (C) and (D) and 50μm in (E). D, dorsal; V, ventral; N, nasal; T, temporal; ONL, outer nuclear layer; INL, inner nuclear layer; GCL, ganglion cell layer.
Figure S3 – Spatial correlation between Fgf8 and Cyp26a1 at HH29, related to Figure 2
Flat mount fish of a HH29 chick retina probed for Fgf8, in green, and Cyp26a1, in red. High magnification images demonstrate the partial spatial co-localization between both transcripts in the stripe domain along the equator of the retina. However the Fgf8 expression does not co-localize with Cyp26a1 expression in his spot domain but rather fills in the Cyp26a1-negative circular region. Scale bar, 500μm. D, dorsal; V, ventral; N, nasal; T, temporal.
Figure S4 – Pharmacological manipulation of RA signaling at HH25 affects the HAA by disturbing the RFZ, related to Figure 4
(A) Retina injected in vivo with atRA at HH25, harvested at E19, analyzed for Rhodopsin ish and the matching uninjected L eye of the same embryo. Note that overall the two retinas look alike, their size was similar and the high-ventral to low-dorsal gradient of rhodopsin expression was present in both. Some RPE is still present in the L retina. (B) Images of dorsal and ventral regions from an uninjected and atRA-injected retina at HH25 and processed for rhodopsin ish at E19. (C) Validation of PDE6γ marker as a specific rod marker. Single chromogenic ish on flat mount and cross sections of E19 chick retina confirmed the presence of a RFZ and a high-ventral to low-dorsal gradient of rods. Flat mount double fish for rhodopsin, in green, and PDE6γ, in red, shows 100% co-localization between the two probes. (D) Flat mount ish with PDE6γ probe in atRA+Liarozole-treated retinas and uninjected L eye revealed induction of PDE6γ positive cells in the RFZ. (E) Fish on a cross section of P0 chick retina for rhodopsin and counterstained with DAPI. Note the presence of the RFZ and the increase in GCL thickness beneath the RFZ versus outside the RFZ, more apparent in the high magnifications of the corresponding boxed areas, 1 and 2, respectively. Scale bar, 2mm in (A), 100μm in (B), (D) and 50μm in (C), (E). D, dorsal; V, ventral; N, nasal; T, temporal; GCL, ganglion cell layer.
Figure S5 – Pharmacological manipulation of RA signaling at HH25 affects the HAA, by disturbing the aster structure, related to Figure 5
Representative images of the aster structure visualized by WGA-TRITC staining, top panels, in untreated, atRA- and Liarozole-treated retinas. Corresponding SteerableJ transformations and color-coded outputs of the examples are shown. Note the loss of radial organization of aster structure in atRA- and Liarozole-injected retinas in relation to untreated retina. Application of the rsl algorithm to the same examples shows a reduced rsl value in treated compared to untreated retina. Corresponding rsl values for each retina is shown (see Figure 5G scatter plot for quantification and statistical analysis). Scale bar, 50μm.
Figure S6- Retinal Fgf8-knockdown by electroporation of RCAS:shFgf8 induced multiple phenotypes in the retina, related to Figure 6
(A) Knockdown of Fgf8 in the retina was accomplished by in vivo electroporation of an shRNA to Fgf8 expressed from the virus, RCAS, as schematized in Figure 6A. Examples of a pair of retinas from the same embryo harvested at E19. Only the right (R) eye was electroporated early at HH11 but due to its replication ability, the virus reached the L eye. Note that Fgf8 knockdown had an effect on RPE pigmentation, with the R eye being completely affected while L eye was only partially affected, as can be seen by the partial RPE depigmentation phenotype, with the dorsal domain being more affected than the ventral region. (B) Rhodopsin flat mount ish on retinas depicted in (A). R retina showed an overall strong downregulation of Rhodopsin ish signal, with some patchiness throughout the whole retina. This effect, and the effect on the RPE, led us to not analyze the RFZ in the R eye, due to potential indirect effects of the changes in the RPE. Dotted circle highlights the RFZ region. (C) The aster structure visualized by SteerableJ or rsl algorithms of a corresponding pair of ipsilateral and contralateral eyes of an RCAS:shFGF8 electroporated embryo. Note that both eyes had an affected aster. Correspondent rsl value for each retina is shown. D, dorsal; V, ventral. N, nasal; T, temporal; Scale bar, 2mm in (A) and (B) and 50μm in (C).
Figure S7 – Cyp26a1 expression in early embryonic human retina, related to Figure 7
(A) Back, ventral and dorsal views of CS22 human embryonic eye illustrating human eye shape at this time in development. (B) Cyp26a1 ish on CS22 retina cross sections along the dorsoventral axis depicting localized signal in only 3 consecutive sections, each 120μm apart. (C) Flat mount ish for Cyp26a1 on CS23 human retina. No ish signal was detected at this stage, only approximately 2 days later than CS22, shown in (B) and Figure 7C–D. Note that since some RPE was still attached to the neural retina in the region of the future fovea, retina was imaged from both outer nuclear layer side (C’) and ganglion cell layer side (C”) to ensure proper examination, imaging and interpretation of the results. *, lens. Scale bar, 500μm in (A) and (C) and 200μm in (B). D, dorsal; V, ventral; N, nasal; T, temporal.
Table S1- Related to STAR Methods. Additional ish probes sequences and qPCR primers
Highlights.
Retinoic acid (RA) and Fgf8 show tightly circumscribed patterns in the chick retina
RA negatively regulates Fgf8 expression to form a central high-acuity area
RA and Fgf8 regulate the distinctive cellular patterns in a high-acuity area
RA enzymes are also distinctly patterned in human embryonic retinal tissue
Acknowledgments
We thank Sylvain Lapan, ChangHee Lee, Nicolas Lonfat, David Wu, Rui Peixoto, and Rima Arnaout for critically reading and commenting on this manuscript. We thank Abby Wark and ChangHee Lee for assistance with statistical analysis. We thank the Image and Data Analysis Core at Harvard Medical School for developing the RSL algorithm. We thank the MRC-Wellcome Trust Human Developmental Biology Resource (HDBR) for providing embryonic human tissue, especially Dr. Steven Lisgo and Dr. Dianne Gerrelli for their assistance. We are also grateful to have had the benefit of data and discussions provided by the work of previous lab members Dorothea Schulte, Rima Arnaout, Jonaki Sen, John Lin, and Maureen Peters. S.S. was funded by Fundação para a Ciência e a Tecnologia (FCT, POPH/FSE, Portugal) and by the Lowy Medical Research Institute. C.L.C. is an HHMI Investigator, and this work was supported by HHMI.
Footnotes
Supplemental Information includes seven figures and one table and can be found with this article online at http://dx.doi.org/10.1016/j.devcel.2017.05.024.
AUTHOR CONTRIBUTIONS
Conceptualization, Methodology, Resources, Writing – Original Draft, and Writing – Review & Editing, S.S. and C.L.C.; Formal Analysis and Investigation, S.S.; Funding Acquisition and Supervision, C.L.C.
References
- Abramov I, Gordon J, Hendrickson A, Hainline L, Dobson V, LaBossiere E. The retina of the newborn human infant. Science. 1982;217:265–267. doi: 10.1126/science.6178160. [DOI] [PubMed] [Google Scholar]
- Abzhanov A, Cordero DR, Sen J, Tabin CJ, Helms JA. Cross-regulatory interactions between Fgf8 and Shh in the avian frontonasal prominence. Congenit Anom (Kyoto) 2007;47:136–148. doi: 10.1111/j.1741-4520.2007.00162.x. [DOI] [PubMed] [Google Scholar]
- Belecky-Adams T, Briggs C, Adler R. Correlations between terminal mitosis and differentiated fate of retinal precursor cells in vivo and in vitro: analysis with the “‘window-labeling “’ technique. Dev Biol. 1996;315:304–315. doi: 10.1006/dbio.1996.0220. [DOI] [PubMed] [Google Scholar]
- Billings NA, Emerson MM, Cepko CL. Analysis of thyroid response element activity during retinal development. PLoS One. 2010;5:e13739. doi: 10.1371/journal.pone.0013739. [DOI] [PMC free article] [PubMed] [Google Scholar]
- Bruhn SL, Cepko C. Development of the pattern of photoreceptors in the chick retina. J Neurosci. 1996;16:1430–1439. doi: 10.1523/JNEUROSCI.16-04-01430.1996. [DOI] [PMC free article] [PubMed] [Google Scholar]
- Burmeister M, Novak J, Liang MY, Basu S, Ploder L, Hawes NL, Vidgen D, Hoover F, Goldman D, Kalnins VI, et al. Ocular retardation mouse caused by Chx10 homeobox null allele: impaired retinal progenitor proliferation and bipolar cell differentiation. Nat Genet. 1996;12:376–384. doi: 10.1038/ng0496-376. [DOI] [PubMed] [Google Scholar]
- Cepko C. Intrinsically different retinal progenitor cells produce specific types of progeny. Nat Rev Neurosci. 2014;15:615–627. doi: 10.1038/nrn3767. [DOI] [PubMed] [Google Scholar]
- Cepko C. The determination of rod and cone photoreceptor fate. Annu Rev Vis. 2015;1:211–234. doi: 10.1146/annurev-vision-090814-121657. [DOI] [PubMed] [Google Scholar]
- Chen CMA, Cepko CL. The chicken RaxL gene plays a role in the initiation of photoreceptor differentiation. Development. 2002;129:5363–5375. doi: 10.1242/dev.00114. [DOI] [PubMed] [Google Scholar]
- Cicconet M, Geiger D, Gunsalus K. Wavelet-based circular hough transform and its application in embryo developmental analysis. VISAPP 2013 – Proceedings of the International Conference on Computer Vision Theory and Applications. 2013;1:669–674. [Google Scholar]
- Crossley PH, Martin GR. The mouse Fgf8 gene encodes a family of polypeptides and is expressed in regions that direct outgrowth and patterning in the developing embryo. Development. 1995;121:439–451. doi: 10.1242/dev.121.2.439. [DOI] [PubMed] [Google Scholar]
- Crossley PH, Martinez S, Ohkubo Y, Rubenstein JL. Coordinate expression of Fgf8, Otx2, BMP4, and Shh in the rostral prosencephalon during development of the telencephalic and optic vesicles. Neuroscience. 2001;108:183–206. doi: 10.1016/s0306-4522(01)00411-0. [DOI] [PubMed] [Google Scholar]
- Cunningham TJ, Duester G. Mechanisms of retinoic acid signalling and its roles in organ and limb development. Nat Rev. 2015;16:110–123. doi: 10.1038/nrm3932. [DOI] [PMC free article] [PubMed] [Google Scholar]
- Dacey DM. The mosaic of midget ganglion cells in the human retina. J Neurosci. 1993;13:5334–5355. doi: 10.1523/JNEUROSCI.13-12-05334.1993. [DOI] [PMC free article] [PubMed] [Google Scholar]
- de Thé H, Vivanco-Ruiz MM, Tiollais P, Stunnenberg H, Dejean A. Identification of a retinoic acid responsive element in the retinoic acid receptor beta gene. Nature. 1990;343:177–180. doi: 10.1038/343177a0. [DOI] [PubMed] [Google Scholar]
- Dyer MA, Martins R, da Silva Filho M, Muniz JA, Silveira LC, Cepko CL, Finlay BL. Developmental sources of conservation and variation in the evolution of the primate eye. Proc Natl Acad Sci USA. 2009;106:8963–8968. doi: 10.1073/pnas.0901484106. [DOI] [PMC free article] [PubMed] [Google Scholar]
- Ehrlich D. Regional specialization of the chick retina as revealed by the size and density of neurons in the ganglion cell layer. J Comp Neurol. 1981;195:643–657. doi: 10.1002/cne.901950408. [DOI] [PubMed] [Google Scholar]
- Eiraku M, Takata N, Ishibashi H, Kawada M, Sakakura E, Okuda S, Sekiguchi K, Adachi T, Sasai Y. Self-organizing optic-cup morphogenesis in three-dimensional culture. Nature. 2011;472:51–56. doi: 10.1038/nature09941. [DOI] [PubMed] [Google Scholar]
- Fite KV, Rosenfield-Wessels S. A comparative study of deep avian foveas. Brain Behav Evol. 1975;12:97–115. doi: 10.1159/000124142. [DOI] [PubMed] [Google Scholar]
- Gierut JJ, Jacks TE, Haigis KM. Whole-mount X-gal staining of mouse tissues. Cold Spring Harb Protoc. 2014;2014:417–419. doi: 10.1101/pdb.prot073452. [DOI] [PMC free article] [PubMed] [Google Scholar]
- Gonzalez-Cordero A, West EL, Pearson RA, Duran Y, Carvalho LS, Chu CJ, Naeem A, Blackford SJ, Georgiadis A, Lakowski J, et al. Photoreceptor precursors derived from three-dimensional embryonic stem cell cultures integrate and mature within adult degenerate retina. Nat Biotechnol. 2013;31:741–747. doi: 10.1038/nbt.2643. [DOI] [PMC free article] [PubMed] [Google Scholar]
- Hamburger V, Hamilton HL. A series of normal stages in the development of the chick embryo. J Morphol. 1951;88:49–92. [PubMed] [Google Scholar]
- Harpavart S, Cepko CL. RCAS-RNAi: a loss-of-function method for the developing chick retina. BMC Dev Biol. 2006:6. doi: 10.1186/1471-213X-6-2. http://dx.doi.org/10.1186/1471-213X-6-2. [DOI] [PMC free article] [PubMed]
- Hendrickson A. A morphological comparison of foveal development in man and monkey. Eye. 1992;6:136–144. doi: 10.1038/eye.1992.29. [DOI] [PubMed] [Google Scholar]
- Hendrickson A. Development of retinal layers in prenatal human retina. Am J Ophthalmol. 2016;161:29–35.e1. doi: 10.1016/j.ajo.2015.09.023. [DOI] [PMC free article] [PubMed] [Google Scholar]
- Hendrickson A, Kupfer C. The histogenesis of the fovea in the macaque monkey. Invest Ophthalmol Vis Sci. 1976;15:746–756. [PubMed] [Google Scholar]
- Hendrickson AE, Yuodelis C. The morphological development of the human fovea. Ophthalmology. 1984;91:603–612. doi: 10.1016/s0161-6420(84)34247-6. [DOI] [PubMed] [Google Scholar]
- Hendrickson A, Zhang C. Development of cone photoreceptors and their synapses in the human and monkey fovea. J Comp Neurol. 2017 doi: 10.1002/cne.24170. http://doi.wiley.com/10.1002/cne.24170. [DOI] [PMC free article] [PubMed]
- Hendrickson A, Bumsted-O’Brien K, Natoli R, Ramamurthy V, Possin D, Provis J. Rod photoreceptor differentiation in fetal and infant human retina. Exp Eye Res. 2008;87:415–426. doi: 10.1016/j.exer.2008.07.016. [DOI] [PMC free article] [PubMed] [Google Scholar]
- Hughes A. The topography of vision in mammals of contrasting life styles: comparative optics and retinal organization. In: Crescitelli F, editor. Handbook of Sensory Physiology. Springer-Verlag; 1977. pp. 613–756. [Google Scholar]
- Hyatt GA, Schmitt EA, Marsh-Armstrong NR, Dowling JE. Retinoic acid-induced duplication of the zebrafish retina. Proc Natl Acad Sci USA. 1992;89:8293–8297. doi: 10.1073/pnas.89.17.8293. [DOI] [PMC free article] [PubMed] [Google Scholar]
- Hyatt GA, Schmitt EA, Fadool JM, Dowling JE. Retinoic acid alters photoreceptor development in vivo. Proc Natl Acad Sci USA. 1996;93:13298–13303. doi: 10.1073/pnas.93.23.13298. [DOI] [PMC free article] [PubMed] [Google Scholar]
- Inzunza O, Bravo H, Smith RL. Foveal regions of bird retinas correlate with the aster of the inner nuclear layer. Anat Rec. 1989;223:342–346. doi: 10.1002/ar.1092230313. [DOI] [PubMed] [Google Scholar]
- Jacob M, Unser M. Design of steerable filters for feature detection using canny-like criteria. IEEE Trans Pattern Anal Mach Intell. 2004;26:1007–1019. doi: 10.1109/TPAMI.2004.44. [DOI] [PubMed] [Google Scholar]
- Kelley MW, Turner JK, Reh TA. Retinoic acid promotes differentiation of photoreceptors in vitro. Development. 1994;120:2091–2102. doi: 10.1242/dev.120.8.2091. [DOI] [PubMed] [Google Scholar]
- Khanna H, Akimoto M, Siffroi-Fernandez S, Friedman JS, Hicks D, Swaroop A. Retinoic acid regulates the expression of photoreceptor transcription factor NRL. J Biol Chem. 2006;281:27327–27334. doi: 10.1074/jbc.M605500200. [DOI] [PMC free article] [PubMed] [Google Scholar]
- Kim JW, Yang HJ, Oel AP, Brooks MJ, Jia L, Plachetzki DC, Li W, Allison WT, Swaroop A. Recruitment of rod photoreceptors from short-wavelength-sensitive cones during the evolution of nocturnal vision in mammals. Dev Cell. 2016;37:520–532. doi: 10.1016/j.devcel.2016.05.023. [DOI] [PMC free article] [PubMed] [Google Scholar]
- Kumar S, Duester G. Retinoic acid controls body axis extension by directly repressing Fgf8 transcription. Development. 2014;141:2972–2977. doi: 10.1242/dev.112367. [DOI] [PMC free article] [PubMed] [Google Scholar]
- Lovicu FJ, Overbeek PA. Overlapping effects of different FGF family members on lens fiber differentiation in transgenic mice. Invest Ophthalmol Vis Sci. 1997;38:3365–3377. doi: 10.1242/dev.125.17.3365. [DOI] [PubMed] [Google Scholar]
- Loy G, Zelinsky A. Fast radial symmetry for detecting points of interest. IEEE Trans Pattern Anal Mach Intell. 2003;25:959–973. [Google Scholar]
- Luo T, Sakai Y, Wagner E, Dräger UC. Retinoids, eye development, and maturation of visual function. J Neurobiol. 2006;66:677–686. doi: 10.1002/neu.20239. [DOI] [PubMed] [Google Scholar]
- Maden M. Retinoid signalling in the development of the central nervous system. Nat Rev. 2002;3:843–853. doi: 10.1038/nrn963. [DOI] [PubMed] [Google Scholar]
- Mann IC. The process of differentiation of the retinal layers in vertebrates. Br J Ophthalmol. 1928;12:449–478. doi: 10.1136/bjo.12.9.449. [DOI] [PMC free article] [PubMed] [Google Scholar]
- Mann I. The Development of the Human Eye. Grune & Stratton; 1964. The development of the human eye; pp. 69–150. [Google Scholar]
- Mark M, Ghyselinck NB, Chambon P. Function of retinoic acid receptors during embryonic development. Nucl Recept Signal. 2009;7:e002. doi: 10.1621/nrs.07002. [DOI] [PMC free article] [PubMed] [Google Scholar]
- Martinez-Morales JR, Del Bene F, Nica G, Hammerschmidt M, Bovolenta P, Wittbrodt J. Differentiation of the vertebrate retina is coordinated by an FGF signaling center. Dev Cell. 2005;8:565–574. doi: 10.1016/j.devcel.2005.01.022. [DOI] [PubMed] [Google Scholar]
- Matt N, Dupé V, Garnier JM, Dennefeld C, Chambon P, Mark M, Ghyselinck NB. Retinoic acid-dependent eye morphogenesis is orchestrated by neural crest cells. Development. 2005;132:4789–4800. doi: 10.1242/dev.02031. [DOI] [PubMed] [Google Scholar]
- McCaffery P, Lee MO, Wagner MA, Sladek NE, Dräger UC. Asymmetrical retinoic acid synthesis in the dorsoventral axis of the retina. Development. 1992;115:371–382. doi: 10.1242/dev.115.2.371. [DOI] [PubMed] [Google Scholar]
- Mears AJ, Kondo M, Swain PK, Takada Y, Bush RA, Saunders TL, Sieving PA, Swaroop A. Nrl is required for rod photoreceptor development. Nat Genet. 2001;29:447–452. doi: 10.1038/ng774. [DOI] [PubMed] [Google Scholar]
- Mey J, McCaffery P, Klemeit M. Sources and sink of retinoic acid in the embryonic chick retina: distribution of aldehyde dehydrogenase activities, CRABP-I, and sites of retinoic acid inactivation. Dev Brain Res. 2001;127:135–148. doi: 10.1016/s0165-3806(01)00127-4. [DOI] [PubMed] [Google Scholar]
- Mitchell DM, Stevens CB, Frey RA, Hunter SS, Ashino R, Kawamura S, Stenkamp DL. Retinoic acid signaling regulates differential expression of the tandemly-duplicated long wavelength-sensitive cone opsin genes in zebrafish. PLoS Genet. 2015;11:e1005483. doi: 10.1371/journal.pgen.1005483. [DOI] [PMC free article] [PubMed] [Google Scholar]
- Moore BA, Kamilar JM, Collin SP, Bininda-Emonds OR, Dominy NJ, Hall MI, Heesy CP, Johnsen S, Lisney TJ, Loew ER, et al. A novel method for comparative analysis of retinal specialization traits from topographic maps. J Vis. 2012;12:1–24. doi: 10.1167/12.12.13. [DOI] [PubMed] [Google Scholar]
- Morris VB. An afoveate area centralis in the chick retina. J Comp Neurol. 1982;210:198–203. doi: 10.1002/cne.902100210. [DOI] [PubMed] [Google Scholar]
- Nakano T, Ando S, Takata N, Kawada M, Muguruma K, Sekiguchi K, Saito K, Yonemura S, Eiraku M, Sasai Y. Self-formation of optic cups and storable stratified neural retina from human ESCs. Cell Stem Cell. 2012;10:771–785. doi: 10.1016/j.stem.2012.05.009. [DOI] [PubMed] [Google Scholar]
- Nelson DR, Goldstone JV, Stegeman JJ. The cytochrome P450 genesis locus: the origin and evolution of animal cytochrome P450s. Philos Trans R Soc Lond B Biol Sci. 2013;368:20120474. doi: 10.1098/rstb.2012.0474. [DOI] [PMC free article] [PubMed] [Google Scholar]
- Osakada F, Ikeda H, Mandai M, Wataya T, Watanabe K, Yoshimura N, Akaike A, Sasai Y, Takahashi M. Toward the generation of rod and cone photoreceptors from mouse, monkey and human embryonic stem cells. Nat Biotechnol. 2008;26:215–224. doi: 10.1038/nbt1384. [DOI] [PubMed] [Google Scholar]
- Perz-Edwards A, Hardison NL, Linney E. Retinoic acid-mediated gene expression in transgenic reporter zebrafish. Dev Biol. 2001;229:89–101. doi: 10.1006/dbio.2000.9979. [DOI] [PubMed] [Google Scholar]
- Peters MA, Cepko CL. The dorsal – ventral axis of the neural retina is divided into multiple domains of restricted gene expression which exhibit features of lineage compartments. Dev Biol. 2002;251:59–73. doi: 10.1006/dbio.2002.0791. [DOI] [PubMed] [Google Scholar]
- Prada C, Puga J, Pérez-Méndez L, López R, Ramírez G. Spatial and temporal patterns of neurogenesis in the chick retina. Eur J Neurosci. 1991;3:559–569. doi: 10.1111/j.1460-9568.1991.tb00843.x. [DOI] [PubMed] [Google Scholar]
- Provis JM, Diaz CM, Dreher B. Ontogeny of the primate fovea: a central issue in retinal development. Prog Neurobiol. 1998;54:549–580. doi: 10.1016/s0301-0082(97)00079-8. [DOI] [PubMed] [Google Scholar]
- Provis JM, Dubis AM, Maddess T, Carroll J. Adaptation of the central retina for high acuity vision: cones, the fovea and the a vascular zone. Prog Retin Eye Res. 2013;35:63–81. doi: 10.1016/j.preteyeres.2013.01.005. [DOI] [PMC free article] [PubMed] [Google Scholar]
- Querubin A, Lee HR, Provis JM, O’Brien KM. Photoreceptor and ganglion cell topographies correlate with information convergence and high acuity regions in the adult pigeon (Columba livia) retina. J Comp Neurol. 2009;517:711–722. doi: 10.1002/cne.22178. [DOI] [PubMed] [Google Scholar]
- Reijntjes S, Gale E, Maden M. Expression of the retinoic acid catabolising enzyme CYP26B1 in the chick embryo and its regulation by retinoic acid. Gene Expr Patterns. 2003;3:621–627. doi: 10.1016/s1567-133x(03)00112-1. [DOI] [PubMed] [Google Scholar]
- Rhinn M, Dolle P. Retinoic acid signalling during development. Development. 2012;139:843–858. doi: 10.1242/dev.065938. [DOI] [PubMed] [Google Scholar]
- Rodrigues T, Krawczyk M, Skowronska-Krawczyk D, Matter-Sadzinski L, Matter JM. Delayed neurogenesis with respect to eye growth shapes the pigeon retina for high visual acuity. Development. 2016;143:4701–4712. doi: 10.1242/dev.138719. [DOI] [PubMed] [Google Scholar]
- Rossant J, Zirngibl R, Cado D, Shago M, Giguere V. Expression of retinoic acid response element-hsp lacZ transgene defines specific domains of transcriptional activity during mouse embryogenesis. Genes Dev. 1991;5:1333–1344. doi: 10.1101/gad.5.8.1333. [DOI] [PubMed] [Google Scholar]
- Schulte D, Peters MA, Sen J, Cepko CL. The rod photoreceptor pattern is set at the optic vesicle stage and requires spatially restricted cvax expression. J Neurosci. 2005;25:2823–2831. doi: 10.1523/JNEUROSCI.2037-04.2005. [DOI] [PMC free article] [PubMed] [Google Scholar]
- Sen J, Harpavat S, Peters MA, Cepko CL. Retinoic acid regulates the expression of dorsoventral topographic guidance molecules in the chick retina. Development. 2005;23:5147–5159. doi: 10.1242/dev.02100. [DOI] [PubMed] [Google Scholar]
- Slonaker JR. A Comparative Study of the Area of Acute Vision in Vertebrates. The Athenaeum Press; 1897. [Google Scholar]
- Stenkamp DL, Gregory JK, Adler R. Retinoid effects in purified cultures of chick embryo retina neurons and photoreceptors. Invest Ophthalmol Vis Sci. 1993;34:2425–2436. [PubMed] [Google Scholar]
- Stevens CB, Cameron DA, Stenkamp DL. Plasticity of photo-receptor-generating retinal progenitors revealed by prolonged retinoic acid exposure. BMC Dev Biol. 2011;11:51. doi: 10.1186/1471-213X-11-51. [DOI] [PMC free article] [PubMed] [Google Scholar]
- Straznicky C, Chehade M. The formation of the area centralis of the retinal ganglion cell layer in the chick. Development. 1987;100:411–420. doi: 10.1242/dev.100.3.411. [DOI] [PubMed] [Google Scholar]
- Vogel-Höpker A, Momose T, Rohrer H, Yasuda K, Ishihara L, Rapaport DH. Multiple functions of fibroblast growth factor-8 (FGF-8) in chick eye development. Mech Dev. 2000;94:25–36. doi: 10.1016/s0925-4773(00)00320-8. [DOI] [PubMed] [Google Scholar]
- Wagner M, Han B, Jessell TM. Regional differences in retinoid release from embryonic neural tissue detected by an in vitro reporter assay. Development. 1992;116:55–66. doi: 10.1242/dev.116.1.55. [DOI] [PubMed] [Google Scholar]
- Walls GL. The Vertebrate Eye and Its Adaptive Radiation. Cranbrook Institute of Science; 1942. [Google Scholar]
- Wassle H, Boycott BB. Functional architecture of the mammalian retina. Physiol Rev. 1991;71:447–480. doi: 10.1152/physrev.1991.71.2.447. [DOI] [PubMed] [Google Scholar]
- Van Wauwe J, Van Nyen G, Coene MC, Stoppie P, Cools W, Goossens J, Borghgraef P, Janssen PA. Liarozole, an inhibitor of retinoic acid metabolism, exerts retinoid-mimetic effects in vivo. J Pharmacol Exp Ther. 1992;261:773–779. [PubMed] [Google Scholar]
- Wilson JG, Roth CB, Warkany J. An analysis of the syndrome of malformations induced by maternal vitamin a deficiency. effects of restoration of vitamin a at various times during gestation. Am J Anat. 1953;92:189–217. doi: 10.1002/aja.1000920202. [DOI] [PubMed] [Google Scholar]
Associated Data
This section collects any data citations, data availability statements, or supplementary materials included in this article.
Supplementary Materials
Figure S1- Time course of expression of RA degrading enzymes, Cyp26a1, Cyp26c1 and Cyp26b1, during retinogenesis and RARE activity following addition of atRA, related to Figure 1.
(A) Flat mount chromogenic ish of Cyp26a1 from HH23 to HH30. Note the dynamic expression of the bull’s eye domain, which ceases after HH27, more apparent in the magnified images. The stripe domain is maintained at least until HH30. (B) Further magnification focusing on the bull’s eye domain of Cyp26a1, illustrating the transient expression of this domain. Note that Cyp26a1 is also expressed along the optic fissure (arrows). (C) Flat mount ish for Cyp26c1 from HH23 to HH30. Note the discrete circular domain of Cyp26c1 expression in a central spot and slightly nasal to optic nerve head at HH23 that lasts at least until HH30. This pattern seems to expand with time and fades after HH29. (D) Whole mount and flat mount ish for Cyp26b1 at stated time points. At HH23 a faint domain of expression was observed in the nasal pole of the retina, arrow. At HH24 some expression was still detected at the most peripheral retina of the nasal region and at HH27 no expression was detected. (E) Dose-dependent response of the RA reporter to increasing amounts of atRA added in the culture medium of E5 plus 2div explants. Note the gradual loss of the RA-signaling free spot with higher doses of atRA. (F) Retina explant cultured for 16 hours in vitro and processed for Cyp26a1 ish. Note the increase of Cyp26a1 expression throughout the whole retina in response to 5μM atRA added to the medium. Both control and treated retinas were processed together and stained for the same amount of time. (G) RARE-reporter response of E5 plus 2div explant incubated with 5μM of Liarozole, a Cyp26s proteins inhibitor. Note the loss of the RARE-signaling-free spot. Scale bar, 500μm. D, dorsal; V, ventral; N, nasal; T, temporal. All images are oriented consistently.
Figure S2 – Time-course expression of Fgf8 during retinogenesis, relative to Cyp26a1, related to Figure 1
(A) Flat mount chromogenic ish of Fgf8 from HH23 to HH30. Note the presence of a spot located centrally and nasal to the optic nerve head and a stripe across the equator. (B) Fgf8 ish time course focusing on the spot domain of expression and (C) relationship with Cyp26a1 bull’s eye domain. Note that the Fgf8 spot increased in size over time. The Fgf8 spot became stronger with time until it reached the peak of intensity at HH27/HH28, coincident with the loss of the Cyp26a1 bull’s eye. (D) Fgf8 transcripts were still detected at HH35-36 in a patterned manner. (E) Fish for Fgf8 counterstained with DAPI on a HH38 retina cross section showed expression of Fgf8 in the central retina in a subset of cells with their cell bodies located in the center of the INL, likely Mueller glial cells. Scale bar, 500μm in (A), (B), (C) and (D) and 50μm in (E). D, dorsal; V, ventral; N, nasal; T, temporal; ONL, outer nuclear layer; INL, inner nuclear layer; GCL, ganglion cell layer.
Figure S3 – Spatial correlation between Fgf8 and Cyp26a1 at HH29, related to Figure 2
Flat mount fish of a HH29 chick retina probed for Fgf8, in green, and Cyp26a1, in red. High magnification images demonstrate the partial spatial co-localization between both transcripts in the stripe domain along the equator of the retina. However the Fgf8 expression does not co-localize with Cyp26a1 expression in his spot domain but rather fills in the Cyp26a1-negative circular region. Scale bar, 500μm. D, dorsal; V, ventral; N, nasal; T, temporal.
Figure S4 – Pharmacological manipulation of RA signaling at HH25 affects the HAA by disturbing the RFZ, related to Figure 4
(A) Retina injected in vivo with atRA at HH25, harvested at E19, analyzed for Rhodopsin ish and the matching uninjected L eye of the same embryo. Note that overall the two retinas look alike, their size was similar and the high-ventral to low-dorsal gradient of rhodopsin expression was present in both. Some RPE is still present in the L retina. (B) Images of dorsal and ventral regions from an uninjected and atRA-injected retina at HH25 and processed for rhodopsin ish at E19. (C) Validation of PDE6γ marker as a specific rod marker. Single chromogenic ish on flat mount and cross sections of E19 chick retina confirmed the presence of a RFZ and a high-ventral to low-dorsal gradient of rods. Flat mount double fish for rhodopsin, in green, and PDE6γ, in red, shows 100% co-localization between the two probes. (D) Flat mount ish with PDE6γ probe in atRA+Liarozole-treated retinas and uninjected L eye revealed induction of PDE6γ positive cells in the RFZ. (E) Fish on a cross section of P0 chick retina for rhodopsin and counterstained with DAPI. Note the presence of the RFZ and the increase in GCL thickness beneath the RFZ versus outside the RFZ, more apparent in the high magnifications of the corresponding boxed areas, 1 and 2, respectively. Scale bar, 2mm in (A), 100μm in (B), (D) and 50μm in (C), (E). D, dorsal; V, ventral; N, nasal; T, temporal; GCL, ganglion cell layer.
Figure S5 – Pharmacological manipulation of RA signaling at HH25 affects the HAA, by disturbing the aster structure, related to Figure 5
Representative images of the aster structure visualized by WGA-TRITC staining, top panels, in untreated, atRA- and Liarozole-treated retinas. Corresponding SteerableJ transformations and color-coded outputs of the examples are shown. Note the loss of radial organization of aster structure in atRA- and Liarozole-injected retinas in relation to untreated retina. Application of the rsl algorithm to the same examples shows a reduced rsl value in treated compared to untreated retina. Corresponding rsl values for each retina is shown (see Figure 5G scatter plot for quantification and statistical analysis). Scale bar, 50μm.
Figure S6- Retinal Fgf8-knockdown by electroporation of RCAS:shFgf8 induced multiple phenotypes in the retina, related to Figure 6
(A) Knockdown of Fgf8 in the retina was accomplished by in vivo electroporation of an shRNA to Fgf8 expressed from the virus, RCAS, as schematized in Figure 6A. Examples of a pair of retinas from the same embryo harvested at E19. Only the right (R) eye was electroporated early at HH11 but due to its replication ability, the virus reached the L eye. Note that Fgf8 knockdown had an effect on RPE pigmentation, with the R eye being completely affected while L eye was only partially affected, as can be seen by the partial RPE depigmentation phenotype, with the dorsal domain being more affected than the ventral region. (B) Rhodopsin flat mount ish on retinas depicted in (A). R retina showed an overall strong downregulation of Rhodopsin ish signal, with some patchiness throughout the whole retina. This effect, and the effect on the RPE, led us to not analyze the RFZ in the R eye, due to potential indirect effects of the changes in the RPE. Dotted circle highlights the RFZ region. (C) The aster structure visualized by SteerableJ or rsl algorithms of a corresponding pair of ipsilateral and contralateral eyes of an RCAS:shFGF8 electroporated embryo. Note that both eyes had an affected aster. Correspondent rsl value for each retina is shown. D, dorsal; V, ventral. N, nasal; T, temporal; Scale bar, 2mm in (A) and (B) and 50μm in (C).
Figure S7 – Cyp26a1 expression in early embryonic human retina, related to Figure 7
(A) Back, ventral and dorsal views of CS22 human embryonic eye illustrating human eye shape at this time in development. (B) Cyp26a1 ish on CS22 retina cross sections along the dorsoventral axis depicting localized signal in only 3 consecutive sections, each 120μm apart. (C) Flat mount ish for Cyp26a1 on CS23 human retina. No ish signal was detected at this stage, only approximately 2 days later than CS22, shown in (B) and Figure 7C–D. Note that since some RPE was still attached to the neural retina in the region of the future fovea, retina was imaged from both outer nuclear layer side (C’) and ganglion cell layer side (C”) to ensure proper examination, imaging and interpretation of the results. *, lens. Scale bar, 500μm in (A) and (C) and 200μm in (B). D, dorsal; V, ventral; N, nasal; T, temporal.
Table S1- Related to STAR Methods. Additional ish probes sequences and qPCR primers