

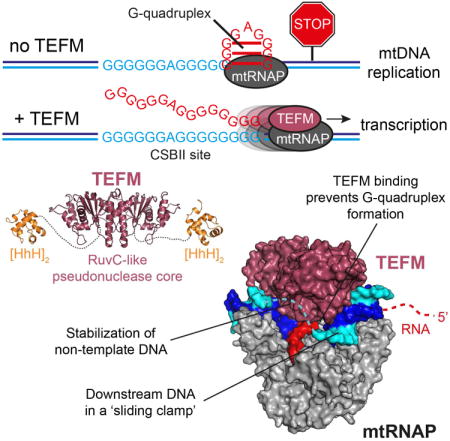
Summary
In human mitochondria, transcription termination events at a G-quadruplex region near the replication origin are thought to drive replication of mtDNA by generation of an RNA primer. This process is suppressed by a key regulator of mtDNA – the transcription factor TEFM. We determined the structure of an anti-termination complex in which TEFM is bound to transcribing mtRNAP. The structure reveals interactions of the dimeric pseudonuclease core of TEFM with mobile structural elements in mtRNAP and the nucleic acid components of the EC. Binding of TEFM to the DNA forms a downstream “sliding clamp”, providing high processivity to the elongation complex. TEFM also binds near the RNA exit channel to prevent formation of the RNA G-quadruplex structure required for termination and thus synthesis of the replication primer. Our data provide insights into target specificity of TEFM and mechanisms by which it regulates the switch between transcription and replication of mtDNA.
Graphical abstract
Crystal structures of the human mitochondrial transcription factor TEFM with its C-terminal domain bound to a transcription elongation complex provide insights into the molecular basis of its roles in promoting elongation and preventing termination.
Introduction
In human mitochondria, the process of replication of mtDNA is directly linked to transcription (Asin-Cayuela and Gustafsson, 2007; Gustafsson et al., 2016). In the absence of a dedicated mitochondrial primase, replication primers are generated by the mitochondrial RNA polymerase (mtRNAP), a single subunit enzyme that resembles phage RNAPs (Gustafsson et al., 2016; Phillips et al., 2017; Ringel et al., 2011; Wanrooij et al., 2008). The early replication events in human mitochondria require assembly of the transcription initiation complex at the light strand promoter (LSP) (Morozov et al., 2015) and termination of transcription after synthesis of a ∼120 nt RNA transcript to produce the primer necessary to initiate mtDNA synthesis (Chang and Clayton, 1985). This termination event is triggered by a conserved G-rich sequence, called CSBII, which is located near the replication origin OriH and encodes a short G-quadruplex structure (Wanrooij et al., 2012; Wanrooij et al., 2010).
Recently, a mitochondrial transcription elongation factor, TEFM, was shown to efficiently prevent termination at CSBII (Agaronyan et al., 2015; Posse et al., 2015). TEFM is a processivity factor required for synthesis of long, near genome-size polycistronic transcripts by the otherwise non-processive mtRNAP (Agaronyan et al., 2015; Minczuk et al., 2011). It has been suggested that TEFM can serve as a key regulator involved in the molecular switch. TEFM would regulate whether a mitochondrial nucleoid undergoes replication (in the absence of TEFM) or transcription (in the presence of TEFM) and help to avoid head-on collisions between the replisome and the elongating mtRNAP (Agaronyan et al., 2015).
In this work, we present the atomic structures of human TEFM domains and define their roles in transcription elongation and anti-termination at the CSBII site. We have also determined the structure of the functionally relevant TEFM C-terminal domain bound to the elongation complex (EC) of mtRNAP, which explains how TEFM enhances transcription processivity. These structural data together with the functional experiments and cross-linking analysis suggest the mechanisms that TEFM exploits to regulate transcription elongation and anti-termination.
Results
TEFM contains two structured domains
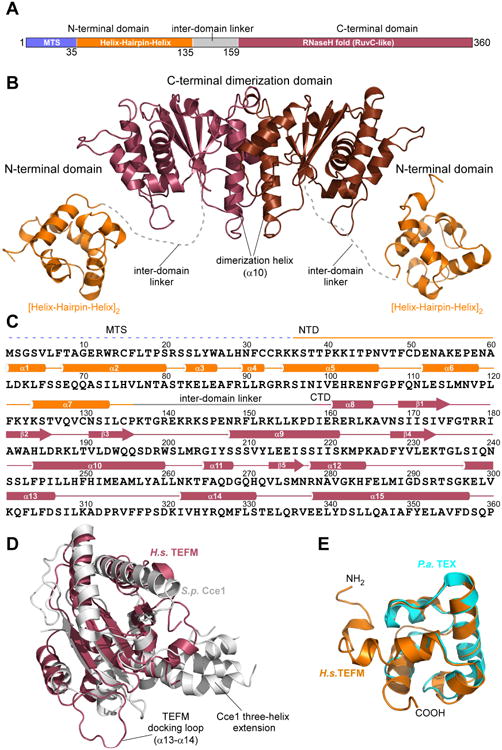
Our initial crystallization trials did not produce crystals of full-length TEFM. Sequence based homology prediction suggested that human TEFM contains at least two regions with distinct structural organization (Minczuk et al., 2011), possibly interspersed by less well-ordered domains (Figure 1A). Protease treatment is known to improve chances of crystallization of proteins with flexible regions (Dong et al., 2007). We therefore probed whether TEFM contains unstructured regions that may interfere with its crystallization by using limited proteolysis with trypsin, LysC and ArgC proteases. These experiments revealed two stable regions representing the N-terminal domain (NTD, ∼10 kDa) and the C-terminal domain (CTD, ∼26 kDa) of TEFM, while the region between these domains (the inter-domain linker) was sensitive to proteolysis (Figure S1A).
Figure 1. Crystal structure of human TEFM.
(A) Schematic representation of human TEFM with residue numbers indicated. Domains identified by sequence-based homology prediction are depicted in different colors: mitochondrial targeting sequence (MTS): blue; N-terminal domain (NTD): orange; C-terminal domain (CTD): raspberry, inter-domain linker: gray.
(B). A ribbon model of TEFM with the major domains and structural elements indicated. The C-terminal dimeric domain (CTD) is in brown/raspberry, the N-terminal domains (NTD) in orange. The inter-domain linker is represented by a dashed, grey line.
(C). Schematics of the primary and secondary structures of TEFM.
(D). Structural alignment of TEFM CTD (raspberry) and fission yeast Holliday junction resolvase Cce1 (PDB ID 1KCF) (grey).
(E). Structural alignment of TEFM NTD (orange) and bacterial (P. aeroginosa) transcription factor TEX (PDB ID 3BZC) (cyan). See also Table S1, Figure S1
Limited proteolysis of TEFM with ArgC prior to crystallization yielded large well-diffracting crystals of the CTD. The structure was subsequently solved at 1.9 Å resolution by single-wavelength anomalous diffraction (SAD) using selenomethionine-labelled protein (Table S1, Figure S1B,C). The TEFM CTD crystals belong to space group C2 and contain four molecules in the asymmetric unit with only minor differences between the individual molecules (Cα RMSD < 1 Å over 200 residues). To obtain the crystal structure of the TEFM NTD, we expressed this domain separately and obtained large, rod-like crystals of space group P43212 containing one molecule in the asymmetric unit. The structure of the NTD was solved at a resolution of 1.3 Å using the anomalous signal of the naturally occurring sulphur atoms (native-SAD) (Table S1, Figure S1D). The crystal structures of the NTD and the CTD were refined to free R-factors of 19.7 and 22.8, respectively, and both showed excellent stereo chemical quality (Table S1).
Structure of TEFM
In the two crystal forms, we observed interpretable electron density for residues 57-134 (NTD) and residues 153-356 (CTD), which comprise 87% of the full-length, mature TEFM (Table S1). Our structures lack 21 N-terminal residues, 3 C-terminal residues, and a 19-amino acid linker region, which connects the two domains. The linker contains six lysine and two arginine residues and appears to be disordered in the CTD structure. The TEFM CTD forms a dimeric assembly of monomers containing an RNase H-like fold that is characteristic of members of the Holliday junction resolvase family of enzymes (Figure 1B,C, S1B) (Wyatt and West, 2014). This family includes a large number of RuvC-like resolvases from bacteria, viruses, and mitochondria (Ariyoshi et al., 1994; Gorecka et al., 2013; Oram et al., 1998). Structural alignment suggests that the closest structural homolog to the TEFM CTD is Schizosaccharomyces pombe mitochondrial Holliday junction resolvase, Cce1 (Ydc2) (Ceschini et al., 2001). While TEFM and Cce1 share little in sequence homology, the structures contain a common core fold consisting of five β-strands and four C-terminal helices (Figure 1D, S1B). Compared to Cce1, TEFM lacks a protruding three-helix region, and two N-terminal helices and two loops (α12-α13; α13-α14) are expanded (Figure 1D) (Sigala and Tsaneva, 2003). Similar to Cce1, dimerization of the TEFM CTD is mediated by a hydrophobic interface mainly formed by a contact between the α10 helices (residues 244–266) from the two CTD monomers.
A unique feature of TEFM, not observed thus far in any related bacterial or mitochondrial Holliday junction resolvase, is the presence of a compact globular N-terminal domain (Figure 1B). The structure of the NTD reveals that this domain adopts a tandem helix-hairpin-helix fold ([HhH]2) found in a number of DNA binding proteins. HhH domains have been implicated in non-sequence-specific double stranded DNA binding and have been found in bacterial and eukaryotic transcription factors and other DNA binding proteins (Close et al., 2011; Johnson et al., 2008). Although lacking apparent sequence homology, the TEFM NTD superimposes well with the HhH domain of the bacterial Tex protein (Cα RMSD = 1.4 Å over 56 residues, PDB 3BZC) (Figure 1E). Taken together, TEFM exhibits a previously unseen combination of distinct structural domains – the Holliday junction resolvase-like CTD core flanked by two globular HhH domains.
Functional role of TEFM domains
TEFM has been previously implicated in anti-termination activity and was shown to affect mtRNAP stability and processivity (Agaronyan et al., 2015; Minczuk et al., 2011; Posse et al., 2015). To determine the functional role of TEFM domains in these activities, we constructed variants representing the CTD alone (Δ159 TEFM, residues 160-360), the CTD with a part of the linker (Δ144 TEFM, residues 145-360) and the CTD with the linker (Δ135 TEFM, residues 136-360) (Figure 2A). In the anti-termination assay, transcription of template DNA containing the CSBII region results in termination of RNA synthesis by mtRNAP in the absence of TEFM, whereas its addition results in accumulation of run-off products (Figure 2B, lanes 1-4). We found that the NTD of TEFM is not required for anti-termination activity (Figure 2B, lanes 5-7). Removal of 10 amino acids of the linker along with the NTD results in significant loss of anti-termination activity (Figure 2B, lanes 8-10), while deletion of the entire linker subdomain abolished anti-termination (Figure 2B, lanes 11-13). TEFM variants containing single or multiple substitutions in the linker were defective to various extents in anti-termination activity, and substitution of amino acid residues 149-153 resulted in loss of activity (Figure 2C, D). We therefore conclude that the inter-domain linker is required for anti-termination activity of TEFM.
Figure 2. Functional role of TEFM domains.
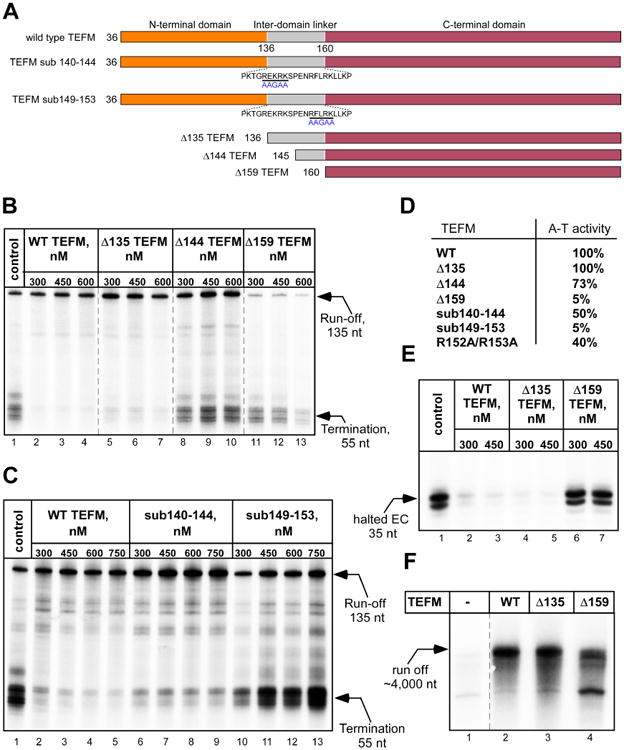
(A) Schematic representation of the TEFM NTD truncation mutants and inter-domain linker substation mutants used. Residues substituted are underlined with a black bar and the replacing residues are shown in blue beneath.
(B) TEFM CTD with the linker are required for anti-termination activity. Transcription assays were performed using a PCR template containing LSP and the CSBII region. The control reaction (lane 1) contains no TEFM. The reaction products were resolved using 20% PAGE containing 6M Urea.
(C, D) Anti-termination activity of TEFM variants having substitutions in the inter-domain linker.
(E) The NTD of TEFM is not required for the EC stability. The ECs assembled in the presence or absence of TEFM variants were halted 35 nt downstream of the transcription start site by omitting CTP. Upon incubation, the complexes were chased with CTP and the products of the reaction resolved using 20% PAGE containing 6M Urea. The region of the gel containing the 35 nt RNA is shown.
(F). Only the CTD of TEFM is required for mtRNAP processivity. Transcription was performed using a linearized plasmid template containing the LSP promoter to generate ∼4000 nt run-off product.
We next analyzed which part of TEFM affects its ability to stabilize the EC (Figure 2E). In this assay, ECs are halted 35 bp downstream from a promoter (in the absence of CTP) for 60 min prior to a “chase” to run-off transcription. In the absence of TEFM, halted ECs are not stable and accumulation of 35-mer RNA product is observed (Figure 2E, lane 1). Addition of TEFM, however, results in stabilization of the EC, prevents high mtRNAP turn-over and, consequently, causes nearly complete extension of 35 nt RNA to run-off (Figure 2E, lanes 2-3). As in the experiments described above, deletion of the NTD did not affect TEFM stabilization activity (Figure 2E, lanes 4-5), while loss of both NTD and inter-domain linker rendered TEFM incapable of EC stabilization (Figure 2E, lanes 6-7). Finally, we examined whether the TEFM variants were able to support mtRNAP processivity on long templates (Figure 2F). In the absence of TEFM, mtRNAP is not able to produce detectable 4,000 nt long run-off RNA products. In contrast, run-off synthesis was observed in the presence of TEFM or TEFM variants lacking the NTD (Figure 2F, lanes 2-3). In the presence of TEFM CTD, mtRNAP was still able to generate long RNA transcripts, suggesting that the CTD, even without the inter-domain linker, is sufficient for stimulating processivity (Figure 2F, lane 4).
Structure determination of TEFM-mtRNAP elongation complex
To obtain the crystal structure of an anti-termination complex, in which elongating mtRNAP is bound to TEFM, we first defined the topology of the nucleic acid scaffold in the EC by RNase I and DNase I foot-printing (Figure 3A). In the absence of TEFM no clear RNA footprint was detected, likely due to the relative instability of the halted ECs. In contrast, in the presence of TEFM, a distinct footprint of about 19 nt of protected RNA was observed suggesting that TEFM stabilizes the EC by interacting with the 5′ end of the exiting transcript (Figure 3A). Removal of the NTD did not significantly alter the TEFM footprint, identifying the CTD and the linker domain as primary RNA-interacting regions (Figure S2A, B).
Figure 3. Topology of the anti-termination complex.
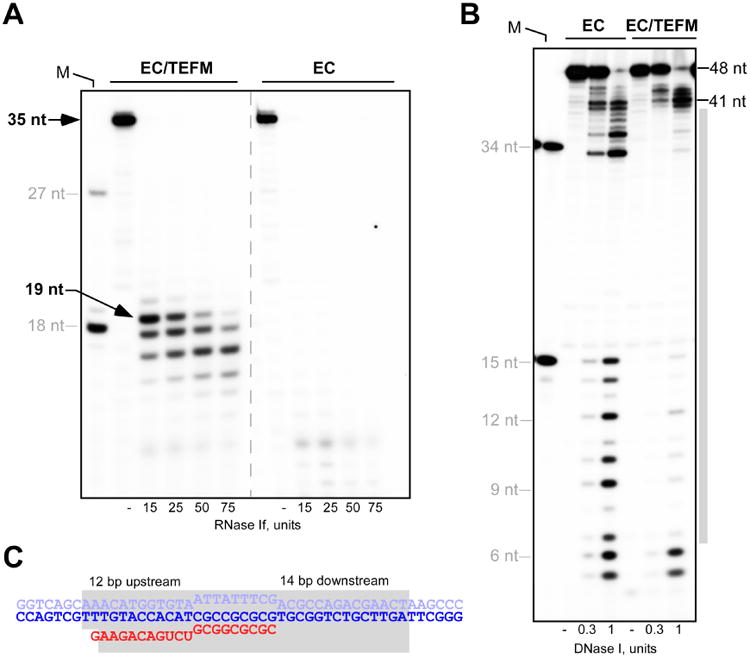
(A) TEFM protects 19-20 nt of RNA from RNase 1 cleavage in the EC-TEFM complex. The ECs were halted 35 bp downstream of the LSP promoter prior to RNase 1 treatment. Positions of the RNA markers (18 and 27 nt) are indicated by grey lines.
(B) TEFM protects the downstream and the upstream DNA in the EC. The EC was assembled using R14/TS26/NT26A scaffold in the absence or presence of TEFM prior to DNase I treatment. The length of the DNA markers (15 and 34 nt, the leftmost lane) is indicated. The grey bar represents the DNA region protected by TEFM.
(C) Schematics of the RNA and DNA protection regions (shown in grey) in the anti-termination complex shown on scaffold used in (B). See also Figure S2
TEFM has previously been shown to interact with the DNA in the EC (Agaronyan et al., 2015). To determine the TEFM footprint on DNA, we assembled ECs using an RNA-DNA scaffold and probed TEFM protection by DNase I (Figure 3B). In the presence of TEFM the protected region was significantly larger than for the EC alone, and included about 12 bp of upstream DNA and 14 bp of downstream DNA (Figure 3B, C). We did not detect any changes in DNA protection when the Δ135 TEFM variant was used, suggesting that the NTD does not strongly associate with DNA (Figure S2C). However, the TEFM variant lacking both NTD and the linker did not produce a clear DNA foot-print (Figure S2D). Overall, binding of TEFM to the EC significantly increases the region of nucleic acid protection (Figure 3C), consistent with our previous findings (Agaronyan et al., 2015).
To crystallize the anti-termination complex, we used the Δ135 variant of TEFM, which is fully functional in anti-termination assays, and Δ150 mtRNAP assembled into an EC on an RNA-DNA scaffold derived from the foot-printing experiments above. Crystals of the EC-TEFM complex belonged to space group C2, contained two copies of the EC-TEFM complex in the asymmetric unit and diffracted to 3.9 Å resolution. The structure was solved by molecular replacement and could be refined to a free R-factor of 27.6 % (Table S2, Methods).
Architecture of the TEFM-mtRNAP elongation complex
The structure revealed that the TEFM CTD dimer forms an extensive network of interactions with all components of the EC by binding mtRNAP at the open side of the RNA-DNA hybrid cavity (Figure 4 A, B). The primary point of interaction between mtRNAP and TEFM is the intercalating hairpin (Figure 4C), a mobile element in the N-terminal domain of mtRNAP involved in separation of RNA from the RNA-DNA hybrid and thus maintenance of the trailing edge of the transcription bubble (Schwinghammer et al., 2013). Two invariant aromatic residues in the intercalating hairpin, Y610 and F612, and the conserved residue Q617 project into a hydrophobic cleft on the surface of TEFM, the walls of which are formed by helices adjacent to the β-strand core (Figure 4C).
Figure 4. Structure of the anti-termination complex.
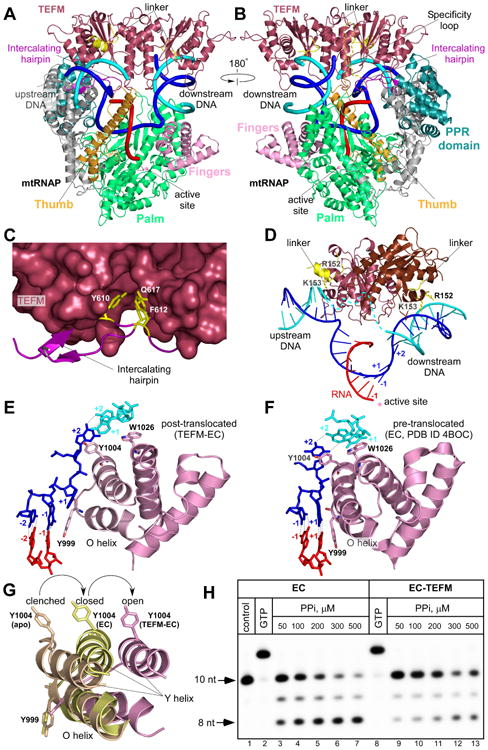
(A,B) TEFM binding to the EC. MtRNAP (ribbon model) is shown with the major domains colored: Thumb: bright orange; Palm: lime-green; NTD: grey; PPR: teal; Fingers domain: pink. RNA is shown in red, template DNA strand in blue, non-template DNA strand in cyan. Intercalating hairpin and specificity loop (modeled) of mtRNAP are highlighted in purple and yelloworange, respectively.
(C). Close-up view of the TEFM binding site at the intercalating hairpin of mtRNAP. TEFM is shown as surface representation. Conserved residues (yellow) in mtRNAP are shown as sticks.
(D) TEFM interacts with the RNA-DNA scaffold in the EC. TEFM (ribbon representation) binds at junctions of the RNA-DNA hybrid and interacts with downstream and upstream DNA. The +1 template DNA base is not paired to its non-template counterpart, indicating the post-translocated conformation state of the EC. Note the proximity of the inter-domain linkers (residues 149-159, yellow) to the DNA duplexes; positively charged residues implicated in interaction with DNA are shown as sticks.
(E,F) Orientation of the O/Y helices of the fingers domain of mtRNAP relative to the 3′ end of RNA in the post-translocated (E) and pre-translocated (F, PDB ID 4BOC) ECs.
(G) Movement of the O/Y helixes in the fingers domain of mtRNAP accompanies formation of the EC and RNA translocation. MtRNAPs from the apo form (PDB ID 3SPA), pre-translocated EC (PDB ID 4BOC) and post-translocated EC-TEFM (this work) were superimposed using the conserved palm domain (residues 643-1230).
(H) TEFM stabilizes the post-translocated state of the EC. A pyrophosphorolytic assay was performed using the EC (lanes 3-7) and the EC-TEFM complex (lanes 9-13). The control (lane 1) is the EC. The assembled complexes were nearly 100% active as evident by efficient extension of the RNA primer by GTP (lanes 2,8). See also Table S2, Figure S3, S4
The structure of the EC-TEFM complex reveals that the homodimeric form of TEFM observed in the CTD crystals also occurs when TEFM is bound to mtRNAP (Figure 4A, B). To investigate whether dimerization of TEFM is required for its activity, we modified the hydrophobic interface between the TEFM monomers to prevent their association by substituting five residues in the α10 helix (Figure S3A). In contrast to the wild type TEFM, the resulting protein eluted as a monomer during size exclusion chromatography and did not bind to the EC (Figure S3B). No anti-termination activity was observed with the mutant monomeric TEFM, confirming that dimerization of TEFM is required for its activity (Figure S3C).
TEFM makes extensive interactions (∼1000 Å2) with the downstream DNA duplex of the EC. The positively charged surface of one of the TEFM monomers covers the otherwise exposed DNA and along with mtRNAP sequesters it in a fashion resembling the DNA “clamping” observed in multi-subunit eukaryotic and bacterial RNAPs (Figure 4D, S4A, B). This clamping may explain the stabilization and higher processivity of ECs in the presence of TEFM (Agaronyan et al., 2015). The positively charged TEFM surface extends to the other monomer contributing to a much smaller interaction surface with the upstream than with the downstream DNA (Figure S4A, B). Consequently, the electron density for the downstream DNA duplex was strong, whereas the density for the upstream DNA duplex was weaker due to higher conformational flexibility (Figure S4C). Furthermore, we observed difference density corresponding to the single-stranded region of the DNA non-template strand in the transcription bubble, which wraps around the opposite side of the dimer axis of TEFM formed by the α10 helices (Figure S4C). This region of the DNA was invisible in the previous structure of the EC (Schwinghammer et al., 2013) due to conformational flexibility but seems to be stabilized in the EC-TEFM complex. However, we refrained from modelling it due to the limited resolution of the complex structure. Thus, in addition to interacting with the downstream DNA, TEFM also stabilizes the EC by sequestering the single-stranded portion of the non-template strand of DNA (Figure 4D). Although visible only partially in the EC-TEFM structure, both inter-domain linkers of TEFM are located in close proximity to the DNA suggesting that the NTDs of TEFM may reside near or at the downstream and upstream duplexes (Figure 4D). Thus, it is plausible that the positively charged residues in the linker contribute additional interaction points with the upstream and downstream DNA, thereby anchoring TEFM to the EC (Figure 4D). This could be important for the anti-termination activity because binding of TEFM to the EC must outweigh the energetically favorable formation of stable secondary structure such as a G-quadruplex. Indeed, substitutions of the charged residues in the linker region or its deletion have a profound effect on transcription anti-termination, as demonstrated above (Figure 2).
Implications for mtRNAP translocation
Binding of TEFM to the EC does not cause noticeable structural changes in the elongation factor (Cα RMSD = 0.48 Å over 389 residues). Superimposition of mtRNAP in the EC and the EC-TEFM complex reveals that the C-terminal catalytic domain remains unchanged, whereas the PPR domain and the N-terminal core domain are slightly rotated outwards and the “fingers” domain adopts a markedly different orientation (Figure 4A, Figure S4D). The latter, however, is not caused by TEFM binding per se, as the observed changes are attributed to the different translocational state of mtRNAP. Indeed, the ‘n+1’ template strand base in the EC-TEFM complex is not paired to the corresponding non-template strand base and instead is found in a “pre-insertion” site of mtRNAP, indicative of the post-translocated state of the EC (Figure 4D) (Temiakov et al., 2004). The O/Y helices of the fingers domain are rotated ∼15°, respectively, as compared to the pre-translocated complex (Schwinghammer et al., 2013), and thus the active site of mtRNAP is found in the “open” conformation, previously observed in T7 RNAP ECs (Figure 4E, F) (Tahirov et al., 2002; Yin and Steitz, 2002). Overall, the conformation of the fingers domain and the position of the 3′ end of RNA in mtRNAP closely matches those in the T7 RNAP post-translocated complex. Comparison of the available structures of mtRNAP (the apo form, pre-translocated EC and post-translocated EC) suggests a rotation of the O/Y helices around an axis that is nearly parallel to the O helix (Figure 4G). This rotation allows for delivery of the cognate substrate bound to the n+1 template base into the insertion site and the closing of the active site required for catalysis (Temiakov et al., 2004; Yin and Steitz, 2004). The mechanism of translocation therefore appears to be highly conserved between mitochondrial and phage RNAPs.
Considering the conformational changes in mtRNAP observed in the EC-TEFM structure, we employed a pyrophosphorolytic assay to probe whether TEFM can affect the translocation state of the EC (Figure 4H). Pyrophosphate binds only to ECs in which mtRNAP is in a pre-translocated conformation and drives reaction that is reverse to RNA synthesis. In the absence of TEFM, RNA was readily shortened by 2 nucleotides, suggesting pyrophosphorolytic activity of this EC (Figure 4H, lanes 3-7). In contrast, in the presence of TEFM the sensitivity of the EC was significantly decreased suggesting stabilization of the post-translocated state, consistent with our structural observations (Figure 4H, lanes 9-13).
Mapping of TEFM-mtRNAP interactions by cross-linking
Since interactions between mtRNAP and TEFM may involve structural elements that are mobile and thus only partially visible in the EC-TEFM structure, we set to map them using an array of cross-linking methods coupled with mass spectrometry, chemical mapping, and mutational analysis. We employed a long range cross-linker BS3 (bis(sulfosuccinimidyl)suberate, 11.4 Å), a medium range cross-linker DSG (disuccinimidyl glutarate, 7.7 Å), a short-range cross-linker p-benzoyl-phenylalanine (Bpa, <4 Å) and a “zero-length” cross-linker EDC (1-ethyl-3-(3-dimethylaminopropyl)carbodiimide) (Leitner et al., 2010; Morozov et al., 2015).
Mass spectrometry analysis of the long-range cross-links obtained with BS3 and DSG revealed proximity of the inter-domain linker (residues K144, K153 and K156) of TEFM (Figure 5A, S5A) to the specificity loop (residues K1087 and K1089) of mtRNAP - a structural element implicated in promoter specificity and formation of the RNA exit pore in single subunit RNAPs (Schwinghammer et al., 2013; Temiakov et al., 2000). We also detected a single interaction point between functionally important TEFM domains (CTD/linker) and mtRNAP (Figure 5A) using the EDC “zero-length” cross-linking, which relies on modification of D-K and E-K salt bridges (Rivera-Santiago et al., 2015). This interaction involves surface residue E214 (or E215) in TEFM and the exposed residue K1089 in the specificity loop of mtRNAP. To confirm these findings and to further map the interaction interface, we used the photo reactive amino acid Bpa incorporated into different positions within mtRNAP (Figure 5B, S5B). Consistent with the EDC cross-linking data, we found that substitution of residues V1088 and I1091 in the specificity loop of mtRNAP resulted in efficient cross-linking with TEFM (Figure 5B). In addition, we detected a strong cross-link (∼30%) to TEFM when Bpa was placed at position 610 in the intercalating hairpin of mtRNAP, in agreement with the structural data (Figure 5B, 4C). Both the specificity loop and the intercalating hairpin are found in close proximity to each other in the EC, and although the tip of the specificity loop is not fully resolved in the EC-TEFM structure, it can be confidently placed in proximity to TEFM based upon RNA-mtRNAP cross-linking data (Figure 5D) (Schwinghammer et al., 2013).
Figure 5. TEFM interactions revealed by cross-linking.
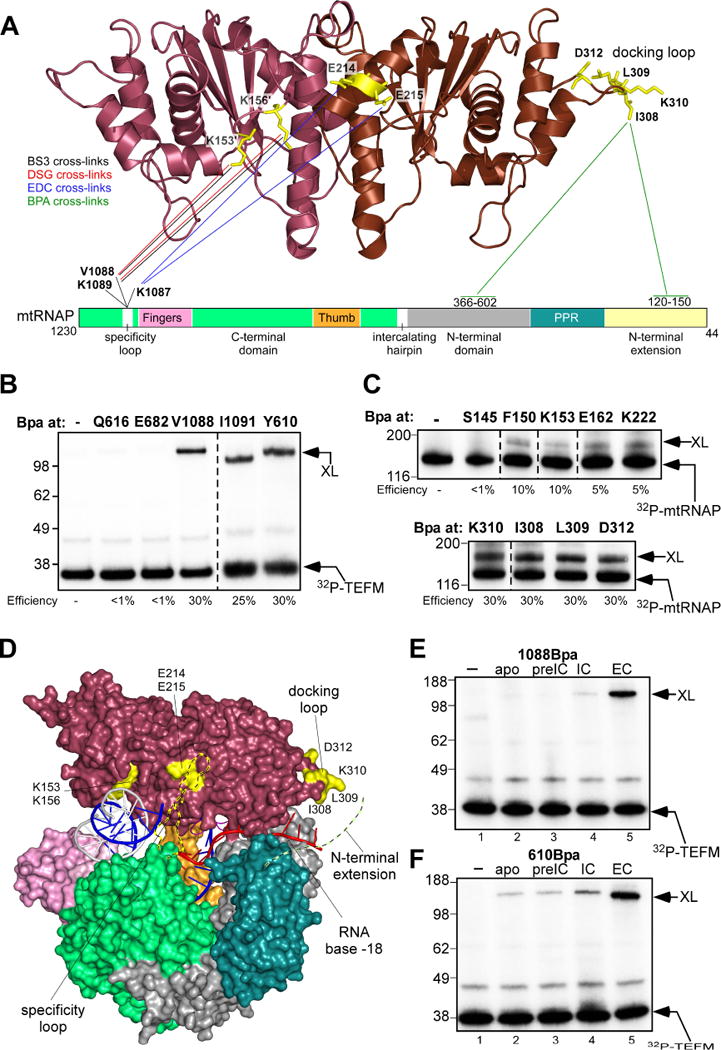
(A) Interaction regions in TEFM and mtRNAP revealed by chemical cross-linking and mass spectroscopy. The TEFM CTD is shown as a ribbon model; mtRNAP is depicted schematically as a bar with the major domains indicated as in Figure 4A. Cross-linked residues in TEFM are shown as sticks (yellow), lines represent the respective target residues/regions in mtRNAP. The colors of the lines indicate the cross-linking reagent used.
(B) TEFM interacts with the specificity loop and the intercalating hairpin of mtRNAP. The ECs were assembled using mtRNAP containing Bpa at the position indicated and 32P-labeled TEFM. The efficiency of cross-linking is indicated beneath the gel, size of molecular weight markers (kDa) is shown to the left of the gel.
(C) Bpa cross-link reveals interaction of the docking loop of TEFM with mtRNAP. The ECs were assembled using 32P-labeled mtRNAP and TEFM containing Bpa at positions indicated.
(D) Location of the mapped regions on EC-TEFM structure. Cross-linking sites on TEFM (surface representation) are highlighted in yellow, the specificity loop (modeled; ribbon view) of mtRNAP is shown in yelloworange. The N-terminal extension domain of mtRNAP implicated in cross-linking with the docking loop of TEFM is shown as a dash line (chartreuse). The RNA is extended by 9 nucleotides to indicate a probable RNA exit channel according to the RNA cross-linking data (Agaronyan et al., 2015; Schwinghammer et al., 2013).
(E,F) TEFM can efficiently cross-link only to the EC. Cross-linking was performed using 32P-labelled TEFM, 1088Bpa-mtRNAP (E) or 610Bpa-mtRNAP (F). The reaction mixtures contained mtRNAP (apo, lane 2), mtRNAP, TFAM and LSP (pre-initiation complex, lane 3), mtRNAP, TFAM, TFB2M and LSP (initiation complex, lane 4) or mtRNAP and RNA/DNA scaffold (EC, lane 5). The control reaction (lane 1) contained TEFM only. See also Figure S5, S6
To refine the interaction interface between mtRNAP and TEFM, we used a reciprocal approach and incorporated the Bpa probe into various positions in TEFM (Figure 5C, S5B,C). We detected efficient cross-linking when Bpa was positioned in an unstructured, solvent exposed loop (the “docking loop”, residues 305-315) at the distal end of the CTD dimer (Figure 5D). There, several TEFM Bpa variants (Bpa308, 309, 310, and 312) produced efficient (>30%) cross-linking to mtRNAP, suggesting an additional point of interaction between the two proteins (Figure 5A, C). We found that 308Bpa TEFM cross-links to two regions of mtRNAP that involve residues 120-150 in the N-terminal extension region of mtRNAP (65% of the cross-link) and residues 364-602, located in the palm subdomain, near to the PPR domain (35% of the crosslink) (Figure S6A-G).
Interestingly, the region 120-150 in mtRNAP (not present in the mtRNAP construct used to determine the EC-TEFM structure) constitutes the binding site for transcription initiation factor TFAM (Morozov et al., 2014), suggesting that binding of TEFM contributes to the transition from the initiation to the elongation phase of transcription. To demonstrate that TEFM binding is specific to the elongation phase of transcription, we assembled different transcription complexes - the pre-initiation complex, the initiation complex and the EC - using Bpa-modified mtRNAP variants (Figure 5E, F). Efficient cross-linking between mtRNAP and TEFM was only observed when the EC was formed (Figure 5E, F). In agreement with these data, analytical size exclusion chromatography demonstrated that TEFM does not efficiently bind to the initiation complex (Figure S5D, E). To conclude, the cross-linking data above corroborate the EC-TEFM structure and expand the comprehensive map of interactions between TEFM and mtRNAP during transcription elongation.
Mechanisms of transcription termination and anti-termination at CSBII
Human mtDNA encodes a G-rich sequence followed by an 8 bp “spacer” region and a 9 bp AU-rich region that precedes the termination point and constitutes the RNA-DNA hybrid in the EC (Figure 6A). CD spectroscopy experiments have confirmed that the G-rich region in RNA is sufficient to form a strong G-quadruplex structure (Wanrooij et al., 2012), which may fold into a parallel-stranded structure having three G-tetrad layers (Figure 6B) (Mukundan and Phan, 2013). The spacer region appears to be dispensable as it can be removed without affecting efficiency or site of termination (Figure 6C). However, when the AT-rich region in the CSBII sequence was changed to a GC-rich region, no termination was observed at the usual point, suggesting the importance of the weak RNA-DNA hybrid in transcription termination at CSBII. (Figure 6D). Instead, multiple points of termination downstream of the usual termination site were observed, all of which corresponded to the occurrence of U-stretches in the RNA (Figure 6D). This indicates that efficient termination at CSBII depends on the formation of a G-quadruplex at the point at which it is most disruptive to the EC (i.e. in proximity to the RNA-DNA hybrid). Termination at the G-quadruplex in human mitochondria is therefore reminiscent of transcription termination in bacteria and T7-like phages, where secondary structure in the RNA (hairpin) is thought to destabilize the EC and a U-stretch is required for its disruption (Epshtein et al., 2007; Gusarov and Nudler, 1999; Ma et al., 2005).
Figure 6. Mechanism of transcription termination at CSBII.

(A) Schematics of the RNA transcript encoded in the CSBII region in human mitochondria. The G-quadruplex region (G6AG8 variant) is highlighted in red, the points of termination are indicated by asterisks.
(B) Schematic depiction of a possible RNA G-quadruplex structure having a single nucleotide bulge.
(C) The spacer region of CSBII is dispensable for termination of transcription. Transcription assays were performed using promoter templates with the WT and mutated CSBII sequence, in which the spacer region was deleted.
(D) The U-run encoded in the CSBII region is required for transcription termination. The transcription assay was performed using the WT and modified CSBII sequence (GC≫AT), in which the AT-rich sequence proximal to the termination site was substituted to the GC-rich sequence.
(E) RNA G-quadruplex structure clashes with the specificity loop and intercalating loop of mtRNAP. The model is obtained by extending the RNA in mtRNAP EC with the 16 nucleotide-long G-quadruplex (PDB ID 2M4P). The G-quadruplex (red) is shown formed in vicinity of the trailing edge of transcription bubble in EC (surface representation). The specificity loop is modeled based on TEFM-mtRNAP Bpa cross-linking data.
(F) Structure of the anti-termination complex (surface representation). Coloring as in Figure 4A. See also Figure S7
The structure of the anti-termination complex combined with cross-linking and RNase foot-printing data suggests that TEFM binds near the RNA exit channel and “guides” the emerging transcript from the region of its separation from the DNA to the point where RNA reaches a length of about 18-20 nucleotides (Figure 2,3,4,6). TEFM interacts with two mobile elements in mtRNAP - the intercalating hairpin and the specificity loop (Figure 5B,D), which were shown to contribute critically to EC stability (Schwinghammer et al., 2013). Modeling of an RNA G-quadruplex into the EC structure suggests that this bulky secondary structure would clash with both the specificity loop and the intercalating hairpin (Figure 6E). This would likely result in displacement of these elements and pulling of RNA from the active site, thus causing dissociation of mtRNAP from the DNA (Figure 6E). In contrast, binding of TEFM to the intercalating hairpin and specificity loop occludes the space in the EC where formation of the G-quadruplex would have the most dramatic impact on the complex stability (Figure 6F). Interestingly, mtRNAP does not efficiently terminate at hairpin termination signals, such as bacterial TrpA and T7 terminator TΦ (Figure S6), possibly due to the relatively small size of these hairpins (∼23Å in diameter vs. ∼36 Å for the G-quadruplex), which may not be sufficient to disrupt mtRNAP elements at the point of termination (Figure 6E, F).
Discussion
The bipartite role of TEFM in transcription elongation and anti-termination
The structure of the anti-termination complex explains how TEFM increases the processivity of mtRNAP. First, TEFM enhances interaction of the EC with the downstream DNA, contributing to a sliding clamp, a characteristic feature of a processive polymerase. Second, TEFM sequesters the single-stranded portion of the non-template DNA strand, thus preventing collapse of the transcription bubble. Third, because of the binding of TEFM to the specificity loop and the intercalating hairpin, which contributes to the formation of the RNA exit channel, the anti-termination complexes possess a much higher stability and processivity, as required for syntheses of genome-size RNA transcripts. Finally, TEFM may stabilize the post-translocation state of the EC, which is known to enhance RNAP processivity by promoting forward translocation and preventing pausing and arrest of transcription complexes on various sequences (Herbert et al., 2010).
The G-rich sequence found in CSBII is predicted to form a G-quadruplex structure and is likely the major cause of EC destabilization leading to termination of RNA synthesis and primer formation for mtDNA replication. Two hypotheses involving the nature of the G-quadruplex in human mitochondria have been advanced – that formation of the quadruplex involves a hybrid between the NT DNA strand and the RNA and, alternatively, that the quadruplex involves only RNA (Wanrooij et al., 2012; Wanrooij et al., 2010). Analysis of the mtRNAP EC structure suggests that formation of the hybrid quadruplex structure is highly unlikely due to steric hindrance provided by mtRNAP, which separates the RNA from the DNA-RNA hybrid and diverts it away from the upstream DNA (Schwinghammer et al., 2013). Consistently, substitution of GMP to 7-deazaGMP (which disrupts G-quadruplex formation) in DNA does not affect termination at CSBII, suggesting that a RNA quadruplex is solely responsible for termination (Kuzmine et al., 2001; Wanrooij et al., 2012).
The efficiency of termination at CSBII has been demonstrated to depend upon the arrangement of the G residues in this region, which is highly polymorphic in the human mtDNA population. Thus, the more commonly occurring sequences - G6AG8 and G6AG7 (30% of the population) - exhibit significantly higher efficiency of termination as compared to the relatively rare G5AG8 and G5AG6 sequences (Kang et al., 2016; Tan et al., 2016). This suggests that the strength of the G-quadruplex is likely a primary contributor to the efficiency of transcription termination and thus to replication and maintenance of mtDNA copy number (Agaronyan et al., 2015). The more common G-quadruplex sequences in human mtDNA allow assembly similar to a three-layer G-quadruplex structure having a single nucleotide insertion (bulge) (Mukundan and Phan, 2013)(Figure 6B). This would result in a bulky structure forming inside the RNA exit channel of mtRNAP, likely causing disruption of the EC. Lack of termination of mtRNAP at hairpin terminators, at which a related T7 RNAP efficiently terminates, suggests that weaker secondary structures are tolerated by mtRNAP. This phenomenon may be attributed to the biological role of mtRNAP, which must transcribe through extensive secondary structures of ribosomal and transfer RNAs. The structure of the anti-termination complex reveals that TEFM binds at the junction between the RNA-DNA hybrid and the upstream DNA, near the RNA exit channel (Figure 4A, B). This is predicted to prevent formation of the G-quadruplex structure near the point of RNA separation from the RNA-DNA hybrid, the mtRNAP region that defines EC stability. Formation of the G-quadruplex past this point would not impose as dramatic an effect on EC stability and, as consequence, cause efficient termination (Figure 6D). The anti-termination mechanism for TEFM is thus reminiscent to that of the phage lambda protein N and bacterial transcription factor RapA, both of which bind at the RNA exit channel and prevent RNA hairpin formation within the bacterial RNAP EC (Gusarov and Nudler, 2001; Liu et al., 2015).
TEFM as a dedicated transcription factor
Since the TEFM CTD shows high structural similarity to RuvC-like resolvases, the question as to whether it possesses a nuclease activity may have significant bearings on the mechanism of replication in human mitochondria. Indeed, the closest structural homologs of TEFM, S.p. and S.c. Cce1, are functional resolvases (Doe et al., 2000; Lockshon et al., 1995). Yeast cells deficient in Cce1 exhibit a dramatic increase in mtDNA aggregation (Doe et al., 2000; Piskur, 1997). The crystal structure of the TEFM CTD dimer reveals two putative nuclease sites, which are similar in overall shape to the active sites of Cce1 (Figure 7A, B). S.p. Cce1 uses three negatively charged catalytic residues (D320, E117 and D46) to coordinate Mg ions required for nuclease activity (Ceschini et al., 2001). In TEFM, the two corresponding residues, D342 and E232, are preserved; however, the third catalytic residue is altered to valine (V174), which is conserved in TEFM from all species (Figure 7A,B). The structure suggests that this substitution renders TEFM unable to coordinate a Mg ion. Indeed, no electron density compatible with a bound divalent cation was observed in our structure even though crystallization conditions included 200 mM MgCl2. We therefore conclude that the nuclease sites in TEFM are degenerate and not functional. Indeed, considering that mammalian mitochondrial genomes are among the smallest, it is plausible that during evolution and transfer of many mitochondrial genes to the nucleus the resolvase function became non-essential for mtDNA maintenance. In contrast, preservation of a functional Holliday junction resolvase in yeast mitochondria is related to its essential function during replication, as the heritable mtDNA units in S. cerevisiae consist of genomes linked via recombination junctions (Doe et al., 2000; Lockshon et al., 1995). Although lacking nuclease activity, TEFM evolved to retain the ability of a Holliday junction resolvase to bind DNA, as the protein establishes simultaneous contacts with the RNA-DNA hybrid duplex and the downstream and upstream DNA regions of the transcription bubble (Figure 4A, B, D). These three duplexes of the EC are sharply bent relative to each other and resemble the topology of the DNA junctions, at which RuvC-like resolvases operate (Gorecka et al., 2013).
Figure 7. Target specificity of TEFM.
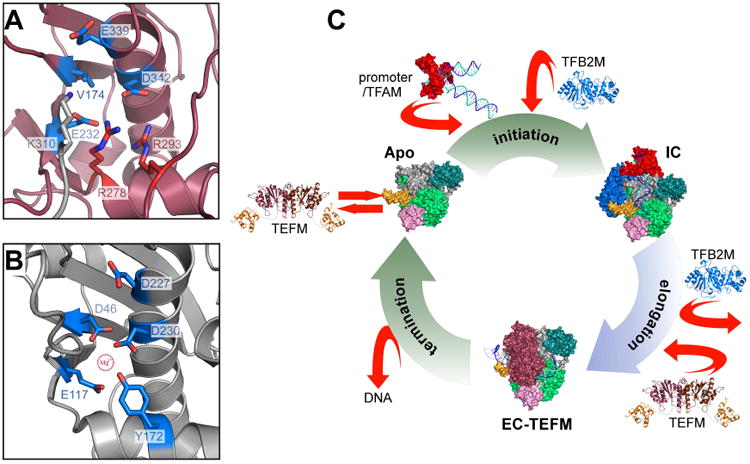
(A,B) TEFM is a pseudo-resolvase. Putative active sites of human TEFM (A) and fission yeast Holliday junction resolvase Cce1 (B) are shown in similar orientation (ribbon representation). One of the magnesium-coordinating residues involved in catalysis in Cce1, D46, is replaced by the conserved residue V174 in TEFM. Two arginine residues conserved in all TEFM (R278 and R293, red sticks) are engaged in salt bridges with E232 and D342, effectively neutralizing their negative charge required for metal ion binding. An additional positive charge is contributed by K310 from the docking loop of a crystallographically related TEFM molecule (grey).
(C) Schematics of the transcription cycle in human mitochondria. During initiation, mtRNAP is recruited to promoter by interactions with TFAM. Subsequent binding of TFB2M results in formation of the initiation complex. Transition to the elongation phase of transcription occurs upon release of TFB2M and recruitment of TEFM, required for processive elongation. At the end of the transcription cycle, mtRNAP dissociates from mtDNA, which triggers release of TEFM. Structures shown are of TFAM/LSP (PDB ID 3TMM (Ngo et al., 2011; Rubio-Cosials et al., 2011), the IC and the TFB2M models (Morozov et al., 2015), EC (PDB ID 4BOC) (Schwinghammer et al., 2013), EC-TEFM (this work) and apo mtRNAP (PDB ID 3SPA) (Ringel et al., 2011).
Target specificity of TEFM
Many transcription factors can recognize a particular conformation of RNAP allowing for transient regulation of its activity (Washburn and Gottesman, 2015). This is clearly the case for TEFM, as the cross-linking data and analytical gel filtration assay suggest that TEFM can efficiently bind to the EC, but not to the pre-initiation complex, initiation complex or the apo mtRNAP (Figure 7C, 5E, F). Our structural data provide an explanation for this observation. In the EC, the orientation of the two major structural elements of mtRNAP that bind TEFM - the intercalating hairpin and the specificity loop - are fixed by interactions with the DNA and RNA (Figure 4A, B). In contrast, in the apo mtRNAP structure, both loops are disordered (Ringel et al., 2011) and therefore cannot contribute to the efficient binding of TEFM (Figure 5E, F). In the pre-IC and the IC the intercalating hairpin and specificity loop are likely engaged in interactions with promoter DNA and may not be fully accessible to TEFM (Morozov et al., 2015). Once mtRNAP completes the transcription cycle and dissociates from mtDNA, TEFM can no longer bind to the mtRNAP efficiently, and dissociates prior to engagement of mtRNAP in transcription initiation (Figure 7C).
Our data on the mechanism of TEFM anti-termination activity, EC stabilization, mtRNAP processivity enhancement, and target specificity provide the molecular basis for the proposed role of TEFM in regulation of the switch between transcription and replication in human mitochondria (Agaronyan et al., 2015). Future experiments should be directed towards deciphering whether this regulation includes post-translational modifications of TEFM or changes in TEFM concentration in mitochondria by expression, degradation or other, yet unidentified factors.
Contact for Reagent and Resource Sharing
Further information and requests for resources and reagents should be directed to and will be fulfilled by the Lead Contact, Dmitry Temiakov (temiakdm@rowan.edu). A Material Transfer Agreement will be required to fulfill the requests.
Method Details
Protein expression and purification
Human mtRNAP (Δ119 and Δ150), WT TFAM, TFB2M (Δ20), WT TEFM, and Δ50 TEFM were expressed and purified as described previously (Agaronyan et al., 2015; Morozov et al., 2015; Sologub et al., 2009). Variants of these proteins were obtained by site-directed mutagenesis (QuikChange, Agilent) and purified as described previously (Morozov et al., 2015). TEFM NTD (residues 36-136) was purified using cation exchange chromatography on a MonoS column (GE Healthcare) followed by gel-filtration on a Superdex 200 10/300 column (GE Healthcare). Expression of Bpa-containing proteins was performed as described previously (Morozov et al., 2015). For expression of selenomethionine-labeled protein, expression cultures were grown in SeMet base media (Molecular Dimensions) with the addition of L-selenomethionine (50 μg/ml), L-lysine (50 μg/ml), L-threonine (50 μg/ml), L-phenylalanine (50 μg/ml), L-leucine (25 μg/ml), L-isoleucine (25 μg/ml) and L-valine (25 μg/ml). Selenomethionine-labeled TEFM was purified as described above.
Limited proteolysis of TEFM
TEFM was subjected to limitied proteolysis using trypsin (Sigma, protease/TEFM ratio 1: 20,000 w/w), ArgC protease (Promega, 1:1000 w/w), LysC protease (Sigma, 1:1000 w/w) for 1 h at RT. Products of protease digestion of TEFM were dissolved in a solution containing 5% acetonitrile and 0.1% tetrafluoroacetic acid and purified using C4 ZipTip. The peptide mixtures were analyzed using a Bruker MicroFlex MALDI-TOF instrument in sinapinic acid matrix with R=5000.
Crystallization of TEFM
Purified Δ50 TEFM (6.5 mg/ml) was treated with ArgC protease (Promega, 1:1000 w/w) and incubated for 60 min at room temperature (RT) prior to crystallization trials. Initial hits were obtained using the sitting drop vapor diffusion with a well solution containing 100 mM BIS-TRIS pH 5.5 – 6.5, 200 mM MgCl2 and 25% PEG3350. Large, diffraction-quality crystals were obtained by the hanging drop vapor diffusion method by micro-seeding with crushed crystals into fresh drops. Crystals appeared within 24 h and grew to full size over the course of two weeks. Crystals were cryo-protected by gradually increasing the glycerol concentration to 20% (v/v) and flash frozen in liquid nitrogen.
TEFM NTD (10 mg/ml) was crystallized using the sitting drop vapor diffusion method and Crystallization Screen solution 15 (Hampton Research) containing 30% PEG4000, 0.2 M ammonium acetate, 0.1 M sodium acetate (pH 4.0) to produce large (0.05 mm × 0.05 mm × 0.8 mm) needle-like crystals. The crystals were flash-frozen using a stabilization solution containing 30% PEG4000, 15% PEG400, 0.1 M ammonium acetate and 0.05 M sodium acetate pH 4.0.
Crystallization of the EC-TEFM complex
Synthetic DNA and RNA oligonucleotides (IDT DNA) NT25HH, TS22HH and RNA14mt were dissolved in H2O and mixed at a final concentration of 0.5 mM. The sequences of the oligos (IDTDNA) are as follows (5′ to 3′): GAACATGGTGTAATTATTTCGACGCCAGACGAAC (NT25HH), GTTCGTCTGGCGTGCGCGCCGCTACACCATGTTC (TS22HH) and AGUCUGCGGCGCGC (RNA14mt). The scaffold was annealed by heating the mixture to 95°C and step-wise cooling (1°C / 90 s) to 4°C. To form an EC/TEFM complex, Δ150 mtRNAP (45 μM) was mixed with a 1.1-fold molar excess of DNA/RNA scaffold and incubated at 20°C for 10 min prior to addition of a 2.2-fold molar excess Δ135 TEFM and further incubation at 20°C for 10 min. The complex was subsequently purified by size exclusion chromatography using a Superdex 200 Increase 3.2/300 column (GE Healthcare) equilibrated with buffer containing 10 mM Tris-HCl pH 8.0, 100 mM NaCl, 20 mM MgCl2, 10 mM DTT, 1 mM Tris(2-carboxyethyl)phosphine and 5 % (v/v) Glycerol. Peak fractions were pooled and used for crystallization. Crystals were obtained by the hanging-drop vapour diffusion method by mixing 2.5 μl of protein complex solution with 2.5 μl of reservoir solution containing 100 mM BIS-TRIS pH 5.5, 200 mM (NH4)2SO4, 6% PEG3350 and 0.5 μl of a seeding solution prepared from crystals previously obtained in an identical condition. Crystals appeared as thin blade clusters after 3-4 days. The clusters were carefully broken into individual blades and cryo-protected by gradually increasing the glycerol concentration in the drop to 25% (v/v) final prior to fishing and freezing in liquid nitrogen.
Structure determination, model building and refinement
Diffraction data for TEFM CTD and EC-TEFM complex crystals was collected at beamlines X06SA and X10SA at the Swiss Light Source (Villigen, CH) using a Pilatus 6M detector. Diffraction data for TEFM NTD crystals was collected at beamline P13 at the PETRA III storage ring operated by EMBL (DESY, Hamburg, Germany). Data were indexed and integrated using XDS and scaled using XSCALE (Kabsch, 2010). Anomalous substructure determination, phasing and density modification was performed using the hkl2map interface and SHELXC/D/E (Pape and Schneider, 2004; Sheldrick, 2008), as well as phenix.autosol (Adams et al., 2010). To obtain experimental phase information for the TEFM CTD crystals, multiple datasets from two isomorphous selenomethionine-containing crystals were merged using XSCALE and used for SAD phasing. Heavy atom sites identified by SHELXD were manually edited to remove weak occupancy sites and used as input in phenix.autosol for phasing and density modification. The obtained electron density map was of excellent quality and allowed for manual building of most of the four protein chains in the asymmetric unit (Figure S1 C). Refinement was carried out against the high-resolution native dataset using phenix.refine (Adams et al., 2010) and alternated with manual adjustment in Coot (Emsley et al., 2010) until a model with excellent stereochemistry was obtained. Experimental phase information for TEFM NTD crystals was obtained in a SAD experiment utilizing native sulfur atoms present in cysteine and methionine residues by collecting multiple highly redundant datasets from a single crystal at a wavelength of 2.066Å. Datasets were merged using XSCALE and substructure determination, phasing, density modification and phase extension was carried out with SHELXC/D/E. The resulting electron density map was readily interpretable and used for manual model building. The model was subjected to iterative rounds of refinement in phenix.refine against the high-resolution native dataset collected from the same crystal and manual model building in Coot until excellent stereochemistry and R-factors were achieved. The final mFo-DFc map displayed some unmodeled difference density between crystallographically related molecules, corresponding to unidentified solvent molecules.
The EC-TEFM structure was solved by molecular replacement in Phaser (McCoy et al., 2007) using the human mitochondrial transcription elongation complex (PDB ID: 4BOC) (Schwinghammer et al., 2013) and the TEFM CTD structure as search models. The resulting electron density was readily interpretable and used to rigid body fit domain movements in mtRNAP manually in Coot. The model was subsequently refined in phenix.refine alternated with manual adjustment in Coot, with secondary structure restraints and reference model restraints enabled until the late stages of refinement due to the low resolution of the data. We observed positive difference density corresponding to the previously unresolved single-stranded region of the non-template strand as well as for parts of the N-terminal extension of mtRNAP, which may be involved in forming crystal contacts, but refrained from de-novo modeling these regions due to the limited resolution. The unbiased Fo-Fc map for the non-template strand was calculated from a model that never contained a model for the non-template strand. The final model was refined to good stereochemistry and a free R factor of 27.6%.
Promoter templates for transcription assays
Templates for transcription anti-termination assays containing the LSP promoter and CSBII region were prepared by PCR amplification as described previously (Agaronyan et al., 2015). For the processivity assay, plasmid DNA (pT7blue) containing the LSP promoter region (-70/+70LSP_pT7blue) (Morozov et al., 2015) was linearized using the XhoI nuclease. The template was purified using phenol-chloroform extraction followed by ethanol precipitation. For termination assays, T7 phage terminator TΦ and bacterial terminator TrpA were cloned into LSP-containing plasmid (-70/+70LSP_pT7blue) 70 bp downstream of the transcription start site. For the halted complex assays and RNA foot-printing, a variant of the LSP-promoter template (“+35LSP”) with the initial transcribed sequence AAAGATAAAATTTGAAATGGTAGT TGTTTAAGTTGC was used.
Transcription assays
Standard transcription reactions were carried out using PCR-amplified DNA templates (50 nM), mtRNAP (50 nM), TFAM (50 nM), TFB2M (50 nM) in a transcription buffer containing 40 mM Tris-HCl pH=7.9, 10 mM MgCl2 and 10 mM DTT in the presence of ATP (0.3 mM), GTP (0.3 mM), UTP (0.01 mM) and 0.3 μCi[α-32P] UTP (800 Ci/mmol). Reactions were carried out at 35 °C for 60 min and stopped by addition of an equa l volume of 95 % formamide / 0.05 M EDTA. The products were resolved by 20% PAGE containing 6 M urea and visualized using a PhosphorImager (GE Healthcare). For the processivity assay, the reactions (10 μl) were stopped by addition of 190 μl of stop buffer containing 20 mM Tris-HCl pH 8.0, 150 mM NaCl, 20 mM EDTA, 1% SDS and 20 μg/ml proteinase K. After incubation at 55°C for 1 h the RNA products were extracted with a phenol/chlorophorm/isoamyl alcohol mixture followed by ethanol precipitation and resolved by 6% PAGE containing 6 M urea.
Nuclease foot-printing assays
For RNA foot-printing, ECs were halted 35 bp downstream of the promoter start site by omitting CTP from the transcription reaction and treated with RNase 1f (NEB) for 5 min at RT. For DNA foot-printing, the ECs were assembled using R14mt/TS36/NT36 scaffold, incubated for 14 min with TEFM at RT and treated with DNase I (NEB) for 5 min at RT. The sequences of the oligos (IDTDNA) are as follows (5′ to 3′): GGGCTTAGTTCGTCTGGCGTGCGCGCCGCTACAC CATGTTTGCTGACC (TS26), GGTCAGCAAACATGGTGTAAGTATTACGACGCCAGAC GAACTAAGCCC (NT26A). The reactions were stopped by addition of an equal volume of 95 % formamide/0.05 M EDTA and resolved by 20% PAGE containing 6 M urea.
Cross-linking using photo reactive amino acid (Bpa)
The ECs (0.5 μM) were assembled using R14mt/TS2/NT2 scaffold (Schwinghammer et al., 2013) and mtRNAP. TEFM (1 μM) was added to the EC and incubated for 15 min at RT. The cross-linking was activated by UV irradiation at 312 nm for 30 min at RT.
Mapping of TEFM-mtRNAP interaction using BS3 and EDC
The EC/TEFM complex was assembled by incubating Δ150mtRNAP (10 - 20 μM) with a 2.5-fold molar excess of WT TEFM and a 1.3-fold molar excess of RNA14HH/NT19HH/TS16HH scaffold for 10 min at 20°C. The sequence of the oligos (IDT DNA) is as follows (5′ to 3′): UGAUGGUAAUGCUCCUGUCGUGAUC (RNA14HH), CATGGGGTAACTAGTTCGACGCCA GACG (NT19HH), CGTCTGGCGTGATCACGACTACCCCATG (TS16HH). The complex was subsequently purified by size exclusion chromatography using a Superdex 200 Increase 3.2/300 column (GE Healthcare) equilibrated with buffer containing 20 mM HEPES pH 8.0 for BS3 or pH 7.5 for EDC, 100 mM NaCl, 20 mM MgCl2, and 0.5 mM Tris(2-carboxyethyl)phosphine. The purified complexes (∼2 μM) were then incubated with a 150 to 470-fold molar excess of BS3 (Thermo Fisher) for 30 min at 30°C or with 2500 to 15000-fold molar excess of EDC (Thermo Fisher) in the presence of 1 mM N-hydroxy-sulfosuccinimide for 60 min at 23°C. The reactions were quenched by the addition of 200 mM (NH4)2HCO3 followed by incubation for 5 min on ice. The products of the reaction were resolved using 4 - 12% SDS-PAGE (Invitrogen) and the cross-linked species excised and in-gel digested with trypsin. The tryptic peptides were extracted, dried and reconstituted in solution containing 5% v/v acetonitril and 0.1 % v/v FA and subjected to liquid chromatography-tandem mass spectrometry (LC-MS/MS). The separated peptides were analyzed online on a Q-Exactive HF mass spectrometer (Thermo Scientific). The raw data of LC-MS/MS analysis were converted to Mascot generic format files with Proteome Discoverer 2.0.0.802 software (Thermo Scientific) and searched against a protein database by pLink 1.22 software (Yang et al., 2012) as described in (Pleiner et al., 2015). The results were obtained with 1% false discovery rate followed by manual validation and removal of all tandem spectra that did not show confident sequence coverage of both cross-linked peptides.
Mapping of TEFM-mtRNAP interactions using DSG
To map the TEFM binding site, EC-TEFM complex (5 μM in 40 mM Na-HEPES pH 7.5) was treated with a mixture of DSG/[2H4]-DSG (0.6 mM DMSO solution, ProteoChem) and the products of the reaction separated using 7% Tris-glycine SDS PAGE. The cross-linked species were excised from the gel and subjected to trypsin digestion in 100 mM NH4HCO3 buffer overnight at 37°C. The products of the digestion r eaction were extracted from the gel with CH3CN-0.1% TFA in water (9:1), dried in vacuum, re-dissolved in 10 mg/ml CHCA matrix in CH3CN-0.1% TFA in water (1:1), and the resulting solution applied on target for MALDI-TOF mass spectrometry. Mass spectra were taken on a MicroFlex LRF spectrometer (Bruker). Positively charged ions (M+H+) were analyzed in the reflector mode (m/z 1000 to 4000) and cross-linked peptides identified using xBobcat mass matching search engine (http://prottools.ethz.ch/orinner/public/htdocs/xquest/index_review.html) (Rinner et al., 2008).
Mapping of the Bpa-TEFM cross-link site in mtRNAP
For mapping with the HRV 3C protease (Pierce), the ECs were assembled using D119 mtRNAPs with engineered 3C cleavage sites (LEVLFQGP): 3C-PPR mtRNAP (substitution of residues 358-364, cleaved at Q363), 3C-thumb mtRNAP (insertion after residue H745, cleaved at Q751) and 3C-lever-loop mtRNAP (insertion after residue K596, cleaved at Q602). All these mtRNAP variants also contained an engineered protein kinase (PKA) site at the N-terminus (MGHHHHHHRRASV…) (Morozov et al., 2015). Upon UV irradiation, the ECs (0.5 μM) were incubated with 3C protease (1:1 w/w ratio) for 15 - 25 h at 4 °C and the products of the reaction resolved using 4 - 12% SDS PAGE (Invitrogen). NTCB mapping of the TEFM sites in mtRNAP was performed as described in (Morozov et al., 2015). The TEFM-mtRNAP cross-link was excised from the gel, eluted with 0.2% SDS for 1 h at 4 °C and precipitated with 80% acetone. The dried material was dissolved in a solution containing 0.2% SDS prior to the NTCB treatment. Hydroxylamine (NH2OH) cleavage was performed as in (Sologub et al., 2009) with modifications using a variant of Δ43 mtRNAP having an NG pair (hydroxylamine cleavage site) at position 150 and an engineered PKA site (Morozov et al., 2014). Specifically, 2 - 10 ml of the cross-linked material was lyophilized, dissolved in 30 ml of a solution containing 2 M NH2OH, 0.2 M Na2CO3 and 4 M Guanidine (pH 10-11.5 adjusted with 50% NaOH), and incubated for 4 h at 43°C. The reaction was stopped by addition of 70 μl of H2O and 400 ml of acetone, the products precipitated for 30 min at -70 °C, re-suspended in SDS gel loading buffer and resolved in 4 - 12% SDS-PAGE (Invitrogen).
Pyrophosphorolytic assay
The ECs (250 μM) were assembled using 32P-labeled RNA10, TS1 and NT1 for 10 min at RT in the presence or absence of TEFM (500 μM). The sequence of the oligos (IDTDNA) is as follows (5′ to 3′): CUGCGCGCAU (RNA10), GGGTCCTGTCTGAAATCGACATCGCCGC (TS1) and CGATTTCAGACAGGACCC (NT1). The reactions were incubated with pyrophosphate (50-500 μM) for 30 min at RT and stopped by the addition of formamide / EDTA containing buffer. The samples were resolved by electrophoresis in 20% PAGE in the presence of 6 M urea and visualized by PhosphoImager.
Analytical size-exclusion chromatography
The mitochondrial initiation complex was assembled by incubating Δ119 mtRNAP (20 μM) with the LSP promoter template (NT_LSP, TS_LSP) (20 μM), Δ42 “cys-less” TFAM (20 μM) and Δ20 TFB2M (40 μM) for 10 min at 20°C. The sequence of the oligos (IDTDNA) is as follows (5′ to 3′): TGTTAGTTGGGGGGTGACTGTTAAAAGTGCATACCTATCCCCGATAGGCC (NT_LSP) and GGCCTATCTTTTGGCGGTATGCACTTTTAACAGTCACCCCCCAACTAACA (TS_LSP). To analyze binding of TEFM, WT TEFM (60 μM) was added to the initiation complex and incubated for 10 min at 20°C. Gel-filtration was performed us ing a Superdex 200 Increase 3.2/300 size exclusion column (GE Healthcare) equilibrated with buffer containing 20 mM Tris-HCl pH 8.0, 100 mM NaCl, 20 mM MgCl2, and 2 mM DTT. For the dimer mutant analysis, the ECs (20 μM) were assembled using RNA14HH/TS22HH/NT25HH scaffold (1.1-fold molar excess) for 10 min at 20°C. After incubation, the ECs were mixed with 2.2-fold molar excess of WT TEFM or TEFM mutant (F244E L248D I252D M256S L260D) and incubated for 10 min at 20°C. Gel-filtration was performed using a Superdex 200 Increase 3.2/300 size exclusion column (GE Healthcare) equilibrated with buffer containing 20 mM Tris-HCl pH 8.0, 200 mM NaCl, 20 mM MgCl2, 10 mM DTT and 1 mM Tris(2-carboxyethyl)phosphine.
Data Availability
Atomic coordinates and structure factors for crystal structures of TEFM NTD, TEFM CTD and EC-TEFM complex have been deposited in the Protein Data Bank under ID codes 5OL9, 5OL8 and 5OLA.
Supplementary Material
(A) Limited proteolysis of TEFM. Top panel. Cleavage of TEFM with proteases occurs in the inter-domain linker. Lower panel. Schematics of cleavage in the inter-domain linker of TEFM as determined by mass spectrometry.
(B) Schematic representation of secondary structure elements in TEFM. Alpha-helices are shown as cylinders, β-sheets as arrows. Important structural features are indicated. Coloring as in Figure 1A.
(C) Structure determination of the TEFM CTD. Top. Ribbon representation of the structure of the TEFM CTD with one monomer colored in raspberry and the other in chocolate. Secondary structure elements are indicated. Methionine residues substituted with selenomethionine in the crystals used for phasing are indicated and shown as sticks. An anomalous difference Fourier map calculated using the dataset used for phasing is shown as mesh at 5 σ in yellow. Bottom. The unbiased experimental electron density used for building the initial model is shown as mesh (marine blue) at 1 σ around representative regions shown as sticks (sheets β1, β2, β3 and the dimerization interface composed of a10 from each monomer).
(D) Structure determination of the TEFM NTD. Left. Ribbon representation of the structure of the TEFM NTD colored in orange. Secondary structure elements are indicated. Sulphur-containing residues M116 and C130 are indicated and shown as sticks and an anomalous difference Fourier map calculated using the dataset used for phasing is shown as mesh at 5 σ in pink. Right. Unbiased experimental electron density used for building initial model is shown as marine blue mesh at 1 σ around representative helix α5.
(A) TEFM lacking the NTD domain protects 19-20 nt of RNA from RNase 1 cleavage in the anti-termination complex. The ECs were halted 35 bp downstream of the LSP promoter in the presence of WT or Δ135 TEFM and treated with RNase 1 for 5 min at RT.
(B) TEFM lacking the NTD domain and the inter-domain linker does not protect RNA from RNase 1 cleavage. The experimental conditions were as described above.
(C) TEFM lacking the NTD domain protects the downstream and the upstream DNA in the EC. The EC was assembled using R14/TS26/NT26 scaffold in the absence of TEFM or in the presence of WT or Δ135 TEFM prior to DNase I treatment for 5 min at RT.
(D) TEFM lacking the NTD domain and the inter-domain linker leaves no clear footprint in the DNAse I protection assay. The experimental conditions were as described above.
(A) Close-up view of the dimerization interface of TEFM. Coloring and representation as in Figure 1B. The α10 helix of each monomer is highlighted, with the rest of the protein shown transparently. Hydrophobic residues forming the dimerization interface that were subjected to mutagenesis are shown as sticks.
(B) Mutation of the TEFM residues contributing to the dimerization interface results in a monomeric form of TEFM that cannot bind EC. Upper panel: A monomeric TEFM mutant (Δ35TEFM F244E L248D I252D M256S L260D) was purified and used for analytical size exclusion experiments. The mutant TEFM elutes as a monomer (blue), while the WT TEFM elutes as a dimer (red). Middle panel: Incubation of the EC with WT TEFM leads to a distinct shift of the peak representing the EC, indicating formation of a stoichiometric complex (2:1 TEFM:EC). In contrast, incubation of the EC with the monomeric TEFM mutant does not lead to a change in retention volume as compared to the individual components (Lower panel).
(C) The monomeric TEFM mutant does not prevent termination at CSBII. Transcription assays were performed using the PCR template containing LSP and the CSBII region. The control reaction (lane 1) contains no TEFM. The reaction products were resolved using 20% PAGE containing 6M Urea.
(A) Surface charge distribution in TEFM. Surface charge analysis of TEFM reveals an extensive positively charged surface facing the nucleic acid scaffold in the EC-TEFM complex. (MtRNAP is not shown). (Blue: positive charge; red: negative charge). DNA is shown in cartoon view with coloring as in Figure 4A. Vacuum electrostatic potential was calculated with Pymol.
(B) TEFM interactions with the downstream DNA contribute to the formation of a “sliding clamp”. TEFM (raspberry) and mtRNAP (grey) are shown in surface representation.
(C) Electron density for nucleic acids in the anti-termination complex. The final model of the non-template DNA, template DNA and RNA is shown as sticks in cyan, blue and red, respectively. The TEFM CTD is shown as surface representation in raspberry. The 2mFo-DFc electron density for the nucleic acid included in the model is shown as grey mesh at 1 σ. An unbiased mFo-DFc map for the region corresponding to the single-stranded portion of the non-template strand (not modeled) is shown as green mesh at 3 σ. The expected trajectory of the missing non-template bases is indicated by a dashed line.
(D) Comparison of mtRNAP structure in the EC and the anti-termination complex. The structure of mtRNAP in the anti-termination complex is shown as ribbon representation with subdomains colored as in Figure 4A. The structure of the EC (PDB ID 4BOC) was superimposed using the C-terminal catalytic domain (residues 643-1230) and is shown in identical coloring at 50% opacity. Arrows indicate movements necessary to transform from the EC to the anti-termination conformation. While the palm and thumb subdomains assume identical positions, the fingers domain is rotated in the post-translocated anti-termination complex to a conformation analogous to the one observed in the T7 post-translocated state (Temiakov et al., 2004). In addition, the NTD and PPR domains of mtRNAP adopt a more open conformation in the anti-termination complex than in the EC.
(A) List of peptides representing intra-protein cross-links between mtRNAP and TEFM detected by BS3 (black), EDC (blue) and DSG (red).
(B) List of pBpa-substitions made in mtRNAP and TEFM with their respective cross-linking efficiencies.
(C) Anti-termination activity of various TEFM mutants.
(D, E) TEFM does not bind to the initiation complex. Elution profile (D) and SDS-PAGE (E) of analytical size-exclusion chromatography of the initiation complex (LSP/mtRNAP/TFAM/TFB2M) in the presence of TEFM. Fractions analyzed by SDS-PAGE are indicated as colored bars in the chromatogram and below the SDS gel.
(A) The docking loop of TEFM cross-links to two distinct sites in mtRNAP. Cross-linking was performed using a 32P-labeled Bpa308 TEFM variant and mtRNAP having an engineered cleavage site for 3C protease introduced into the proline-rich linker domain (cleavage after residue 363). The cleavage reaction revealed that the majority of the cross-link to the 308BpaTEFM (∼65%) is located to the N-terminus of the 3C site, i.e. in the N-terminal extension region/PPR domain of mtRNAP (residues 120-364).
(B) Fine mapping of the N-terminal cross-linking site in mtRNAP. Cross-linking was performed using Bpa308 TEFM and 32P-labeled Δ119 mtRNAP. Upon cross-linking, the radioactive species were separated using 6% SDS PAGE. MtRNAP-TEFM cross-link and mtRNAP were excised from the gel, eluted and subjected to cleavage by NTCB (cuts at Cys residues). The products of the reaction were resolved using 4-12% PAGE (Invitrogen). N-terminal cleavage pattern is observed for mtRNAP (lanes 1,2); the identity of every band representing labeled peptide was verified using the molecular weight standards (Mark 12, Invitrogen). Cleavage of the mtRNAP-TEFM cross-link results in appearance of adducts (indicated by the blue arrows), that are a TEFM mass (∼37 kDa) larger than the corresponding peptides observed for mtRNAP. The cleavage pattern of the cross-link (lanes 3,4) is consistent with the location of the N-terminal cross-link between residues 120-178 in mtRNAP. Blue numbers (left side of the gel) represent apparent molecular weights of the three most N-terminal mtRNAP peptides involved in TEFM cross-linking; blue numbers to the right are molecular weights of the corresponding adducts. Note that the large molecular weight C-terminal cross-linked species are not resolved in this gel.
(C) Fine mapping of the TEFM-mtRNAP NTD cross-link. The cross-linking was performed using a Bpa308 TEFM variant and 32P-labeled Δ44 mtRNAP (mature mtRNAP) with an engineered hydroxylamine cleavage site (NG) at residue 150. Upon the cleavage reaction, appearance of the labelled species (∼55 kDa) corresponding to TEFM cross-linked to the region 44-150 in the NTD of mtRNAP was observed. Taken together with the data obtained in the NTCB experiment above, this suggests that TEFM interacts with the region 120-150 in the mtRNAP NTD. Note that the C-terminal cross-link is not visible in this experiment as the labelling of mtRNAP is due to the engineered PKA site at the N-terminus of mtRNAP.
(D) Schematic illustration of the variants of mtRNAP used in experiments shown in Panel A-C. The red rectangle indicates the N-terminal cross-link to 32P-labeled TEFM (or 32P-labeled mtRNAP to TEFM); the yellow rectangle represents the C-terminal mtRNAP cross-link due to 32P-labeled TEFM.
(E) TEFM does not efficiently cross-link to Δ150 mtRNAP. Cross-linking was performed using a32P-labeled Bpa308 TEFM variant and Δ119 (lane 1) or Δ 150 (lane 2) mtRNAP.
(F) Mapping of the C-terminal cross-linking site in mtRNAP. Cross-linking was performed using a 32P-labeled Bpa308 TEFM variant and mtRNAPs with an engineered cleavage site for the 3C protease introduced into the thumb domain (cleavage after residue 751, lanes 1,2) or into the lever loop (cleavage after residue 602, lanes 3,4). The identified cross-linked adducts are indicated by black arrows. Grey arrows mark the expected position of the cross-linked species that correspond to the minor (< 5-10%) cross-linking sites. Cleavage of 3C-751-mtRNAP results in appearance of a single band, representing the region 120-751 of mtRNAP. Cleavage of 3C-602-mtRNAP results in appearance of a band, which represents the region 120-602 of mtRNAP. These data, taken together with the data suggesting the location of the C-terminal cross-linking site between residues 365-1230 (panel A), indicate the location of the C-terminal crosslink in region 364-602 of mtRNAP.
(G) Schematic illustration of the variants of mtRNAP used in experiments shown in Panel A and F. The red rectangle indicates the N-terminal cross-link to 32P-labeled TEFM; the yellow rectangle represents the C-terminal mtRNAP cross-link due to 32P-labeled TEFM.
(A) Transcription assay performed using a PCR template containing the LSP promoter (lane1) and the LSP promoter and TrpA terminator (lane 2). The position of the expected termination product is indicated with the black arrow; efficiency of termination at this point is indicated beneath the gel.
(B) Transcription assay performed using a PCR template containing the LSP promoter (lane1) and the LSP promoter and TΦ terminator (lane 2). The position of the expected termination product is indicated with the black arrow; efficiency of termination at this point is indicated beneath the gel.
Highlights.
- Structure of human TEFM reveals a pseudo-nuclease core with two globular HhH-domains
- TEFM binding to the elongation complex of mtRNAP forms a ‘sliding clamp’
- Sliding clamp dramatically increases processivity of the elongation complex
- TEFM prevents G-quadruplex formation, driving transcription over mtDNA replication
Acknowledgments
We thank past and present members of the Cramer laboratory, in particular Gaurika Garg and Jürgen Wrawzinek. We thank the staff at the Swiss Light Source beamline X06SA and at the PETRA III storage ring at DESY Hamburg, in particular Micele Cianci for assistance during diffraction data collection. We thank Dr W.T. McAllister and Dr M. Gottesman for critical reading of the manuscript and helpful discussion. Part of this work was performed at Beamlines X06SA and X10SA at the Swiss Light Source at the Paul-Scherrer-Institut, Villigen, Switzerland, and at PETRA-III, DESY Hamburg, Germany.
Funding: NIH RO1 GM104231 and R01 GM118941 (D.T.), Deutsche Forschungsgemeinschaft (SFB860), European Research Council (Advanced Grant TRANSREGULON), and the Volkswagen Foundation (P.C.), Deutsche Forschungsgemeinschaft SFB860 (H.U.). H.S.H was supported by a Boehringer Ingelheim Fonds PhD student fellowship.
Footnotes
Contributions: H.S.H. purified proteins, prepared crystals, solved structures and performed BS3 and EDC cross-linking and analytical size-exclusion chromatography. A.P. and J.J.G. made and purified TEFM mutants, performed Bpa cross-linking and mapping. K.A. and Y.I.M. isolated TEFM mutants, performed functional assays, made and analyzed DSG cross-links. K.S. performed cloning and established initial purification of TEFM. A.C. and H.U. performed mass-spectrometric analysis of cross-linked complexes. D.T. purified proteins, performed foot-printing, and prepared TEFM NTD crystals. H.S.H., A.P., K.A., M.A., Y.I.M., P.C. and D.T. analyzed the data, and H.S.H., M.A., P.C. and D.T. wrote the manuscript.
Publisher's Disclaimer: This is a PDF file of an unedited manuscript that has been accepted for publication. As a service to our customers we are providing this early version of the manuscript. The manuscript will undergo copyediting, typesetting, and review of the resulting proof before it is published in its final citable form. Please note that during the production process errors may be discovered which could affect the content, and all legal disclaimers that apply to the journal pertain.
References
- Adams PD, Afonine PV, Bunkoczi G, Chen VB, Davis IW, Echols N, Headd JJ, Hung LW, Kapral GJ, Grosse-Kunstleve RW, et al. PHENIX: a comprehensive Python-based system for macromolecular structure solution. Acta Crystallogr D Biol Crystallogr. 2010;66:213–221. doi: 10.1107/S0907444909052925. [DOI] [PMC free article] [PubMed] [Google Scholar]
- Agaronyan K, Morozov YI, Anikin M, Temiakov D. Replication-transcription switch in human mitochondria. Science. 2015;347:548–551. doi: 10.1126/science.aaa0986. [DOI] [PMC free article] [PubMed] [Google Scholar]
- Ariyoshi M, Vassylyev DG, Iwasaki H, Nakamura H, Shinagawa H, Morikawa K. Atomic structure of the RuvC resolvase: a holliday junction-specific endonuclease from E. coli. Cell. 1994;78:1063–1072. doi: 10.1016/0092-8674(94)90280-1. [DOI] [PubMed] [Google Scholar]
- Asin-Cayuela J, Gustafsson CM. Mitochondrial transcription and its regulation in mammalian cells. Trends in biochemical sciences. 2007;32:111–117. doi: 10.1016/j.tibs.2007.01.003. [DOI] [PubMed] [Google Scholar]
- Ceschini S, Keeley A, McAlister MS, Oram M, Phelan J, Pearl LH, Tsaneva IR, Barrett TE. Crystal structure of the fission yeast mitochondrial Holliday junction resolvase Ydc2. Embo J. 2001;20:6601–6611. doi: 10.1093/emboj/20.23.6601. [DOI] [PMC free article] [PubMed] [Google Scholar]
- Chang DD, Clayton DA. Priming of human mitochondrial DNA replication occurs at the light-strand promoter. Proceedings of the National Academy of Sciences of the United States of America. 1985;82:351–355. doi: 10.1073/pnas.82.2.351. [DOI] [PMC free article] [PubMed] [Google Scholar]
- Close D, Johnson SJ, Sdano MA, McDonald SM, Robinson H, Formosa T, Hill CP. Crystal structures of the S. cerevisiae Spt6 core and C-terminal tandem SH2 domain. Journal of molecular biology. 2011;408:697–713. doi: 10.1016/j.jmb.2011.03.002. [DOI] [PMC free article] [PubMed] [Google Scholar]
- Doe CL, Osman F, Dixon J, Whitby MC. The Holliday junction resolvase SpCCE1 prevents mitochondrial DNA aggregation in Schizosaccharomyces pombe. Mol Gen Genet. 2000;263:889–897. doi: 10.1007/s004380000256. [DOI] [PubMed] [Google Scholar]
- Dong A, Xu X, Edwards AM, Midwest Center for Structural, G., Structural Genomics, C. Chang C, Chruszcz M, Cuff M, Cymborowski M, Di Leo R, et al. In situ proteolysis for protein crystallization and structure determination. Nature methods. 2007;4:1019–1021. doi: 10.1038/nmeth1118. [DOI] [PMC free article] [PubMed] [Google Scholar]
- Emsley P, Lohkamp B, Scott WG, Cowtan K. Features and development of Coot. Acta Crystallogr D Biol Crystallogr. 2010;66:486–501. doi: 10.1107/S0907444910007493. [DOI] [PMC free article] [PubMed] [Google Scholar]
- Epshtein V, Cardinale CJ, Ruckenstein AE, Borukhov S, Nudler E. An allosteric path to transcription termination. Molecular cell. 2007;28:991–1001. doi: 10.1016/j.molcel.2007.10.011. [DOI] [PubMed] [Google Scholar]
- Gorecka KM, Komorowska W, Nowotny M. Crystal structure of RuvC resolvase in complex with Holliday junction substrate. Nucleic acids research. 2013;41:9945–9955. doi: 10.1093/nar/gkt769. [DOI] [PMC free article] [PubMed] [Google Scholar]
- Gusarov I, Nudler E. The mechanism of intrinsic transcription termination. Molecular cell. 1999;3:495–504. doi: 10.1016/s1097-2765(00)80477-3. [DOI] [PubMed] [Google Scholar]
- Gusarov I, Nudler E. Control of intrinsic transcription termination by N and NusA: the basic mechanisms. Cell. 2001;107:437–449. doi: 10.1016/s0092-8674(01)00582-7. [DOI] [PubMed] [Google Scholar]
- Gustafsson CM, Falkenberg M, Larsson NG. Maintenance and Expression of Mammalian Mitochondrial DNA. Annual review of biochemistry. 2016;85:133–160. doi: 10.1146/annurev-biochem-060815-014402. [DOI] [PubMed] [Google Scholar]
- Herbert KM, Zhou J, Mooney RA, Porta AL, Landick R, Block SM. E. coli NusG inhibits backtracking and accelerates pause-free transcription by promoting forward translocation of RNA polymerase. Journal of molecular biology. 2010;399:17–30. doi: 10.1016/j.jmb.2010.03.051. [DOI] [PMC free article] [PubMed] [Google Scholar]
- Johnson SJ, Close D, Robinson H, Vallet-Gely I, Dove SL, Hill CP. Crystal structure and RNA binding of the Tex protein from Pseudomonas aeruginosa. Journal of molecular biology. 2008;377:1460–1473. doi: 10.1016/j.jmb.2008.01.096. [DOI] [PMC free article] [PubMed] [Google Scholar]
- Kabsch W. Integration, scaling, space-group assignment and post-refinement. Acta Crystallogr D Biol Crystallogr. 2010;66:133–144. doi: 10.1107/S0907444909047374. [DOI] [PMC free article] [PubMed] [Google Scholar]
- Kang E, Wu J, Gutierrez NM, Koski A, Tippner-Hedges R, Agaronyan K, Platero-Luengo A, Martinez-Redondo P, Ma H, Lee Y, et al. Mitochondrial replacement in human oocytes carrying pathogenic mitochondrial DNA mutations. Nature. 2016;540:270–275. doi: 10.1038/nature20592. [DOI] [PubMed] [Google Scholar]
- Kuzmine I, Gottlieb PA, Martin CT. Structure in nascent RNA leads to termination of slippage transcription by T7 RNA polymerase. Nucleic acids research. 2001;29:2601–2606. doi: 10.1093/nar/29.12.2601. [DOI] [PMC free article] [PubMed] [Google Scholar]
- Leitner A, Walzthoeni T, Kahraman A, Herzog F, Rinner O, Beck M, Aebersold R. Probing native protein structures by chemical cross-linking, mass spectrometry, and bioinformatics. Molecular & cellular proteomics : MCP. 2010;9:1634–1649. doi: 10.1074/mcp.R000001-MCP201. [DOI] [PMC free article] [PubMed] [Google Scholar]
- Liu B, Zuo Y, Steitz TA. Structural basis for transcription reactivation by RapA. Proceedings of the National Academy of Sciences of the United States of America. 2015;112:2006–2010. doi: 10.1073/pnas.1417152112. [DOI] [PMC free article] [PubMed] [Google Scholar]
- Lockshon D, Zweifel SG, Freeman-Cook LL, Lorimer HE, Brewer BJ, Fangman WL. A role for recombination junctions in the segregation of mitochondrial DNA in yeast. Cell. 1995;81:947–955. doi: 10.1016/0092-8674(95)90014-4. [DOI] [PubMed] [Google Scholar]
- Ma K, Temiakov D, Anikin M, McAllister WT. Probing conformational changes in T7 RNA polymerase during initiation and termination by using engineered disulfide linkages. Proceedings of the National Academy of Sciences of the United States of America. 2005;102:17612–17617. doi: 10.1073/pnas.0508865102. [DOI] [PMC free article] [PubMed] [Google Scholar]
- McCoy AJ, Grosse-Kunstleve RW, Adams PD, Winn MD, Storoni LC, Read RJ. Phaser crystallographic software. J Appl Crystallogr. 2007;40:658–674. doi: 10.1107/S0021889807021206. [DOI] [PMC free article] [PubMed] [Google Scholar]
- Minczuk M, He J, Duch AM, Ettema TJ, Chlebowski A, Dzionek K, Nijtmans LG, Huynen MA, Holt IJ. TEFM (c17orf42) is necessary for transcription of human mtDNA. Nucleic acids research. 2011;39:4284–4299. doi: 10.1093/nar/gkq1224. [DOI] [PMC free article] [PubMed] [Google Scholar]
- Morozov YI, Agaronyan K, Cheung AC, Anikin M, Cramer P, Temiakov D. A novel intermediate in transcription initiation by human mitochondrial RNA polymerase. Nucleic acids research. 2014;42:3884–3893. doi: 10.1093/nar/gkt1356. [DOI] [PMC free article] [PubMed] [Google Scholar]
- Morozov YI, Parshin AV, Agaronyan K, Cheung AC, Anikin M, Cramer P, Temiakov D. A model for transcription initiation in human mitochondria. Nucleic acids research. 2015;43:3726–3735. doi: 10.1093/nar/gkv235. [DOI] [PMC free article] [PubMed] [Google Scholar]
- Mukundan VT, Phan AT. Bulges in G-quadruplexes: broadening the definition of G-quadruplex-forming sequences. J Am Chem Soc. 2013;135:5017–5028. doi: 10.1021/ja310251r. [DOI] [PubMed] [Google Scholar]
- Ngo HB, Kaiser JT, Chan DC. The mitochondrial transcription and packaging factor Tfam imposes a U-turn on mitochondrial DNA. Nature structural & molecular biology. 2011;18:1290–1296. doi: 10.1038/nsmb.2159. [DOI] [PMC free article] [PubMed] [Google Scholar]
- Oram M, Keeley A, Tsaneva I. Holliday junction resolvase in Schizosaccharomyces pombe has identical endonuclease activity to the CCE1 homologue YDC2. Nucleic acids research. 1998;26:594–601. doi: 10.1093/nar/26.2.594. [DOI] [PMC free article] [PubMed] [Google Scholar]
- Pape T, Schneider TR. HKL2MAP: a graphical user interface for macromolecular phasing with SHELX programs. Journal of Applied Crystallography. 2004;37:843–844. [Google Scholar]
- Phillips AF, Millet AR, Tigano M, Dubois SM, Crimmins H, Babin L, Charpentier M, Piganeau M, Brunet E, Sfeir A. Single-Molecule Analysis of mtDNA Replication Uncovers the Basis of the Common Deletion. Molecular cell. 2017 doi: 10.1016/j.molcel.2016.12.014. [DOI] [PubMed] [Google Scholar]
- Piskur J. The transmission disadvantage of yeast mitochondrial intergenic mutants is eliminated in the mgt1 (cce1) background. J Bacteriol. 1997;179:5614–5617. doi: 10.1128/jb.179.17.5614-5617.1997. [DOI] [PMC free article] [PubMed] [Google Scholar]
- Pleiner T, Bates M, Trakhanov S, Lee CT, Schliep JE, Chug H, Bohning M, Stark H, Urlaub H, Gorlich D. Nanobodies: site-specific labeling for super-resolution imaging, rapid epitopemapping and native protein complex isolation. Elife. 2015;4:e11349. doi: 10.7554/eLife.11349. [DOI] [PMC free article] [PubMed] [Google Scholar]
- Posse V, Shahzad S, Falkenberg M, Hallberg BM, Gustafsson CM. TEFM is a potent stimulator of mitochondrial transcription elongation in vitro. Nucleic acids research. 2015;43:2615–2624. doi: 10.1093/nar/gkv105. [DOI] [PMC free article] [PubMed] [Google Scholar]
- Ringel R, Sologub M, Morozov YI, Litonin D, Cramer P, Temiakov D. Structure of human mitochondrial RNA polymerase. Nature. 2011;478:269–273. doi: 10.1038/nature10435. [DOI] [PubMed] [Google Scholar]
- Rinner O, Seebacher J, Walzthoeni T, Mueller LN, Beck M, Schmidt A, Mueller M, Aebersold R. Identification of cross-linked peptides from large sequence databases. Nature methods. 2008;5:315–318. doi: 10.1038/nmeth.1192. [DOI] [PMC free article] [PubMed] [Google Scholar]
- Rivera-Santiago RF, Sriswasdi S, Harper SL, Speicher DW. Probing structures of large protein complexes using zero-length cross-linking. Methods. 2015;89:99–111. doi: 10.1016/j.ymeth.2015.04.031. [DOI] [PMC free article] [PubMed] [Google Scholar]
- Rubio-Cosials A, Sidow JF, Jimenez-Menendez N, Fernandez-Millan P, Montoya J, Jacobs HT, Coll M, Bernado P, Sola M. Human mitochondrial transcription factor A induces a U-turn structure in the light strand promoter. Nature structural & molecular biology. 2011;18:1281–1289. doi: 10.1038/nsmb.2160. [DOI] [PubMed] [Google Scholar]
- Schwinghammer K, Cheung AC, Morozov YI, Agaronyan K, Temiakov D, Cramer P. Structure of human mitochondrial RNA polymerase elongation complex. Nature structural & molecular biology. 2013;20:1298–1303. doi: 10.1038/nsmb.2683. [DOI] [PMC free article] [PubMed] [Google Scholar]
- Sheldrick GM. A short history of SHELX. Acta Crystallogr A. 2008;64:112–122. doi: 10.1107/S0108767307043930. [DOI] [PubMed] [Google Scholar]
- Sigala B, Tsaneva IR. Functional dissection of the Schizosaccharomyces pombe Holliday junction resolvase Ydc2: in vivo role in mitochondrial DNA maintenance. Eur J Biochem. 2003;270:2837–2847. doi: 10.1046/j.1432-1033.2003.03661.x. [DOI] [PubMed] [Google Scholar]
- Sologub M, Litonin D, Anikin M, Mustaev A, Temiakov D. TFB2 is a transient component of the catalytic site of the human mitochondrial RNA polymerase. Cell. 2009;139:934–944. doi: 10.1016/j.cell.2009.10.031. [DOI] [PMC free article] [PubMed] [Google Scholar]
- Tahirov TH, Temiakov D, Anikin M, Patlan V, McAllister WT, Vassylyev DG, Yokoyama S. Structure of a T7 RNA polymerase elongation complex at 2.9 A resolution. Nature. 2002;420:43–50. doi: 10.1038/nature01129. [DOI] [PubMed] [Google Scholar]
- Tan BG, Wellesley FC, Savery NJ, Szczelkun MD. Length heterogeneity at conserved sequence block 2 in human mitochondrial DNA acts as a rheostat for RNA polymerase POLRMT activity. Nucleic acids research. 2016 doi: 10.1093/nar/gkw648. [DOI] [PMC free article] [PubMed] [Google Scholar]
- Temiakov D, Mentesana PE, Ma K, Mustaev A, Borukhov S, McAllister WT. The specificity loop of T7 RNA polymerase interacts first with the promoter and then with the elongating transcript, suggesting a mechanism for promoter clearance. Proceedings of the National Academy of Sciences of the United States of America. 2000;97:14109–14114. doi: 10.1073/pnas.250473197. [DOI] [PMC free article] [PubMed] [Google Scholar]
- Temiakov D, Patlan V, Anikin M, McAllister WT, Yokoyama S, Vassylyev DG. Structural basis for substrate selection by T7 RNA polymerase. Cell. 2004;116:381–391. doi: 10.1016/s0092-8674(04)00059-5. [DOI] [PubMed] [Google Scholar]
- Wanrooij PH, Uhler JP, Shi Y, Westerlund F, Falkenberg M, Gustafsson CM. A hybrid G-quadruplex structure formed between RNA and DNA explains the extraordinary stability of the mitochondrial R-loop. Nucleic acids research. 2012;40:10334–10344. doi: 10.1093/nar/gks802. [DOI] [PMC free article] [PubMed] [Google Scholar]
- Wanrooij PH, Uhler JP, Simonsson T, Falkenberg M, Gustafsson CM. G-quadruplex structures in RNA stimulate mitochondrial transcription termination and primer formation. Proceedings of the National Academy of Sciences of the United States of America. 2010;107:16072–16077. doi: 10.1073/pnas.1006026107. [DOI] [PMC free article] [PubMed] [Google Scholar]
- Wanrooij S, Fuste JM, Farge G, Shi Y, Gustafsson CM, Falkenberg M. Human mitochondrial RNA polymerase primes lagging-strand DNA synthesis in vitro. Proceedings of the National Academy of Sciences of the United States of America. 2008;105:11122–11127. doi: 10.1073/pnas.0805399105. [DOI] [PMC free article] [PubMed] [Google Scholar]
- Washburn RS, Gottesman ME. Regulation of transcription elongation and termination. Biomolecules. 2015;5:1063–1078. doi: 10.3390/biom5021063. [DOI] [PMC free article] [PubMed] [Google Scholar]
- Wyatt HD, West SC. Holliday junction resolvases. Cold Spring Harb Perspect Biol. 2014;6:a023192. doi: 10.1101/cshperspect.a023192. [DOI] [PMC free article] [PubMed] [Google Scholar]
- Yang B, Wu YJ, Zhu M, Fan SB, Lin J, Zhang K, Li S, Chi H, Li YX, Chen HF, et al. Identification of cross-linked peptides from complex samples. Nature methods. 2012;9:904–906. doi: 10.1038/nmeth.2099. [DOI] [PubMed] [Google Scholar]
- Yin YW, Steitz TA. Structural basis for the transition from initiation to elongation transcription in T7 RNA polymerase. Science. 2002;298:1387–1395. doi: 10.1126/science.1077464. [DOI] [PubMed] [Google Scholar]
- Yin YW, Steitz TA. The structural mechanism of translocation and helicase activity in T7 RNA polymerase. Cell. 2004;116:393–404. doi: 10.1016/s0092-8674(04)00120-5. [DOI] [PubMed] [Google Scholar]
Associated Data
This section collects any data citations, data availability statements, or supplementary materials included in this article.
Supplementary Materials
(A) Limited proteolysis of TEFM. Top panel. Cleavage of TEFM with proteases occurs in the inter-domain linker. Lower panel. Schematics of cleavage in the inter-domain linker of TEFM as determined by mass spectrometry.
(B) Schematic representation of secondary structure elements in TEFM. Alpha-helices are shown as cylinders, β-sheets as arrows. Important structural features are indicated. Coloring as in Figure 1A.
(C) Structure determination of the TEFM CTD. Top. Ribbon representation of the structure of the TEFM CTD with one monomer colored in raspberry and the other in chocolate. Secondary structure elements are indicated. Methionine residues substituted with selenomethionine in the crystals used for phasing are indicated and shown as sticks. An anomalous difference Fourier map calculated using the dataset used for phasing is shown as mesh at 5 σ in yellow. Bottom. The unbiased experimental electron density used for building the initial model is shown as mesh (marine blue) at 1 σ around representative regions shown as sticks (sheets β1, β2, β3 and the dimerization interface composed of a10 from each monomer).
(D) Structure determination of the TEFM NTD. Left. Ribbon representation of the structure of the TEFM NTD colored in orange. Secondary structure elements are indicated. Sulphur-containing residues M116 and C130 are indicated and shown as sticks and an anomalous difference Fourier map calculated using the dataset used for phasing is shown as mesh at 5 σ in pink. Right. Unbiased experimental electron density used for building initial model is shown as marine blue mesh at 1 σ around representative helix α5.
(A) TEFM lacking the NTD domain protects 19-20 nt of RNA from RNase 1 cleavage in the anti-termination complex. The ECs were halted 35 bp downstream of the LSP promoter in the presence of WT or Δ135 TEFM and treated with RNase 1 for 5 min at RT.
(B) TEFM lacking the NTD domain and the inter-domain linker does not protect RNA from RNase 1 cleavage. The experimental conditions were as described above.
(C) TEFM lacking the NTD domain protects the downstream and the upstream DNA in the EC. The EC was assembled using R14/TS26/NT26 scaffold in the absence of TEFM or in the presence of WT or Δ135 TEFM prior to DNase I treatment for 5 min at RT.
(D) TEFM lacking the NTD domain and the inter-domain linker leaves no clear footprint in the DNAse I protection assay. The experimental conditions were as described above.
(A) Close-up view of the dimerization interface of TEFM. Coloring and representation as in Figure 1B. The α10 helix of each monomer is highlighted, with the rest of the protein shown transparently. Hydrophobic residues forming the dimerization interface that were subjected to mutagenesis are shown as sticks.
(B) Mutation of the TEFM residues contributing to the dimerization interface results in a monomeric form of TEFM that cannot bind EC. Upper panel: A monomeric TEFM mutant (Δ35TEFM F244E L248D I252D M256S L260D) was purified and used for analytical size exclusion experiments. The mutant TEFM elutes as a monomer (blue), while the WT TEFM elutes as a dimer (red). Middle panel: Incubation of the EC with WT TEFM leads to a distinct shift of the peak representing the EC, indicating formation of a stoichiometric complex (2:1 TEFM:EC). In contrast, incubation of the EC with the monomeric TEFM mutant does not lead to a change in retention volume as compared to the individual components (Lower panel).
(C) The monomeric TEFM mutant does not prevent termination at CSBII. Transcription assays were performed using the PCR template containing LSP and the CSBII region. The control reaction (lane 1) contains no TEFM. The reaction products were resolved using 20% PAGE containing 6M Urea.
(A) Surface charge distribution in TEFM. Surface charge analysis of TEFM reveals an extensive positively charged surface facing the nucleic acid scaffold in the EC-TEFM complex. (MtRNAP is not shown). (Blue: positive charge; red: negative charge). DNA is shown in cartoon view with coloring as in Figure 4A. Vacuum electrostatic potential was calculated with Pymol.
(B) TEFM interactions with the downstream DNA contribute to the formation of a “sliding clamp”. TEFM (raspberry) and mtRNAP (grey) are shown in surface representation.
(C) Electron density for nucleic acids in the anti-termination complex. The final model of the non-template DNA, template DNA and RNA is shown as sticks in cyan, blue and red, respectively. The TEFM CTD is shown as surface representation in raspberry. The 2mFo-DFc electron density for the nucleic acid included in the model is shown as grey mesh at 1 σ. An unbiased mFo-DFc map for the region corresponding to the single-stranded portion of the non-template strand (not modeled) is shown as green mesh at 3 σ. The expected trajectory of the missing non-template bases is indicated by a dashed line.
(D) Comparison of mtRNAP structure in the EC and the anti-termination complex. The structure of mtRNAP in the anti-termination complex is shown as ribbon representation with subdomains colored as in Figure 4A. The structure of the EC (PDB ID 4BOC) was superimposed using the C-terminal catalytic domain (residues 643-1230) and is shown in identical coloring at 50% opacity. Arrows indicate movements necessary to transform from the EC to the anti-termination conformation. While the palm and thumb subdomains assume identical positions, the fingers domain is rotated in the post-translocated anti-termination complex to a conformation analogous to the one observed in the T7 post-translocated state (Temiakov et al., 2004). In addition, the NTD and PPR domains of mtRNAP adopt a more open conformation in the anti-termination complex than in the EC.
(A) List of peptides representing intra-protein cross-links between mtRNAP and TEFM detected by BS3 (black), EDC (blue) and DSG (red).
(B) List of pBpa-substitions made in mtRNAP and TEFM with their respective cross-linking efficiencies.
(C) Anti-termination activity of various TEFM mutants.
(D, E) TEFM does not bind to the initiation complex. Elution profile (D) and SDS-PAGE (E) of analytical size-exclusion chromatography of the initiation complex (LSP/mtRNAP/TFAM/TFB2M) in the presence of TEFM. Fractions analyzed by SDS-PAGE are indicated as colored bars in the chromatogram and below the SDS gel.
(A) The docking loop of TEFM cross-links to two distinct sites in mtRNAP. Cross-linking was performed using a 32P-labeled Bpa308 TEFM variant and mtRNAP having an engineered cleavage site for 3C protease introduced into the proline-rich linker domain (cleavage after residue 363). The cleavage reaction revealed that the majority of the cross-link to the 308BpaTEFM (∼65%) is located to the N-terminus of the 3C site, i.e. in the N-terminal extension region/PPR domain of mtRNAP (residues 120-364).
(B) Fine mapping of the N-terminal cross-linking site in mtRNAP. Cross-linking was performed using Bpa308 TEFM and 32P-labeled Δ119 mtRNAP. Upon cross-linking, the radioactive species were separated using 6% SDS PAGE. MtRNAP-TEFM cross-link and mtRNAP were excised from the gel, eluted and subjected to cleavage by NTCB (cuts at Cys residues). The products of the reaction were resolved using 4-12% PAGE (Invitrogen). N-terminal cleavage pattern is observed for mtRNAP (lanes 1,2); the identity of every band representing labeled peptide was verified using the molecular weight standards (Mark 12, Invitrogen). Cleavage of the mtRNAP-TEFM cross-link results in appearance of adducts (indicated by the blue arrows), that are a TEFM mass (∼37 kDa) larger than the corresponding peptides observed for mtRNAP. The cleavage pattern of the cross-link (lanes 3,4) is consistent with the location of the N-terminal cross-link between residues 120-178 in mtRNAP. Blue numbers (left side of the gel) represent apparent molecular weights of the three most N-terminal mtRNAP peptides involved in TEFM cross-linking; blue numbers to the right are molecular weights of the corresponding adducts. Note that the large molecular weight C-terminal cross-linked species are not resolved in this gel.
(C) Fine mapping of the TEFM-mtRNAP NTD cross-link. The cross-linking was performed using a Bpa308 TEFM variant and 32P-labeled Δ44 mtRNAP (mature mtRNAP) with an engineered hydroxylamine cleavage site (NG) at residue 150. Upon the cleavage reaction, appearance of the labelled species (∼55 kDa) corresponding to TEFM cross-linked to the region 44-150 in the NTD of mtRNAP was observed. Taken together with the data obtained in the NTCB experiment above, this suggests that TEFM interacts with the region 120-150 in the mtRNAP NTD. Note that the C-terminal cross-link is not visible in this experiment as the labelling of mtRNAP is due to the engineered PKA site at the N-terminus of mtRNAP.
(D) Schematic illustration of the variants of mtRNAP used in experiments shown in Panel A-C. The red rectangle indicates the N-terminal cross-link to 32P-labeled TEFM (or 32P-labeled mtRNAP to TEFM); the yellow rectangle represents the C-terminal mtRNAP cross-link due to 32P-labeled TEFM.
(E) TEFM does not efficiently cross-link to Δ150 mtRNAP. Cross-linking was performed using a32P-labeled Bpa308 TEFM variant and Δ119 (lane 1) or Δ 150 (lane 2) mtRNAP.
(F) Mapping of the C-terminal cross-linking site in mtRNAP. Cross-linking was performed using a 32P-labeled Bpa308 TEFM variant and mtRNAPs with an engineered cleavage site for the 3C protease introduced into the thumb domain (cleavage after residue 751, lanes 1,2) or into the lever loop (cleavage after residue 602, lanes 3,4). The identified cross-linked adducts are indicated by black arrows. Grey arrows mark the expected position of the cross-linked species that correspond to the minor (< 5-10%) cross-linking sites. Cleavage of 3C-751-mtRNAP results in appearance of a single band, representing the region 120-751 of mtRNAP. Cleavage of 3C-602-mtRNAP results in appearance of a band, which represents the region 120-602 of mtRNAP. These data, taken together with the data suggesting the location of the C-terminal cross-linking site between residues 365-1230 (panel A), indicate the location of the C-terminal crosslink in region 364-602 of mtRNAP.
(G) Schematic illustration of the variants of mtRNAP used in experiments shown in Panel A and F. The red rectangle indicates the N-terminal cross-link to 32P-labeled TEFM; the yellow rectangle represents the C-terminal mtRNAP cross-link due to 32P-labeled TEFM.
(A) Transcription assay performed using a PCR template containing the LSP promoter (lane1) and the LSP promoter and TrpA terminator (lane 2). The position of the expected termination product is indicated with the black arrow; efficiency of termination at this point is indicated beneath the gel.
(B) Transcription assay performed using a PCR template containing the LSP promoter (lane1) and the LSP promoter and TΦ terminator (lane 2). The position of the expected termination product is indicated with the black arrow; efficiency of termination at this point is indicated beneath the gel.
Data Availability Statement
Atomic coordinates and structure factors for crystal structures of TEFM NTD, TEFM CTD and EC-TEFM complex have been deposited in the Protein Data Bank under ID codes 5OL9, 5OL8 and 5OLA.