

Abstract
Objectives
In this study, the authors aimed to examine the association of a range of blood lead levels on language skills assessed at 4, 6, 10 and 12 years of age using a prospective longitudinal design controlling for potential confounding variables including maternal vocabulary, caregiver’s psychological distress and symptomatology, child’s race and prenatal drug exposure.
Methods
The participants (N=278) were a subsample of a large longitudinal study that examined the association of prenatal drug exposure on children who were followed prospectively from birth and assessed for receptive and expressive language skills at 4, 6, 10 and 12 years of age. Blood lead levels were determined at 4-years of age by atomic absorption spectrometry. A mixed model approach with restricted maximum likelihood procedures was used to assess the association of lead on language outcomes.
Results
Longitudinal mixed model analyses suggested a negative effect of lead exposure on both receptive and expressive language, with the adverse outcomes of lead exposure appearing to become more prominent at 10 and 12 years. Higher caregiver vocabulary was positively associated with child’s language scores whereas caregiver psychological distress appeared to negatively affect language scores. Prenatal drug exposure was not related to the effects of lead on language skills.
Conclusions
These findings suggest that elevated blood lead levels occurring early in life may be associated with poorer language skills at older ages. A language rich environment may minimize the negative influence of early lead exposure on language skills, with psychological distress seemingly exacerbating the negative outcome.
Keywords: lead exposure, language, longitudinal outcomes
Introduction
Although elevated blood lead levels (EBL) have been declining in children over the past 30 years, children growing up in urban environments may be at increased risk for EBL (National Center for Health Statistics; Mahaffey, Annest, Murphy, 1982). More specifically, industrial, urban environments have been known to present hazards to families since many of the homes and buildings were constructed prior to 1980 (before lead was removed from paint and pipes) increasing the possibility of lead contaminated soil in play areas in the neighborhoods (Bullard & Johnson, 2000; Koger, Schettler, & Weiss, 2005). Factories in cities that produced lead products in the 80’s and 90’s released lead dust into the air that settled in the soil. Fumes from the high volume of traffic in urban areas before lead was removed from gasoline was another source of lead in the soil.
Recognizing the potentially harmful effect of lead on development, the Center for Disease Control (CDC) lowered the “blood lead level of concern” from >10 μg/dL to 5 μg/dL or greater in 2012(http://www.cdc.gov/nceh/lead/ACCLPP/blood_lead_levels.htm). The BLL of 5 μg/dL or greater identifies children whose BLL is in the top 2.5% of children ages 1–5 years in the United States. However, there is evidence to suggest that lead levels as low as 2μg/dL may be of concern (Gilbert & Weiss, 2006). The CDC recommends that children presenting with BLL above this “level of concern” should be followed for potential cognitive, behavioral and academic problems.
One problem associated with the ability to identify the specific adverse outcomes of lead exposure in children living in urban environments stems from the fact that children in urban settings are at increased risk for adverse outcomes due to a variety of other factors, including prenatal drug exposure, poverty, low parental education and other environmental conditions (Min, et al., 2009). Few studies have sought to separate out the effects of lead exposure on language skills from these other risk factors (poverty, drug exposure). It is not known whether prenatal exposure to drugs such as alcohol, cigarette smoking, marijuana, and cocaine mitigate or compound the adverse outcomes of lead exposure on language. A study by Bandstra and colleagues (2002) found a higher percentage of children who were exposed to cocaine in utero had blood lead levels great than 10 µg/dL when compared to children without prenatal cocaine exposure. Cocaine influences on language skills were observed after controlling for lead exposure.
In the current study we examined the association of EBL on language skills in a cohort of children recruited at birth from an urban population and followed longitudinally from birth. Although the original study was not designed to examine the association of EBL on language skills, the large well-characterized cohort followed prospectively from birth provided us with the opportunity to consider whether lead appeared to have an effect on the presentation of language skills at different developmental stages. We were also able to control for multiple risk factors to tease out the association of early lead exposure on language skills at four time points spanning from 4 to 12 years of age.
Studies of Lead Exposure and Language Skills
The detrimental influence of early EBL on cognitive and academic abilities have been well documented (Needleman et al. 1979; Lanphear, Dietrich, Auinger, & Cox, 2000), with reports suggesting that even low EBL (<5μg/dL) are associated with IQ decline and deficits in academic performance (Lanphear et al., 2005; Min, et al., 2009). Studies have examined auditory processing deficits and academic achievement in math, reading and spelling that are related to language abilities (Dzwilewski & Schnatz, 2015). Fewer studies have also specifically examined the relationship of lead exposure on language skills although language skills may be particularly susceptible to EBL (Boutwell, Beaver, & Barnes, 2014; Dzwilewski & Schantz, 2015; Ernhart & Greene, 1990).
Language acquisition is rapid during early childhood, a time when lead exposure most frequently occurs (Ernhart & Greene, 1990). Global language skills are often evaluated as part of general tests of cognitive abilities and are negatively impacted by EBL (Hou, Yuan, Jin, Ding, Qin, Li, Wu, Zhao, & Deng, 2013). Language assessments of specific domains such as semantics, syntax, morphology, and phonology are not typically conducted and therefore the precise relationship between EBL and domain–specific language skills appears unknown. For example, a study by Hubbs-Tait et al. (2009) examined the relationship of blood lead levels <10 µg/dL and language employing the Peabody Picture Vocabulary Test-III (PPVT-III), a measure of receptive vocabulary, in 112 Headstart children. Although the relationship between the PPVT-III scores and lead levels failed to reach statistical significance, other domains of language that were not assessed may have been adversely affected by lead exposure.
Although few studies have specifically examined children with language impairment for EBL, work by Gahyva, Crenitte, Galdana, & Hage in 2008 pointed clearly to the multifactored involvement of environmental and genetic factors in language impairment. In their sample of 20 preschoolers with blood lead levels > 10μg/dL, 65% (n=13) of the children had language impairments including phonology and other language domains (Gahyva, Crenitte, Caldana, & Hage, 2008). Interestingly, a correlation was not found between the severity of language impairment and the degree of EBL. The authors concluded that genetic and environmental factors, including low SES may have contributed to the language impairment. An early study of language and lead exposure by Earnhart and Greene (1990), examined cord lead levels and language skills in an urban population of children at ages one, two, and three years. They failed to find a relationship between receptive and expressive language scores and lead levels, although differences in mean length of utterance were marginally significant. Inconsistency in lead associations with language may stem in part from differences in age and/or type of language assessment.
Other studies have examined the influence of EBL on reading skills, a language derived skill. While not assessing spoken language directly, it is well documented that children with deficits in spoken language skills often experience difficulty with reading (Kamhi & Catts, 2012). In a recent study conducted in a school district described to be urban by the authors, poor reading readiness in Kindergarten was associated with EBL (McLaine, Novas-Acien, Lee, Simon, Diener-West, & Agnew, 2013). Most concerning, is the fact that lead levels well below the 10 μg/dL (i.e.) appeared to be negatively associated with reading readiness. While the data are suggestive that urban environments present risks for early lead exposure, the authors contend that testing blood lead levels in school districts should be a component of the screenings conducted for early reading intervention because these environments present risks for early lead exposure (i.e., industrial settings, older buildings, lead paint).
There is recent evidence that the effects of EBL on language development is not limited to early childhood, but appears to persist into adolescence and beyond. Dzwilewski and Schnatz (2015) in a review paper concluded that lead exposure affects cognitive and intellectual development from infancy through adolescence. Seven of eight studies that they reviewed found that lead exposure was associated with reduced cognitive abilities in early childhood. Four of these studies followed children into later childhood and all found persistent negative effects of early lead exposure. In a study of 11- to 14- year old, males in the highest quartile of elevated bone lead levels demonstrated poorer language processing, including phonological, lexical, and sentence processing, than peers without elevated bone lead levels (Campbell, Needleman, Riess, &Tobin, 2000). These findings suggest that there is a long-term influence of lead exposure on language abilities.
Other language-related factors that may mediate the association of EBL and language
Multiple risk factors (biological, maternal, and environmental) influence language development, with children growing up in low income, inner city communities particularly at risk. In an effort to more precisely examine the association between EBL and language, researchers have been careful to control statistically for these risk factors. The biological factors include exposure to drugs in utero, such as alcohol, tobacco, marijuana and cocaine (Lewis et al., 2013), as well as prematurity and low birthweight. Maternal factors such as education, verbal skills, depression, and psychosocial distress have also been shown to influence child language development. Mothers experiencing mental health issues and stress are often not able to provide adequate language stimulation for their children (Minnes et al., 2005). Environmental factors associated with poverty such as homelessness, violence, and other environmental toxins beside lead may result in poor language outcomes (Dzwilewski & Scnatz, 2015; Koger, Schettler, & Weiss, 2005; Singer et al., 2008). Precisely how these factors affect language likely varies with the age of the child as language demands change from early childhood to adolescence. In the current study, we statistically controlled for these confounding variables that may mediate the association between EBL and language.
Neurobiological associations of lead exposure on language
Although the neurobiological impact that lead exposure has on language in children is not well understood, there is some evidence that language areas of the brain specifically may be affected by lead exposure. Lead affects multiple body systems including the brain, liver, bones and kidney. Young children are particularly susceptible to lead as they absorb more lead than adults. A study by Stansfield, Pilsner, Lu, Wright, and Guilarte (2012) demonstrated that lead affects development of neural synapses in an animal model. Furthermore, they argued that lead decreases the BDNF gene expression that creates new synapses in the hippocampus, an area of the brain associated with memory and learning, that may disrupt language development. Additionally, disruption of the auditory system by lead exposure has also been reported in an animal model. Although the function of the animal’s primary auditory cortex was impaired by low-level lead exposure (Zhu et al., 2016), perceptual training after lead exposure improved the animal’s auditory function. The direct link between animal and human cognition is a bit of a stretch, some preliminary research has found similar effects with children. Children with lead exposure demonstrate auditory temporal processing deficits that appeared to adversely affect language development and reading (Dietrich, Succop, Berger, & Keith, 1992). Drawing on the work of Zhu et al. (2016) with animals, future research should explore the possibility that carefully designed intervention may ameliorate the influence on lead exposure on the auditory system in children with early lead exposure.
Long-term developmental influences of lead on language have not been studied. The neurobiological consequences of lead exposure may persist into adulthood. A study of young adults with early childhood EBL demonstrated reduced activation in the left frontal cortex, adjacent to Broca’s area, and the left medial temporal gyrus, including Wernicke’s area, during language tasks (Yuan et al., 2006). It appears that early lead exposure may disrupt the functional neural anatomy associated with language resulting in life-long language and cognitive deficits.
Rationale for the current study
Although language skills appear to be affected by EBL from early childhood into adolescence and adulthood, most studies have not comprehensively assessed language skills across the developmental age-continuum. The impact of early lead exposure may differ with the age of the child and the language domain examined (i.e. receptive and expressive language skills). Finally, research studies are needed that control for the many potential confounding variables that may indirectly or directly affect the relationship between EBL and language ability, including prenatal drug exposure, poverty, parental stress, and low maternal education.
The current study employed a subsample of children who were participating in a large prospective longitudinal study designed to examine the developmental effects of prenatal cocaine exposure. Blood lead levels were considered as a continuous variable and as a dichotomous variable while controlling for multiple biological and environmental confounders including prenatal drug exposure, low SES, and maternal IQ, vocabulary and psychological distress and symptomatology.
The purpose of the study is to examine the long-term association of early childhood EBL with receptive, expressive and total language skills in children 4–12 years of age at high risk for EBL. Since our experimental (lead exposed group) and Control (non-exposed group) are comparable in terms of demographic factors (i.e., ethnicity, SES, education) and statistical control for multiple co-occurring variables shown to affect language outcomes, including biological (such as prenatal drug exposure, child head circumference), maternal (such as caregiver’s vocabulary and psychological distress) and environmental factors (such as low SES and the quality of home environment) was collected on this cohort, we are in a unique position to assess the relationship between EBL and language skills. We hypothesized that 1) higher lead levels would be related to poorer language outcomes and 2) that lead levels of 5 μg/dL or greater will have poorer language outcomes than children with lower lead levels.
Methods
Subjects
The participants were a subsample of a large longitudinal study examining the developmental effects of prenatal cocaine exposure. The total sample consisted of 85% African American children of low socioeconomic status (Hollingshead, 1975) drawn from a cohort recruited at birth (September 1994–June 1996) from a large, urban, county teaching hospital. IRB approval from University Hospitals of Cleveland and MetroHealth Medical Center was obtained for all participants, with informed consent obtained from parents. Health Insurance Portability & Accountability Act of 1996 (HIPAA) was maintained. All subjects were protected by a writ of confidentiality (DA-04-03) which prevented the release of any subject information by the research staff even under court order.
Maternal and infant urine samples were obtained immediately before or after labor/delivery and analyzed for the presence of cocaine metabolites (benzoylecgonine), cannabinoids, opiates, PCP, and amphetamines. Infants had meconium drug analyses performed for cocaine and its metabolites. Screening assays were conducted using polarization immunoassay reagents (fluorescence polarization immunoassay; US Drug Testing Laboratories, Inc, Des Plaines, IL). Cutoff levels were as follows: cocaine and metabolites, opiates, 25 ng/g; amphetamines, 100 ng/g; phencyclidine, 25 ng/g; tetrahydrocannabinol, 25ng/g.
Infants with prenatal cocaine exposure (PCE) were identified based on either positive infant meconium, maternal urine, or maternal self-report to hospital or research staff, while control infants were negative on all three indicators (NCE). Women who used alcohol, marijuana, or tobacco during pregnancy were included in both groups. Of the 647 mothers identified, 54 were excluded (20 PCE & 34 NCE) from this study, with 15 not having meconium, two having Down Syndrome, 16 having maternal psychiatric history, two due to primary heroin use, five having human immunodeficiency virus status, one due to IQ <70, one having Fetal Alcohol Syndrome, two due to maternal age under 19 years, three due to a medical illness in the infant, four due to chronic illness in the mother, and three for other reasons. Additionally, a total of 155 women (49 cocaine using & 106 non cocaine using) refused to participate; and 23 did not come to the enrollment visit. The sample size of the original cohort was 415.
Birth, demographic, and medical characteristics were taken from hospital records, and included maternal race, age, parity, number of prenatal care visits, infant Apgar scores, and infant birth weight, length, and head circumference. The Hobel Neonatal Risk Index (Hobel, Hyvarinen, Okada, & Oh, 1973) was computed to obtain a measure of neonatal medical complications. Children exposed to cocaine were smaller in length, head circumference, and weight at birth than children who were not exposed. Children were followed prospectively from birth at 1, 2, 4, 6, 9, 10, 11, and 12 years of age.
At 4-years of age, 376 children were followed and assessed on a comprehensive test battery including a blood draw for lead level analysis. Ninety-eight children did not contribute blood samples due to parent refusal, child illness, or inability to draw blood due to child distress. A lower percentage of foster parents consented to the blood draw than biological parents. Blood samples were obtained for the lead analysis from 278 children (136 boys, 142 girls), primarily African American (85%). Blood lead levels were determined by atomic absorption spectrophotometry. See Table 1 for child characteristics of the subsample used in these analyses.
Table 1.
Child Characteristics (N=278)
| N (%) | Mean ± SD | |
|---|---|---|
| Male | 136 (48.92) | – |
| African American | 236 (84.89) | – |
| Gestational age, weeks | 38.12 ± 2.63 | |
| Prematurity (< 37wks gestational age) | 67 (24.10) | |
| Hobel Neonatal Risk score, Median (10%tile–90%tile) | – | 0 (0 – 20) |
| Birth weight, grams | – | 2906 ± 668 |
| Baby length, cm | – | 48.25 ± 3.70 |
| Head circumference, cm | – | 32.97 ± 2.20 |
| Microcephaly | 25 (9.09) | |
| Blood lead level at 4 years (μg/dL) | 7.01 ± 2.23 | |
| < 5 μg/dL | 100 (35.97) | |
| 5 μg/dL – < 7 μg/dL | 64 (23.02) | |
| 7 μg/dL – < 10 μg/dL | 62 (22.30) | |
| ≥10 μg/dL | 52 (18.71) | |
| Iron Deficiency Anemia at 4 years | 11 (3.96) |
Maternal/caregiver measures
At the enrollment visit, maternal socioeconomic status (Hollingshead, 1975) and educational level were calculated. Maternal vocabulary score was measured using the Peabody Picture Vocabulary Test - Revised (PPVT-R; Dunn & Dunn, 1997). Two subtests of the Wechsler Adult Intelligence Scale - Revised (WAIS-R; Wechsler, 1989) were administered: Block Design (BD) and Picture Completion (PC), which enabled an estimate of non-verbal intelligence. In an effort to examine psychological distress and symptomatology, the Brief Symptom Inventory (BSI; Derogotis, 1992) was administered at birth and at the one-year visit. The BSI is a self-report scale yielding a summary psychological distress and symptomatology score, the Global Severity Index (GSI).
At each follow-up visit, current caregiver data were updated to provide concurrent measures of caregiver psychological distress and symptomatology and drug use, including tobacco, alcohol, marijuana, and cocaine or other drug use. If the child had been placed with a new caregiver, intellectual measures were also updated. Current caregivers received the Peabody Picture Vocabulary Test- 3rd Edition (PPVT-III) and the GSI. The Home Observation of the Environment (HOME; Cadwell & Bradley, 1984) was administered to the caregiver in an interview format as a measure of the quality of the caregiving environment. Time-varying concurrent HOME scores were used in analyses. See Table 2 for maternal and caregiver variables.
Table 2.
Biological Maternal and Caregiver Characteristics (N=278)
| n (%)/Mean ± SD | |
|---|---|
| Biological maternal | |
| African American | 238 (85.61) |
| Low socioeconomic statusa | 271 (97.83) |
| Married | 39 (14.03) |
| Number of prenatal visits | 7.21 ± 4.99 |
| Age at birth | 27.65 ± 5.24 |
| Parity | 3.18 ± 1.90 |
| Years of education | 11.82 ± 1.59 |
| Amount of prenatal drug use | |
| Alcohol | 5.42+(14.21) |
| Cigarette | 6.89+ (9.10) |
| Marijuana | 0.79+ (2.65) |
| Cocaine | 10.71+ (27.96) |
| Average amount of prenatal drug use, Median (10%tile–90%tile) | |
| Alcohol dose/week | 0.50 (0 – 12.68) |
| Cigarette use/day | 3.00 (0 – 20.00) |
| Marijuana dose/week | 0 (0 – 2.25) |
| Cocaine units/week | 0.13 (0 – 29.75) |
| Global Severity Index, Median (10%tile–90%tile) | 0.40 (0.08 – 1.47) |
| PPVT-R Standard Score | 76.15 ± 15.35 |
| WAIS-R Block Design | 7.06 ± 1.99 |
| WAIS-R Picture Completion | 7.01 ± 2.23 |
| Caregiver at age 12 | |
| HOME environment | 48.33 ± 6.36 |
| Non-kinship foster/adoptive care | 22 (8.24) |
| Global Severity Index | 0.38 ± 0.47 |
| PPVT Standard Score | 78.62 ± 15.19 |
| WAIS-R Block Design | 7.30 ± 2.06 |
| WAIS-R Picture Completion | 7.37 ± 2.47 |
| Average drug use (past 30 days), Median (10%tile–90%tile) | |
| Alcohol dose/week | 0 (0 – 4.5) |
| Cigarette use/day | 0 (0 – 20) |
| Marijuana dose/week | 0 (0 – 0) |
| Cocaine units/week | 0 (0 – 0) |
Hollingshead classification IV and V
IQR= Inter Quartile Range; PPVT-R= Peabody Picture Vocabulary Test- Revised; WAIS-R = Wechsler Adult Intelligence Scale-Revised
Child language measures
Language skills were assessed at four time points by age appropriate standardized measures. Testing was performed by Masters level examiners under the supervision of a PhD licensed clinical psychologist. Testers were trained to a proficiency level of over 95% inter-rater reliability. At age 10, we again assessed inter-rater reliability of TOLD using 16 cases. It ranged around .98 (generals) – .99 (sentence combining, word ordering, grammatic comprehension, picture vocabulary, malapropisms).
At 4-years of age, the Clinical Evaluation of Language Fundamentals-Preschool (CELF-P; Wiig, Secord, & Semel, 1992) was administered. The normative sample for the CELF-P was 14.9% African American. Test-retest reliability is .91–.96 for the composite scores. Inter-rater reliability was greater than .90. Concurrent validity was demonstrated by correlation with the PLS-3 (.90) and the CELF-R (.71).
At six years of age, the Comprehensive Assessment of Spoken Language (CASL; Carrow-Woolfolk, 1999) was given. The normative sample was 16% African American. Reliability ranged from .80–.90 with test-retest reliability reported as.88–.96. Criterion related validity was evaluated by correlation with comparable tests including TACL-R, OWLS, EVT, and PPVT.
At 10 and 12 years of age, the Test of Language Development –Intermediate, 3rd Edition (TOLD-I:3; Hammill & Newcomer, 1997) was employed. The receptive, expressive, and total language scores from these measures were used in the analyses. The normative sample was based on the US Census Bureau data. Little or no bias was observed for gender, race and ethnicity. Test-retest reliability is .94–.96 and inter-rater reliability is .96–.97. Criterion prediction validity is .74–.88 for composite scores.
Receptive, expressive and total language scores were internally standardized by creating z-scores for all available children at each time point. Approximately 94% (n=260) of the sample completed all four assessments for the present longitudinal analysis.
Analyses
Data that were positively skewed were normalized using a log transformation (alcohol and drug use, maternal psychological distress and symptomatology) prior to analyses. Means and standard deviations were reported by the variables’ original distribution, with transformations used in analyses. The blood lead level was retained on its natural scale despite any presence of skewness as it is the focus of this analysis. Pearson or Spearman correlations were estimated to examine inter-relationships between lead and maternal, child, and caregiver characteristics.
Hypothesis 1: Higher lead levels are related to poorer language outcomes
Since our previous work indicated a linear association of lead with outcomes (Min et al., 2009), lead level was examined as a continuous variable and was entered first in the model and retained throughout the modeling process. A mixed linear model approach with restricted maximum likelihood estimation procedures was used to evaluate the relationship of lead levels to language z-scores on the CELF-P, CASL, or TOLD-I:3 at 4, 6, 10 and 12 years of age. An unstructured covariance matrix, estimating each variance and covariance uniquely from the data by making no assumptions regarding the nature of the residual correlations between the repeated measures, was used to account for correlated responses within a subject. We tested the homogeneity of lead influences, as well as the association of gender and other covariates on children’s language outcomes over time by including an interaction term with time. If the interaction was not significant at p < .10, the interaction terms were removed from the model. Missing data were modeled using full-information maximum likelihood (FIML), which uses all available information from the observed data. Compared to mean-imputation, list-wise, or pairwise models, FIML provides more statistically reliable standard errors (Wothke, 1998). Variables that were associated with lead or with outcomes at p<.20 for at least one time-point (Mickey & Greenland, 1989) were entered as covariates into the model using backward elimination approach.
Hypothesis 2: Lead levels of 5 μg/dL or greater will have poorer language outcomes than children with lower lead levels
To provide a more comprehensive picture, we also created a dichotomous lead exposure variable using two lead levels < 5 and ≥5 μg/dL and < 7 and ≥7 μg/dL (7 μg/dL was the mean lead level for the cohort), based on the findings of a pooled-analyses (Lanphear et al., 2005) to graphically demonstrate the effects of high versus low EBL.
Results
Blood lead level analysis
The mean blood lead level (BLL) at 4-years of age was 7.0 µg/dL (SD = 4.1; range 1.3–23.8). Thirty-six percent of the children (n=100) had a lead level < 5 μg/dL, 23% (n=64) had a lead level between 5 to <7 μg/dL, 22% (n=62) had a lead level between 7 to <10μg/dL and 19% (n=52) had lead levels ≥10 μg/dL. The percentage of children with blood lead levels ≥10 μg/dL was considerably above the percentage reported by the CDC from 2002–2010 where rates ranged from 2% to 9.3% for children one to two years of age (Raymond, Wheeler, & Brown, 2014). Six percent of children living in poverty were reported to have BLL ≥5 μg/dL. It was noted that children placed in adoptive/foster care (n=27) had lower BLL than children who remained in biological relative care (n=251). Only three children (11.1%) in adoptive/foster care had BLL≥10 μg/dL compared to 49 (19.52%) of children in biological relative care. Table 2 presents maternal/caregiver demographics including the HOME score at 12 years of age used in analyses.
Lead levels and language skills
Hypothesis 1: Higher lead levels are related to poorer language outcomes
Table 3 presents the results of the relationship of BLL and receptive, expressive and total language scores with adjustments for covariates. Language scores at 12 years of age are used as the reference group in the model. The estimate reported in Table 3 for each variable is similar to b (the unstandardized regression coefficient). The mixed model revealed a linear negative effect of lead level on total language skills (b=−.03, 95% CI=−0.058~−0.009). A standard total language score loss of 5.25 points was estimated for each 10 micrograms per deciliter increase in blood lead level at 4, 6, 10 and 12 years of age. Significant covariates included current caregiver’s PPVT score, current caregiver’s GSI score, and child’s race. See Table 3. Higher caregiver PPVT scores were related to better child language scores in general, with greater influence on 12-year language scores compared to 4-year language scores (b=0.01; 95% CI= 0.006 ~ 0.019). Not surprisingly psychological distress and symptomatology had a negative impact on language skills, with higher maternal GSI scores related to poorer child language scores (b= −0.07; 96% CI= −0.136 ~ −0.009). There was a significant time effect with total language scores decreasing for all children as they aged (F=2.87, df=3, 265, p = .037).
Table 3.
Impact of Lead on Language Scores by Time with scores at12 years of age as the reference group
| Receptive language
|
Expressive language
|
Total language
|
|||||||
|---|---|---|---|---|---|---|---|---|---|
| Estimate | SE | p | Estimate | SE | p | Estimate | SE | p | |
| Blood lead level (BLL) at 4 years | −0.05 | 0.01 | .001 | −0.03 | 0.01 | .01 | −0.03 | 0.01 | .007 |
| Age 4 year | −0.21 | 0.13 | .09 | −0.008 | 0.05 | .88 | 0.81 | 0.28 | .004 |
| Age 6 year | −0.12 | 0.12 | .33 | 0.02 | 0.06 | .78 | 0.44 | 0.25 | .08 |
| Age 10 year | 0.08 | 0.08 | .30 | −0.01 | 0.04 | .74 | 0.18 | 0.18 | .33 |
| BLL*Age 4 year | 0.03 | 0.02 | .03 | – | – | – | – | – | – |
| BLL*Age 6 year | 0.03 | 0.01 | .047 | – | – | – | – | – | – |
| BLL*Age 10 year | −0.008 | 0.01 | .39 | – | – | – | – | – | – |
| Male | −0.10 | 0.09 | .27 | −0.18 | 0.10 | .06 | −0.12 | 0.10 | .22 |
| Child race, African American | −0.48 | 0.13 | .0003 | −0.35 | 0.14 | .01 | −0.47 | 0.14 | .001 |
| Caregiver PPVT score | 0.009 | 0.003 | .0005 | 0.009 | 0.003 | .002 | 0.01 | 0.003 | .0002 |
| Caregiver PPVT*4 year | – | – | – | – | – | – | −0.01 | 0.003 | .003 |
| Caregiver PPVT*6 year | – | – | – | – | – | – | −0.005 | 0.003 | .11 |
| Caregiver PPVT*10 year | – | – | – | – | – | – | −0.002 | 0.002 | .31 |
| Maternal GSI at birth | – | – | – | – | – | – | −0.07 | 0.03 | .03 |
| Prenatal marijuana exposure, 1st trimester | – | – | – | 0.12 | 0.07 | .10 | – | – | – |
| Head circumference at birth | 0.02 | 0.02 | .47 | 0.03 | 0.02 | .24 | 0.02 | 0.02 | .29 |
Note. Blank spaces indicate that the variable did not meet the criteria (e.g. not significant at the bivariate level) and therefore not included in the model.
Findings for receptive (p=.001) and expressive (p=.01) subscales were consistent with the total language score findings with lead levels demonstrating a negative linear effect. Prenatal drug exposure was not significantly related to lead effects on language skills.
Hypothesis 2: Lead levels of 5 μg/dL or greater will have poorer language outcomes than children with lower lead levels
Comparisons of BLL <5 μg/dL (low lead levels) to children with BLL ≥5 μg/dL
We compared children with BLL <5 μg/dL (low lead levels) to children with BLL >5 μg/dL on receptive, expressive and total language scores at 4, 6, 10 and 12 years of age. The overall model for BLL ≥ 5 μg/dL was not significant for total language scores at 4, 6, 10 and 12 years adjusted for child age, gender, and race and caregiver PPVT score, PPVT*child age, maternal GSI at birth, and child head circumference at birth. Significant differences in total language were observed at ages 10 (p=.027) and 12 (p=.016) with children with BLL ≥5 μg/dL performing more poorly than those with BLL <5 μg/dL.
Similarly, the overall model for BLL ≥ 5 μg/dL was not significant for expressive language scores at 4, 6, 10 and 12 years adjusted for child age, gender, and race and caregiver PPVT score, prenatal marijuana exposure during the first trimester, and child head circumference at birth. Significant differences in expressive language were observed at age 12 (p=.02) with children with BLL ≥5 μg/dL performing more poorly than those with BLL ≥5 μg/dL.
The overall model for BLL ≥ 5 μg/dL was significant for receptive language scores at 4, 6, 10 and 12 years adjusted for child age, gender, and race and caregiver PPVT score, and child head circumference at birth. Significant differences in receptive language were observed at ages 10 (p=.005) and 12 (p=.008) with children with BLL ≥5 μg/dL performing more poorly than those with BLL ≥5 μg/dL. See Figure 1.
Figure 1. Receptive Language scores of children with BLL less than 5 μg/dL (red dashed line) and greater than or equal to 5 μg/dL (blue solid line) with confidence intervals.

Figure 1 shows the differences between children with BLL less than 5 μg/dL and greater than or equal to 5 μg/dL on the receptive language scores at 4, 6, 10, and 12 years of age. The receptivel language scores were adjusted for child age, gender, child race, caregiver PPVT score, and child’s head circumference at birth. Mean scores and 95% Confidence Interval (CI) are shown. Significant differences in total language were observed at ages 10 (p=.005) and 12 (p=.008).
Comparisons of BLL <7 μg/dL (low lead levels) to children with BLL >7 μg/dL
We also compared children with BLL <7 μg/dL (low lead levels) to children with BLL≥7 μg/dL on receptive, expressive and total language scores at 4, 6, 10 and 12 years of age as this was the median BLL for our cohort. See Table 4 for the unadjusted mean language scores by BLL ≥ 7 μg/dL. As shown in Figures 2-a, 2-b, and 2-c, children with BLL ≥ 7 μg/dL performed significantly more poorly on total (2-a), expressive (2-b) and receptive (2-c) language scores at ages 10 and 12 than children with BLL < 7μg/dL, while controlling for covariates, with these lead findings not significant at 4 and 6 years of age.
Table 4.
Unadjusted Language Scores at Each Assessment by Blood Lead Level, M ± SD
| Age, years
|
||||
|---|---|---|---|---|
| 4 (n= 277) | 6 (n= 272) | 10 (n= 269) | 12 (n= 268) | |
| Receptive | ||||
| BLL ≥ 7 | 75.50 ± 16.28 | 94.96 ± 14.32 | 79.66 ± 12.44 | 75.46 ± 13.31 |
| BLL < 7 | 78.84 ± 15.50 | 98.51 ± 12.56 | 85.63 ± 11.55 | 81.03 ± 12.97 |
| p | .09 | .03 | < .0001 | .0007 |
| Expressive | ||||
| BLL ≥ 7 | 81.82 ± 14.55 | 80.17 ± 10.97 | 77.39 ± 14.66 | 74.35 ± 14.34 |
| BLL < 7 | 84.85 ± 12.45 | 84.23 ± 12.62 | 82.70 ± 14.31 | 80.23 ± 13.40 |
| P | .06 | .006 | .003 | .007 |
| Total | ||||
| BLL ≥ 7 | 78.33 ± 14.09 | 86.17 ± 12.83 | 76.99 ± 13.54 | 73.05 ± 14.16 |
| BLL < 7 | 81.26 ± 13.07 | 89.91 ± 12.21 | 83.01 ± 12.74 | 79.20 ± 13.15 |
| p | .08 | .015 | .0002 | .0003 |
Note: At 4 years the Clinical Evaluation of Language Fundamentals-Preschool (CELF-P; Wiig, Secord, & Semel, 1992) was administered. At 6 years the Comprehension Assessment of Spoken Language (CASL; Carrow-Woolfolk, 1999) was given. At 10 and 12 years of age, the Test of Language Development –Intermediate, 3rd Edition (TOLD-I:3; Hammill & Newcomer, 1997) was employed. p-value indicates significance between children with BLL ≥ 7 μg/dL vs children with BLL < 7μg/dL at each assessment.
Figure 2-a. Total Language scores of children with BLL less than 7 μg/dL (red dashed line) and greater than or equal to 7 μg/dL (blue solid line) with confidence intervals.

Figure 2-a shows the differences between children with BLL less than 7 μg/dL and greater than or equal to 7 μg/dL on the total language scores at 4, 6, 10, and 12 years of age. The total language scores were adjusted for child age, gender, child race, caregiver PPVT score, PPVT*child age, maternal GSI at birth, child age and child’s head circumference at birth. Mean scores and 95% Confidence Interval (CI) are shown. Significant differences in total language were observed at ages 10 (p=.003) and 12 (p=.004).
Figure 2-b. Expressive Language scores of children with BLL less than7 μg/dL (red dashed line) and greater than or equal to 7 μg/dL (blue solid line) with confidence intervals.
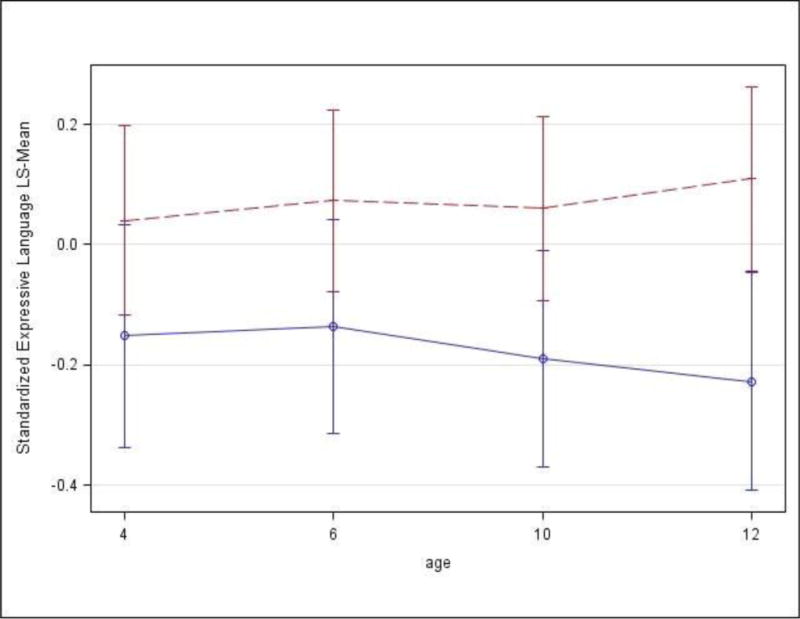
Figure 2-b depicts the differences between children with BLL less than 7 μg/dL and greater than or equal to 7 μg/dL on the expressive language scores at 4, 6, 10 and 12 years of age. Expressive language scores were adjusted for adjusted for child age, gender, and race, caregiver PPVT score, prenatal marijuana exposure during 1st trimester, and child head circumference at birth. Mean scores and 95% Confidence Interval (CI) are shown. Significant differences in expressive language were observed at ages 10 (p=.04) and 12 (p=.007).
Figure 2-c. Receptive Language scores of children with BLL less than 7 μg/dL (red dashed line) and greater than or equal to 7 μg/dL (blue solid line) with confidence intervals.

Figure 2-C illustrates the differences between children with BLL less than 7 μg/dL and greater than or equal to 7 μg/dL on the receptive language scores at 4, 6, 10 and 12 years of age. Receptive language scores were adjusted for child age, gender, and race, caregiver PPVT score, and child head circumference at birth. Mean scores and 95% CI on receptive language are shown. Significant differences in expressive language were observed at age 10 (p=.0003) and 12 (p=.005).
Discussion
What this study adds to the literature
This study contributes to what is known about lead exposure and language skills by employing a longitudinal, low SES cohort of children at risk for lead exposure. An association between early EBL and later language skills at 10 and 12 years of age was demonstrated. Receptive and expressive language skills were examined separately, to examine the impact that EBL has on specific language domains. A plethora of potential confounding factors (i.e. child age, race, gender, maternal vocabulary and psychological distress, and prenatal drug exposure) were statistically controlled for to clarify the association between lead and language skills. After controlling for these covariates, lead was related to language outcomes. Finally, we examined BLL as a dichotomous variable to understand more fully the associations of lead with language at two cut-off points. Using both the CDC’s level of concern (BLL AT ≥5 μg/dL) and the median lead level in this cohort 9 ≥7 μg/dL) an association between language skills and lead levels at both levels was obtained. A more striking relationship was observed at higher BLL. The following hypotheses were examined:
Hypothesis 1: Higher lead levels are related to poorer language outcomes
Consistent with our hypotheses and existing literature, EBL had a negative association with language skills from early childhood through 12 years of age. Employing BLL as a continuous variable allowed us to highlight the relationship between BLL and language skills across a broad developmental continuum (4–12 years of age).
Hypothesis 2: Lead levels of 5 μg/dL or greater will have poorer language outcomes than children with lower lead levels
First lead levels were examined at <5 and ≥5 μg/dL, which is the BLL of concern stated by the CDC. Significant differences between groups were observed for receptive language at 10 and 12 years of age, but were not significant at 4 and 6 years of age. When lead levels were dichotomized at a higher level (the median group level) of <7 and ≥7 μg/dL, significant differences between the two groups were observed on all language scores (receptive, expressive and total language scores) at 10 and 12 years of age but again did not reach significance at 4 and 6 years. Early lead exposure was associated with both receptive and expressive language skills suggesting that the result of lead exposure was broad and not restricted to a single language domain. The adverse influences of lead on language become more prominent as demands for language skills increase during late childhood and early adolescence.
Our findings are in agreement with the study by Min and colleagues (2009) who found that decrements in verbal IQ with EBL were not apparent until 11 years of age, while non-verbal reasoning decrements were observed earlier at 4–9 years of age in this cohort. Similarly in a different sample, Ernhart and Greene (1990) also failed to find differences on language measures in early childhood (1, 2, and 3 years of age) in children with low-level lead exposure from an similar environment. One explanation may be that other factors more strongly influence language development in early childhood including quality of the language environment provided by caretakers. An alternative explanation may be that measures of language development are not sensitive enough at a young age to identify subtle differences in language development between children with EBL and those without EBL, with improved sensitivity noted for older children.
Children with early lead exposure at a moderate level have been shown to score poorly on the end of fourth-grade standardized tests (Amato et al., 2012). The school-age child is faced with increasing language demands as literacy is acquired. Written language skills become essential to academic achievement. As the child progresses through school, texts become more complex and more discipline specific. The gap between children with poor language skills in early childhood intensifies by adolescence. Our findings are in agreement with those of Coscia and colleagues (2003) who reported a decline in verbal comprehension and vocabulary at 15 years in adolescents with lead exposure in the early childhood period.
The language-learning environment may positively or negatively impact the child’s language skills from early childhood to 12 years of age. Children from the inner city and low SES appear to be particularly at risk for language impairments. Higher socioeconomic status and higher maternal IQ were both related to better cognitive and language scores independent of lead exposure (Coscia et al, 2003). Previous research has demonstrated that an enriched environment was protective against lead induced neurotoxicity in young rats (Schneider, Lee, Anderson, Zuck, & Lidsky, 2001). Studies employing animal models have also demonstrated that an enriched environment ameliorated the neurobehavioral outcomes of lead exposure. Generalizing these findings to children and drawing on early intervention research (Ramsey, 2014) it is quite likely that early intervention with children who have EBL may mitigate later language problems (Schneider, Lee, Anderson, Zuck, & Lidsky, 2001).
In our study, the caregiver’s vocabulary was directly related to the child’s language skills, with higher caregiver vocabularies related to better language outcomes. The caregiver’s psychological distress and symptomatology level negatively impacted the child’s language skills at 6, 10 and 12 years of age. Other studies have reported that low SES is associated with parenting psychological distress and symptomatology that impacts language development especially in the domains of vocabulary, phonological awareness and syntax (Perkins, Finegood, & Swain, 2013). These findings suggest that early intervention targeting decreasing maternal psychological distress and symptomatology and increasing the quality of the language environment may temper the influence of early lead exposure across the developmental trajectory.
No interaction effects were observed between lead and prenatal alcohol, tobacco, marijuana, or cocaine exposure. In the current sample, prenatal exposure to these drugs neither exacerbated nor reduced the association of lead on language. This is in agreement with an earlier study by Bandstra and colleagues (2002) that reported that dichotomized lead levels<10 μg/dL and >10 μg/dL did not impact effects of prenatal cocaine exposure on language skills. Gender did not mediate the relationship of EBL to language, with both boys’ and girls’ language skills equally affected by EBL.
Strengths and Limitations
One strength of this study is the large well-characterized cohort followed prospectively with excellent retention from birth to twelve years of age. This allowed us to observe the association between lead and language at different developmental stages. Another strength of this study was that we were able to control for a large number of risk factors associated with less than optimal language development, including prenatal drug exposure (i.e. alcohol, tobacco, marijuana and cocaine), low SES, and maternal/caregiver variables (i.e. vocabulary and psychological distress and symptomatology level).
Limitations of the study include use of a single blood lead level at 4 years of age. Without multiple blood lead levels, we are not able to determine whether there is variability in language outcomes as a function of fluctuations in blood lead levels. While somewhat concerning, the data that is currently available (Lanphear, Dietrich, Auinger, & Cox, 2000) is suggestive of stability in blood lead levels across the developmental continuum. Future studies should include multiple tests of blood lead levels across the developmental continuum in order to more precisely examine whether levels change and the impact this may have on development. Another limitation in the current study was that the range of BLL did not extend to higher lead blood levels such as >25 μg/dL. Thus, we did not examine children with extremely high blood lead levels. We did not have information on prenatal lead exposure, which might have devastating consequences. The use of standardized tests may present with a racial bias. To control for this bias, language raw scores were internally standardized by creating z-scores for all children at each time point. Finally, this study was conducted on children in an urban environment and findings might not generalize to a more rural population.
Conclusions
The present study provides additional evidence on the adverse influence of early lead exposure on language development. It adds to the current literature in that it documents that the decline in language performance with EBL at early childhood persists into adolescence and is observed for both receptive and expressive language skills. The long-term outcomes of early lead exposure may not be evident until later in development.
Findings also indicate that language skills may be modified by environmental factors, with positive effects of maternal vocabulary and negative effects of caregiver psychological distress and symptomatology level noted. Early screening for blood lead levels, even low levels, appears warranted to identify and intervene with children at risk for language difficulties and related academic and literacy deficits.
High-risk population such as the one in this study, in particular, should be tested for lead exposure prior to school entry by the local health department. Further, community based educational programs should be developed to address the origins and influence of lead exposure and to determine how to identify and reduce lead exposure among children.
Highlights.
Elevated blood lead levels have a lasting negative impact on language skills.
The effects of lead exposure on language becomes more evident in later childhood.
Other factors such as maternal vocabulary may positively influence language skills.
Caregiver’s psychological distress may negatively impact language skills.
Abbreviations
- BLL
blood lead levels
- EBL
elevated blood lead levels
- PCE
prenatal cocaine exposure
- NCE
no cocaine exposure
- FIML
Full-information maximum likelihood
Footnotes
Publisher's Disclaimer: This is a PDF file of an unedited manuscript that has been accepted for publication. As a service to our customers we are providing this early version of the manuscript. The manuscript will undergo copyediting, typesetting, and review of the resulting proof before it is published in its final citable form. Please note that during the production process errors may be discovered which could affect the content, and all legal disclaimers that apply to the journal pertain.
References
- Amato MS, Moore CF, Magzamen S, Imm P, Havlena JA, Anderson HA, Kanarek MS. Annals of Epidemiology. 2012;22:738–743. doi: 10.1016/j.annepidem.2012.07.004. [DOI] [PMC free article] [PubMed] [Google Scholar]
- Bandstra ES, Morrow CE, Vogel AL, Fifer RC, Ofir AY, Dausa AT, Xue L, Anthony JC. Longitudinal influence of prenatal cocaine exposure on child language functioning. Neurotoxicology andTeratology. 2002;24:297–308. doi: 10.1016/s0892-0362(02)00192-7. [DOI] [PubMed] [Google Scholar]
- Boutwell BB, Beaver KM, Barnes JC. The association of parent-reported lead exposure with language skills and externalizing behavioral problems in children. Journal of Geography and Natural Disasters. 2014;4(2) [Google Scholar]
- Bullard RD, Johnson GS. Environmental justice: Grassroots activism and its impact on public policy decision making. Journal of Social Issues. 2000;56(3):555–578. [Google Scholar]
- Cadwell B, Bradley R. Home Observation for Measurement of the Environment. Revised. Little Rock, AK: University of Arkansas Press; 1984. [Google Scholar]
- Campbell TF, Needleman HL, Riess JA, Tobin MJ. Bone lead levels and language processing performance. Developmental Neuropsychology. 2000;18(2):171–186. doi: 10.1207/S15326942DN1802_2. [DOI] [PubMed] [Google Scholar]
- Carrow-Woolfolk E. Comprehensive Assessment of Spoken Language. Circle Pines, MN: American Guidance Service, Inc; 1999. [Google Scholar]
- Center for Disease Control and Prevention. What do parents need to know to protect their children? http://www.cdc.gov/nceh/lead/ACCLPP/blood_lead_levels.htm.
- Coscia JM, Ris MD, Suecop P, Deitrich KN. Cognitive development of lead exposed children from ages 6 to 15: an application of growth curve analysis. Child Neuropsychology. 2003;9(1):10–21. doi: 10.1076/chin.9.1.10.14498. [DOI] [PubMed] [Google Scholar]
- Derogatis I. The Brief Symptom Inventory: administration, scoring and procedures manual- II. Baltimore, MD: Clinical Psychometric Research; 1992. [Google Scholar]
- Dietrich KN, Succop PA, Berger OG, Keith RW. Lead exposure and the central auditory processing abilities and cognitive development of urban children: the Cincinnati lead cohort at age 5 years. Neurotoxicology and Teratology. 1992;14:51–56. doi: 10.1016/0892-0362(92)90028-9. [DOI] [PubMed] [Google Scholar]
- Dunn LM, Dunn DM. Peabody Picture Vocabulary Test – III. Circle Pines, MN: American Guidance Service, Inc; 1997. [Google Scholar]
- Dzwilewski KLC, Schnatz SL. Prenatal chemical exposures and child language development. Journal of Communication Disorders. 2015;57:41–65. doi: 10.1016/j.jcomdis.2015.07.002. [DOI] [PMC free article] [PubMed] [Google Scholar]
- Ernhart CB, Greene T. Low-level lead exposure in the prenatal and early preschool periods: language development. Archives of Environmental Health. 1990;45(6):342–354. doi: 10.1080/00039896.1990.10118753. [DOI] [PubMed] [Google Scholar]
- Gahyva DLC, Crenitte PAP, Caldana ML, Hage SRV. Characterization of language disorders in children with lead poisoning. Pro-Fono Revista de Atualizacao Cientifica. 2008;20(1):55–60. doi: 10.1590/s0104-56872008000100010. [DOI] [PubMed] [Google Scholar]
- Gilbert SG, Weiss B. A rationale for lowering the blood lead action level from 10 to 2 μg/dL. NeuroToxicology. 2006;27:693–701. doi: 10.1016/j.neuro.2006.06.008. [DOI] [PMC free article] [PubMed] [Google Scholar]
- Hammill DD, Newcomer PL. Test of Language Development- Intermediate. Third. Austin, TX: Pro-Ed; 1997. [Google Scholar]
- Hobel CJ, Hyvarinen MA, Okada DM, Oh W. Prenatal and intrapartum high risk screening, I: Prediction of the high-risk neonate. American Journal of Obstetrics and Gynecology. 1973;117:1–9. doi: 10.1016/0002-9378(73)90720-5. [DOI] [PubMed] [Google Scholar]
- Hollingshead AB. Four factor index of social status. Department of Social Work, Yale University; New Haven, CT: 1975. Unpublished manuscript. [Google Scholar]
- Hou S, Yuan L, Jin P, Ding B, Qin B, Li L, Liu X, Wu Z, Zhao G, Deng Y. A clinical study of the effects of lead poisoning on the intelligence and neurobehavioral abilities of children. Theoretical Biology and Medical Modelling. 2013;10:13. doi: 10.1186/1742-4682-10-13. [DOI] [PMC free article] [PubMed] [Google Scholar]
- Hubbs-Tait L, Mulugeta A, Bogale A, Kennedy TS, Baker ER, Stoecker BJ. Main and interaction effects of iron, zinc, lead and parenting on children’s cognitive outcomes. Developmental Neuropsychology. 2009;34(2):175–195. doi: 10.1080/87565640802646759. [DOI] [PubMed] [Google Scholar]
- Kamhi AG, Catts HW. Language and Reading Disabilities. Pearson Education Inc.; Boston: 2012. [Google Scholar]
- Koger SM, Schettler T, Weiss B. Environmental toxicants and developmental disabilities: A challenge for Psychologists. American Psychologist. 2005 Apr;60(3):243–255. doi: 10.1037/0003-066X.60.3.243. [DOI] [PubMed] [Google Scholar]
- Lanphear BP, Dietrich K, Auinger P, Cox C. Cognitive deficits associated with blood lead levels <10μ/dL in US children and adolescents. Public Health Report. 2000;115:521–529. doi: 10.1093/phr/115.6.521. [DOI] [PMC free article] [PubMed] [Google Scholar]
- Lanphear BP, Hornung R, Khoury J, Yolton K, Baghurst P, Bellinger DC, Canfield RL, Dietrich KN, Bornschein R, Greene T, Rothenberg J, Needleman HL, Schnaas L, Wasserman G, Graziano J, Roberts R. Low-level environmental lead exposure and children’s intellectual function: an internaltional pooled analysis. Environmental Health Perspectives. 2005;113(7):894–899. doi: 10.1289/ehp.7688. [DOI] [PMC free article] [PubMed] [Google Scholar]
- Lewis BA, Minnes S, Short EJ, Min MO, Wu M, Lang A, Weishampel P, Singer LT. Language outcomes at 12 years for children exposed prenatally to cocaine. Journal of Speech, Language, and Hearing Research. 2013;56:1662–1676. doi: 10.1044/1092-4388(2013/12-0119). [DOI] [PMC free article] [PubMed] [Google Scholar]
- Mahaffey KR, Annest JL, Roberts J, Murphy RS. National estimates of blood lead levels: United States, 1976–1980: association with selected demographic and socioeconomic factors. New England Journal of Medicine. 1982;307:573–579. doi: 10.1056/NEJM198209023071001. [DOI] [PubMed] [Google Scholar]
- McLaine, P., Navas-Acien, A., Lee, R., Simon, P., Diener-West, M., & Agnew, J. (2013)., 131(6), 1081–1089.
- Mickey RM, Greenland S. The impact of confounder selection criteria on effect estimation. American Journal of Epidemiology. 1989;129(1):125–137. doi: 10.1093/oxfordjournals.aje.a115101. [DOI] [PubMed] [Google Scholar]
- Min MO, Singer LT, Kirchner HL, Minnes S, Short E, Hussain Z, Nelson S. Cognitive development and low-level lead exposure in poly-drug exposed children. Neurotoxicology and Teratology. 2009;21:225–231. doi: 10.1016/j.ntt.2009.03.002. [DOI] [PMC free article] [PubMed] [Google Scholar]
- Minnes S, Singer LT, Arendt R, Farkas K, Kirchner HL. Effects of cocaine/poly drug use on maternal-infant feeding interaction over the first year of life. Journal of Developmental and Behavioral Pediatrics. 2005;26:194–200. doi: 10.1097/00004703-200506000-00005. [DOI] [PMC free article] [PubMed] [Google Scholar]
- National Center for Health Statistics. Annest JL, Mahaffey KR. Blood lead levels for persons 6 months to 74 years in the United States, 1976–1980. Washington DC: US Government Printing Press; (Vital and Health Statistics Series 11, Public Health Service). [Google Scholar]
- Needleman HL, Gunnoe C, Leviton A, Reed R, Peresie H, et al. Deficits in psychologic and classroom performance of children with elevated dentine lead levels. New England Journal of Medicine. 1979;300:689–695. doi: 10.1056/NEJM197903293001301. [DOI] [PubMed] [Google Scholar]
- Perkins SC, Finegood ED, Swain JE. Poverty and language development: Roles of parenting and stress. Innovations in Clinical Neuroscience. 2013;10(4):10–19. [PMC free article] [PubMed] [Google Scholar]
- Ramsey CT. Preventing intellectual disabilities starting in infancy: Results from randomized controlled Abecedarian trials. Global Education Review. 2014;2(4):1–20. [Google Scholar]
- Raymond J, Wheeler W, Brown MJ. Lead screening and prevalence of blood lead levels in children aged 1–2 years- Child blood lead surveillance system, United States, 2002–2010 and National Health and Nutrition Examination Survey, United States, 1999–2010. Center for Disease Control and Prevention, Morbidity and Mortality Weekly Report. 2014 Sep 12;201463(02):36–42. [PubMed] [Google Scholar]
- Schneider JS, Lee MH, Anderson DW, Zuck L, Lidsky TI. Enriched environment during development is protective against lead-induced neurotoxicity. Brain Research. 2001;896:48–55. doi: 10.1016/s0006-8993(00)03249-2. [DOI] [PubMed] [Google Scholar]
- Singer LT, Nelson S, Short E, Min MO, Lewis B, Russ S, Minnes S. Prenatal cocaine exposure: Drug and environmental effects at 9 years. Journal of Pediatrics. 2008;153:105–111. doi: 10.1016/j.jpeds.2008.01.001. [DOI] [PMC free article] [PubMed] [Google Scholar]
- Stansfield KH, Pilsner JR, Lu Q, Wright RO, Guilarte TR. Dysregulation of BDNF-TrkB signaling in developing hippocampal neurons by Pb2 Implications for an environmental basis of neurodevelopmental disorders. Toxicological Sciences. 2012;127(1):277–295. doi: 10.1093/toxsci/kfs090. [DOI] [PMC free article] [PubMed] [Google Scholar]
- Wechsler D. Wechsler Adult Intelligence Scale – Revised. San Antonio, TX: The Psychological Corporation; 1989. [Google Scholar]
- Wiig EH, Secord W, Semel E. Clinical Evaluation of Language Fundamentals-Preschool. San Antonio, TX: The Psychological Corporation; 1992. [Google Scholar]
- Wothke W. Longitudinal and multi-group modeling with missing data. In: Little TD, Schnabel KU, Baumert J, editors. Modeling longitudinal and multiple group data: Practical issues, applied approaches and specific examples. Mahwah, NJ: Lawrence Erlbaum Associates; 1998. pp. 219–240. [Google Scholar]
- Yuan W, Holland SK, Cecil KM, Dietrich KN, Wessel SD, Altaye M, Hornung RW, Ris MD, Egelhoff JC, Lanphear BP. The impact of early childhood lead exposure on brain organization: a functional magnetic resonance imaging study of language function. Pediatrics. 2006;118(3):971–977. doi: 10.1542/peds.2006-0467. [DOI] [PubMed] [Google Scholar]
- Zhu X, Liu X, Wei F, Wang F, Merzenich MM, Schreiner CE, Sun X, Zhou X. Perceptual training restores impaired cortical temporal processing due to lead exposure. Cerebral Cortx. 2016;26:334–345. doi: 10.1093/cercor/bhu258. [DOI] [PMC free article] [PubMed] [Google Scholar]