

Abstract
Epigenetic regulation of chromatin states is thought to control gene expression programs during lineage specification. However, the roles of repressive histone modifications such as trimethylated histone lysine 20 (H4K20me3) in development and genome stability are largely unknown. Here we show that depletion of SET and MYND domain-containing protein 5 (SMYD5), which mediates H4K20me3, leads to genome-wide decreases in H4K20me3 and H3K9me3 levels and derepression of endogenous LTR and LINE repetitive DNA elements during differentiation of mouse embryonic stem (ES) cells. SMYD5 depletion resulted in chromosomal aberrations and the formation of transformed cells that exhibited decreased H4K20me3 and H3K9me3 levels and an expression signature consistent with multiple human cancers. Moreover, dysregulated gene expression in SMYD5 cancer cells was associated with LTR and endogenous retrovirus (ERV) elements and decreased H4K20me3. In addition, depletion of SMYD5 in human colon and lung cancer cells results in increased tumor growth and upregulation of genes overexpressed in colon and lung cancers, respectively. These findings implicate an important role for SMYD5 in maintaining chromosome integrity by regulating heterochromatin and repressing endogenous repetitive DNA elements during differentiation.
Keywords: SMYD5, H4K20me3, repetitive DNA, LTR, LINE, pluripotent, genome stability, cancer, tumorigenesis, tumor suppressor, epigenetics, chromatin, genomics, RNA-Seq, ChIP-Seq, gene expression, embryoid body, differentiation, histone methyltransferase, tumor, teratoma, mammosphere 3D culture, shRNA, lentiviral transduction, spectral karyotyping, FISH
INTRODUCTION
Mammalian DNA is packaged into two classes of chromatin: euchromatin, which is open and transcriptionally active, and heterochromatin, a densely packed chromatin structure that is largely refractory to transcription factor binding and transcription [1]. Heterochromatin is located at specific chromosomal features such as centromeres and telomeres and interspersed throughout the genome [2]. Heterochromatin is an integral player in the regulation of gene expression [3], and it promotes genome integrity by stabilizing DNA repeats by inhibiting recombination between homologous DNA repeats [4].
Chromatin compaction is regulated in part by histone modifications, such as H4K20 and H3K9 methylation, which are enriched at heterochromatin regions. H4K20 methylation is involved in several cellular functions such as heterochromatin formation and chromosome condensation[5], transcriptional activation and repression [6], genome stability[7], DNA replication[8], and DNA repair [9]. The sequential methylation of H4K20me1 and H4K20me2, by Suv420h1 or Suv420h2, which catalyze H4K20me3, supports the formation of pericentric hetereochromatin [7]. H4K20me3 marks also repress transcription of repetitive elements [10].
SMYD5 (SET and MYND domain-containing protein 5) mediates H4K20me3 marks at LINE/LTR repetitive DNA sequences[11]. SMYD5 promotes mouse embryonic stem (ES) cell self-renewal by silencing lineage-specific gene expression: SMYD5 is recruited by LINE and LTR repetitive DNA elements to the vicinity of differentiation genes and keeps them silenced by depositing H4K20me3 marks. SMYD5 regulates heterochromatin formation and silencing of endogenous retroviruses (ERVs) in ES cells by mediating H4K20me3 marks and interacting with chromatin repressors heterochromatin protein 1 (HP1) and the H3K9 methyltransferase G9a, respectively[11]. The ERV-silencing properties of the H3K9 methyltransferase ESET during differentiation [12], implicates a role for histone modifying enzymes in heterochromatin formation and silencing of repetitive DNA elements. However, it is unclear how SMYD5 regulates heterochromatin formation, and how it contributes to silencing of repetitive DNA elements and genome stability during differentiation.
Here, we demonstrate that depletion of SMYD5 results in decreased H4K20me3 levels and decreased H3K9me3 ChIP-Seq levels during ES cell differentiation. Depletion of SMYD5 causes chromosome aberrations and is accompanied by cell transformation during ES cell differentiation. Finally, resulting cancer cells display decreased H4K20me3 and H3K9me3 levels and the expression signature of SMYD5-depleted transformed cells is correlated with a number of human cancers and can predict patient survival outcome.
MATERIALS AND METHODS
Mouse ES cell culture
Mouse R1 ES cells were obtained from ATCC (2010) and stored in liquid nitrogen. R1 ES cells were cultured as previously described with minor modifications and used in this study from passage 30 to passage 42 [13]. Briefly, R1 ES cells were cultured on irradiated MEFs in DMEM, 15% FBS media containing LIF (ESGRO) at 37°C with 5% CO2. For ChIP experiments ES cells were cultured on gelatin-coated dishes in ES cell media containing 1.5 μM CHIR9901 (GSK3 inhibitor) for several passages to remove feeder cells. R1 ES cells have been tested for mycoplasma using a kit from Fisher (MycoFluor Mycoplasma Detection Kit). For embryoid body (EB) formation, ES cells were cultured in low attachment binding dishes to promote 3D formation in ES cell media without LIF. shSmyd5 cancer cells were cultured in DMEM media containing 15% FBS, glutamine, 2-mercaptoethanol, and non-essential amino acids.
Human ES cell culture
Human ES cells (H1) were obtained from Dr. Guokai Chen and stored in liquid nitrogen. H1 hESCs were cultured as previously described with minor modifications [14], and used in this study from passage 30 to 40. Briefly, H1 hESCs were cultured on Matrigel coated dishes in serum-free defined E8 media and passaged using EDTA[14]. H1 hESCs have been tested for mycoplasma using a kit from Fisher (MycoFluor Mycoplasma Detection Kit). For embryoid body (EB) formation, hESCs were cultured on low attachment binding dishes to promote 3D formation in E8 media for 2–3 days, and subsequently cultured in media containing high-glucose DMEM supplemented with 15% FBS, L-glutamine, non-essential amino acids, and β-mercaptoethanol. Human shSmyd5 cancer cells were cultured in DMEM media containing 15% FBS, glutamine, β-mercaptoethanol, and non-essential amino acids.
Human cancer and non-tumorigenic cell line culture
HCT-116, A549, and MCF7 cells were obtained from the NCI and stored in liquid nitrogen. HCT-116, A549, and MCF7 cells were cultured in media containing RPMI 1640, 5% FBS, and 1 mM L-Glutamine. A549 cells were used in this study from passage 4–15, and HCT-116 and MCF7 cells were passaged no more than 10–15 times. MCF10A cells, which were passaged no more than 10–15 times, were cultured in media containing DMEM/F12, 5% FBS, 20 ng/mL EGF, 1μg/mL hydrocortisone, 200 ng/mL cholera toxin, and 10 μg/mL insulin.
Lentiviral Transduction
Mouse R1 ES cells were transduced with lentiviral particles encoding shRNAs as described previously [11]. Briefly, shRNAs were cloned into the pSIH1-H1-puro Vector (System Biosciences) according to the manufacture’s protocol. To generate lentiviral particles, HEK 293T cells were co-transfected with an envelope plasmid (pLP/VSVG), packaging vector (psPAX2), and shRNA expression vector using lipofectamine 2000. Twenty-four to 48 hrs post transfection, the medium containing lentiviral particles was harvested and used to infect mouse ES cells. Twenty-four hours post transduction ES cells were stably selected in the presence of 1 μg/mL puromycin to generate a heteroclonal population. For Human ES cells (H1), the medium containing lentiviral particles was harvested and used to transduce hESCs for 4–6 hours. The E8 media was subsequently changed and post transduction hESCs were stably selected and maintained in the presence of 0.5 μg/mL puromycin to generate a heteroclonal population. For HCT-116, A549, and MCF7 cells, the medium (RPMI 1640, glutamine, and 5% FBS) containing lentiviral particles was used to transduce human cancer cells overnight. The media was subsequently changed and post transduction HCT-116, A549, and MCF7 cells were stably selected in the presence of 1 μg/mL puromycin to generate a heteroclonal population. For MCF10A cells, the medium (DMEM/F12, 5% FBS, 20 ng/mL EGF, 1μg/mL hydrocortisone, 200 ng/mL cholera toxin, and 10 μg/mL insulin) containing lentiviral particles was used to transduce MCF10A cells overnight. The media was subsequently changed and post transduction MCF10A cells were stably selected in the presence of 1 μg/mL puromycin to generate a heteroclonal population.
Teratoma and tumor formation
Mouse ES cells were cultured on gelatin coated dishes to remove feeder cells, dissociated into single cells, and 106 ES cells were injected subcutaneously into SCID-beige mice. After three to four weeks mice were euthanized and teratomas were washed and fixed in 10% buffered formalin. Teratomas were then embedded in paraffin. Thin sections were cut and stained with hematoxylin and eosin (H&E) using standard techniques. shSmyd5 cancer cell tumor formation was performed as described above for ES cells. Ten sections were cut from three different tumors (30 sections total). All animals were treated according to Institutional Animal Care and Use Committee guidelines approved for these studies at the National Heart, Lung, and Blood Institute and at Wayne State University.
Xenograft Tumor Model
Human colon and lung adenocarcinoma cell lines HCT-116 and A549, respectively, were dissociated into single cells and 106 cells were injected subcutaneously into female SCID-beige mice, aged 6–8 weeks, in accordance with Institution Animal Care and Use Committee guidelines under current approved protocols at Wayne State University. After several weeks (4–6), when the tumors grew to ~1 cm in diameter, mice were euthanized and tumors were washed in PBS and weighed.
DQ-collagen IV-based proteolytic activity assay
Mouse and human shSmyd5 cancer cells and control shLuc cells were serial diluted in the respective maintenance media, seeded in 350 μL/well of cold Matrigel and plated in a 24-well plate. Matrigel polymerization occurred after 30 min incubation at 37°C; 1 mL/well of maintenance medium (DMEM media containing 15% FBS, glutamine, 2-mercaptoethanol, and non-essential amino acids) was added and replenished every other day. The proteolytic activity of the Matrigel embedded cells was ascertained by first washing the cells with warm PBS and then incubating overnight in the presence or absence of DQ-collagen IV (10 μg/mL) in serum free, phenol red free DMEM at 37°C. DQ-collagen IV is a heavily fluorescein labeled collagen IV substrate which yields green fluorescence upon cleavage by matrix metalloproteinases (MMPs). The fluorescence resulting from the DQ-collagen IV cleavage was visualized using a Leica DMIRB fluorescence microscope equipped with the SPOT RT3 camera and the SPOT advanced software. The cell nuclei were counterstained with Hoechst or DAPI dye.
qRT-PCR expression analysis
RNA isolation and qRT-PCR were performed as previously described with minor modifications[11]. Briefly, total RNA was harvested from ES cells using an RNeasy Mini Kit or miRNeasy Mini Kit (Qiagen, Valencia, CA) and DNase treated using Turbo DNA-free (Ambion). Reverse transcription was performed using a Superscript III kit (Invitrogen, Carlsbad, CA). Primers used for qRT-PCR (Table S1) were designed using the Universal Probe Library Assay design Center (Roche) or Primer 3 (http://bioinfo.ut.ee/primer3-0.4.0/).
RNA-Seq analysis
RNA was harvested from shSmyd5 cancer cells as previously described for ES cells [11]. mRNA was purified using a Dynabeads mRNA purification kit (Invitrogen). Double-stranded cDNA was generated using a SuperScript Double-Stranded cDNA synthesis kit (Invitrogen). cDNA was end-repaired using the End-It DNA End-Repair kit (Epicentre), followed by addition of a single A nucleotide, and ligation of PE adapters (Illumina) or custom indexed adapters. PCR was performed using Phusion High Fidelity PCR master mix. RNA-Seq libraries were sequenced on Illumina GAIIX or HiSeq platforms according to the manufacture’s protocol. At least two biological replicates were performed for shSmyd5 cancer cells RNA-Seq experiments.
The “read per kilo bases of exon model per million reads” (RPKM) measure, as defined previously [15], was used to quantify the mRNA expression level of a gene from RNA-Seq data sets. Differentially expressed genes were identified using edgeR[16] with a false discovery rate (FDR) < 0.001 and fold-change (FC) > 2). Genes with RPKM < 3 in both conditions in comparison were excluded from this analysis. The RPBM measure (reads per base per million reads) was used to quantify RNA expression levels of LINE and LTR repeats from RNA-Seq data sets.
Oncomine
Differentially expressed genes between shSmyd5 cancer cells and shLuc EBs were evaluated using Oncomine software. shSmyd5 cancer repressed genes are underexpressed in shSmyd5 cancer cells and underexpressed in human lung adenocarcinoma versus normal lung [within the top 5% underexpressed; (p=3.44E-10) [17] and (p=1.12E-7)[18]], and underexpressed in additional human cancers including colon adenocarcinomas and invasive breast carcinomas versus normal colon and breast.
ChIP-Seq
ChIP-Seq experiments were performed as previously described with minor modifications [11]. The polyclonal H4K20me3 antibody (07-463) was obtained from Millipore. The polyclonal H3K9me3 (ab8898) antibody was obtained from Abcam. Briefly, ES cells were harvested and chemically crosslinked with 1 % formaldehyde (Sigma) for 10 minutes at 37°C and subsequently sonicated using a Misonix XL2020 sonifier and setting #5 (18 cycles: 30 second pulse time, 1 minute rest). Sonicated cell extracts were used for ChIP assays. ChIP-enriched DNA was end-repaired using the End-It DNA End-Repair kit (Epicentre), followed by addition of a single A nucleotide, and ligation of an indexed adapter. PCR was performed using Phusion High Fidelity PCR master mix. ChIP libraries were sequenced on an Illumina HiSeq platform according to the manufacture’s protocol. At least two biological replicates were performed for the H4K20me3 and H3K9me3 ChIP-Seq experiments.
Sequence reads were mapped to the mouse genome using bowtie2. To allow mapping to repetitive elements we used the default mode of bowtie2, which searches for multiple alignments, and reports the best one based on the alignment score (MAPQ) (http://bowtie-bio.sourceforge.net/bowtie2/manual.shtml).
ChIP-Seq read enriched regions were identified relative to Input DNA (sonicated chromatin) as previously described with minor modifications[11]. ChIP-Seq read enriched regions (peaks) were identified relative to Input DNA using “Spatial Clustering for Identification of ChIP-Enriched Regions” (SICER) software [19] with a window size setting of 200 bps, a gap setting of 400 bps and a FDR setting of 0.001. For a comparison of ChIP-enrichment between samples a fold-change threshold of 1.5 and an FDR setting of 0.001 were used. The RPBM measure (reads per base per million reads) was used to quantify the density of histone modification and SMYD5 binding at genomic regions from ChIP-Seq datasets. The Kolmogorov–Smirnov test was also performed to obtain p value statistics and compare densities at genomic regions.
DNA-Seq
Genomic DNA (gDNA) was harvested from shLuc ES cells and shSmyd5 cancer cells using the Promega Wizard Genomic DNA Purification Kit. gDNA was sonicated using a Diagenode Bioruptor and end-repaired using the End-It DNA End-Repair kit (Epicentre) and sequenced on an Illumina HiSeq platform according to the manufacture’s protocol as described above. DNA-Seq was performed using a read length of 75 bp. 275×106 and 253×106 reads were obtained for shLuc ES cells and shSmyd5 cancer cells, respectively. At least two biological replicates were performed for the shSmyd5 cancer cell DNA-Seq experiments.
Input-Seq
shLuc and shSmyd5 ES cells and shSmyd5 cancer cells were harvested and chemically crosslinked with 1 % formaldehyde (Sigma) for 10 minutes at 37°C and subsequently sonicated using a Misonix XL2020 sonifier and setting #5 (18 cycles: 30 second pulse time, 1 minute rest). Sonicated cell extracts were used for Input-Seq assays. Input DNA was end-repaired using the End-It DNA End-Repair kit (Epicentre) and sequenced on an Illumina HiSeq platform according to the manufacture’s protocol as described above. At least two biological replicates were performed for the shSmyd5 cancer cell Input-Seq experiments.
CNV-Seq
CNV-Seq software [20] with default settings (p-value < 0.001) was used to identify regions of copy number alteration. For CNV-Seq analysis of Input-Seq data, regions that increased at least two-fold were used for these analyses, while for CNV-Seq analysis of DNA-Seq data, regions that decreased at least two-fold were used for these analyses.
Annotation of Repetitive DNA Sequences
Repetitive DNA sequence classes (e.g. LINE, LTR), families (L1, ERVK), and names (e.g. L1Md_T, IAPLTR1) were defined according to the annotations provided by the UCSC Genome Browser and RepeatMasker (http://www.repeatmasker.org), which uses curated libraries of repeats such as Repbase (http://www.girinst.org/repbase/).
Spectral Karyotyping (SKY)
Preparation of mouse metaphase chromosome suspension, SKY probes, slide pre-treatment, slide denaturation, detection, and imaging have been described previously [21]. Numerical aberrations and structural aberrations were described according to nomenclature rules from Jackson Laboratories, Bar Harbor, ME: http://www.informatics.jax.org/mgihome/nomen/gene.shtml. Ploidy designations for chromosome numbers used in this study have been presented previously[22]. Loss of chromosomes (relative to cell ploidy) is classified as clonal when the identical chromosome is lost in three or more cells, and the gain of chromosomes as clonal when being present in two or more cells. Structural rearrangements must be detected in two or more cells to be classified as clonal changes.
Fluorescence in-situ-hybridization (FISH)
Whole chromosome paints for chromosomes X, 3, 6, 14, and 19 were used to further define several structural aberrations found by SKY. Protocols used in the preparation of mouse metaphase chromosome suspension, FISH probes, slide pre-treatment, slide denaturation, detection, and imaging are found at: http://www.riedlab.nci.nih.gov/index.php/protocols
Statistical analysis
We have applied the Kolmogorov–Smirnov test using R (https://cran.r-project.org/) to obtain p-value statistics and compare densities at genomic regions using ChIP-Seq data. Survival analysis was determined by log-rank (Mantel–Cox) analysis using Prism software. P < 0.05 was considered significant. ChIP-Seq: ChIP-Seq peaks were identified relative to Input DNA using SICER software [19] with a window size setting of 200 bps, a gap setting of 400 bps and a FDR setting of 0.001. For a comparison of ChIP-enrichment between samples a fold-change threshold of 1.5 and an FDR setting of 0.001 were used. RNA-Seq: Differentially expressed genes were identified using EdgeR (FDR < 0.001 & FC > 2)[25]. CNV-Seq: CNV-Seq software [20] with default settings (p-value < 0.001) was used to identify regions of copy number alteration. For CNV-Seq analysis of Input-Seq data, regions that increased at least two-fold were considered significant, while for CNV-Seq analysis of DNA-Seq data, regions that decreased at least two-fold were considered significant.
Availability of data
The sequencing data from this study have been submitted to the NCBI Gene Expression Omnibus (GEO) (http://www.ncbi.nlm.nih.gov/geo) under accession no. GSE94955.
RESULTS
SMYD5 safeguards genome integrity during ES cell differentiation
To test whether SMYD5 plays a role in safeguarding genome integrity, we evaluated the differentiation of SMYD5-depleted (short hairpin Smyd5; shSmyd5) ES cells relative to shLuc ES cells. RNAi knockdown resulted in decreased SMYD5 protein levels in shSmyd5 ES cells relative to shLuc ES cells (Figure 1A). Previously, we showed that embryoid body (EB) differentiation of SMYD5-depleted ES cells leads to complex structures containing bulges lined with a primitive endoderm (PE) layer[11]. Interestingly, by extending our EB assays from 14 to 21 days, we observed the formation of transformed-like cells during differentiation in the absence of SMYD5 (Figure 1Bi). These transformed colonies continued to emerge from the EBs and proliferate during the remainder of the culture period, and outnumbered the EBs after 21 days of culture.
Figure 1. Stochastic transformation of SMYD5 depleted ES cells during differentiation.
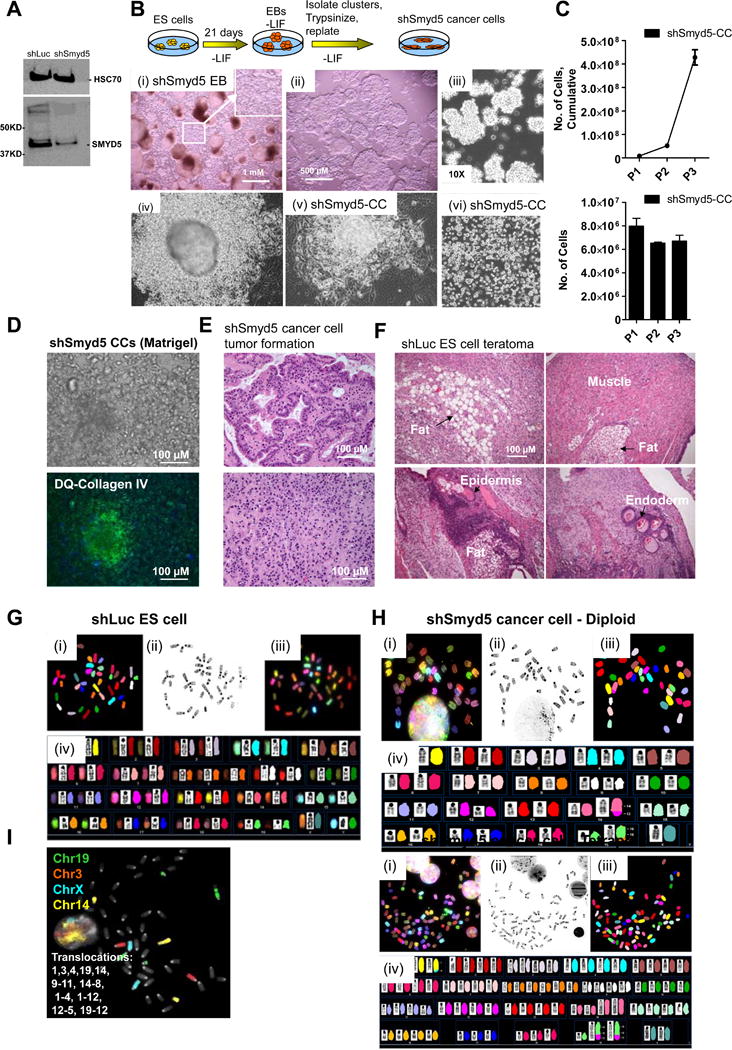
(A) Western blot of SMYD5 in shLuc and shSmyd5 ES cells. HSC70 was used as a loading control. (B) Schematic of experimental design. (i) Formation of atypical cellular aggregates which originated from cells budding off from the primitive endoderm (PE) layer of shSmyd5 EBs. (ii) Stereo- and (iii) bright field microscopy of shSmyd5-EB induced aggregates. (iv) Passaged shSmyd5-EB derived cancer cells. (C) Proliferation rate of shSmyd5 cancer cells was determined by passaging several times. (D) shSmyd5 cancer cells were embedded in Matrigel, and proteolytic activity was ascertained after incubating with DQ-collagen IV (see methods). Nuclei were stained with Hoechst dye. (E) H&E sectioned tumors generated from shSmyd5 cancer cells. (F) H&E histological sections of teratomas generated from shLuc ES cells. (G–H) Representative karyotype of a (G) control (shLuc) ES cell and (G) shSmyd5 hypo-diploid (top) and hypo-tetraploid (bottom) cancer cell analyzed by SKY. (i) RGB color display metaphase, (ii) inverted-DAPI stained metaphase (iii) pseudo-colored classification metaphase and (iv) karyotype of the same metaphase spread. (I) Whole chromosome paint analysis was used to define structural and numerical aberrations of chromosomes X, 3, 14, and 19 in shSmyd5 4n cancer cells.
To further characterize these transformed cells, we isolated small clumps of homogenously translucent and morphologically similar cells (Figure 1Bii–iii) and plated them on tissue culture dishes (Figure 1Biv–vi). In addition to their ability to proliferate in suspension, the transformed shSmyd5 cancer cells are capable of proliferating as a monolayer for an extended period of time (>2 months), and display a high proliferative rate (17.7 hour cell doubling time, Figure 1C). Likewise, the shSmyd5 cancer cells are also capable of proliferating for an extended period of time (>2 months) in suspension in an anchorage-independent manner as clusters of cells, which is indicative of transformation (Figure 1Bii–iii). Moreover, the shSmyd5 cancer cells proliferated in 3D Matrigel concentrically away from the original embedded cells protruding the matrix in all directions (Figure S1A, top). Concomitantly, matrix degradation occurred as evidenced by progressive degradation of the Matrigel layer, and green fluorescence was detected following incubation with DQ-collagen IV (Figure 1D, S1A, S1B). The observed proteolytic activity of shSmyd5 cancer cells in 3D Matrigel (Figure 1D; S1A, bottom, S1B) is most likely derived from cleavage of DQ-collagen IV by the membrane tethered 1-MMP (MMP14)/MMP2 axis, which has been extensively characterized[23] and has been shown to play a role in cell invasion[24]. In contrast, control (shLuc) ES cells, which were embedded in 3D Matrigel and cultured in LIF-independent media, formed EB structures, but they did not protrude the 3D Matrigel, and fluorescence was not detected following incubation with DQ-collagen IV (Figure S1C). Altogether, these results suggest that shSmyd5 cancer cells are transformed.
To evaluate the tumorigenicity of shSmyd5 cancer cells in vivo, we injected them subcutaneously into SCID-beige mice and observed the formation of tumors containing mainly adenocarcinoma-like cells (Figure 1E). In contrast, control shLuc ES cells form teratomas following subcutaneous injection into SCID-beige mice, which consist of a heterogeneous mixture of cells of the three germ layers, including ectoderm (keratinized epithelium, epidermis), mesoderm (muscle, adipocytes), and endoderm (glandular epithelium) (Figure 1F). To rule out the possibility that cell transformation was caused by an integration event that disrupted a tumor suppressor gene or by an off target effect of the shSmyd5 construct, we tested three different sequences to knock down Smyd5 [11] and all of them led to the formation of transformed cells (Figure S1D–G). As described above, while shLuc ES cells formed spherical EB structures containing a PE layer during early differentiation (day 6) (Figure S1E, left)[11], shSmyd5 ES cells formed structures containing bulges lined with a PE layer (Figure S1E, right). The clusters of transformed cells emerged from shSmyd5-1, shSmyd5-2, and shSmyd5-3 EBs (Figure S1F), but not shLuc EBs. Moreover, the transformed shSmyd5 cancer cells are capable of proliferating as a monolayer (Figure S1G). In addition, shSmyd5-3 cancer cells developed tumors containing adenocarcinoma-like cells in vivo following injection into SCID-beige mice (Figure S1H).
To investigate whether the transformed shSmyd5 cells are associated with any chromosomal aberrations, we performed spectral karyotyping (SKY) analysis, using previously defined nomenclature rules[22]. Sixteen control (shLuc) ES cell metaphase spreads analyzed by SKY revealed a diploid population (Figure 1G), while fourteen shSmyd5 cancer cell metaphase spreads analyzed by SKY revealed a polyclonal population of 50% near-diploid cells (2n=40; chromosome numbers ranged from 39–49) (Figure 1H, top) and 50% near-tetraploid cells (chromosome number ranged from 70–83) (Figure 1H, bottom). The shSmyd5 cells are of male origin, and in both cell populations, the Y chromosome was lost. In the diploid cell population, chromosomes that were clonally gained are X, 1, 2, 4, 12, and 19. Clonal structural aberrations involved chromosomes 12, 14, and 19 (Table S2). Structural aberrations involving chromosomes 14 and 19 were found to contain homogeneously staining regions (HSRs), which are typically indicative of gene amplifications. Chromosome 19 also was found by SKY to be deleted at the distal end of the chromosome (19D1).
In the tetraploid shSmyd5 cancer cells, more prevalent chromosome losses include chromosomes 10, 11, 13, 17 and 18, and a gain of chromosome 8 was found in 3/7 cells. The same structural aberrations involving chromosomes 14 and 19 were also found in the tetraploid cell population (Table S2). The main differences between the 2n and 4n shSmyd5 cancer cell populations is the increase of chromosome instability (CIN) in the 4n cells, which includes the presence of several novel unbalanced translocations and dicentric chromosomes in the 4n population. The dicentric chromosomes were complex in that they not only had amplifications of regions from chromosome 19 but were also fused to different chromosomes (2, 6, 8, and 12) (Table S2). In summary, all of the structural aberrations involving chromosomes 12, 14, and 19, resulted in an imbalance (gains and losses) of these chromosome sequences (Table S2).
Whole chromosome paints (WCP) for chromosomes X, 3, 6, 14, and 19 were used to further define several clonal aberrations found by SKY (Figure 1I). These FISH results confirmed the deletions and several translocations observed in the SKY analysis.
Copy number alterations in shSmyd5 cancer cells are associated with decreased H4K20me3/H3K9me3 and enriched with repetitive elements
Copy number alterations (CNA), which are a structural variation that is a source of genetic variation and disease susceptibility, are commonly found in cancer cells with compromised genome integrity [25]. To identify regions of CNA between shSmyd5 cancer cells and control (shLuc) ES cells, we performed whole-genome DNA sequencing (DNA-Seq). Using DNA-Seq, we obtained 7.75× and 7.13 coverage of the mouse genome for shLuc ES cells and shSmyd5 cancer cells, respectively. We then used copy number variation sequencing (CNV-Seq) software [20] to identify CNA regions. Using this approach, we found 3,427 CNA regions (size range of 7kb-2.26Mb; average size of 235 kb; median size of 15.9 kb) (Figure 2A; red and green). A number of the major deletions identified using SKY analysis involving chromosomes 9, 12, 14, 19 were also identified using DNA-Seq.
Figure 2. Chromosomal aberrations in shSmyd5 cancer cells are enriched at DNA repeats and are associated with an altered epigenomic landscape.
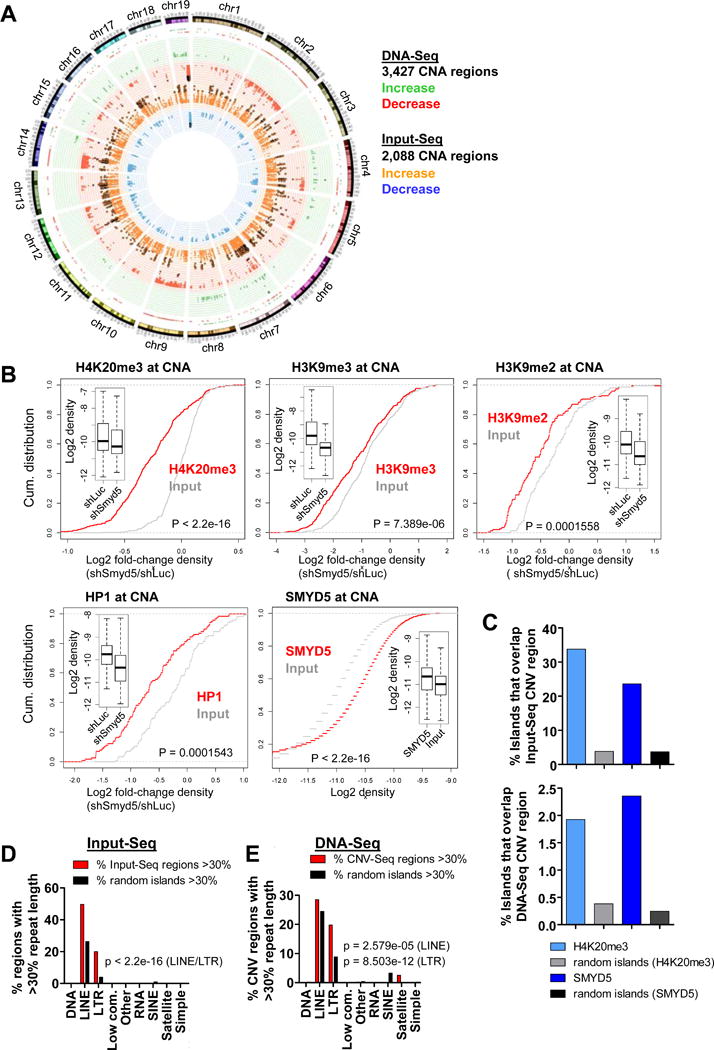
(A) CNA-Seq analysis of shSmyd5 cancer cells relative to shLuc ES cells. Circular genome map showing distributions of DNA copy number alterations (DNA-Seq; red and green, outer two histograms) and regions with open chromatin determined using CNV-Seq software (Input-Seq; orange and blue, inner two histograms). For DNA-Seq, red indicates copy number loss while green indicates copy number gain. For Input-Seq, blue indicates decreased enrichment of Input while orange indicates increased enrichment. (B) Empirical cumulative distribution for the fold-change of density of H4K20me3, H3K9me3, H3K9me2, and HP1 at CNA regions in shSmyd5 ES cells relative to shLuc ES cells, and SMYD5 density at CNA regions in ES cells. (C) Percentage of H4K20me3, SMYD5, or random genomic sequences of comparable size and frequency that overlap CNA regions obtained from Input-Seq (top) or DNA-Seq (bottom). CNA regions that increased 10-fold (Input-Seq; n=4,048) or decreased 8-fold (DNA-Seq; n=1,279) in shSmyd5 cancer cells relative to shLuc ES cells were used for these analyses. (D–E) LINE and LTR repetitive DNA sequences are enriched in CNA regions. Comparison of (D) Input-Seq and (E) DNA-Seq CNA enriched sequences (red) and annotated repetitive sequences between shSmyd5 cancer cells and shLuc ES cells relative to random regions (black). The percentage of CNA regions with at least 30% repeat length is shown for (D) Input-Seq and (E) DNA-Seq results. Note the predominance of LTR and LINE repetitive DNA sequences in the CNA-enriched islands.
To evaluate open chromatin regions we also sequenced ChIP input chromatin from shLuc ES cells, shSmyd5 ES cells and shSmyd5 cancer cells (Input-Seq). While we did not observe significant alterations in open chromatin between shLuc ES cells and shSmyd5 ES cells using CNV-Seq software, we found 2,088 regions (size range of 54kb-8.6Mb; average size of 682 kb, median size of 202.2 kb) between shSmyd5 cancer cells and shLuc ES cells (77% of altered Input-Seq regions increased in shSmyd5 cancer cells) (Figure 2A). These results suggest that shSmyd5 cancer cells may exhibit more decondensed chromatin relative to control (shLuc) ES cells. Because we did not identify any significant alterations in open chromatin between shLuc and shSmyd5 ES cells, we used shLuc ES cells as a control for shSmyd5 cancer cells.
We then investigated whether regions of altered Input-Seq chromatin compaction identified between shSmyd5 cancer cells and shLuc ES cells are correlated with SMYD5 binding and changes in H4K20me3, H3K9me3/2, and HP1 levels in shSmyd5 ES cells relative to shLuc ES cells at CNA-regions (Figure 2B). Using ChIP-Seq data we generated for shSmyd5 ES cells relative to shLuc ES cells[11], we found that H4K20me3, H3K9me3/2, and HP1 levels decrease at CNA regions and regions of altered Input-Seq open chromatin (Figure 2B). We also observed SMYD5 enrichment at regions of altered Input-Seq chromatin compaction (Figure 2B). Moreover, we also investigated whether there is an association between CNA regions or regions of altered Input-Seq open chromatin compaction and enrichment of H4K20me3 and SMYD5 by evaluating the percentage of H4K20me3 or SMYD5 islands that overlap the CNA regions or the regions of altered Input-Seq open chromatin compaction, respectively. These results show that 33% of H4K20me3 islands and 23% of SMYD5 islands overlap with altered Input-Seq regions (Figure 2C, top), and 2% of H4K20me3 islands and 2.4% of SMYD5 islands overlap with DNA-Seq CNA regions (Figure 2C, bottom). SMYD5 and H4K20me3 occupancy was markedly higher at CNA (DNA-Seq) and altered open chromatin regions (Input-Seq) relative to random genomic sequences of comparable size and frequency (Figure 2C), which were used as controls, demonstrating that SMYD5 and H4K20me3 are enriched at CNA and altered Input-Seq regions in shSmyd5 cancer cells.
Because H4K20me3 and SMYD5 are enriched at LINE and LTR repetitive DNA sequences [11], we characterized whether the CNA or Input-Seq regions contain known repetitive sequences. To this end, we evaluated the percentage of CNA or Input-Seq regions that contain at least 30% coverage of a repeat element. Indeed, the enrichment of LINE and LTR elements was significantly higher at these regions than at random genomic sequences, which were used as controls (Figure 2D–E). We also evaluated the percent coverage of LTR and LINE sequences for all CNA or Input-Seq regions, and observed enrichment of LTR and LINE sequences in Input-Seq (Figure S2A and S2B) and DNA-Seq (Figure S2C and S2D) CNA regions relative to random genomic regions. We also evaluated the percent coverage of ERVK and L1 sequences for all CNA or Input-Seq regions, and observed enrichment of ERVK and L1 sequences in altered Input-Seq regions (Figure S2E and S2F) and DNA-Seq CNA regions (Figure S2G and S2H) relative to random genomic regions.
Depletion of SMYD5 leads to decreased H4K20me3 and decreased H3K9me3 levels during differentiation
Next, we tested whether H4K20me3 and H3K9me3 is reduced in shSmyd5 cancer cells or shSmyd5 EBs relative to control EBs or ES cells using ChIP-Seq. These results revealed a global decrease of H4K20me3 (Figure 3A) and H3K9me3 (Figure 3B) in shSmyd5 EBs relative to shLuc EBs. Likewise, we observed a global decrease in H4K20me3 (Figure 3C) and H3K9me3 (Figure 3D) levels in shSmyd5 cancer cells relative to day 14 shLuc EBs. Average profiles (Figure 3E–F) or boxplots (Figure 3G–H) around H4K20me3 or H3K9me3 peaks also revealed global decreases in H4K20me3 (Figure 3E,G) and H3K9me3 (Figure 3F,H) levels during EB differentiation and in shSmyd5 cancer cells. Browser views show decreased levels of H4K20me3 and H3K9me3 (Figure 3I). These results demonstrate that depletion of SMYD5 leads to more pronounced decreases in H4K20me3 and H3K9me3 levels in EBs and shSmyd5 cancer cells relative to ES cells. However, we found that the protein levels of the H3K9 methyltransferase, G9a, were similar between shLuc and shSmyd5 ES cells (Figure S3A), and between shLuc and shSmyd5 EBs (Figure S3B), suggesting that changes in H3K9me3 levels in SMYD5-depleted cells is not due to altered expression of G9a.
Figure 3. Decreased H4K20me3 and H3K9me3 levels in SMYD5 knockdown EBs and shSmyd5 cancer cells.
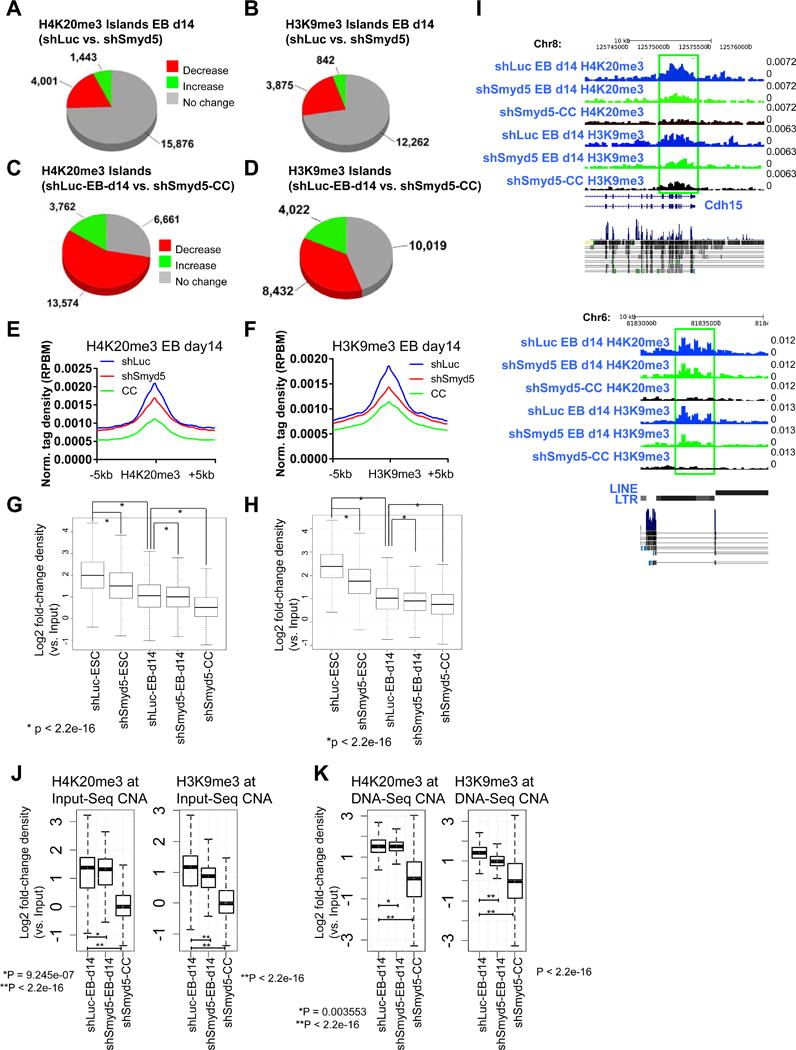
(A–B) Changes in the global distribution of (A) H4K20me3 and (B) H3K9me3 in shSmyd5 EBs relative to shLuc EBs, and (C) H4K20me3 and (D) H3K9me3 in shSmyd5 cancer cells relative to shLuc EBs. Average profile of (E) H4K20me3 and (F) H3K9me3 in shLuc and shSmyd5 EBs, and shSmyd5 cancer cells. Density of (G) H4K20me3 and (H) H3K9me3 in shLuc and shSmyd5 ES cells, shLuc and shSmyd5 EBs, and shSmyd5 cancer cells. P-value for all <2.2e–16. (I) Browser view of H4K20me3 and H3K9me3 levels in shLuc and shSmyd5 d14 EBs, and shSmyd5 cancer cells. (J–K) Density of H4K20me3 and H3K9me3 levels at (J) Input-Seq and (K) DNA-Seq CNA regions in shLuc EB d14, shSmyd5 EB d14, and shSmyd5 cancer cells.
Our data further show that H4K20me3 and H3K9me3 levels exhibit even greater decreases in shSmyd5 cancer cells relative to EBs at CNA regions (Figure 3J–K). These results suggest that the decrease in H4K20me3 during differentiation in the absence of SMYD5 is correlated with the formation of CNA regions in shSmyd5 cancer cells.
Depletion of SMYD5 leads to elevated expression of repetitive DNA elements during differentiation
While we previously demonstrated that SMYD5 mediates silencing of LTR and LINE repeat classes in ES cells[11], it is unknown whether SMYD5 silences repetitive DNA elements during differentiation. Therefore, we investigated whether decreased H4K20me3 leads to increased expression of LINE and LTR repeats in SMYD5 depleted EBs and shSmyd5 cancer cells. Our results show that SMYD5-depleted EBs and shSmyd5 cancer cells exhibit increased expression of L1 (Figure 4A) and ERVK repeat families (Figure 4B) and subfamilies (Figure C–D). Moreover, we observed similar expression profiles of ERVK (Figure S4A) and L1 repeats (Figure S4B) between different shSmyd5 cancer cell samples.
Figure 4. Elevated expression of repetitive LINE/LTR repetitive DNA elements in SMYD5 knockdown EBs and cancer cells.

Fold-change expression of (A) L1 and (B) ERVK repeat families in day 14 differentiated shLuc and shSmyd5 EBs, and in shSmyd5 cancer cells relative to day 14 differentiated control (shLuc) EBs. Fold-change expression of (C) L1 and (D) ERVK repeat subfamilies in day 14 shSmyd5 EBs (left), and in shSmyd5 cancer cells (right) relative to day 14 shLuc EBs. (E) Fold-change expression of full-length LTR internal features in day 14 shSmyd5 EBs (left), and in shSmyd5 cancer cells (right) relative to day 14 shLuc EBs. (F) qRT-PCR analysis of IAP expression in control (shLuc) ES cells and shSmyd5 cancer cells. (G) GREAT [26]gene ontology (GO) analysis of regions occupied by SMYD5/H4K20me3 in ES cells overlapping with LTR regions annotated by performing a de novo search for LTR retrotransposons/ERVs in the mouse genome using LTRharvest software, and annotating using LTRdigest software.
To investigate whether decreased H4K20me3 leads to increased expression of full-length, or intact, LTR retrotransposons and ERVs in SMYD5-depleted EBs and shSmyd5 cancer cells, we first performed a de novo search for full-length LTR retrotransposons and ERVs in the mouse genome using LTRharvest software (http://genometools.org/), and annotated internal features of these LTR regions using LTRdigest software. We then evaluated the expression of LTR internal annotated features in differentiated control EBs (shLuc) and SMYD5-depleted (shSmyd5), and in shSmyd5 cancer cells. These results reveal an increase in expression of LTR retrotransposons/ERV features including sequences encoding viral proteins such as gag and pol during EB differentiation of SMYD5 depleted cells (Figure 4E, left), and even higher expression levels of these elements in shSmyd5 cancer cells (Figure 4E, right). We also observed increased expression of IAP family of LTR retrotransposons in shSmyd5 cancer cells relative to ES cells (Figure 4F). These findings suggest that depletion of SMYD5 leads to decreased H4K20me3 levels and increased expression of the underlying LTR retrotransposon/ERV sequences.
To investigate a relationship between the de-repression of LTR retrotransposons/ERV regions, occupancy of SMYD5/H4K20me3, and cancer in humans, we evaluated the overlap between LTR regions and SMYD5/H4K20me3 occupancy. Using this method we found 955 regions which were occupied by SMYD5/H4K20me3 and contained LTR retrotransposons/ERV sequences[11]. We then used GREAT gene ontology software [26] to functionally annotate these regions, and found that genes within these regions were identified in a copy number alterations study of 191 breast tumor samples, and genes co-amplified within MYCN in primary neuroblastoma tumors (Figure 4G), suggesting that SMYD5-mediated repression of LTR retrotransposons/ERV regions, marked by H4K20me3, represses expression of nearby genes in mouse cells whose expression and copy number is positively correlated with human cancers.
To investigate whether loss of SMYD5-dependent silencing of LTR/ERV elements leads to upregulated expression of nearby genes, we evaluated the number of upregulated genes in shLuc day 14 EBs (control) and shSmyd5 cancer cells that contain LTR/ERV sequences within 10 kb of their transcriptional start site (TSS) (Figure 5A–B). Of the 3715 genes that were upregulated in shSmyd5 cancer cells relative to control EBs (1.5 fold-change, FDR<0.05), 880 genes (24%) contained LTR/ERV sequences (Figure 5A, left) and 645 genes (17%) contained LINE/L1 sequences (Figure 5A, right) within 10 kb of their TSS. Annotation of the LTR/ERV (Figure 5C, left) and LINE/L1 (Figure 5C, right) elements revealed that they mainly reside in intronic and intergenic regions. We then evaluated the expression state of LTR/ERV elements nearby differentially expressed genes. These results revealed an increase in the expression of LTR/ERV (Figure 5D, left) and LINE/L1 (Figure 5D, right) elements in cancer cells relative to control EBs (Figure 5D).
Figure 5. Upregulated genes in shSmyd5 cancer cells are associated with LTR/ERV elements and decreased H4K20me3.
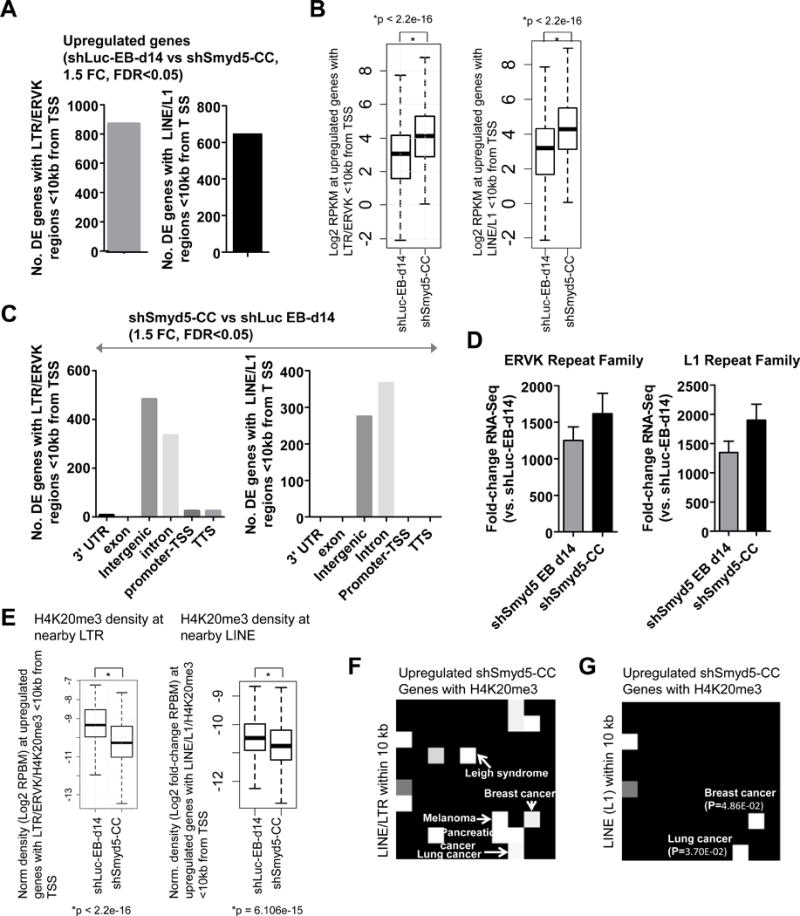
Loss of SMYD5-dependent silencing of LTR/ERV elements influences the expression of nearby genes. (A) Number of DE genes between shLuc EB d14 and shSmyd5 cancer cells (fold-change>1.5, p-value<0.05). (B) Expression of upregulated genes between shLuc EB d14 and shSmyd5 cancer cells. (C) Annotation of LTR/ERV elements nearby DE genes in shLuc and shSmyd5 ES cells, and shLuc EB d14 and shSmyd5 cancer cells using HOMER software. (D) Fold-change expression of LTR/ERV elements nearby DE genes relative to total mRNA. (E) Density of H4K20me3 marks nearby LTR/ERV element and within 10 kb of TSS of DE genes. (F–G) OMIM diseases expression analysis: Network2Canvas was used to evaluate upregulated genes (shSmyd5 cancer cells vs. shLuc EB d14) nearby H4K20me3 marks and (F) LTR/LINE and (G) LINE/L1 elements. Each node (square) represents a gene list associated with a gene-set library (OMIM diseases). The brightness (white) of each node is determined by its p-value.
Moreover, we also observed decreased H4K20me3 levels at nearby LTR/ERVK (Figure 5E, left) and LINE/L1 (Figure 5E, right) in shSmyd5 cancer cells (Figure 5E), suggesting that SMYD5-dependent control of H4K20me3 supports the repression of LTR/ERV elements of nearby genes. Overall, these results demonstrate that SMYD5 influences gene expression of nearby genes by silencing LTR/ERV elements.
Interestingly, the upregulated genes in shSmyd5 cancer cells, which contain H4K20me3 marks and LTR/LINE elements, are enriched in multiple human cancers (lung and breast cancer) (Figure 5F–G). These results suggest that SMYD5-dependent silencing of LTR/LINE elements represses the expression of a cancer transcriptional program during differentiation.
shSmyd5 cancer cell signature genes predict outcome of patient survival
To investigate whether shSmyd5-induced cell transformation is related to human cancers, we first identified differentially expressed genes between shSmyd5 cancer cells and shLuc and shSmyd5 ES cells and day 14 EB using RNA-Seq. K-means clustering followed by hierarchical clustering identified major patterns of gene expression variability (Figure 6A). Notably, shSmyd5 cancer cells expressed a number of MMPs, namely MMP23, MMP2, MMP14, MMP19 and MMP24. The observed proteolytic activity of shSmyd5 cancer cells in 3D Matrigel (Figure 1D, S1A) is most likely due to the membrane tethered 1-MMP (MMP14)/MMP2 axis, which has been shown to play a role in cell invasion [24].
Figure 6. Integrative transcriptomic analysis reveals that a loss of SMYD5 is associated with a poor cancer prognosis.
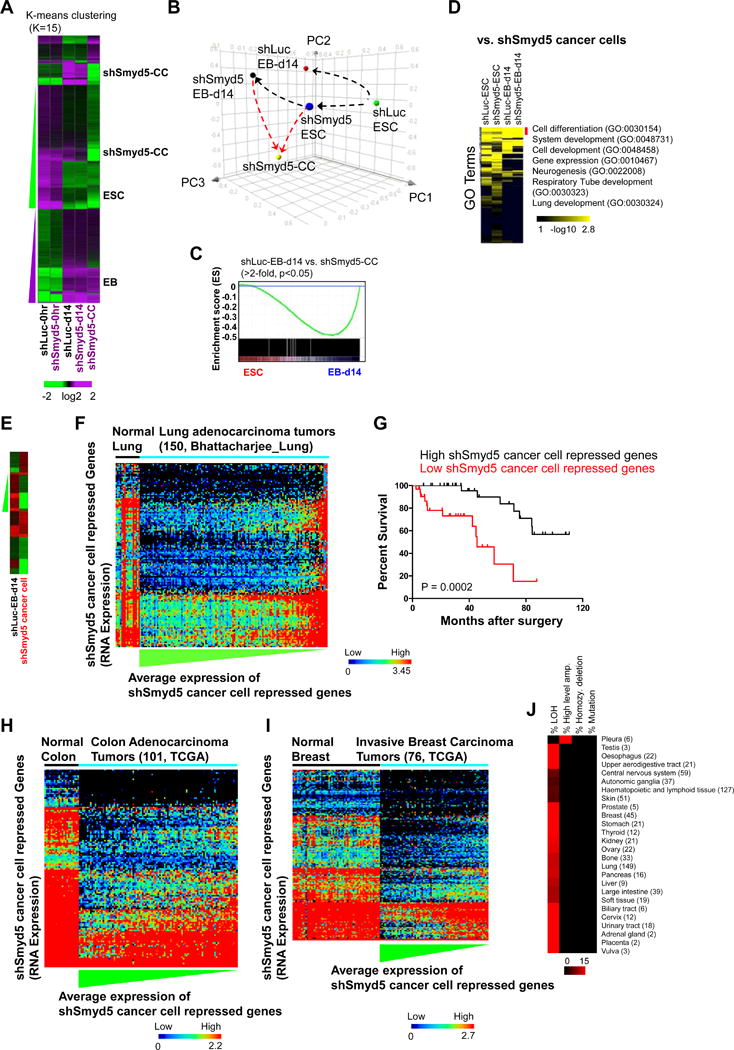
(A) Analysis of RNA-Seq data. Differentially expressed (DE) genes (FDR <0.001; fold change >1.5) were clustered according to k-means. (B) PCA analysis of DE genes. (C) GSEA analysis of differentially expressed genes between shSmyd5 cancer cells and shLuc d14 EB. (D) DAVID Gene ontology (GO) functional annotation of DE genes. (E) Heat map of DE genes (FDR <0.001; fold change >1.5) between shSmyd5 cancer cells and shLuc EB day 14 (green, decrease; red, increase). (F) Representative dataset from a meta-analysis of public mRNA expression data from human lung adenocarcinoma tumors with known clinical outcomes using Oncomine. DE genes between shSmyd5 cancer cells and shLuc EB d14 (>1.5 fold-change, FDR < 0.001) were evaluated using Oncomine software (see Methods section for details). Heat map: shSmyd5 cancer cell repressed genes were ordered by hierarchical clustering and tumors were sorted by average expression of shSmyd5 cancer cell repressed genes from low (blue) to high (red). (G) The lung adenocarcinoma datasets were divided into two groups: those with high (top 10%) and those with low (bottom 10%) expression of shSmyd5 cancer cell repressed genes. Kaplan-Meier curves for the overall survival of patients with lung adenocarcinoma tumors exhibiting high (top 10%, “High shSmyd5 cancer cell repressed”, black) or low (bottom 10%, “Low shSmyd5 cancer cell repressed”, expressed) expression of shSmyd5 cancer cell repressed genes are shown. (H–I) Representative datasets from meta-analyses of TCGA mRNA expression datasets derived from (H) human colon adenocarcinoma tumors and normal colon tissue, and (I) human invasive breast carcinoma tumors and normal breast tissue. shSmyd5 cancer cell repressed genes and tumors were ordered as described above. (J) CNV analysis performed using CONAN software of human cancers revealed that SMYD5 is associated with a loss of heterozygosity (LOH). The heat map shows the percentage of human cancers with mutated SMYD5.
Principal component analysis (PCA) was used to determine the three-dimensional proximity of shSmyd5 cancer cells to shLuc and shSmyd5 ES cells and EBs (Figure 6B). PCA revealed a skewed trajectory of shSmyd5 EB differentiation and shSmyd5 cancer cell formation compared to control EB differentiation (Figure 6B). Moreover, by comparing shSmyd5 cancer cell and shLuc day 14 EB DE genes with gene expression data from primitive cells (ES cells) and differentiated cells (day 14 EB), using gene set enrichment analysis (GSEA)[27], we found that differentially expressed genes are enriched in EBs (Figure 6C), suggesting that differentiation genes are dysregulated in shSmyd5 cancer cells. DAVID Gene ontology (GO) analysis further confirmed that developmental GO terms, including cell differentiation, system development, cell development, gene expression, and lung development, were overrepresented between shSmyd5 cancer cells and shLuc day 14 EB (Figure 6D).
Next, we identified differentially expressed genes between shSmyd5 cancer cells and shLuc EB day 14 cells (Figure 6E). Our results show that shSmyd5 cancer cells overexpress lineage-specific genes such as Nog, Snai, Sox7, Thbd, and Spink2 and underexpress genes such as Col1a2, Erbb2ip, Gata3, Smyd5, and Sox11 (Figure 6E). Interrogation of the overexpressed and underexpressed signature genes with a compendium of cancer expression datasets using Oncomine[28] revealed a correlation between genes that were underexpressed in shSmyd5 cancer cells and underexpressed in human lung adenocarcinoma versus normal lung with known clinical outcomes [within the top 5% underexpressed; (p=3.44E-10) [17] and (p=1.12E-7)[18]] (Figure 6F). We divided the lung adenocarcinoma datasets into two groups: those with high (top 10%) and those with low (bottom 10%) expression of shSmyd5 cancer cell repressed genes. A Kaplan-Meier analysis was then performed on the datasets to investigate an association between the shSmyd5 cancer cell expression signature and patient outcome (survival) (Figure 6G). We found that lung adenocarcinoma patients with a low expression of shSmyd5 cancer cell repressed genes have a decreased rate of survival relative to patients with a high expression profile of shSmyd5 cancer cell repressed genes. A similar correlation was observed between the underexpressed shSmyd5 cancer cell repressed genes and additional human cancers including colon adenocarcinomas (Figure 6H) and invasive breast carcinomas (Figure 6I).
We also investigated copy number variation (CNV) and the mutational profile of SMYD5 in human cancers using CONAN [29] (Figure 6J). These results show that a loss of heterozygosity (LOH) of SMYD5 is present in many human cancers including lung and breast cancer (Figure 6J). Altogether, these results suggest that a loss of SMYD5 is associated with cancer formation.
To investigate whether knockdown of SMYD5 may potentiate tumor initiation in human cells, we depleted SMYD5 mRNA in human embryonic stem cells (H1 hESCs) using RNAi (see methods) (Figure 7A–B, S5A). qRT-PCR confirmed that SMYD5 mRNA levels were reduced in shSmyd5 hESCs relative to control (shLuc) hESCs (Figure 7C). We observed altered differentiation of SMYD5-depleted hESCs, including a greater frequency of cavitated/cystic embryoid bodies (EB) and a decreased frequency of solid EBs relative to shLuc hESCs at day 13 of differentiation (Figure 7D–E, S5B). Interestingly, by extending the EB assay, we also observed the formation of transformed-like cells during EB differentiation of shSmyd5 hESCs (Figure 7F–G, S5C–D). Similar to mouse shSmyd5 cancer cells, human shSmyd5 cancer cells are capable of proliferating in suspension in an anchorage-independent manner as clusters of cells on low binding dishes (Figure 7G–H, S5E) or as a monolayer (Figure 7I). Moreover, human shSmyd5 cancer cells proliferated in 3D Matrigel (Figure 7J, right), and incubation with DQ-collagen IV revealed proteolytic activity of the embedded cells (Figure 7J, right). In contrast, control (shLuc) EBs did not proliferate in 3D Matrigel, and fluorescence was not detected following incubation with DQ-collagen IV (Figure 7J, left).
Figure 7. Depletion of SMYD5 in human ES cells and human cancer cells.
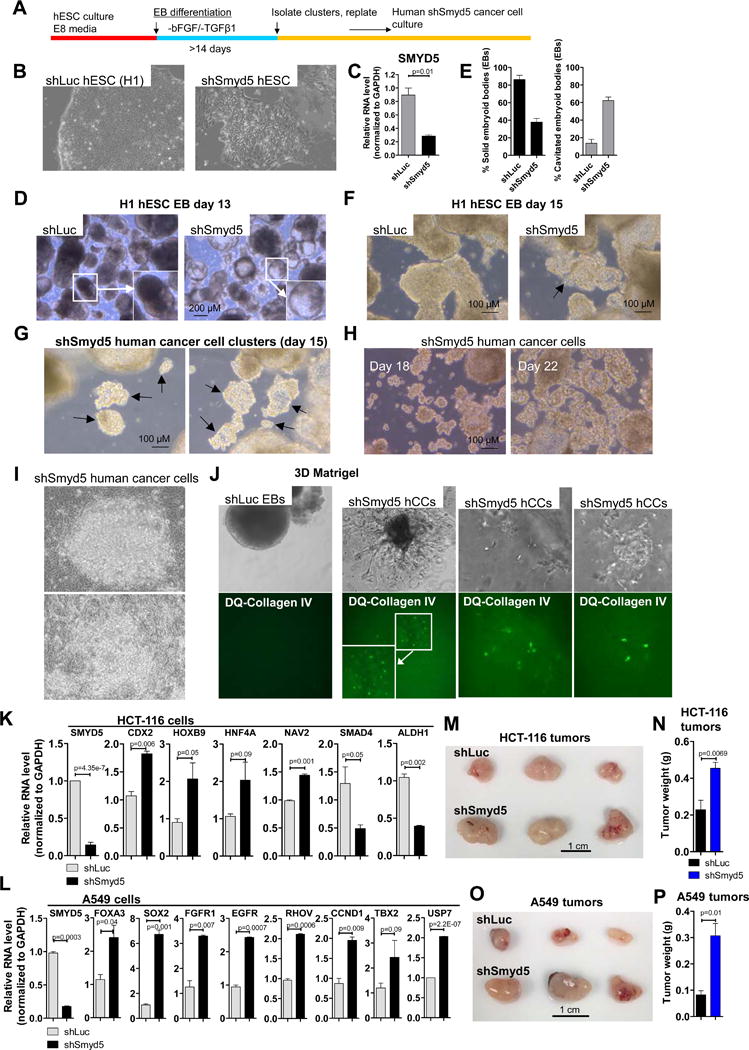
(A) Schematic of experimental design. (B) hESCs transduced with shLuc or shSmyd5 lentiviral particles (see methods). (C) qRT-PCR expression of SMYD5 in shLuc and shSmyd5 hESCs. (D) EB formation shows enhanced cavitation of shSmyd5 hEBs relative to control (shLuc) hEBs at day 13. Inset images in (D) shows solid shLuc EB and cavitated shSmyd5 EB. (E) The percentage of solid or cavitated shLuc and shSmyd5 EBs. (F) EB differentiation at day 15 reveals the formation of atypical cellular aggregates of human shSmyd5 EBs, but not shLuc EBs. (G) shSmyd5 cancer cell clusters at day 15 (arrows show clusters), (H) day 18 and day 22. (I) Passaged shSmyd5 human cancer cells. (J) Bright-field and fluorescence microscopy of shLuc EBs (left) and shSmyd5 human cancer cells (right) cultured in 3D Matrigel with DQ-collagen IV. (K–L) qRT-PCR expression analysis of shLuc and shSmyd5 (K) HCT-116 colon cancer and (L) A549 lung cancer cells. (M, O) Tumor growth assay. 106 shLuc or shSmyd5 HCT-116 cells, or shLuc or shSmyd5 A549 cells, were subcutaneously injected into SCID-beige mice. (N, P) Weight of shLuc and shSmyd5 HCT-116 and shLuc and shSmyd5 A549 tumors. Tumor weight plots are presented as mean ± SEM.
To evaluate whether depletion of SMYD5 in a non-tumorigenic epithelial cell line leads to transformation we knocked down SMYD5 in MCF10A breast epithelial cells and assayed for 3D growth in Matrigel. Our results demonstrate that shSmyd5 MCF10A cells exhibit altered growth characteristics relative to control (shLuc) MCF10A cells. Specifically, while shLuc MCF10A cells formed normal round acini (Figure S6A, left), shSmyd5 MCF10A cells formed irregularly shaped acini that expanded into the matrix (Figure S6A, right). In addition, Phalloidin and DAPI staining showed that shLuc MCF10A cells formed normal acini with a lumen (Figure S6B, left), while shSmyd5 MCF10A cells formed irregular acini without a lumen structure (Figure S6B, right). Moreover, 3D culture in Collagen I showed that shSmyd5 MCF10A cells exhibit a highly branched structure relative to shLuc MCF10A cells (Figure S6C). Taken together, these results suggest that depletion of SMYD5 in MCF10A cells leads to a partially transformed phenotype.
To evaluate whether SMYD5 regulates expression of genes in human cancer cells, we knocked down SMYD5 in HCT-116 colon cancer, A549 lung cancer, and MCF7 breast cancer cells using RNAi (see methods). qRT-PCR demonstrated that SMYD5 mRNA levels decreased by 86% in shSmyd5 HCT-116 cells (Figure 7K), 82% in shSmyd5 A549 cells (Figure 7L), and 90% in shSmyd5 MCF7 cells (Figure S7A) relative to shLuc HCT-116, shLuc A549, or shLuc MCF7 cells, respectively. Moreover, we observed upregulation of genes overexpressed in colon cancer such as CDX2, HNF4A, NAV2, and HOXB9 [30–33], and downregulation of genes underexpressed in colon cancer including SMAD4 and ALDH1[34, 35] in shSmyd5 HCT-116 cells relative to shLuc HCT-116 cells (Figure 7K). In addition, we observed upregulation of genes overexpressed in lung cancer such as FOXA3, SOX2, FGFR1, EGFR, RHOV, CCND1, TBX2, and USP7 [36–42] in shSmyd5 A549 cells relative to shLuc A549 cells (Figure 7L). We also observed upregulation of genes overexpressed in breast cancer such as PGR, MMP11, CCNB1, STK15[43–46], and downregulation of SCUBE2[47] in shSmyd5 MCF7 cells relative to shLuc MCF7 cells (Figure S7A).
We also investigated the in vivo consequence of depleting SMYD5 in human colon and lung cancer cells. To this end, shLuc or shSmyd5 HCT116 cells, or shLuc or shSmyd5 A549 cells were injected subcutaneously into SCID-beige mice. Mice injected with shSmyd5 HCT-116 cells (Figure 7M–N) or shSmyd5 A549 cells (Figure 7O–P) exhibited significantly increased tumor growth relative to tumors generated from shLuc HCT116 shLuc A549 cells, respectively.
DISCUSSION
Results presented in this study implicate a role for SMYD5 in maintaining genome stability of ES cells during differentiation. The formation of transformed cells during differentiation in SMYD5 depleted ES cells is likely attributed to decreased H4K20 methylation, resulting in decreased levels of heterochromatin marks (H3K9 methylation/HP1), and transcriptional dysregulation of the underlying repetitive DNA elements. H4K20 methylation has been linked to multiple cellular processes including heterochromatin formation, transcriptional regulation and repression [6], and genome stability [7]. Moreover, our results show that loss of SMYD5-dependent silencing of LTR/ERV elements leads to upregulated expression of nearby genes. Our results, which implicate a role for SMYD5 in regulating genome stability, are in alignment with the known function of other H4K20 histone methyltransferases, Suv420h1 and Suv420h2 [48]. In addition, decreased H4K20me3 levels are a common hallmark of cancer, where decreased H4K20me3 levels occurs early during transformation, and is progressively lost through the most malignant stages [49]. Also, decreased H4K20me3 is correlated with preneoplasia and squamous cell lung cancer, and the level of H4K20me3 was found to decrease with disease progression [50]. Concomitantly, decreased H4K20me3 is associated with poor prognosis in breast cancer and tumor progression[51]. H3K9 methylation also plays a critical role in protecting genome stability, where a loss of Suv39h H3K9 HMTases leads to chromosomal instability, and decreased levels of H3K9 methylation have been found in cancer cells [52]. Our results are consistent with these findings, where we observed decreased levels of the repressive histone modifications H4K20me3 and H3K9me3 in shSmyd5 cancer cells relative to control cells, suggesting that decreased levels of H4K20me3 and H3K9me3 is associated with genome instability, tumorigenesis and cancer progression. Moreover, our results also suggest that SMYD5 may potentially act as a tumor suppressor in human cells, where depletion of SMYD5 in hESCs resulted in the formation of transformed cells during differentiation, and depletion of SMYD5 in human cancer cells lead to increased tumor growth and changes in expression of genes associated with cancer progression or prognosis.
In this study we found that shSmyd5 cancer cells exhibit chromosomal aberrations, including copy number alterations. Our results revealed a positive correlation between SMYD5 binding, altered levels of repressive histone modifications and heterochromatin proteins (H4K20me3, H3K9me3, HP1) in SMYD5-depleted cells, and the occurrence of copy number alterations in shSmyd5 cancer cells. Based on these findings, we propose that SMYD5-dependent H4K20me3 is important for maintaining a heterochromatic structure that is important to protect genome stability. Absence of SMYD5 may favor a more relaxed heterochromatic state, which may be prone to genome instability during cellular state transitions from self-renewal to lineage commitment. In this case, inappropriate chromosome conformational changes may ensue from the induction of specific transcriptional programs during differentiation in the absence of adequate levels of heterochromatin, thus resulting in genome instability. It is also possible that de-repression of ERVs during differentiation in the absence of SMYD5 may promote genome instability through insertional and post-insertion-based mutagenesis of activated ERVs [53, 54].
Supplementary Material
Acknowledgments
We thank Drs. Zhiyong Ding, Wenfei Jin, Gangqing Hu, Ana Robles and Curt Harris for helpful discussions. This work utilized the Wayne State University (WSU) High Performance Computing Grid and the NIH HPC Biowulf cluster. The DNA Sequencing and Genomics Core, Light Microcopy Core, Transgenic Core, and Pathology Core facilities of NHLBI assisted with this work. This work was supported by the Division of Intramural Research of the NHLBI and WSU.
Funding
This work was supported by Wayne State University, Karmanos Cancer Institute, the Division of Intramural Research of the National Heart, Lung and Blood Institute, and a grant from the National Heart, Lung and Blood Institute (1K22HL126842-01A1) awarded to B.L. Kidder.
Footnotes
The authors declare no conflict of interest.
References
- 1.Grewal SI, Moazed D. Heterochromatin and epigenetic control of gene expression. Science. 2003;301(5634):798–802. doi: 10.1126/science.1086887. Epub 2003/08/09. doi: 10.1126/science.1086887 301/5634/798 [pii] [DOI] [PubMed] [Google Scholar]
- 2.Grewal SI, Elgin SC. Heterochromatin: new possibilities for the inheritance of structure. Curr Opin Genet Dev. 2002;12(2):178–87. doi: 10.1016/s0959-437x(02)00284-8. Epub 2002/03/15. doi: S0959437X02002848 [pii] [DOI] [PubMed] [Google Scholar]
- 3.Avner P, Heard E. X-chromosome inactivation: counting, choice and initiation. Nat Rev Genet. 2001;2(1):59–67. doi: 10.1038/35047580. Epub 2001/03/17. [DOI] [PubMed] [Google Scholar]
- 4.Guarente L. Sir2 links chromatin silencing, metabolism, and aging. Genes Dev. 2000;14(9):1021–6. Epub 2000/05/16. [PubMed] [Google Scholar]
- 5.Beck DB, Oda H, Shen SS, Reinberg D. PR-Set7 and H4K20me1: at the crossroads of genome integrity, cell cycle, chromosome condensation, and transcription. Genes Dev. 2012;26(4):325–37. doi: 10.1101/gad.177444.111. Epub 2012/02/22. doi: 26/4/325 [pii] 10.1101/gad.177444.111. [DOI] [PMC free article] [PubMed] [Google Scholar]
- 6.Karachentsev D, Sarma K, Reinberg D, Steward R. PR-Set7-dependent methylation of histone H4 Lys 20 functions in repression of gene expression and is essential for mitosis. Genes Dev. 2005;19(4):431–5. doi: 10.1101/gad.1263005. Epub 2005/02/01. doi: gad.1263005 [pii] 10.1101/gad.1263005. [DOI] [PMC free article] [PubMed] [Google Scholar]
- 7.Schotta G, Sengupta R, Kubicek S, Malin S, Kauer M, Callen E, et al. A chromatin-wide transition to H4K20 monomethylation impairs genome integrity and programmed DNA rearrangements in the mouse. Genes Dev. 2008;22(15):2048–61. doi: 10.1101/gad.476008. Epub 2008/08/05. doi: 22/15/2048 [pii] 10.1101/gad.476008. [DOI] [PMC free article] [PubMed] [Google Scholar]
- 8.Vermeulen M, Eberl HC, Matarese F, Marks H, Denissov S, Butter F, et al. Quantitative interaction proteomics and genome-wide profiling of epigenetic histone marks and their readers. Cell. 2010;142(6):967–80. doi: 10.1016/j.cell.2010.08.020. Epub 2010/09/21. doi: S0092-8674(10)00951-7 [pii] 10.1016/j.cell.2010.08.020. [DOI] [PubMed] [Google Scholar]
- 9.Botuyan MV, Lee J, Ward IM, Kim JE, Thompson JR, Chen J, et al. Structural basis for the methylation state-specific recognition of histone H4-K20 by 53BP1 and Crb2 in DNA repair. Cell. 2006;127(7):1361–73. doi: 10.1016/j.cell.2006.10.043. Epub 2006/12/28. doi: S0092-8674(06)01525-X [pii] 10.1016/j.cell.2006.10.043. [DOI] [PMC free article] [PubMed] [Google Scholar]
- 10.Schotta G, Lachner M, Sarma K, Ebert A, Sengupta R, Reuter G, et al. A silencing pathway to induce H3-K9 and H4-K20 trimethylation at constitutive heterochromatin. Genes Dev. 2004;18(11):1251–62. doi: 10.1101/gad.300704. Epub 2004/05/18. doi: 10.1101/gad.300704 300704 [pii] [DOI] [PMC free article] [PubMed] [Google Scholar]
- 11.Kidder BL, Hu G, Cui K, Zhao K. SMYD5 regulates H4K20me3-marked heterochromatin to safeguard ES cell self-renewal and prevent spurious differentiation. Epigenetics Chromatin. 2017;10:8. doi: 10.1186/s13072-017-0115-7. [DOI] [PMC free article] [PubMed] [Google Scholar]
- 12.Matsui T, Leung D, Miyashita H, Maksakova IA, Miyachi H, Kimura H, et al. Proviral silencing in embryonic stem cells requires the histone methyltransferase ESET. Nature. 2010;464(7290):927–31. doi: 10.1038/nature08858. Epub 2010/02/19. doi: nature08858 [pii] 10.1038/nature08858. [DOI] [PubMed] [Google Scholar]
- 13.Kidder BL, Hu G, Yu ZX, Liu C, Zhao K. Extended self-renewal and accelerated reprogramming in the absence of Kdm5b. Mol Cell Biol. 2013;33(24):4793–810. doi: 10.1128/MCB.00692-13. [DOI] [PMC free article] [PubMed] [Google Scholar]
- 14.Beers J, Gulbranson DR, George N, Siniscalchi LI, Jones J, Thomson JA, et al. Passaging and colony expansion of human pluripotent stem cells by enzyme-free dissociation in chemically defined culture conditions. Nat Protoc. 2012;7(11):2029–40. doi: 10.1038/nprot.2012.130. [DOI] [PMC free article] [PubMed] [Google Scholar]
- 15.Mortazavi A, Williams BA, McCue K, Schaeffer L, Wold B. Mapping and quantifying mammalian transcriptomes by RNA-Seq. Nat Methods. 2008;5(7):621–8. doi: 10.1038/nmeth.1226. Epub 2008/06/03. doi: nmeth.1226 [pii] 10.1038/nmeth.1226. [DOI] [PubMed] [Google Scholar]
- 16.Robinson MD, McCarthy DJ, Smyth GK. edgeR: a Bioconductor package for differential expression analysis of digital gene expression data. Bioinformatics. 2009;26(1):139–40. doi: 10.1093/bioinformatics/btp616. Epub 2009/11/17. doi: btp616 [pii] 10.1093/bioinformatics/btp616. [DOI] [PMC free article] [PubMed] [Google Scholar]
- 17.Bhattacharjee A, Richards WG, Staunton J, Li C, Monti S, Vasa P, et al. Classification of human lung carcinomas by mRNA expression profiling reveals distinct adenocarcinoma subclasses. Proc Natl Acad Sci U S A. 2001;98(24):13790–5. doi: 10.1073/pnas.191502998. Epub 2001/11/15. doi: 10.1073/pnas.191502998 191502998 [pii] [DOI] [PMC free article] [PubMed] [Google Scholar]
- 18.Beer DG, Kardia SL, Huang CC, Giordano TJ, Levin AM, Misek DE, et al. Gene-expression profiles predict survival of patients with lung adenocarcinoma. Nat Med. 2002;8(8):816–24. doi: 10.1038/nm733. Epub 2002/07/16. doi: 10.1038/nm733 nm733 [pii] [DOI] [PubMed] [Google Scholar]
- 19.Zang C, Schones DE, Zeng C, Cui K, Zhao K, Peng W. A clustering approach for identification of enriched domains from histone modification ChIP-Seq data. Bioinformatics. 2009;25(15):1952–8. doi: 10.1093/bioinformatics/btp340. Epub 2009/06/10. doi: btp340 [pii] 10.1093/bioinformatics/btp340. [DOI] [PMC free article] [PubMed] [Google Scholar]
- 20.Xie C, Tammi MT. CNV-seq, a new method to detect copy number variation using high-throughput sequencing. BMC Bioinformatics. 2009;10:80. doi: 10.1186/1471-2105-10-80. Epub 2009/03/10. doi: 1471-2105-10-80 [pii] 10.1186/1471-2105-10-80. [DOI] [PMC free article] [PubMed] [Google Scholar]
- 21.Liyanage M, Coleman A, du Manoir S, Veldman T, McCormack S, Dickson RB, et al. Multicolour spectral karyotyping of mouse chromosomes. Nat Genet. 1996;14(3):312–5. doi: 10.1038/ng1196-312. Epub 1996/11/01. [DOI] [PubMed] [Google Scholar]
- 22.Padilla-Nash HM, Hathcock K, McNeil NE, Mack D, Hoeppner D, Ravin R, et al. Spontaneous transformation of murine epithelial cells requires the early acquisition of specific chromosomal aneuploidies and genomic imbalances. Genes Chromosomes Cancer. 2012;51(4):353–74. doi: 10.1002/gcc.21921. Epub 2011/12/14. [DOI] [PMC free article] [PubMed] [Google Scholar]
- 23.Hernandez-Barrantes S, Bernardo M, Toth M, Fridman R. Regulation of membrane type-matrix metalloproteinases. Semin Cancer Biol. 2002;12(2):131–8. doi: 10.1006/scbi.2001.0421. [DOI] [PubMed] [Google Scholar]
- 24.Friedl P, Wolf K. Tube travel: the role of proteases in individual and collective cancer cell invasion. Cancer Res. 2008;68(18):7247–9. doi: 10.1158/0008-5472.CAN-08-0784. [DOI] [PubMed] [Google Scholar]
- 25.Girirajan S, Campbell CD, Eichler EE. Human copy number variation and complex genetic disease. Annu Rev Genet. 2011;45:203–26. doi: 10.1146/annurev-genet-102209-163544. Epub 2011/08/23. [DOI] [PMC free article] [PubMed] [Google Scholar]
- 26.McLean CY, Bristor D, Hiller M, Clarke SL, Schaar BT, Lowe CB, et al. GREAT improves functional interpretation of cis-regulatory regions. Nature biotechnology. 2010;28(5):495–501. doi: 10.1038/nbt.1630. [DOI] [PMC free article] [PubMed] [Google Scholar]
- 27.Subramanian A, Tamayo P, Mootha VK, Mukherjee S, Ebert BL, Gillette MA, et al. Gene set enrichment analysis: a knowledge-based approach for interpreting genome-wide expression profiles. Proc Natl Acad Sci U S A. 2005;102(43):15545–50. doi: 10.1073/pnas.0506580102. [DOI] [PMC free article] [PubMed] [Google Scholar]
- 28.Rhodes DR, Yu J, Shanker K, Deshpande N, Varambally R, Ghosh D, et al. ONCOMINE: a cancer microarray database and integrated data-mining platform. Neoplasia. 2004;6(1):1–6. doi: 10.1016/s1476-5586(04)80047-2. Epub 2004/04/08. [DOI] [PMC free article] [PubMed] [Google Scholar]
- 29.Forer L, Schonherr S, Weissensteiner H, Haider F, Kluckner T, Gieger C, et al. CONAN: copy number variation analysis software for genome-wide association studies. BMC Bioinformatics. 2010;11:318. doi: 10.1186/1471-2105-11-318. Epub 2010/06/16. doi: 1471-2105-11-318 [pii] 10.1186/1471-2105-11-318. [DOI] [PMC free article] [PubMed] [Google Scholar]
- 30.Chellappa K, Robertson GR, Sladek FM. HNF4alpha: a new biomarker in colon cancer? Biomark Med. 2012;6(3):297–300. doi: 10.2217/bmm.12.23. [DOI] [PMC free article] [PubMed] [Google Scholar]
- 31.Tan F, Zhu H, Tao Y, Yu N, Pei Q, Liu H, et al. Neuron navigator 2 overexpression indicates poor prognosis of colorectal cancer and promotes invasion through the SSH1L/cofilin-1 pathway. J Exp Clin Cancer Res. 2015;34:117. doi: 10.1186/s13046-015-0237-3. [DOI] [PMC free article] [PubMed] [Google Scholar]
- 32.Dalerba P, Sahoo D, Paik S, Guo X, Yothers G, Song N, et al. CDX2 as a Prognostic Biomarker in Stage II and Stage III Colon Cancer. N Engl J Med. 2016;374(3):211–22. doi: 10.1056/NEJMoa1506597. [DOI] [PMC free article] [PubMed] [Google Scholar]
- 33.Huang K, Yuan R, Wang K, Hu J, Huang Z, Yan C, et al. Overexpression of HOXB9 promotes metastasis and indicates poor prognosis in colon cancer. Chin J Cancer Res. 2014;26(1):72–80. doi: 10.3978/j.issn.1000-9604.2014.01.11. [DOI] [PMC free article] [PubMed] [Google Scholar]
- 34.Woodford-Richens KL, Rowan AJ, Gorman P, Halford S, Bicknell DC, Wasan HS, et al. SMAD4 mutations in colorectal cancer probably occur before chromosomal instability, but after divergence of the microsatellite instability pathway. Proc Natl Acad Sci U S A. 2001;98(17):9719–23. doi: 10.1073/pnas.171321498. [DOI] [PMC free article] [PubMed] [Google Scholar]
- 35.Alazzouzi H, Alhopuro P, Salovaara R, Sammalkorpi H, Jarvinen H, Mecklin JP, et al. SMAD4 as a prognostic marker in colorectal cancer. Clin Cancer Res. 2005;11(7):2606–11. doi: 10.1158/1078-0432.CCR-04-1458. [DOI] [PubMed] [Google Scholar]
- 36.Clinical Lung Cancer Genome P, Network Genomic M. A genomics-based classification of human lung tumors. Sci Transl Med. 2013;5(209):209ra153. doi: 10.1126/scitranslmed.3006802. [DOI] [PMC free article] [PubMed] [Google Scholar]
- 37.Rudin CM, Durinck S, Stawiski EW, Poirier JT, Modrusan Z, Shames DS, et al. Comprehensive genomic analysis identifies SOX2 as a frequently amplified gene in small-cell lung cancer. Nat Genet. 2012;44(10):1111–6. doi: 10.1038/ng.2405. [DOI] [PMC free article] [PubMed] [Google Scholar]
- 38.Guo M, Tomoshige K, Meister M, Muley T, Fukazawa T, Tsuchiya T, et al. Gene signature driving invasive mucinous adenocarcinoma of the lung. EMBO Mol Med. 2017;9(4):462–81. doi: 10.15252/emmm.201606711. [DOI] [PMC free article] [PubMed] [Google Scholar]
- 39.Shepelev MV, Korobko IV. The RHOV gene is overexpressed in human non-small cell lung cancer. Cancer Genet. 2013;206(11):393–7. doi: 10.1016/j.cancergen.2013.10.006. [DOI] [PubMed] [Google Scholar]
- 40.Gautschi O, Ratschiller D, Gugger M, Betticher DC, Heighway J. Cyclin D1 in non-small cell lung cancer: a key driver of malignant transformation. Lung Cancer. 2007;55(1):1–14. doi: 10.1016/j.lungcan.2006.09.024. [DOI] [PubMed] [Google Scholar]
- 41.Zhang Z, Guo Y. High TBX2 expression predicts poor prognosis in non-small cell lung cancer. Neoplasma. 2014;61(4):476–80. [PubMed] [Google Scholar]
- 42.Zhao GY, Lin ZW, Lu CL, Gu J, Yuan YF, Xu FK, et al. USP7 overexpression predicts a poor prognosis in lung squamous cell carcinoma and large cell carcinoma. Tumour Biol. 2015;36(3):1721–9. doi: 10.1007/s13277-014-2773-4. [DOI] [PMC free article] [PubMed] [Google Scholar]
- 43.Horwitz KB, McGuire WL. Estrogen control of progesterone receptor in human breast cancer. Correlation with nuclear processing of estrogen receptor. J Biol Chem. 1978;253(7):2223–8. [PubMed] [Google Scholar]
- 44.Basset P, Okada A, Chenard MP, Kannan R, Stoll I, Anglard P, et al. Matrix metalloproteinases as stromal effectors of human carcinoma progression: therapeutic implications. Matrix Biol. 1997;15(8–9):535–41. doi: 10.1016/s0945-053x(97)90028-7. [DOI] [PubMed] [Google Scholar]
- 45.Ding K, Li W, Zou Z, Zou X, Wang C. CCNB1 is a prognostic biomarker for ER+ breast cancer. Med Hypotheses. 2014;83(3):359–64. doi: 10.1016/j.mehy.2014.06.013. [DOI] [PubMed] [Google Scholar]
- 46.Dai Q, Cai QY, Shu XO, Ewart-Toland A, Wen WQ, Balmain A, et al. Synergistic effects of STK15 gene polymorphisms and endogenous estrogen exposure in the risk of breast cancer. Cancer Epidemiol Biomarkers Prev. 2004;13(12):2065–70. [PubMed] [Google Scholar]
- 47.Lin YC, Lee YC, Li LH, Cheng CJ, Yang RB. Tumor suppressor SCUBE2 inhibits breast-cancer cell migration and invasion through the reversal of epithelial-mesenchymal transition. Journal of cell science. 2014;127(Pt 1):85–100. doi: 10.1242/jcs.132779. [DOI] [PubMed] [Google Scholar]
- 48.Jorgensen S, Schotta G, Sorensen CS. Histone H4 lysine 20 methylation: key player in epigenetic regulation of genomic integrity. Nucleic Acids Res. 2013;41(5):2797–806. doi: 10.1093/nar/gkt012. Epub 2013/01/25. doi: gkt012 [pii] 10.1093/nar/gkt012. [DOI] [PMC free article] [PubMed] [Google Scholar]
- 49.Fraga MF, Ballestar E, Villar-Garea A, Boix-Chornet M, Espada J, Schotta G, et al. Loss of acetylation at Lys16 and trimethylation at Lys20 of histone H4 is a common hallmark of human cancer. Nat Genet. 2005;37(4):391–400. doi: 10.1038/ng1531. Epub 2005/03/15. doi: ng1531 [pii] 10.1038/ng1531. [DOI] [PubMed] [Google Scholar]
- 50.Van Den Broeck A, Brambilla E, Moro-Sibilot D, Lantuejoul S, Brambilla C, Eymin B, et al. Loss of histone H4K20 trimethylation occurs in preneoplasia and influences prognosis of non-small cell lung cancer. Clin Cancer Res. 2008;14(22):7237–45. doi: 10.1158/1078-0432.CCR-08-0869. [DOI] [PubMed] [Google Scholar]
- 51.Yokoyama Y, Matsumoto A, Hieda M, Shinchi Y, Ogihara E, Hamada M, et al. Loss of histone H4K20 trimethylation predicts poor prognosis in breast cancer and is associated with invasive activity. Breast Cancer Res. 2014;16(3):R66. doi: 10.1186/bcr3681. [DOI] [PMC free article] [PubMed] [Google Scholar]
- 52.Feinberg AP, Koldobskiy MA, Gondor A. Epigenetic modulators, modifiers and mediators in cancer aetiology and progression. Nat Rev Genet. 2016;17(5):284–99. doi: 10.1038/nrg.2016.13. [DOI] [PMC free article] [PubMed] [Google Scholar]
- 53.Konkel MK, Batzer MA. A mobile threat to genome stability: The impact of non-LTR retrotransposons upon the human genome. Semin Cancer Biol. 2010;20(4):211–21. doi: 10.1016/j.semcancer.2010.03.001. [DOI] [PMC free article] [PubMed] [Google Scholar]
- 54.Hedges DJ, Deininger PL. Inviting instability: Transposable elements, double-strand breaks, and the maintenance of genome integrity. Mutat Res. 2007;616(1–2):46–59. doi: 10.1016/j.mrfmmm.2006.11.021. [DOI] [PMC free article] [PubMed] [Google Scholar]
Associated Data
This section collects any data citations, data availability statements, or supplementary materials included in this article.