Abstract
Purpose
Different vaccination strategies against the NY-ESO-1 antigen have been employed in an attempt to induce anti-tumor immune responses. Antigen-specific effector T cell responses have been reported in a subset of vaccinated patients; however, these responses have not consistently correlated with disease regression. Here we report for the first time clinical and immune responses generated by the NY-ESO-1 DNA vaccine administered by particle-mediated epidermal delivery to cancer patients.
Experimental Design
Eligible patients received treatment with the NY-ESO-1 DNA vaccine. Clinical outcomes and immune responses were assessed.
Results
The NY-ESO-1 DNA vaccine was safely administered and induced both antigen-specific effector CD4 and/or CD8 T cell responses in 93% (14/15) of patients who did not have detectable pre-vaccine immune responses. Despite the induction of antigen-specific T cell responses, clinical outcomes consisted predominantly of progressive disease. Detectable effector T cell responses were inconsistent and did not persist in all patients after completion of the scheduled vaccinations. However, high-avidity CD4 T cell responses that were either undetectable pre-vaccine or found to be diminished at a later time during the clinical trial were detected in certain patients’ samples after in vitro depletion of regulatory T cells.
Conclusions
Regulatory T cells play a role in diminishing vaccine-induced antigen-specific effector T cell responses in cancer patients. The NY-ESO-1 DNA vaccine represents a feasible immunotherapeutic strategy to induce antigen-specific T cell responses. Counteracting regulatory T cell activity prior to vaccination may lead to prolonged effector T cell responses and possibly anti-tumor responses in cancer patients.
Introduction
Immunological unresponsiveness to self and foreign antigens is mediated by central and peripheral mechanisms. Clonal deletion in the thymus and the induction of anergy are well-characterized mechanisms for the establishment and maintenance of tolerance (1). However, it is now clear that in addition to these mechanisms, active suppression by regulatory T cells also allows for tolerance to both self and foreign antigens (2–9). Various subsets of regulatory T cells have been described, and much effort has been focused on understanding their ontogeny, function, and mechanisms of action. Within the CD4 T cell subset there is a population of naturally occurring CD4+CD25hiFOXP3+ T cells that are defined as regulatory T cells. These cells can be identified as CD4+FOXP3+ T cells by flow cytometry. FOXP3 is the forkhead box P3 transcription factor that controls regulatory T cell development (8, 9). However, since FOXP3 is intracellular and requires permeabilization of cells for detection by flow cytometry, regulatory T cells are isolated as CD4+CD25hi T cells, which can be shown to have functional suppressive abilities in co-culture experiments. In cancer patients, CD4+CD25hi regulatory T cells have been shown to be increased in lung, ovarian, esophageal and prostate cancer patients (10–15). In one study with ovarian cancer patients, regulatory T cells were noted to specifically inhibit anti-tumor immunity and increased numbers of regulatory T cells predicted for poor survival (16). It was shown in a mouse model system that the balance between effector and regulatory T cells can influence immune responses elicited by vaccination with a tumor antigen and these regulatory T cells suppressed effector T cell responses in vivo (17).
NY-ESO-1 is a promising target antigen in patients as a candidate for specific immune recognition of cancer since it has restricted expression in normal tissue but frequently occurs on human tumors (18). Presence of NY-ESO-1 is seen in approximately one-third to one-fourth of all lung, melanoma, ovarian, esophageal, bladder and prostate cancers, and expression is often associated with high-grade tumors. NY-ESO-1 is spontaneously immunogenic in a proportion of these patients, eliciting both CD8 and CD4 T cell responses that correlate with the presence of serum antibodies to NY-ESO-1 (19, 20). It was also shown that spontaneously occurring CD4 T cell responses against NY-ESO-1 may be suppressed by CD4+CD25+ regulatory T cells (21). Clinical trials have been conducted using different NY-ESO-1 peptides and full-length protein (22–26). In order to deliver full-length antigen and minimize possible degradation of the antigen that can be associated with naked protein vaccines, we proposed a clinical trial with the NY-ESO-1 DNA vaccine. The effect of regulatory T cell responses on NY-ESO-1 vaccine-induced T cell responses has not previously been reported.
DNA immunization can be performed either by skin bombardment with plasmid DNA coated onto microscopic gold particles using a gene gun, or by direct intramuscular (IM) injection of plasmid DNA. The former method, also known as particle mediated epidermal delivery (PMED), has been shown to result in higher transgene expression, as compared to direct IM injection, and to lead to protective immunity in a variety of animal models of infection and cancer (27–30). We relied on the Powderject PMED delivery system for administration of the NY-ESO-1 DNA vaccine.
Here we report the first NY-ESO-1 DNA vaccine clinical trial in 16 patients with advanced cancer, either diagnosed as prostate adenocarcinoma (10 patients) or non-small cell lung cancer (5 patients) or esophageal carcinoma (1 patient). The NY-ESO-1 DNA vaccine induced T cell responses in treated patients but these responses were not consistently detected throughout the vaccination schedule. Depletion of regulatory T cells from samples that previously did not reveal detectable antigen-specific T cell responses led to identification of NY-ESO-1-specific CD4 T cell responses which were noted to be high-avidity T cell responses, as previously defined by us and others using peptide-titration experiments and assessing T cell responses to naturally processed antigen (31–33). Therefore, counteracting regulatory T cell activity prior to vaccination may prove to be an important method for induction of optimal effector T cell responses.
Materials and Methods
Clinical Trial
NY-ESO-1 Plasmid DNA (pPJV7611) was produced by PowderMed Incorporated and Ludwig Institute for Cancer Research (LICR) sponsored the clinical trial with the NY-ESO-1 DNA vaccine. All NSCLC (N=5) and esophageal cancer patients (N=1) were consented on an Institutional Review Board (IRB)-approved protocol at Cornell University, New York Hospital, and all prostate adenocarcinoma patients (N=10) were consented on an IRB-approved protocol at UTMDACC.
Delayed type hypersensitivity (DTH) skin tests were done with NY-ESO-1 full-length protein in all patients and with NY-ESO-1b peptide (HLA-A2-binding motif peptide 157–165, SLLMWITQCFL) in HLA-A2+ patients and NY-ESO-1 DP4 peptide (HLA-DP4-binding motif peptide 157–174, SLLMWITQCFLPVFLAQP) in HLA-DP4+ patients. DTH skin tests were placed in the forearm of each patient and read 48 to 72 hours later.
Blood was drawn one to four weeks prior to receiving the first dose of vaccine (baseline pre-vaccine blood sample) and at weeks 3, 5, 7, 9, 11 and 13 for immunological assessment as outlined below. Samples for immunological monitoring were shared and analyzed at Ludwig Institute for Cancer Research at Memorial Sloan-Kettering Cancer Center and University of Texas M. D. Anderson Cancer Center (UTMDACC). Sufficient cells from samples obtained at week 13 for patients’ #P002 and #N07 were not available to conduct certain experiments..
Clinical responses were assessed using standard RECIST criteria and computed tomography (CT) scans with intravenous contrast at 2.5 mm reconstructions for chest CT and 5 mm reconstructions for other anatomic sites. For patients with prostate cancer, change in the prostate specific antigen (PSA) tumor marker was used to assess clinical response.
ELISA
Half-area, 96-well flat-bottom plates (Corning, NY) were coated with recombinant NY-ESO-1 protein solution (25ul/well at 1ug/ml in phosphate buffered saline) overnight at 4°C. Plates were washed twice with 0.1% Tween 20 in phosphate buffered saline (PBS-T) and blocked overnight with blocking buffer (5% non-fat milk in phosphate buffered saline) at 4°C. Plates were washed 4x with PBS-T and 4x with PBS. Serum dilutions in blocking buffer (30ul/well) were added to plate and incubated at room temperature for 2 hours. The plates were washed and 30ul of secondary antibody in blocking buffer (goat anti-human IgG-AP, Southern Biotechnology, Birmingham, AL) was added per well and the plate incubated at room temperature for 1 hour. The plate was washed and 30ul of substrate was added per well (AttoPhos, Promega, WI) for 30 min. at room temperature in the dark. Stop solution was added (15ul/well, 3N NaOH) to wells and immediately read (SpectraMax M2, Molecular Devices, CA). Sera were tested over a range of fourfold serial dilution from 1:100 to 1:400,000. A positive reaction is defined as an OD value of a 1:400 diluted serum that exceeds the mean OD value of sera from normal donors by three standard deviations (23, 34).
Peptides and vectors for T cell Analyses
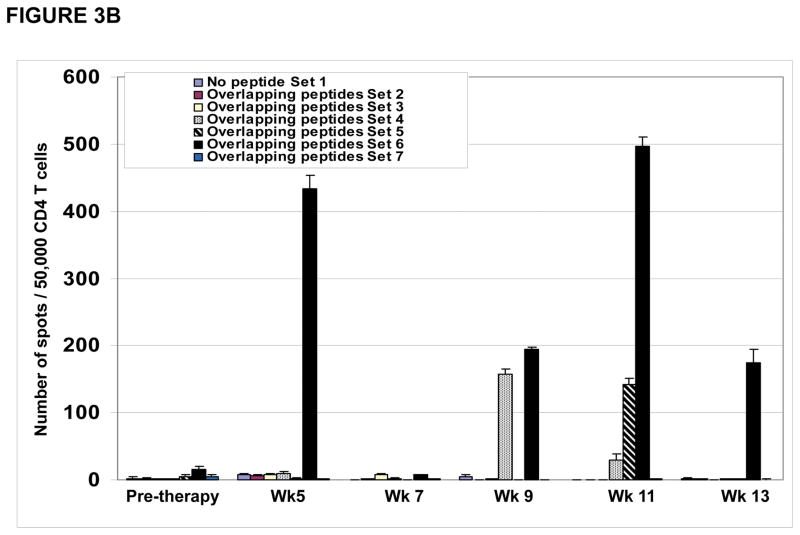
Synthetic NY-ESO-1 20-mer overlapping peptides were produced by the Ludwig Institute for Cancer Research and designated Peptide Set 1: No peptides; Peptide Set 2: 1–20, 11–30, 21–40; Peptide Set 3: 31–50, 41–60, 51–70; Peptide Set 4: 61–80, 71–90, 81–100; Peptide Set 5: 91–110, 101–120, 111–130; Peptide Set 6: 119–143, 131–150, 139–160; and Peptide Set 7: 151–170, 161–180. Peptides for influenza nucleoprotein NP206–229 (FWRGENGRKTRIAYERMCNILKGK), tetanus toxoid TT 830–844 (QYIKANSKFIGITEL), influenza hemagglutinin HA 307–319 (PKYVKQNTLKLAT), Melan A (ELAGIGILTV), and flu matrix (GILGFVFTL) were obtained from Bio-Synthesis (Lewisville, TX) with a purity of greater than 95% as determined by mass spectrometry. Fowlpox recombinant vectors encoding full-length NY-ESO-1 or irrelevant antigen were previously described and used to infect target APC overnight at 37°C at 100 pfu/cell (35).
In vitro sensitization with peptides
Peripheral blood mononuclear cells (PBMCs) were obtained from patients and CD4+ and CD8+ T cells were obtained by positive selection using antibody-coated magnetic beads (Dynabeads, Dynal, Oslo). Total CD4+ or CD4+ T cells depleted of CD4+CD25+ regulatory T cells by Miltenyi’s regulatory T cell depletion kit or total CD8+ T lymphocytes seeded in 96-well round-bottom plates (Corning, NY) at a concentration of 5 x 10⁵ cells per well in RPMI 1640 medium supplemented with 10% human AB serum (GemCell, Gemini Biobroducts, Woodland, CA), L-glutamine (2mM), penicillin (100 units/ml), streptomycin (100 ug/ml), and 1% nonessential amino acids (complete medium).
As antigen presenting cells (APCs), autologous PBMCs depleted of CD4+ and CD8+ T cells were pulsed with 10uM or 10ug/ml peptide overnight at 37°C, 5% CO2, at a concentration of 4 x 10⁶ cells/ml in serum-free medium (X-VIVO-15, Bio-Whittaker, Walkersville, MD). Pulsed cells were washed, irradiated, and added to the plates containing CD4+ and CD8+ T cells at a concentration of 1 x 10⁶ cells APC per well. After 8 hours, IL-2 (10 units/ml, Roche Molecular Biochemicals, IN) and IL-7 (20ng/ml, R&D Systems, MN) were added to culture wells, and this step was repeated every 3–4 days until the cells were harvested for testing.
ELISPOT Assays
Flat-bottom, 96-well mixed cellulose ester membrane plates (Multiscreen, Millipore, Bedford, MA) were coated with IFN-γ mAb (4ug/ml, 1-D1K, MABTECH, Stockholm) and incubated overnight at 4°C. Plates were washed twice with RPMI 1640 medium supplemented with 1% non-essential amino acids and blocked with RPMI 1640 medium supplemented with 10% human AB serum for 2 hours at 37°C. Presensitized CD8+, CD4+, or CD4+CD25– T cells (5 x 10⁴ cells) and 1 x 10⁵ target cells APC were added to each well and incubated for 16 to 20 hours in RPMI 1640 medium supplemented with 1% non-essential amino acids at 37°C, 5% CO2. Plates were washed thoroughly with sterile water containing 0.05% Tween 20 to remove cells, and IFN-γ mAb (0.2ug/ml, 7-B6-1-biotin, MABTECH, Stockholm) was added to each well. Plates were incubated for 2 hours at 37°C, 5% CO2, washed thoroughly, and developed with streptavidin alkaline phosphatase (1/1000 dilution, MABTECH, Stockholm) for 1 hour at room temperature in the dark. After thoroughly washing plate, substrate (5-bromo-4-chloro-3-indolyl phosphate/nitro tetrazolium, Sigma-Aldrich, St. Louis, MO) was added. After final washes, plates were dried and plate membranes displaying dark-violet spots were scanned by using CTL ImmunoSpot analyzer and software (Cellular Technologies, Cleveland). Responses were considered significant if the number of spots for 50,000 CD4+ T cells against NY-ESO-1 peptide pulsed targets was >30 spots and at least 3x higher than response against targets pulsed with irrelevant control peptide.
Flow Cytometry
CD4+CD25hi T cells and CD4+FOXP3+ T cells were identified by flow cytometry. Antibodies used for flow cytometry studies consisted of CD4-PerCP-Cy5.5, CD25-APC (BD Pharmingen), and FOXP3-PE (eBiosciences, clone PHC101).
Co-culture Suppression Assays
Suppression assays were performed by sorting PBMCS for CD4+CD25− and autologous CD4+CD25hi cells with each plated alone at 5,000 cells/well or together at a 1:1 ratio in triplicate wells for 6 days with 5 ug/mL anti-CD3 antibody and then addition of 1 uCi 3H-thymidine for 18 hours prior to assessing proliferation with a scintillation counter.
Results
Clinical Trial
Patients with non-small cell lung cancer, esophageal carcinoma or prostate adenocarcinoma who met all eligibility criteria as per the clinical trial protocol were enrolled sequentially into one of three cohorts (Supplementary Table 1). Cohort one consisted of 3 non-small cell lung cancer (NSCLC) patients who received treatment with 4 micrograms of NY-ESO-1 DNA vaccine administered monthly at weeks 1, 5 and 9. Each 4 microgram dosage of the vaccine was given via PMED with 1 microgram of vaccine administered to 4 separate sites of one upper arm. Cohort two consisted of 2 NSCLC patients, 1 esophageal carcinoma patient and 3 prostate adenocarcinoma patients who received 8 micrograms of vaccine administered monthly at weeks 1, 5 and 9. Each 8 microgram dosage of vaccine was given via PMED with 1 microgram of vaccine administered to both upper arms and in 4 separate sites in each upper arm. Cohort three consisted of 7 prostate adenocarcinoma patients who received 8 micrograms of vaccine administered as clustered dosing with 2 microgram doses on days 1, 3, 5 and 8 of each week and given monthly at weeks 1, 5 and 9. The clustered dosing was administered via PMED with 1 microgram of vaccine given in each arm on days 1, 3, 5 and 8 for weeks 1, 5 and 9.
Eighteen patients were enrolled onto the study but only 16 patients received at least one vaccination and 15 patients completed all scheduled vaccinations. Of the 16 vaccinated patients, 2 were diagnosed with Stage IV NSCLC and were treated with surgical resection of metastatic disease prior to enrollment onto the vaccine clinical trial. One patient was diagnosed with Stage IIIB NSCLC and treated with surgical resection of disease prior to enrollment onto the vaccine clinical trial. One patient with Stage IV esophageal carcinoma was also treated with surgical resection of metastatic disease prior to enrolling onto the vaccine clinical trial. These 4 patients did not have any evidence of disease at the time of vaccine therapy. Two patients with Stage IV NSCLC were also enrolled onto the clinical trial and these patients had evidence of disease at the time of vaccine therapy. All 10 patients with prostate adenocarcinoma had metastatic disease as determined by rising prostate specific antigen (PSA) tumor marker or computed tomography (CT) scans suggestive of metastatic disease. Patients were followed throughout the clinical trial and evaluated every two weeks by physical examination and routine chemistry and hematological blood tests until week 13 to assess for safety of the vaccine treatment.
Safety of NY-ESO-1 DNA vaccine and clinical responses
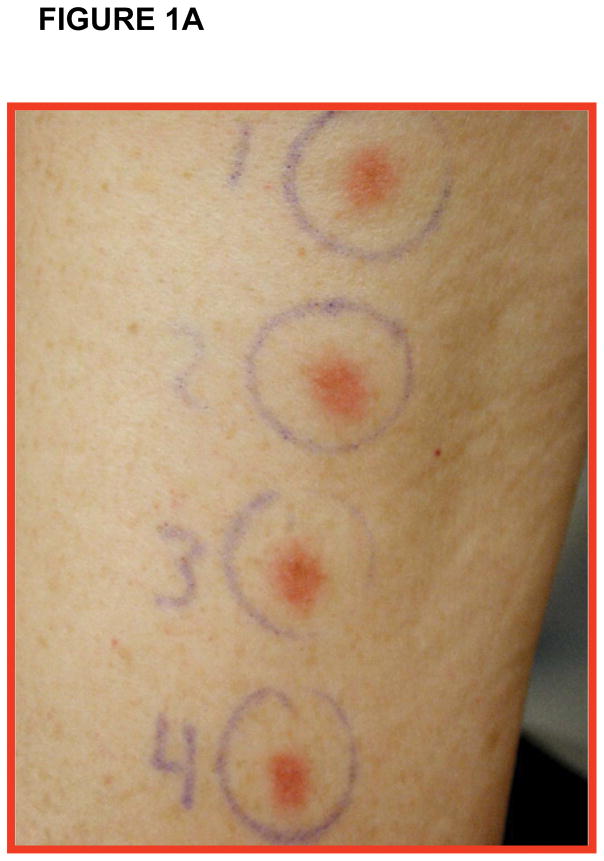
All 16 patients tolerated the NY-ESO-1 DNA vaccine administered as per protocol schema with minimal side-effects and toxicities related to vaccine therapy. Side-effects related to vaccination consisted of grade 1 to 2 erythema at the vaccine site (Figure 1A). One prostate adenocarcinoma patient (patient #P005) on cohort three received only two vaccinations prior to being removed from the study secondary to disease progression. This patient was replaced in the study and 15 patients, consisting of 9 prostate adenocarcinoma patients, 5 NSCLC patients, and 1 esophageal carcinoma patient, completed all scheduled vaccinations.
Figure 1. Clinical trial with NY-ESO-1 DNA vaccine.
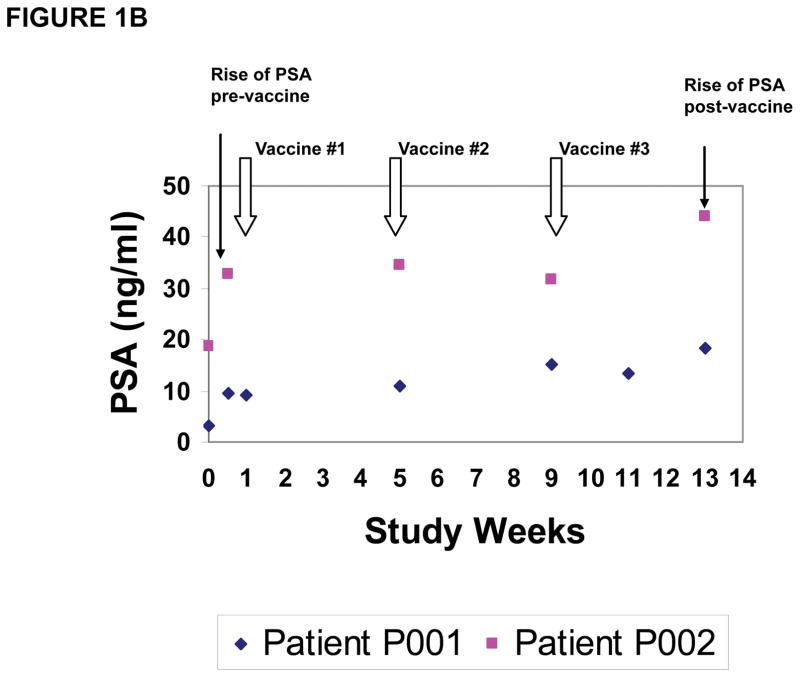
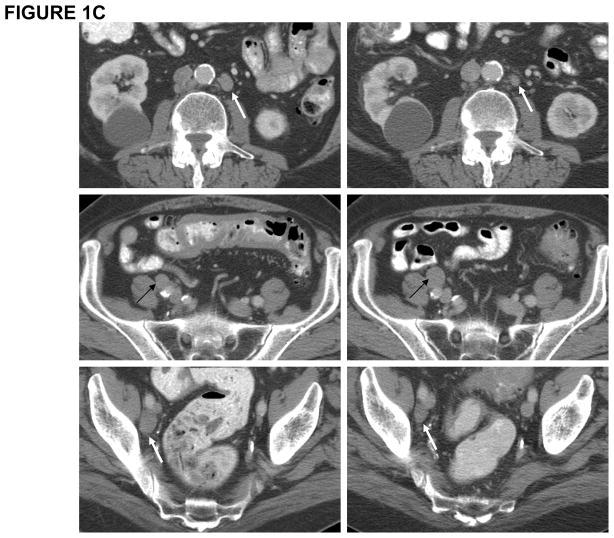
(A) Depiction of grade 2 adverse event consisting of erythema at vaccine site in one representative patient; (B) PSA measurements in two representative patients demonstrating PSA stabilization during vaccination and rise of PSA pre-and post-vaccine administration; (C) CT scan of patient #P009 showing pre-vaccine scan (Left Panel) compared to post-vaccine scan (Right Panel) with decrease in size of some lymph nodes (white arrows) and increase in size of others (black arrows).
Clinical responses (Table 1) in this small cohort of patients were limited to stable disease of 16 and 23 months for 2 patients on cohort 1 with stage IV NSCLC, who had measurable disease at the time of vaccination, and for 3 patients on cohort 2 (NSCLC, N=2 and esophageal carcinoma, N=1) who had no evidence of disease at the time of vaccination. One NSCLC patient (cohort 1) with previously diagnosed stage IIIB disease did develop progressive disease. Although the prostate adenocarcinoma patients were noted to have slower rises in the PSA tumor marker during the vaccination period as compared to pre-vaccine PSA levels (Figure 1B, 2 representative patients), all patients, except one (patient #P009), were deemed to have progressive disease as noted by PSA rise at the time of study completion at week 13. Patient #P009 had stable PSA at study week 13 and repeat imaging by CT scans demonstrated a mixed tumor response, with decreased size of previously enlarged lymph nodes as well as increased size in other lymph nodes, which was considered progressive disease (Figure 1C). Thus, clinical outcomes induced by NY-ESO-1 DNA vaccination were limited to stable disease in two patients, continued absence of disease in 3 patients and progressive disease in 11 patients.
Table 1.
Clinical and immune responses observed in patients vaccinated with the NY-ESO-1 DNA vaccine.
| Cohort | Patient ID | Disease Status | Clinical Response | Antibody Response | CD4 T cell Response | CD8 T cell Response | DTH Skin Response |
|---|---|---|---|---|---|---|---|
| 1 | N01 | Stage IIIB NSCLC (NED) | PD | Negative | + ( 7, 9) | + (5) | Negative |
| N02* | Stage IV NSCLC (with disease) | SD 23 months |
Negative | + (9, 11) | Negative | Negative | |
| N03* | Stage IV NSCLC (with disease) | SD 16 months |
Negative | + (5, 7, 9, 11,13) | + (13) | Negative | |
| 2 | N04* | Stage IV NSCLC (NED) | NED | Negative | + (3, 5, 9, 11) | Negative | Positive |
| E06 | Stage IV ESO (NED) | NED | Negative | Negative | Negative | Positive | |
| N07 | Stage IV NSCLC (NED) | NED | Negative | + (11) | + (5, 7) | Negative | |
| P011* | Stage IV PCa | PD | Negative | + (5, 7, 9, 11) | + (13) | Negative | |
| P001 | Stage IV PCa | PD | Negative | + (P, 5, 9, 11, 13) | Negative | Negative | |
| P002 | Stage IV PCa | PD | Negative | + (P, 3, 9) | Negative | Negative | |
| 3 | P003* | Stage IV PCa | PD | Negative | + (7) | Negative | Negative |
| P004 | Stage IV PCa | PD | Negative | + (7) | Negative | Negative | |
| P005 | Stage IV PCa | PD | + (P, 3, 5) | + (P, 3, 5) | + (P, 3) | Negative | |
| P007* | Stage IV PCa | PD | Negative | + (5, 11) | Negative | Negative | |
| P008* | Stage IV PCa | PD | Negative | + (3,5,7,11,13) | Negative | Negative | |
| P009 | Stage IV PCa | PD | Negative | + (3, 5, 7, 9,11, 13) | Negative | Negative | |
| P010 | Stage IV PCa | PD | Negative | + (P, 7, 9, 11, 13) | Negative | Negative |
Disease status pre-vaccine is shown. Numbers in parentheses indicates study week at which immune responses were detected, with P representing pre-vaccine timepoint. NED= no evidence of disease; SD= stable disease; PD= progressive disease; DTH= delayed type hypersensitivity;
Immune responses
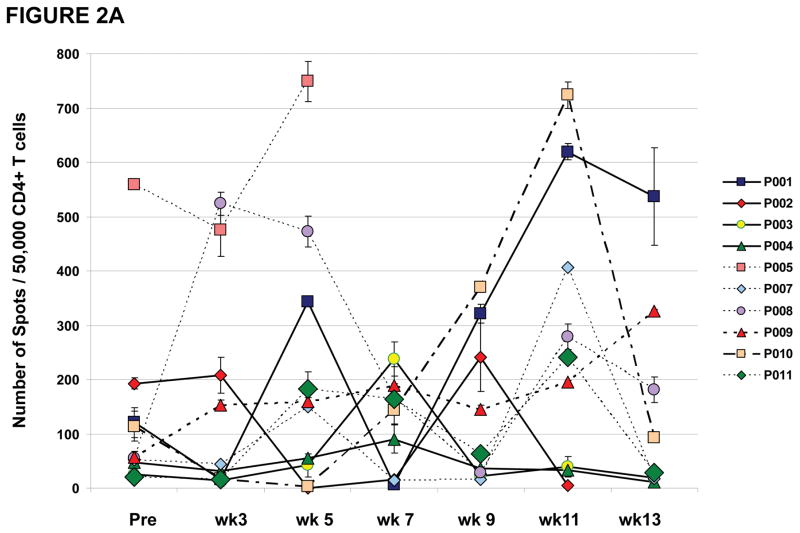
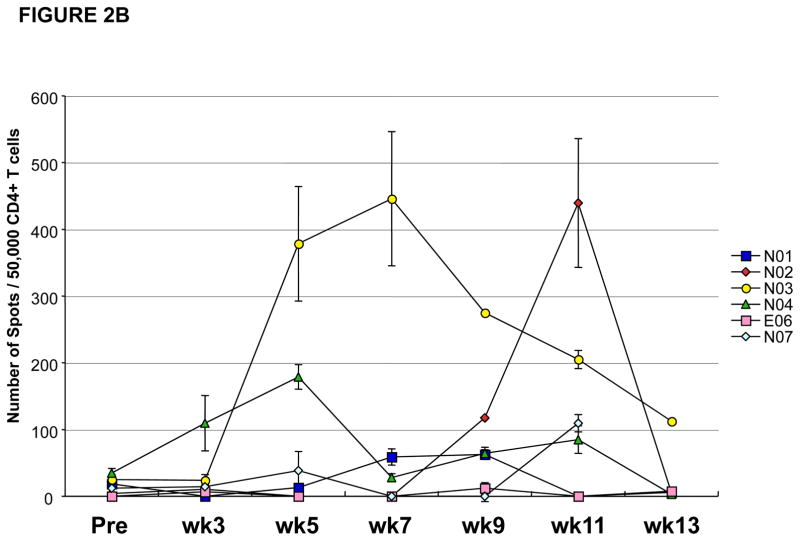
All patients who received at least one vaccination on this clinical trial developed detectable T cell responses against NY-ESO-1 (Table 1) except for the esophageal carcinoma patient (patient #E06). None of the patients on this clinical trial were noted to have a positive antibody response against NY-ESO-1 as measured by ELISA except for patient #P005, who had a baseline pre-vaccine antibody response which remained detectable for the period of time that he was on the clinical trial (Table 1). All 15 patients who had measurable T cell responses had CD4 T cell responses against NY-ESO-1 as detected by ELISPOT assays. Figure 2A provides an overview of NY-ESO-1 specific CD4 T cell responses induced in 10 treated prostate cancer patients during the vaccination schedule. As shown, CD4 T cell responses were detected at different study weeks for each patient. CD4 T cell responses fluctuated throughout the vaccination schedule. Most patients (6/9) who had measurable vaccine-induced CD4 T cell responses between study weeks 7 and 11 of the clinical trial were found to have greatly diminished CD4 T cell responses at study week 13, which was 4 weeks after the last vaccine administration. For example, patient #P003 had a detectable CD4 T cell response against NY-ESO-1 at study week 7 which was undetectable at study weeks 9 through 13. Similarly, patient #P007 had detectable CD4 T cell responses at study weeks 5 and 11 but not at weeks 7, 9 and 13. Similar CD4 T cell responses were seen in the 5 non-small cell lung cancer patients (Figure 2B).
Figure 2. CD4 T cell responses against NY-ESO-1 representative peptides by IFN-γ ELISPOT.
Results shown throughout vaccination (from pre-vaccine [Pre] to week [wk] 13) following pre-sensitization, and represented as the number of spots for 50,000 CD4 T cells against targets pulsed with NY-ESO-1 peptides (with median number of spots for irrelevant control target <10 spots). Results representative of at least two repeat assays. NY-ESO-1 specific CD4 T cell responses measured throughout the clinical trial in (A) 10 prostate cancer patients and (B) 5 NSCLC patients and 1 esophageal cancer patient, demonstrating inconsistent T cell responses with intra- and inter-patient variability.
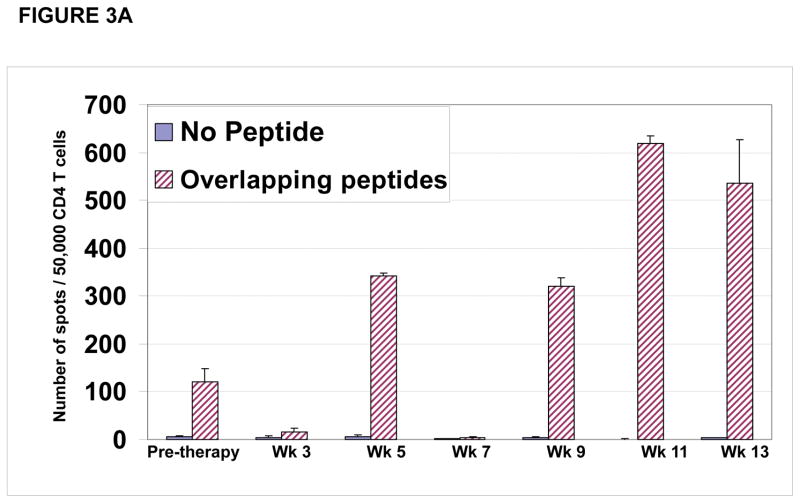
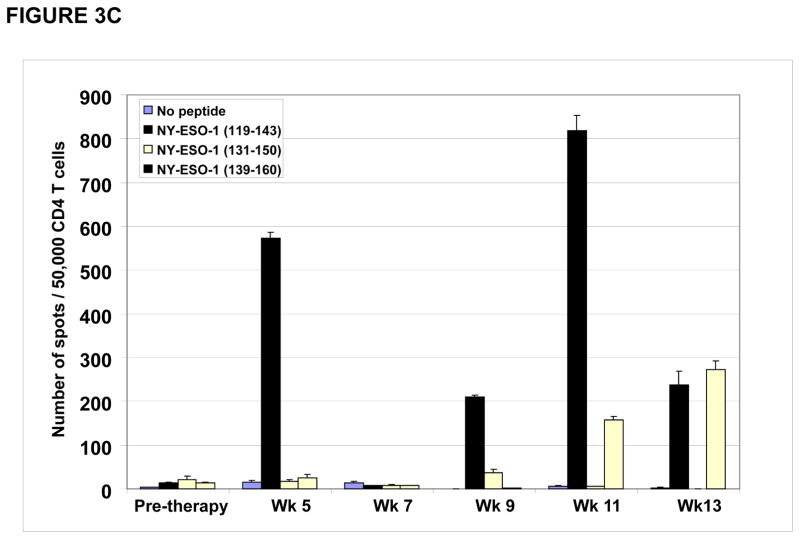
CD4 T cell responses were specific for different regions within the NY-ESO-1 protein. As shown for patient #P001, CD4 T cell responses detected at study weeks 5, 9, 11 and 13 (Figure 3A) were predominantly directed at the overlapping NY-ESO-1 peptides found in our peptide set #6 (described in materials and methods) (Figure 3B) which were mapped primarily to the NY-ESO-1 peptide encompassing amino acids 119–143 (Figure 3C).
Figure 3. CD4 T cell responses against multiple regions of the NY-ESO-1 protein.
(A) CD4 T cell responses from one representative patient P#001 were detected throughout the clinical trial and; (B) were found to be predominantly against overlapping peptide set 6 and; (C) predominantly against peptides 119–143 and 139–160.
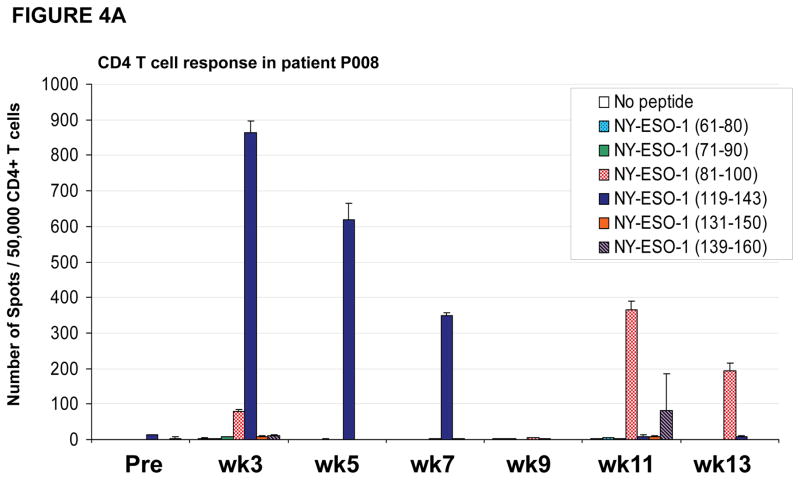
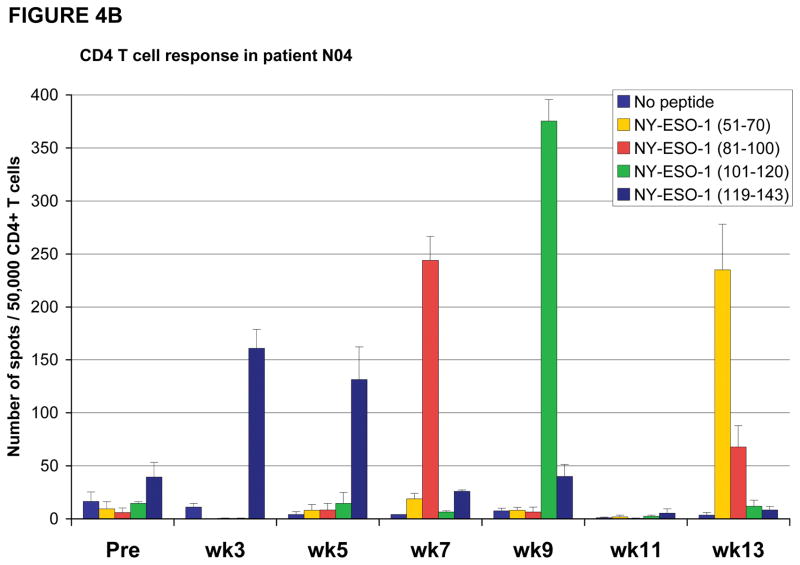
In some instances, patients were noted to have CD4 T cell responses to certain peptides which were no longer detectable at a different timepoint, instead CD4 T cell responses against a different peptide was found. For example, patient #P008 had CD4 T cell responses directed predominantly against the NY-ESO-1 peptide encompassing amino acids 119–143 at study weeks 3, 5 and 7 but, at weeks 9, 11 and 13 these responses were no longer detected and instead CD4 T cell responses were primarily directed against the NY-ESO-1 peptide encompassing amino acids 81–100 at study weeks 11 and 13 (Figure 4A). Similarly, patient #N04 had CD4 T cell responses against multiple peptides (Figure 4B), including responses against NY-ESO-1 peptide 119–143 at study weeks 3 and 5 which then changed with loss of detectable responses against peptide 119–143 and emergence of new responses against peptides 51–70, 81–100 and 101–120. Furthermore, the response against peptide 101–120, which was detected at study week 9, became undetectable at study weeks 11 and 13.
Figure 4. CD4 and CD8 T cell responses against NY-ESO-1 peptides vary during the course of vaccination.
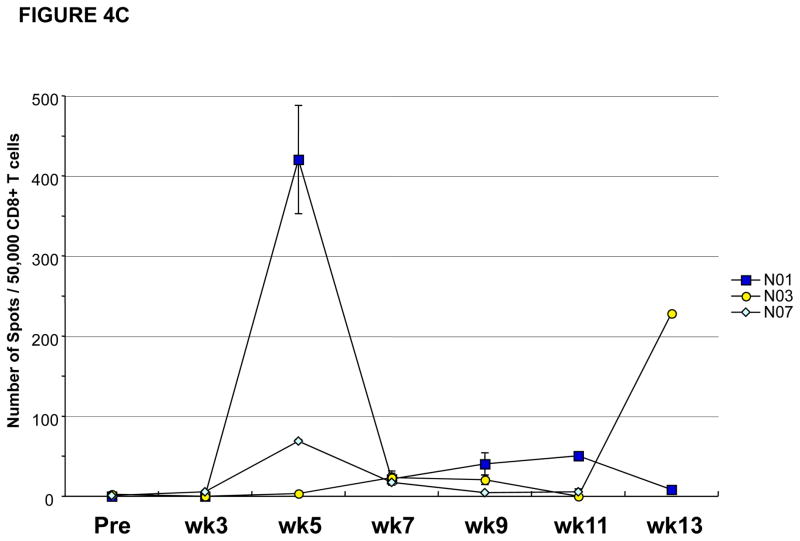
(A) Patient #P008 had CD4 T cell responses against multiple regions of the NY-ESO-1 protein with responses predominantly against peptide 119–143 at weeks 3, 5 and 7, but at weeks 11 and 13, the responses were predominantly against peptide 81–100; (B) Patient #N04 had CD4 T cell responses against multiple regions of the NY-ESO-1 protein with responses predominantly against peptide 119–143 at weeks 3 and 5, against peptide 81–100 at week 7, against peptide 101–120 at week 9, and against peptide 51–70 at week 13; (C) CD8 T cell responses were also inconsistent, with intra- and inter-patient variability, as shown for representative patients #N01, N03, and N07; (D) CD8 T cell responses were also found against multiple regions of the NY-ESO-1 protein as shown for representative patient #P011 who had detectable CD8 T cell responses against the overlapping peptides in sets 4 and 5.
Patients #N01, N03, N07, P005, and P011 had measurable CD8 T cell responses against NY-ESO-1 as detected by ELISPOT assays (Table 1). Similar to CD4 T cell responses, CD8 T cell responses were also observed transiently and appeared specific for different regions of the NY-ESO-1 protein (Figures 4C and 4D). As shown for patient #P011, NY-ESO-1 specific CD8 T cell responses were detected at study week 13, with specificity for NY-ESO-1 peptides found in overlapping peptides set 4 and 5 (Figure 4D). Thus, NY-ESO-1 DNA vaccination can induce CD8 T cell responses but, these responses were inconsistent and were not detectable in blood samples from all study time points for each patient throughout the clinical trial.
Depletion of regulatory T cells leads to detection of NY-ESO-1-specific CD4 T cell responses
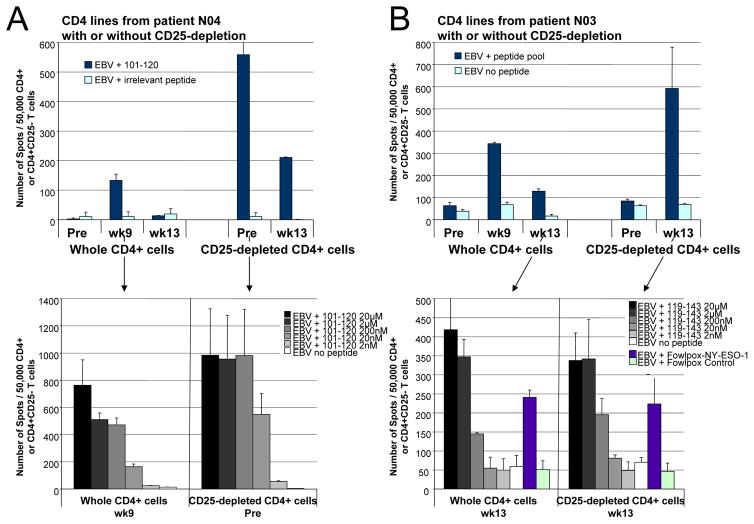
Of the 16 cancer patients treated with the NY-ESO-1 DNA vaccine, NY-ESO-1-specific CD4 T cell responses to certain peptides were not detected in the pre-vaccine baseline blood samples of 12 patients or in the week 13 post-vaccine blood samples of 8 patients for which samples were available (Table 1). Available samples from 7 patients (patients #N02, N03, N04, P003, P007, P008, and P011) were analyzed to determine if depletion of regulatory T cells would permit detection of NY-ESO-1-specific CD4 T cell responses. CD4+CD25hi T cells were shown to have regulatory T cell function in standard co-culture experiments (Supplementary Figure 1). Frequency of CD4+FOXP3+ regulatory T cells did not change significantly between pre- and post vaccine samples for 9 patients who had sufficient cells available for analyses (Supplementary Figures 2A and 2B) but, as previously reported (10–15), the frequency of CD4+FOXP3+ regulatory T cells was increased in cancer patients (ranging from approximately 20% to 60%) as compared to the average frequency of CD4+FOXP3+ regulatory T cells observed in the systemic circulation of 10 healthy donors (5 ± 2%) (Supplementary Figure 2B). For 7 patients who received the NY-ESO-1 DNA vaccine, in vitro depletion of regulatory T cells from samples that did not have detectable antigen-specific T cell responses led to the identification of NY-ESO-1-specific CD4 T cell responses with high avidity, as evidenced by peptide titration and recognition of naturally processed antigen. As shown in Figures 4B and 5A, patient #N04 had detectable CD4 T cell responses against NY-ESO-1 peptide 101–120 at study week 9 after vaccination but, there were no detectable CD4 T cells against this specific peptide present in the pre-vaccine or week 13 blood samples. However, after depletion of regulatory T cells from the pre-vaccine and week 13 blood samples, there were detectable CD4 T cell responses against NY-ESO-1 peptide 101–120 (Figure 5A, Top Panel). Interestingly, the avidity of CD4 T cells against NY-ESO-1 peptide 101–120 did not significantly differ in the presence or absence of regulatory T cells (Figure 5A, Bottom Panel), in contrast to what had been observed for vaccine-induced NY-ESO-1 CD4 T cell responses following peptide vaccination (26). Similarly, patients #P008 and P011 were found to have detectable CD4 T cell responses against NY-ESO-1 after depletion of regulatory T cells from their pre-vaccine blood samples (data not shown). However, as shown in Figure 5B, patient #N03 did not have CD4 T cells against NY-ESO-1 in the pre-vaccine blood sample, even when regulatory T cells were depleted (Figure 5B). But, patient #N03 did have enhanced CD4 T cell responses against the NY-ESO-1 peptide pool in the week 13 blood sample after depletion of regulatory T cells (Figure 5B, Top Panel). The CD4 T cell responses were specific for peptide 119–143 and the avidity of CD4 T cells remained similar in the absence and presence of regulatory T cells (Figure 5B, Bottom Panel). Patient #N02 also did not have detectable CD4 T cells against NY-ESO- in pre-vaccine blood sample despite regulatory T cell depletion but did develop detectable CD4 T cell responses in the week 13 blood sample after depletion of regulatory T cells (data not shown). Similarly, patients #P003 and P007 developed CD4 T cell responses against NY-ESO-1 in the week 13 blood samples after depletion of regulatory T cells (data not shown). Therefore, CD4 T cell responses against all NY-ESO-1 peptides or specific NY-ESO-1 peptides may have decreased at study week 13 as a result of the presence and function of naturally occurring regulatory T cells acting to suppress antigen-specific effector T cell responses that were induced after vaccination.
Figure 5. Effect of depletion of CD4+CD25hi cells on NY-ESO-1-specific CD4 T cell responses.
(A) Patient #N04 has a CD4 T cell response to NY-ESO-1 peptide 101–120 at study wk 9 that is only detectable at pre-vaccine and wk 13 if regulatory T cells are depleted before pre-sensitization. The avidity of CD4 T cells against NY-ESO-1 peptide 101–120 does not appear to differ significantly whether from preexisting precursors (CD25-depleted at Pre) or from vaccine-induced responses (wk 9 whole CD4) in peptide titrations. Results representative of at least two repeat assays; error bars indicate standard deviation of repeat assays. (B) Patient #N03 does not have detectable CD4 T cell responses against NY-ESO-1 peptides in the pre-vaccine sample (Pre), either from whole CD4 cells or from CD25-depleted CD4 cells. However, patient #N03 develops NY-ESO-1-specific CD4 T cell responses at wk 9 and 13, and depletion of regulatory T cells leads to markedly increased CD4 T cell responses that are detected at wk 13, which appear to have similar avidity against peptide 119–143 in serial dilutions and can equally recognize naturally processed full-length NY-ESO-1.
Discussion
This is the first report of the NY-ESO-1 DNA vaccine in a clinical trial with cancer patients. The vaccination method elicited CD4 T cell responses in 14/15 (93%) treated patients and CD8 T cell responses in 5/15 (33%) patients who did not have detectable pre-vaccine immune responses. From the 3 cohorts of treated patients, as little as 4 micrograms of DNA vaccine given every 4 weeks was sufficient to elicit a measurable immune response consisting of CD4 T cells. In addition, CD8 T cell responses were associated mostly within cohorts 1 and 2 (one prostate cancer patient and three lung cancer patients), with the exception of one cohort 3 patient, #P005, who had baseline pre-vaccine detectable CD8 T cell responses that remained measurable post-vaccination. All of the T cell responses against NY-ESO-1 were clustered within the C-terminal region of the protein as T cell responses were predominantly detected against peptides in this region of the protein, indicating that this region of the protein is the most immunogenic as previously published (18, 20).
Previously published clinical trials utilizing NY-ESO-1 peptides and full-length antigen also noted induction of CD4, CD8 and/or antibody responses against NY-ESO-1 (18, 19, 22–25); however, clinical responses were limited to stable disease in most cases, which also occurred most frequently in patients who had prior surgical resection of disease before beginning vaccine therapy. In one study with melanoma patients who predominantly had their disease surgically resected prior to vaccination, the authors reported that in a cohort of 42 vaccinated patients, with a median follow-up of approximately 2 years, 16 patients had relapse of disease: 5/7 patients who received placebo vaccine had recurrent disease, 9/16 patients who received NY-ESO-1 protein vaccine had recurrent disease and 2/19 patients who received NY-ESO-1 protein vaccine plus ISCOMATRIX adjuvant developed recurrent disease (23). The authors concluded that the vaccine appeared to be more effective when given with ISCOMATRIX adjuvant. We recently reported a study in urothelial carcinoma patients who had their disease surgically removed prior to administration of the NY-ESO-1 protein vaccine plus BCG and GM-CSF. We found that 5/6 vaccinated patients developed recurrent disease after median follow-up of approximately 4 years (25). Our current study also reports limited clinical benefit consisting predominantly of stable disease in patients who had prior surgical resection of their disease. The role of regulatory T cells on vaccine-induced T cell responses was not examined in previous clinical trials.
There is growing evidence that regulatory T cells, which occur naturally within the immune system, are capable of suppressing effector T cell responses within cancer patients and may be responsible for inadequate anti-tumor responses (11–16). We have previously described that CD4+CD25+ regulatory T cells play an important role in the suppression of precursor CD4 T cells specific for NY-ESO-1 in healthy donors and in patients without serum antibody response to NY-ESO-1 (21). Our current data confirm that antigen-specific CD4 T cell responses exist spontaneously in cancer patients and that these cells may be suppressed by regulatory T cells that are already present within the immune system.
We had also observed in a previous study in ovarian cancer with NY-ESO-1 peptide vaccination that these suppressing mechanisms were profound, and that spontaneous CD4 T cells that were suppressed by regulatory T cells had a higher avidity for NY-ESO-1 compared to CD4 T cells that were induced after peptide vaccination (26). In the current study with NY-ESO-1 DNA immunization, our data indicate that vaccine-induced CD4 T cell responses were diminished in some cancer patients as a result of suppression by regulatory T cells. In addition, T cell responses to specific peptides may have been altered due to regulatory T cells acting on various subsets of effector T cells. However, contrary to what had been previously shown with peptide vaccination, DNA-vaccine induced effector CD4 T cell responses against NY-ESO-1 appeared to be qualitatively similar to CD4 T cell responses that were identified upon depletion of regulatory T cells, consisting of high-avidity T cell responses as measured by peptide titration and the ability to recognize naturally processed NY-ESO-1 antigen.
It is possible that regulatory T cell suppression of effector T cell responses tempered the potential efficacy of the NY-ESO-1 DNA vaccine immunotherapeutic approach. It is also possible that other mechanisms, including loss of tumor antigen and/or lack of presentation of tumor antigen due to loss or absence of MHC molecules within the tumor microenvironment, contributed to the lack of anti-tumor responses that were observed in our study. These possibilities will need to be explored in future studies. From our limited data, it does not appear that the NY-ESO-1 DNA vaccine increased the frequency of CD4+FOXP3+ regulatory T cells but, these cells exist naturally, and are increased in cancer patients, thus playing a role in the suppression of vaccine-induced effector T cell responses.
Since regulatory T cells exist naturally to play a role in controlling elicited effector immune responses, future immunotherapeutic strategies will need to consider mechanisms to overcome regulatory T cell suppression in order to develop successful therapies to treat cancer patients. Depletion of regulatory T cells prior to vaccination may allow for enhanced effector T cell responses with subsequent anti-tumor responses. Other counteracting approaches to regulatory T cell activity may include the use of immunostimulatory adjuvants during vaccination, including Toll-like receptor ligands, which have been shown to bypass potential suppressive activity (35, 36). It is unlikely that any single immunological agent will be able to provide sufficient immune responses to generate clinical benefit in the majority of cancer patients and combination therapies with multiple agents, including conventional therapies with immunotherapies, will have to be investigated for the development of clinically beneficial cancer therapeutics. In this regard, the NY-ESO-1 DNA vaccine is a tested platform on which to build. The NY-ESO-1 DNA vaccine demonstrated an acceptable safety profile, measurable T cell responses in 15/16 vaccinated patients, and potential for improvement in immune responses if given in combination with regulatory T cell depletion or in prime-boost methods, which would possibly enhance antibody and CD8 T cell responses, or with agents such as anti-CTLA-4 antibody that would allow for an increased ratio of effector to regulatory T cells (37, 38).
Supplementary Material
CD4+CD25low cells were proliferative when cultured alone but, autologous CD4+CD25hi T cells proliferated minimally in culture alone and suppressed proliferation of CD4+CD25low cells when the two cell populations were cultured together at a 1:1 ratio.
(A) CD4+FOXP3+ T cells are not significantly different in pre-vaccine samples as compared to post-vaccine samples at study weeks 3, 5, 7, 9, 11 and 13 in representative patient #P001. Gates for FOXP3 staining were set according to appropriate isotype controls as shown in the representative panel. (B) Graphical presentation of percentages of CD4+FOXP3+ T cells measured in pre-vaccine and post-vaccine samples from 9 prostate cancer patients. Samples were analyzed in triplicate and data is presented as mean ± standard deviation at each study week timepoint for each patient shown. Healthy donors (HD; N=10) had 5 ± 2% CD4+FOXP3+ T cells detected in their blood samples.
Arrows indicate time of vaccine administration for each of the three cohorts of patients.
Translational Relevance.
Cancer vaccines are designed to enhance effector T cell responses against tumor antigens; however, these T cell responses have not correlated with tumor regression in patients. Antigen form (protein vs. peptides vs. DNA), which may influence T cell avidity, was proposed as an explanation for this lack of correlation. We conducted the first NY-ESO-1 DNA vaccine clinical trial to determine whether T cell responses induced by this method would lead to clinical benefit. Antigen-specific T cell responses occurred in 93% of vaccinated patients but these responses were short-lived and did not lead to clinical benefit. Depletion of regulatory T cells in vitro restored detectable levels of antigen-specific effector T cells with high-avidity for the NY-ESO-1 antigen. We propose that combination strategies to induce antigen-specific T cell responses and overcome regulatory T cell mechanisms are warranted for the development of clinically beneficial immunotherapies.
Acknowledgments
The authors wish to thank Drs. Linda Pan, Eric Hoffman, Gerd Ritter and Ralph Venhaus from the Ludwig Institute for Cancer Research for their assistance in clinical trial management. The authors also wish to thank Erin Horne for her assistance in obtaining blood samples from patients at M. D. Anderson Cancer Center. The authors also wish to thank Marla Johnson, Jason Love and Alana Bethea from M. D. Anderson Cancer Center for their assistance in clinical trial management and data management.
This work was supported in part by a Physician-Scientist Program Award and an Institutional Research Grant, both from The University of Texas M. D. Anderson Cancer Center, a Clinical Investigator Award from the Cancer Vaccine Collaborative of the Cancer Research Institute, and a Prostate Cancer Foundation Young Investigator Award (all to P.S).
References
- 1.Schwartz RH. T cell anergy. Annu Rev Immunol. 2003;21:305–34. doi: 10.1146/annurev.immunol.21.120601.141110. [DOI] [PubMed] [Google Scholar]
- 2.Sakaguchi S. Naturally arising CD4+ regulatory T cells for immunologic self-tolerance and negative control of immune responses. Annu Rev Immunol. 2004;22:531–62. doi: 10.1146/annurev.immunol.21.120601.141122. [DOI] [PubMed] [Google Scholar]
- 3.O’Garra A, Vieira P. Regulatory T cells and mechanisms of immune system control. Nat Med. 2004;10:801–5. doi: 10.1038/nm0804-801. [DOI] [PubMed] [Google Scholar]
- 4.Piccirillo CA, Thornton AM. Cornerstone of peripheral tolerance: naturally occurring CD4+CD25+ regulatory T cells. Trends Immunol. 2004;25:374–80. doi: 10.1016/j.it.2004.04.009. [DOI] [PubMed] [Google Scholar]
- 5.Jiang H, Chess L. An integrated view of suppressor T cell subsets in immunoregulation. J Clin Invest. 2004;114:1198–208. doi: 10.1172/JCI23411. [DOI] [PMC free article] [PubMed] [Google Scholar]
- 6.Baecher-Allan C, Viglietta V, Hafler DA. Human CD4+CD25+ regulatory T cells. Semin Immunol. 2004;16:89–98. doi: 10.1016/j.smim.2003.12.005. [DOI] [PubMed] [Google Scholar]
- 7.Sakaguchi S, Sakaguchi N, Asano M, Itoh M, Toda M. Immunologic self-tolerance maintained by activated T cells expressing IL-2 receptor alpha-chains (CD25). Breakdown of a single mechanism of self-tolerance causes various autoimmune diseases. J Immunol. 1995;155:1151–64. [PubMed] [Google Scholar]
- 8.Hori S, Nomura T, Sakaguchi S. Control of regulatory T cell development by the transcription factor Foxp3. Science. 2003;299:1057–61. doi: 10.1126/science.1079490. [DOI] [PubMed] [Google Scholar]
- 9.Fontenot JD, Gavin MA, Rudensky AY. Foxp3 programs the development and function of CD4+CD25+ regulatory T cells. Nat Immunol. 2003;4:330–6. doi: 10.1038/ni904. [DOI] [PubMed] [Google Scholar]
- 10.Marshall NA, Christie LE, Munro LR, et al. Immunosuppressive regulatory T cells are abundant in the reactive lymphocytes of Hodgkin lymphoma. Blood. 2004;103:1755–62. doi: 10.1182/blood-2003-07-2594. [DOI] [PubMed] [Google Scholar]
- 11.Woo EY, Chu CS, Goletz TJ, et al. Regulatory CD4(+)CD25(+) T cells in tumors from patients with early-stage non-small cell lung cancer and late-stage ovarian cancer. Cancer Res. 2001;61:4766–72. [PubMed] [Google Scholar]
- 12.Woo EY, Yeh H, Chu CS, et al. Cutting edge: regulatory T cells from lung cancer patients directly inhibit autologous T cell proliferation. J Immunol. 2002;168:4272–6. doi: 10.4049/jimmunol.168.9.4272. [DOI] [PubMed] [Google Scholar]
- 13.Ichihara F, Kono K, Takahashi A, Kawaida H, Sugai H, Fujii H. Increased populations of regulatory T cells in peripheral blood and tumor-infiltrating lymphocytes in patients with gastric and esophageal cancers. Clin Cancer Res. 2003;9:4404–8. [PubMed] [Google Scholar]
- 14.Wolf AM, Wolf D, Steurer M, Gastl G, Gunsilius E, Grubeck-Loebenstein B. Increase of regulatory T cells in the peripheral blood of cancer patients. Clin Cancer Res. 2003;9:606–12. [PubMed] [Google Scholar]
- 15.Miller AM, Lundberg K, Ozenci V, et al. CD4+CD25high T cells are enriched in the tumor and peripheral blood of prostate cancer patients. J Immunol. 2006;177:7398–405. doi: 10.4049/jimmunol.177.10.7398. [DOI] [PubMed] [Google Scholar]
- 16.Curiel TJ, Coukos G, Zhou L, et al. Specific recruitment of regulatory T cells in ovarian carcinoma fosters immune privilege and predicts reduced survival. Nat Med. 2004;10:942–9. doi: 10.1038/nm1093. [DOI] [PubMed] [Google Scholar]
- 17.Turner MS, Cohen PA, Finn OJ. Lack of effective MUC1 tumor antigen-specific immunity in MUC1-transgenic mice results from a Th/T regulatory cell imbalance that can be corrected by adoptive transfer of wild-type Th cells. J Immunol. 2007;178:2787–93. doi: 10.4049/jimmunol.178.5.2787. [DOI] [PubMed] [Google Scholar]
- 18.Gnjatic S, Nishikawa H, Jungbluth A, et al. NY-ESO-1: review of an immunogenic tumor antigen. Adv Cancer Res. 2006;95:1–30. doi: 10.1016/S0065-230X(06)95001-5. [DOI] [PubMed] [Google Scholar]
- 19.Jäger E, Nagata Y, Gnjatic S, et al. Monitoring CD8 T cell responses to NY-ESO-1: correlation of humoral and cellular immune responses. Proc Natl Acad Sci U S A. 2000;97:4760–5. doi: 10.1073/pnas.97.9.4760. [DOI] [PMC free article] [PubMed] [Google Scholar]
- 20.Gnjatic S, Atanackovic D, Jäger E, et al. Survey of naturally occurring CD4+ T cell responses against NY-ESO-1 in cancer patients: correlation with antibody responses. Proc Natl Acad Sci U S A. 2003;100:8862–7. doi: 10.1073/pnas.1133324100. [DOI] [PMC free article] [PubMed] [Google Scholar]
- 21.Nishikawa H, Jäger E, Ritter G, Old LJ, Gnjatic S. CD4+ CD25+ regulatory T cells control the induction of antigen-specific CD4+ helper T cell responses in cancer patients. Blood. 2005;106:1008–11. doi: 10.1182/blood-2005-02-0607. [DOI] [PubMed] [Google Scholar]
- 22.Jäger E, Gnjatic S, Nagata Y, et al. Induction of primary NY-ESO-1 immunity: CD8+ T lymphocyte and antibody responses in peptide-vaccinated patients with NY-ESO-1+ cancers. Proc Natl Acad Sci U S A. 2000;97:12198–203. doi: 10.1073/pnas.220413497. [DOI] [PMC free article] [PubMed] [Google Scholar]
- 23.Davis ID, Chen W, Jackson H, et al. Recombinant NY-ESO-1 protein with ISCOMATRIX adjuvant induces broad integrated antibody and CD4(+) and CD8(+) T cell responses in humans. Proc Natl Acad Sci U S A. 2004;101:10697–702. doi: 10.1073/pnas.0403572101. [DOI] [PMC free article] [PubMed] [Google Scholar]
- 24.Adams S, O’Neill DW, Nonaka D, et al. Immunization of malignant melanoma patients with full-length NY-ESO-1 protein using TLR7 agonist imiquimod as vaccine adjuvant. J Immunol. 2008;181:776–84. doi: 10.4049/jimmunol.181.1.776. [DOI] [PMC free article] [PubMed] [Google Scholar]
- 25.Sharma P, Bajorin DF, Jungbluth AA, Herr H, Old LJ, Gnjatic S. Immune responses detected in urothelial carcinoma patients after vaccination with NY-ESO-1 protein plus BCG and GM-CSF. J Immunother. 2008 doi: 10.1097/CJI.0b013e3181891574. in press. [DOI] [PubMed] [Google Scholar]
- 26.Nishikawa H, Qian F, Tsuji T, et al. Influence of CD4+CD25+ regulatory T cells on low/high-avidity T cells following peptide vaccination. J Immunol. 2006;176:6340–6. doi: 10.4049/jimmunol.176.10.6340. [DOI] [PubMed] [Google Scholar]
- 27.Cheng L, Ziegelhoffer PR, Yang NS. In vivo promoter activity and transgene expression in mammalian somatic tissues evaluated by using particle bombardment. Proc Natl Acad Sci U S A. 1993;90:4455–9. doi: 10.1073/pnas.90.10.4455. [DOI] [PMC free article] [PubMed] [Google Scholar]
- 28.Ciernik IF, Berzofsky JA, Carbone DP. Induction of cytotoxic T lymphocytes and antitumor immunity with DNA vaccines expressing single T-cell epitopes. J Immunol. 1996;156:2369–75. [PubMed] [Google Scholar]
- 29.Irvine KR, Rao JB, Rosenberg SA, Restifo NP. Cytokine enhancement of DNA immunization leads to effective treatment of established pulmonary metastases. J Immunol. 1996;156:238–45. [PMC free article] [PubMed] [Google Scholar]
- 30.Tang DC, DeVit M, Johnston SA. Genetic immunization is a simple method for eliciting an immune response. Nature. 1992;356:152–4. doi: 10.1038/356152a0. [DOI] [PubMed] [Google Scholar]
- 31.Harari A, Cellerai C, Enders FB, et al. Skewed associations of polyfunctional antigen-specific CD8 T cell populations with HLA-B genotype. Proc Natl Acad Sci U S A. 2007;104:16233–8. doi: 10.1073/pnas.0707570104. [DOI] [PMC free article] [PubMed] [Google Scholar]
- 32.Nishikawa H, Qian F, Tsuji T, et al. Influence of CD4+CD25+ regulatory T cells on low/high-avidity CD4+ T cells following peptide vaccination. J Immunol. 2006;176:6340–6. doi: 10.4049/jimmunol.176.10.6340. [DOI] [PubMed] [Google Scholar]
- 33.Nishikawa H, Tsuji T, Jager E, et al. Induction of regulatory T cell-resistant helper CD4+ T cells by bacterial vector. Blood. 2008;111:1404–12. doi: 10.1182/blood-2007-09-113761. [DOI] [PubMed] [Google Scholar]
- 34.Stockert E, Jäger E, Chen YT, et al. A survey of the humoral immune response of cancer patients to a panel of human tumor antigens. J Exp Med. 1998;187:1349–54. doi: 10.1084/jem.187.8.1349. [DOI] [PMC free article] [PubMed] [Google Scholar]
- 35.Atanackovic D, Altorki NK, Cao Y, et al. Booster vaccination of cancer patients with MAGE-A3 protein reveals long-term immunological memory or tolerance depending on priming. Proc Natl Acad Sci U S A. 2008;105:1650–5. doi: 10.1073/pnas.0707140104. [DOI] [PMC free article] [PubMed] [Google Scholar]
- 36.Gnjatic S, Nagata Y, Jäger E, et al. Strategy for monitoring T cell responses to NY-ESO-1 in patients with any HLA class I allele. Proc Natl Acad Sci U S A. 2000;97:10917–22. doi: 10.1073/pnas.97.20.10917. [DOI] [PMC free article] [PubMed] [Google Scholar]
- 37.Nishikawa H, Sato E, Briones G, et al. In vivo antigen delivery by a Salmonella typhimurium type III secretion system for therapeutic cancer vaccines. J Clin Invest. 2006;116:1946–54. doi: 10.1172/JCI28045. [DOI] [PMC free article] [PubMed] [Google Scholar]
- 38.Wang RF, Miyahara Y, Wang HY. Toll-like receptors and immune regulation: implications for cancer therapy. Oncogene. 2008;27:181–9. doi: 10.1038/sj.onc.1210906. [DOI] [PubMed] [Google Scholar]
- 39.Quezada SA, Peggs KS, Curran MA, Allison JP. CTLA-4-blockade and GMCSF combination immunotherapy alters the intra-tumor balance of effector and regulatory T cells. J Clin Invest. 2006;116:1935–45. doi: 10.1172/JCI27745. [DOI] [PMC free article] [PubMed] [Google Scholar]
- 40.Liakou C, Kamat A, Chen H, Ng Tang D, Sun J, Troncoso P, Logothetis C, Sharma P. CTLA-4 blockade increases IFN-γ-producing CD4+ICOShi T cells to shift the ratio of effector to regulatory T cells in cancer patients. Proc Natl Acad Sci USA. 2008;105:14987–14992. doi: 10.1073/pnas.0806075105. [DOI] [PMC free article] [PubMed] [Google Scholar]
Associated Data
This section collects any data citations, data availability statements, or supplementary materials included in this article.
Supplementary Materials
CD4+CD25low cells were proliferative when cultured alone but, autologous CD4+CD25hi T cells proliferated minimally in culture alone and suppressed proliferation of CD4+CD25low cells when the two cell populations were cultured together at a 1:1 ratio.
(A) CD4+FOXP3+ T cells are not significantly different in pre-vaccine samples as compared to post-vaccine samples at study weeks 3, 5, 7, 9, 11 and 13 in representative patient #P001. Gates for FOXP3 staining were set according to appropriate isotype controls as shown in the representative panel. (B) Graphical presentation of percentages of CD4+FOXP3+ T cells measured in pre-vaccine and post-vaccine samples from 9 prostate cancer patients. Samples were analyzed in triplicate and data is presented as mean ± standard deviation at each study week timepoint for each patient shown. Healthy donors (HD; N=10) had 5 ± 2% CD4+FOXP3+ T cells detected in their blood samples.
Arrows indicate time of vaccine administration for each of the three cohorts of patients.


