

Abstract
Standard Illumina libraries are biased toward sequences of intermediate GC-content. This results in an underrepresentation of GC-rich regions in sequencing projects of genomes with heterogeneous base composition, such as mammals and birds. We developed a simple, cost-effective protocol to enrich sheared genomic DNA in its GC-rich fraction by subtracting AT-rich DNA. This was achieved by heating DNA up to 90 °C before applying Illumina library preparation. We tested the new approach on chicken DNA and found that heated DNA increased average coverage in the GC-richest chromosomes by a factor up to six. Using a Taq polymerase supposedly appropriate for PCR amplification of GC-rich sequences had a much weaker effect. Our protocol should greatly facilitate sequencing and resequencing of the GC-richest regions of heterogeneous genomes, in combination with standard short-read and long-read technologies.
Keywords: GC content, GC enrichment, high-throughput sequencing, bird
Introduction
High-throughput sequencing technologies have decreased the cost of sequencing by several orders of magnitude over the last few decades (Reuter et al. 2015). Short-read technologies have increased the depth of coverage to values typically >60× for whole-genome sequencing and 15× for resequencing data (Sims et al. 2014). Unfortunately, depth of coverage is often far from evenly distributed across the sequenced genome. Biases in PCR amplification create uneven genomic representation in classical Illumina libraries (Dohm et al. 2008; Kozarewa et al. 2009; Aird et al. 2011), PCR being sensitive to extreme GC-content variation (Baskaran et al. 1996; Benita et al. 2003; Oyola et al. 2012). In consequence, the GC-rich regions of large, heterogeneous genomes are typically undercovered, therefore inefficiently assembled, when libraries are prepared following standard protocols (Hillier et al. 2004). A marked heterogeneity in GC-content has been identified in various genomes of relatively large size. In angiosperms, monocots and especially grasses (Poaceae) show a bimodal distribution of GC-content in protein-coding genes, with a class of very GC-rich genes (Yu et al. 2002; Serres-Giardi et al. 2012; Clément et al. 2014; Glémin et al. 2014). Most mammalian genomes, including the human genome, have a local GC-content that varies from 30% to >55% at the kilo-base scale (Lander et al. 2001; Cohen et al. 2005; Duret et al. 2006), and a similar pattern has been reported in honey bee (Apis mellifera) and several species of ants (The Honeybee Genome Sequencing Consortium et al. 2006; Smith et al. 2011).
The genomes of birds are arguably among the most heterogeneous with respect to GC-content, both within and among chromosomes. Birds show a particularly striking negative correlation between GC-content and chromosome size (Hillier et al. 2004): the bird karyotype includes a number of very small-sized chromosomes that are particularly GC-rich, underrepresented in short-read sequence data, and difficult to assemble. The original draft chicken genome assembly, for instance, only included 29 out of the 38 autosomes with the smallest chromosomes being missing (Hillier et al. 2004). Importantly, gene density is strongly correlated with GC-content in birds (fig. 1). The unassembled GC-rich regions actually contain a substantial portion—probably ∼15%—of the bird gene complement, which is currently missing from genome annotation databases, as we recently demonstrated from transcriptome analyses (Botero-Castro et al. 2017, see also Hron et al. 2015).
Fig. 1.
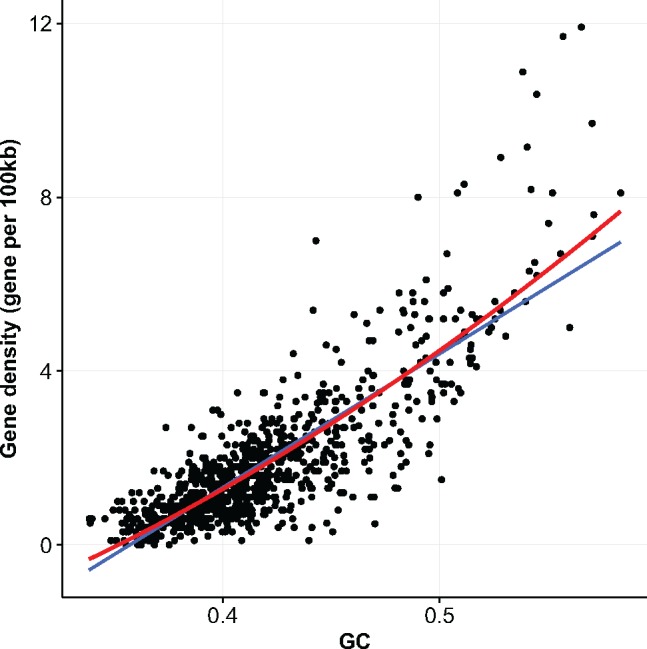
—Gene content and GC-content computed in 100-kb nonoverlapping windows across the chicken genomes (Gallus_gallus-5.0). Linear and quadratic regression lines are shown in blue and red, respectively.
There is, therefore, a clear need for DNA sequencing methods alleviating the GC bias. Single-molecule real-time (SMRT) sequencing technologies that do not rely on PCR have recently contributed to significantly improve genome assembly in large genomes (Davey et al. 2016; Gordon et al. 2016; Bickhart et al. 2017; Korlach et al. 2017; Warren et al. 2017; Weissensteiner et al. 2017). In birds, the chicken, zebra finch (Taeniopygia guttata), Anna’s hummingbird (Calypte anna), and hooded crow (Corvus cornix) assemblies have been improved using PacBio technologies with a coverage from ∼50× to 96× (Korlach et al. 2017; Warren et al. 2017; Weissensteiner et al. 2017). SMRT sequencing, however, remains relatively costly and error prone, and requires high quantity and quality of DNA, so that in many projects sequencing depth is mainly contributed by PCR-dependent technologies. Several attempts have been made to optimize PCR conditions, such as temperature ramp rate, denaturation time, chemical additives, and DNA polymerase, in order to reduce the GC bias during library preparation (Aird et al. 2011; Oyola et al. 2012). Aird et al. (2011), for instance, improved the homogeneity of coverage depth when applying optimized protocols to a mixture of bacterial DNA from three distinct species but they concluded that not a single protocol is appropriate in every situation. GC-rich and GC-poor DNA have distinct optimal PCR conditions, so that amplifying heterogeneous DNA is intrinsically a difficult problem.
Elaborating on this idea, we here suggest to isolate GC-rich DNA before sequencing it. We investigate a simple method aiming at enriching genomic DNA in its GC-rich fraction prior to library preparation. We show that a simple heat-denaturation and sizing of fragmented DNA before the blunt-end repair step results in a substantially increase in average GC-content of sequence reads. Applying this protocol to chicken DNA, we achieved a considerable increase in coverage depth of the GC-richest regions of the genome. The new approach is cheap, does not require high quantity or quality of DNA, and is complementary to the shotgun, mate pair and/or SMRT approaches.
Materials and Methods
DNA Extraction and Treatment Post-Illumina Library Preparation
Total genomic DNA was extracted from chicken tissue using DNAeasy Blood and Tissue kit (QIAGEN) following the manufacturer instructions. About 3 µg of total genomic DNA were sheared for 20 min using an ultrasonic cleaning unit (Elmasonic One). Sheared DNA was separated in six tubes of 50 µl containing 500 ng of DNA each. We applied different temperatures to the sheared DNA in order to denature it. Two samples (CHK2-75 and CHK2-85) were heated 5 min to 75 °C and 85 °C, respectively. Three samples (CHK3-75, CHK3-85, and CHK-90) were heated to 75 °C, 85 °C, and 90 °C, respectively, and submitted to a second step of shearing in an ultrasonic cleaning unit (Elmasonic One) during 5 min. One control sample (CHK1) was not heated. All samples were sized using AMPure (Agencourt) immediately after treatments (see table 1).
Table 1.
Pretreatments, Melting Temperature (Tm) and GC Content (FastQC) for Each Library
| Library | Heating (°C) | Shearing | Polymerase | DMSO (%) | Tm (°C) | GC Content (%) |
|---|---|---|---|---|---|---|
| CHK1 | No | No | Phusion | 0 | 86 | 41 |
| CHK1 | No | No | Kapa | 0 | 86 | 41 |
| CHK2-75 | 75 | No | Phusion | 0 | 86 | 41 |
| CHK2-75 | 75 | No | Kapa | 0 | 86 | 41 |
| CHK3-75 | 75 | 5 min | Phusion | 0 | 86 | 41 |
| CHK3-75 | 75 | 5 min | Kapa | 0 | 86 | 41 |
| CHK2-85 | 85 | No | Phusion | 0 | 88 | 51 |
| CHK2-85 | 85 | No | Kapa | 0 | 89.5 | 52 |
| CHK3-85 | 85 | 5 min | Phusion | 0 | 88 | 51 |
| CHK3-85 | 85 | 5 min | Kapa | 0 | 89.5 | 52 |
| CHK-90 | 90 | 5 min | Kapa | 3 | 86, 91, 94 | 59 |
Library Preparation and Sequencing
Illumina library preparation followed the classical protocol involving blunt-end repair, adapter ligation, and adapter fill-in steps as developed by Meyer and Kircher (Meyer and Kircher 2010) with slight modifications as explained by Tilak et al. (2015). The full protocol has been deposited in protocols.io dx.doi.org/10.17504/protocols.io.jxicpke. Libraries were quantified using a Nanodrop ND-8000 spectrophotometer (Nanodrop technologies). About 5 ng of each library (except CHK-90) were PCR indexed using Taq Phusion (Phusion High-Fidelity DNA Polymerase Thermo Scientific) and KAPA HiFi (2× KAPA HiFi HotStart ReadyMix KAPABIOSYSTEMS) polymerases because these amplification enzymes could have different GC biases (Quail et al. 2011). CHK-90 was only amplified with KAPA HIFI and 3% DMSO, so that 11 index libraries were generated—one for CHK-90 and two for each of the other five conditions. Indexed libraries were purified using AMPure (Agencourt) ratio 1.6, quantified with Nanodrop ND-800, and pooled in equimolar ratio. The pool of indexed libraries was single-read sequenced on one lane of Illumina HiSeq 2500 at GATC-Biotech (Konstanz, Germany).
Fusion Curves
We generated fusion curves in order to check the effect of pretreatments on the GC-content of the constructed libraries. About 5 ng of each indexed PCR was mixed with ResoLight ROCHE 20× (fluorescent molecule) for a final volume of 10 µl. The libraries were heated from 65 °C to 98 °C with increasing ramp to 0.02 °C per second and 25 acquisitions per degree using the High Resolution Melting program of ROCHE Light Cycler 480. The melting curves were obtained for all libraries and their negative first-derivative (−100 × dF/dT) were calculated to estimate the corresponding melting temperatures (Tm).
Sequence Analyses
For a fair comparison between libraries, we generated 11 data sets of exactly eight millions of 101-bp reads each. This was achieved by randomly subsampling in fastq files prior to any quality control or filtering step (see command line in supplementary material online). The quality and GC-content of the data obtained in this study were assessed using FastQC 0.11.4 (Andrews 2010. Available at: https://www.bioinformatics.babraham.ac.uk/projects/fastqc/). Reads were cleaned with Trimmomatic (Bolger et al. 2014) using parameters: “LEADING: 3 TRAILING: 3 SLIDINGWINDOW: 4: 15 MINLEN: 50.” Cleaned reads were mapped onto the reference genome Gallus_gallus-5.0 using Bowtie2 with default parameters (Langmead and Salzberg 2012). The number of reads mapped to each chromosome and scaffold was computed using SAMtools. We also computed the number of reads mapped to small contigs that are not associated to any chromosome or linkage group (LG) in the Gallus_gallus-5.0 assembly. The size of these contigs varied from 200 to 209,746 bp, with an average of 8,964 bp. These contigs represent the badly assembled regions of the chicken genome. To analyze the relationship between depth of coverage and GC-content, we sorted the contigs according to GC-content and divided them in 29 bins of 623 contigs. Contigs with the 5% highest coverage were excluded from the analysis.
Results
We first analyzed fusion curves in order to estimate the melting temperature (Tm), which, is known to be positively correlated to GC-content (Marmur and Doty 1962). Tm was not notably different between CHK1, CHK2-75, and CHK3-75 regardless of the enzyme used for amplification. These results suggest that GC-content was nearly the same for these libraries. In contrast, the libraries constructed from DNA heated to 85 °C and 90 °C had a significantly increased Tm, compared with CHK1, suggesting a GC enrichment (fig. 2). There was no conspicuous difference in Tm between CHK2-85 and CHK3-85, suggesting that an additional 5-min DNA shearing after heating has no strong effect on GC-content.
Fig. 2.

—Melting curves of a standard (CHK1, blue) and three heated (CHK2-85, CHK3-85, CHK-90) Illumina libraries.
GC-content was estimated for each library using FastQC (table 1). In agreement with the analysis of melting curves, GC-content was significantly increased when DNA was heated to a temperature of 85 °C or higher (table 1): the average GC-content of reads was increased from 41% (unheated) to 52% (85 °C) and up to 59% (90 °C). In contrast, GC-content was similar between CHK1, CHK2-75, and CHK3-75. The choice of DNA polymerase (Taq Phusion or Kapa Hifi) only had a weak effect on GC-content in treatments CHK2-85 and CHK3-85.
Eight million reads from each of the 11 libraries were mapped to the chicken genome Gallus_gallus-5.0. Average expected genome coverage is 0.67× per library. In agreement with the Tm and FastQC results, the number of reads that mapped onto reference genome was similar between libraries CHK1, CHK2-75, and CHK3-75, on one hand, and between CHK2-85 and CHK3-85, on the other hand. The results for libraries CHK1, CHK2-85, and CHK-90 are shown in table 2. The average GC-content of mapped reads was also considerably higher in the CHK2-85 and, particularly, CHK-90 libraries when compared with that of CHK1 and this was true of all the groups of chromosomes. This indicates that heating libraries has not only improved depth of coverage in small, GC-rich chromosomes but also for the GC-richest regions of large, GC-heterogeneous chromosomes. In addition, note that the percentage of mapped reads was higher in heated than in unheated treatments for chromosomes having an average GC-content >42% (table 2). The proportion of reads mapped onto the different chromosomes clearly reflects the increased average GC-content, and more homogeneous coverage, of heated libraries (fig. 3). This result indicates that heating sheared DNA before library preparation makes it possible to sequence GC-rich genomic DNA fragments that are otherwise essentially out of reach when using the standard protocols.
Table 2.
Mapping of Reads from Standard (CHK1) and Heated (CHK2-85, CHK-90) Libraries to the Reference Chicken Genome
| CHK1 |
CHK2-85 |
CHK-90 |
||||||
|---|---|---|---|---|---|---|---|---|
| Chromosomes (% GC) | (%) Mapped Reads | (%) GC Mapped Reads | (%) Mapped Reads | (%) GC Mapped Reads | Coverage Increasea | (%) Mapped Reads | (%) GC Mapped Reads | Coverage Increasea |
| 1–5 (40.3%) | 58.5 | 39 | 43.4 | 51 | <1 | 41.1 | 60 | <1 |
| 6–10 (42.3%) | 13.4 | 41 | 14 | 52 | ∼1 | 13.1 | 66 | ∼1 |
| 11–15 (42.8%) | 7.6 | 43 | 10.4 | 53 | ∼1.4 | 10.9 | 67 | ∼1.4 |
| 16–20 (47.7%) | 3.4 | 46 | 6.9 | 54 | ∼2 | 7.3 | 68 | ∼2.1 |
| 21–25 (50%) | 2.2 | 48 | 5.2 | 55 | ∼2.4 | 5.2 | 68 | ∼2.4 |
| 26–31 (53%) | 1.4 | 51 | 3.9 | 56 | 2.8 | 5.8 | 69 | ∼4.1 |
| 32–33 (54.9%) | 0.06 | 53 | 0.4 | 58 | 6.6 | 0.4 | 70 | 6.6 |
| W-Z-LGE64 (41.3%) | 4.6 | 40 | 4.7 | 52 | ∼1 | 4.27 | 60 | <1 |
Coverage increase was calculated by dividing the percentage of mapped reads of CHK2-85 (respectively, CHK-90) by that of CHK1.
Fig. 3.

—(A) Proportion of reads mapped to the various chromosomes of the chicken genome. Colors represent the different libraries. Chromosomes are sorted according to average GC-content. (B) Average GC-content of chromosomes.
Calculating the average depth of coverage per group of chromosomes, we found that heated libraries yielded a higher coverage than unheated one for chromosomes with average GC-content >43%, with up to a 6-fold increase in the GC-richest ones (table 2). Finally, we analyzed the coverage of small chicken contigs. These contigs represent the badly assembled regions of the chicken genome that are not assigned to any specific chromosome; some of them have a very high GC-content. Reads from CHK1 yielded a negative correlation between contig coverage and GC-content: depth of coverage dropped by a factor of 2.5 as GC increased from 33% to 65% (fig. 4). In contrast, with CHK2-85 contigs coverage increased with GC-content and reached a plateau ∼55% of GC for library CHK2-85 (fig. 4).
Fig. 4.
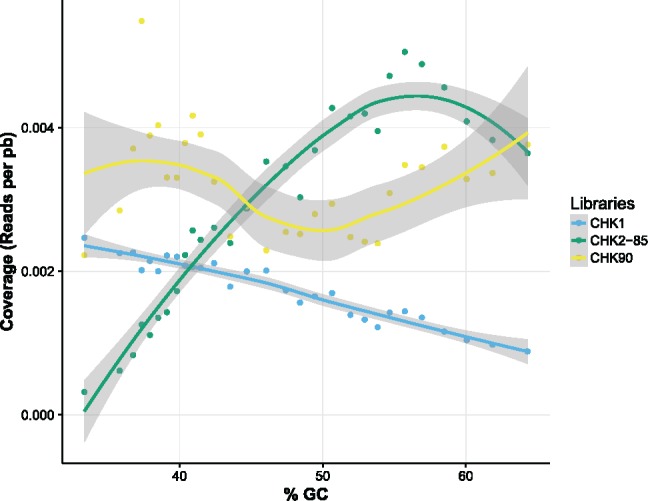
—Relationship between GC-content and coverage recorded on the small contigs of the chicken genome. Contigs are divided into 29 groups (represented by 29 dots with an equal number of contigs) according to their GC-content.
Discussion
Illumina library construction protocols are generally recognized to be biased toward fragments of intermediate GC-content, the GC-richest fraction of the target DNA being underrepresented (van Dijk et al. 2014). Here, we introduce a simple, cheap protocol that leads to a substantial decrease of this bias. Heating DNA to temperatures >85 °C prior to library preparation increased coverage in the GC-richest fraction of the chicken genome by a factor of up to 6. We speculate that this happens because 1) AT-rich regions are underrepresented as double-stranded DNA in heated solutions due to their lower melting temperature, and 2) adapter ligation and further steps of library construction specifically target double-stranded DNA.
Our GC-enrichment protocol will complement existing approaches for optimal sequencing of GC-heterogeneous genomes. We suggest that a promising strategy for, for example, bird genome sequencing would involve combining high-coverage, standard Illumina libraries, high-coverage, GC-enriched Illumina libraries, and medium-coverage SMRT reads. Illumina reads would here be used to correct for sequencing errors in SMRT reads (Salmela and Rivals 2014), and the GC-enriched library would ensure accurate correction across all regions of the genome. We expect this approach to substantially improve the efficiency of de novo genome sequencing in birds, but also in mammals, nonavian reptiles, hymenopterans, monocots, and presumably a number of additional taxa with GC-heterogeneous genomes. Our approach should also facilitate the optimization of PCR conditions (Baskaran et al. 1996; Aird et al. 2011; Oyola et al. 2012) by decreasing the heterogeneity of matrix GC-content.
Gene density is positively correlated to GC-content in birds (Hillier et al. 2004; Axelsson et al. 2005). The unassembled/unannotated GC-rich regions, even if they represent a modest fraction of the genome, contain many genes of interest that so far have been absent from functional and comparative genomic analyses in birds (Botero-Castro et al. 2017) and potentially in other taxa of similarly heterogeneous base composition. Accessing this information requires to increase the coverage in GC-rich regions, which with standard protocols would imply a proportional increment of total sequencing cost. Our approach provides a simple way to alleviate this problem at low cost.
Besides de novo sequencing, our protocol should also be quite helpful in resequencing projects. SNP and, particularly, SNV detection in birds is currently limited by the low depth of coverage typically achieved in GC-rich regions (International Chicken Polymorphism Map Consortium 2004; Rubin et al. 2010; Ellegren et al. 2012; Poelstra et al. 2014). Metagenomics is another potential field of application of this approach. Microbes, particularly bacteria, are characterized by a wide distribution of genome GC-content across species—some species reach a genome average >75% GC (Galtier and Lobry 1997; Lassalle et al. 2015). Environmental samples, which contain a mixture of numerous bacterial species, are therefore typically heterogeneous with respect to GC-content, so that libraries prepared with standard protocols provide a biased sample of the existing microbial communities (Choudhari and Grigoriev 2017). Correcting for this bias implies developing specific enrichment protocols targeting both the GC-rich, as in this study, and the AT-rich fraction of the sampled DNA.
Supplementary Material
Supplementary data are available at Genome Biology and Evolution online.
Supplementary Material
Acknowledgments
The authors thank Philippe Clair for helpful discussion and the Montpellier GenomiX qPCR core facility of University of Montpellier, France. The analyses benefited from the Montpellier Bioinformatics Biodiversity platform services. This work was supported by Agence Nationale de la Recherche grant ANR-14-CE02-0002-01 “BirdIslandGenomic” to B.N.
Literature Cited
- Aird D, et al. 2011. Analyzing and minimizing PCR amplification bias in Illumina sequencing libraries. Genome Biol. 122:R18.. [DOI] [PMC free article] [PubMed] [Google Scholar]
- Axelsson E, Webster MT, Smith NG, Burt DW, Ellegren H.. 2005. Comparison of the chicken and turkey genomes reveals a higher rate of nucleotide divergence on microchromosomes than macrochromosomes. Genome Res. 151:120–125. [DOI] [PMC free article] [PubMed] [Google Scholar]
- Baskaran N, et al. 1996. Uniform amplification of a mixture of deoxyribonucleic acids with varying GC content. Genome Res. 67:633–638.http://dx.doi.org/10.1101/gr.6.7.633 [DOI] [PubMed] [Google Scholar]
- Benita Y, Oosting RS, Lok MC, Wise MJ, Humphery-Smith I.. 2003. Regionalized GC content of template DNA as a predictor of PCR success. Nucleic Acids Res. 3116:e99.. [DOI] [PMC free article] [PubMed] [Google Scholar]
- Bickhart DM, et al. 2017. Single-molecule sequencing and chromatin conformation capture enable de novo reference assembly of the domestic goat genome. Nat Genet. 49:643. [DOI] [PMC free article] [PubMed] [Google Scholar]
- Bolger AM, Lohse M, Usadel B.. 2014. Trimmomatic: a flexible trimmer for Illumina sequence data. Bioinformatics 3015:2114–2120.http://dx.doi.org/10.1093/bioinformatics/btu170 [DOI] [PMC free article] [PubMed] [Google Scholar]
- Botero-Castro F, Figuet E, Tilak M-K, Nabholz B, Galtier N.. 2017. Avian genomes revisited: hidden genes uncovered and the rates versus traits paradox in birds. Mol Biol Evol. 34:3123–3131. [DOI] [PubMed] [Google Scholar]
- Choudhari S, Grigoriev A.. 2017. Phylogenetic heatmaps highlight composition biases in sequenced reads. Microorganisms 5:4. [DOI] [PMC free article] [PubMed]
- Clément Y, Fustier M-A, Nabholz B, Glémin S.. 2014. The bimodal distribution of genic GC content is ancestral to monocot species. Genome Biol Evol. 71:336–348. [DOI] [PMC free article] [PubMed] [Google Scholar]
- Cohen N, Dagan T, Stone L, Graur D.. 2005. GC composition of the human genome: in search of isochores. Mol Biol Evol. 225:1260–1272.http://dx.doi.org/10.1093/molbev/msi115 [DOI] [PubMed] [Google Scholar]
- Davey JW, et al. 2016. Major improvements to the Heliconius melpomene genome assembly used to confirm 10 chromosome fusion events in 6 million years of butterfly evolution. G3 (Bethesda) 6:695–708.http://dx.doi.org/10.1534/g3.115.023655 [DOI] [PMC free article] [PubMed] [Google Scholar]
- Dohm JC, Lottaz C, Borodina T, Himmelbauer H.. 2008. Substantial biases in ultra-short read data sets from high-throughput DNA sequencing. Nucleic Acids Res. 3616:e105.. [DOI] [PMC free article] [PubMed] [Google Scholar]
- Duret L, Eyre-Walker A, Galtier N.. 2006. A new perspective on isochore evolution. Gene 385:71–74.http://dx.doi.org/10.1016/j.gene.2006.04.030 [DOI] [PubMed] [Google Scholar]
- Ellegren H, et al. 2012. The genomic landscape of species divergence in Ficedula flycatchers. Nature 4917426:756–760. [DOI] [PubMed] [Google Scholar]
- Galtier N, Lobry JR.. 1997. Relationships between genomic G+ C content, RNA secondary structures, and optimal growth temperature in prokaryotes. J Mol Evol. 446:632–636. [DOI] [PubMed] [Google Scholar]
- Glémin S, Clément Y, David J, Ressayre A.. 2014. GC content evolution in coding regions of angiosperm genomes: a unifying hypothesis. Trends Genet. 307:263–270. [DOI] [PubMed] [Google Scholar]
- Gordon D, et al. 2016. Long-read sequence assembly of the gorilla genome. Science 3526281:aae0344.. [DOI] [PMC free article] [PubMed] [Google Scholar]
- Hillier LW, et al. 2004. Sequence and comparative analysis of the chicken genome provide unique perspectives on vertebrate evolution. Nature 432:695–716.http://dx.doi.org/10.1038/nature03154 [DOI] [PubMed] [Google Scholar]
- Hron T, Pajer P, Pačes J, Bartůněk P, Elleder D.. 2015. Hidden genes in birds. Genome Biol. 16:164.. [DOI] [PMC free article] [PubMed] [Google Scholar]
- International Chicken Polymorphism Map Consortium. A genetic variation map for chicken with 2.8 million single-nucleotide polymorphisms. Nature 432:717. [DOI] [PMC free article] [PubMed]
- Korlach J, et al. 2017. De novo PacBio long-read and phased avian genome assemblies correct and add to reference genes generated with intermediate and short reads. GigaScience 610:1–16.http://dx.doi.org/10.1093/gigascience/gix085 [DOI] [PMC free article] [PubMed] [Google Scholar]
- Kozarewa I, et al. 2009. Amplification-free Illumina sequencing-library preparation facilitates improved mapping and assembly of (G + C) -biased genomes. Nat. Methods. 6:291–295. [DOI] [PMC free article] [PubMed] [Google Scholar]
- Lander ES, et al. 2001. Initial sequencing and analysis of the human genome. Nature 409:860–921.http://dx.doi.org/10.1038/35057062 [DOI] [PubMed] [Google Scholar]
- Langmead B, Salzberg SL.. 2012. Fast gapped-read alignment with Bowtie 2. Nat Methods 94:357–359.http://dx.doi.org/10.1038/nmeth.1923 [DOI] [PMC free article] [PubMed] [Google Scholar]
- Lassalle F, Périan S, Bataillon T, Nesme X.. 2015. GC-content evolution in bacterial genomes : the biased gene conversion hypothesis expands. PLoS Genet. 11:e1004941. [DOI] [PMC free article] [PubMed]
- Marmur J, Doty P.. 1962. Determination of the base composition of deoxyribonucleic acid from its thermal denaturation temperature. J Mol Biol. 5:109–118.http://dx.doi.org/10.1016/S0022-2836(62)80066-7 [DOI] [PubMed] [Google Scholar]
- Meyer M, Kircher M.. 2010. Illumina sequencing library preparation for highly multiplexed target capture and sequencing. Cold Spring Harb Protoc. 20106:pdb.prot5448.. [DOI] [PubMed] [Google Scholar]
- Oyola SO, et al. 2012. Optimizing Illumina next-generation sequencing library preparation for extremely AT-biased genomes. BMC Genomics 131:1..http://dx.doi.org/10.1186/1471-2164-13-1 [DOI] [PMC free article] [PubMed] [Google Scholar]
- Poelstra JW, et al. 2014. The genomic landscape underlying phenotypic integrity in the face of gene flow in crows. Science 3446190:1410–1414.http://dx.doi.org/10.1126/science.1253226 [DOI] [PubMed] [Google Scholar]
- Quail M. a, et al. 2011. Optimal enzymes for amplifying sequencing libraries. Nat Methods 91:10–11.http://dx.doi.org/10.1038/nmeth.1814 [DOI] [PubMed] [Google Scholar]
- Reuter JA, Spacek DV, Snyder MP.. 2015. High-throughput sequencing technologies. Mol Cell 584:586–597.http://dx.doi.org/10.1016/j.molcel.2015.05.004 [DOI] [PMC free article] [PubMed] [Google Scholar]
- Rubin C-J, et al. 2010. Whole-genome resequencing reveals loci under selection during chicken domestication. Nature 4647288:587–591.http://dx.doi.org/10.1038/nature08832 [DOI] [PubMed] [Google Scholar]
- Salmela L, Rivals E.. 2014. LoRDEC: accurate and efficient long read error correction. Bioinformatics 30:3506–3514. [DOI] [PMC free article] [PubMed] [Google Scholar]
- Serres-Giardi L, Belkhir K, David J, Glémin S.. 2012. Patterns and evolution of nucleotide landscapes in seed plants. Plant Cell 244:1379–1397. [DOI] [PMC free article] [PubMed] [Google Scholar]
- Sims D, Sudbery I, Ilott NE, Heger A, Ponting CP.. 2014. Sequencing depth and coverage: key considerations in genomic analyses. Nat Rev Genet. 152:121–132.http://dx.doi.org/10.1038/nrg3642 [DOI] [PubMed] [Google Scholar]
- Smith CD, et al. 2011. Draft genome of the globally widespread and invasive Argentine ant (Linepithema humile). Proc Natl Acad Sci U S A. 10814:5667–5678. [DOI] [PMC free article] [PubMed] [Google Scholar]
- The Honeybee Genome Sequencing Consortium, others. 2006. Insights into social insects from the genome of the honeybee Apis mellifera. Nature 443:931. [DOI] [PMC free article] [PubMed] [Google Scholar]
- Tilak M-K, et al. 2015. A cost-effective straightforward protocol for shotgun Illumina libraries designed to assemble complete mitogenomes from non-model species. Conserv Genet Resour. 71:37–40.http://dx.doi.org/10.1007/s12686-014-0338-x [Google Scholar]
- van Dijk EL, Jaszczyszyn Y, Thermes C.. 2014. Library preparation methods for next-generation sequencing: tone down the bias. Exp Cell Res. 3221:12–20. [DOI] [PubMed] [Google Scholar]
- Warren WC, et al. 2017. A new chicken genome assembly provides insight into avian genome structure. G3 (Bethesda) 7:109–117.http://dx.doi.org/10.1534/g3.116.035923 [DOI] [PMC free article] [PubMed] [Google Scholar]
- Weissensteiner MH, et al. 2017. Combination of short-read, long-read, and optical mapping assemblies reveals large-scale tandem repeat arrays with population genetic implications. Genome Res. 275:697–708.http://dx.doi.org/10.1101/gr.215095.116 [DOI] [PMC free article] [PubMed] [Google Scholar]
- Yu J, et al. 2002. A draft sequence of the rice genome (Oryza sativa L. ssp. indica). Science 296:79–92. [DOI] [PubMed] [Google Scholar]
Associated Data
This section collects any data citations, data availability statements, or supplementary materials included in this article.