

Abstract
Objective
To determine the comparative diagnostic characteristics of neuropathy measures in an obese population.
Methods
We recruited obese participants from the University of Michigan’s Weight Management Program. Receiver operative characteristic analysis determined the area under the curve (AUC) of neuropathy measures for distal symmetric polyneuropathy (DSP), small fiber neuropathy (SFN), and cardiovascular autonomic neuropathy (CAN). The best test combinations were determined using stepwise and Score subset selection models.
Results
We enrolled 120 obese participants. For DSP, seven of 42 neuropathy measures (Utah Early Neuropathy Score (UENS, N=62), Michigan Neuropathy Screening Instrument (MNSI) reduced combined index, MNSI examination, nerve fiber density (NFD) leg, tibial F response, MNSI questionnaire, peroneal distal motor latency) had AUCs ≥ 0.75. Three of 19 small fiber nerve measures for SFN (UENS, NFD leg, Sudoscan feet (N=70)) and zero of 16 CAN measures had AUCs ≥ 0.75. Combinations of tests performed better than individual tests with AUCs of 0.82 for DSP (two parameters) and 0.84 for SFN (three parameters).
Conclusions
Many neuropathy measures demonstrate good test performance for DSP in obese participants. Select few small fiber nerve measures performed well for SFN, and none for CAN.
Significance
Specific combinations of tests should be used for research studies to maximize diagnostic performance in obese cohorts.
Keywords: Diagnostic tests, distal symmetric polyneuropathy, small fiber neuropathy, cardiovascular autonomic neuropathy, obesity
Introduction
Globally, the prevalence of overweight and obesity has increased by more than 27% over the last 33 years.(Ng et al., 2014) Given this worldwide epidemic and the association between obesity and peripheral neuropathy, there is a need to investigate the diagnostic characteristics of neuropathy measures in obese populations.(Tesfaye et al., 2005, Van Acker et al., 2009) It is well documented that neuropathy measures are susceptible to the effects of age, height, and temperature,(Denys, 1991, Rivner et al., 2001) yet few studies to date have examined the effect of body habitus, and none comparing a comprehensive list of neuropathy measures in an obese population. This is a critical point because obesity is a potential confounding factor in the quantitative assessments of neuropathy.(Boyraz et al., 2010)
Obese patients can develop multiple types of peripheral neuropathy including distal symmetric polyneuropathy (DSP), small fiber neuropathy (SFN), and cardiovascular autonomic neuropathy (CAN).(Callaghan et al., 2012, Callaghan et al., 2015) Many neuropathy measures exist to evaluate each of these conditions, but few studies compare these measures and none have focused on obese populations. Furthermore, past studies often report sensitivity and specificity without reporting the area under the curve (AUC) to allow direct comparisons between tests.(McArthur et al., 1998, Baraz et al., 2014) Therefore, further information is needed regarding the comparative performance of neuropathy tests, as well as the best combinations of these tests, for the most common subtypes of neuropathy in obese populations.
In the current study, we performed extensive neuropathy testing in a cohort of obese participants. We aimed to determine the diagnostic characteristics of neuropathy measures, including combinations of tests, utilizing a clinical definition of DSP regardless of the underlying cause of neuropathy. Furthermore, we studied the test performance of small fiber neuropathy measures for SFN and CAN among our obese participants, and investigated the correlation between large fiber measures and separately between small fiber measures. This is the first report of the comparative diagnostic characteristics of comprehensive neuropathy measures for the most common subtypes of peripheral neuropathy in a well-characterized, obese population. As the obesity prevalence continues to increase worldwide, the importance of choosing the best neuropathy measures in this population will also continue to rise.
Materials and methods
Population
We recruited obese patients attending the University of Michigan Weight Management Program (prior to starting a diet/exercise regimen) from November 2010 to December 2015 as previously described.(Callaghan et al., 2016) Briefly, participants were required to have a body mass index (BMI) ≥ 35 kg/m^2 or ≥ 32 kg/m^2 if they had one or more medical condition in addition to obesity.(Rothberg et al., 2015) Of note, neuropathy was not considered as a medical condition for inclusion. Participants were excluded if they were on anticoagulant medications since these therapies increase the risks associated with skin biopsy.
This study was approved by the University of Michigan Institutional Review Board, and all participants signed an informed consent.
Primary outcome- DSP
Clinical DSP was defined according to the Toronto consensus definition of probable polyneuropathy, which requires 2 or more of the following: neuropathy symptoms, abnormal sensory examination, and abnormal reflexes.(Dyck et al., 2011) Of note, a clinical definition of neuropathy provides sufficient accuracy for use in epidemiologic studies and clinical practice.(England et al., 2005, Pop-Busui et al., 2017) One of four board certified neuromuscular specialists performed a standardized history and examination to determine these criteria.
Secondary outcome- SFN
Clinical SFN was defined according to the Toronto consensus definition of probable SFN, which requires neuropathic symptoms and an abnormal small fiber sensory examination (based on pinprick sensation).(Malik et al., 2011)
Secondary outcome- CAN
CAN was defined as an abnormality on one or more of four cardiovascular reflex tests (expiration to inspiration (E:I) ratio, 30:15 ratio, the average of two Valsalva ratios, and orthostatic hypotension defined as a systolic blood pressure drop of more than 20 or a diastolic blood pressure drop of more than 10).This definition was chosen because autonomic symptoms do not correlate with autonomic measures,(Low et al., 2004, Pop-Busui et al., 2009) which precludes use of a comparable clinical definition of autonomic neuropathy. Furthermore, cardiovascular reflex tests are associated with mortality(Maser et al., 2003) and are considered the gold standard definition of autonomic neuropathy.(Spallone et al., 2011) Lean controls from a recent study were used to determine 5th percentile cutoffs for the first three cardiovascular reflex tests.(Callaghan et al., 2016)
Measures of large fiber nerve injury
Nerve conduction studies were performed by a certified nerve conduction study technologist using the CareFusion’s Viking on Nicolet EDX electrodiagnostic system. A total of six nerves (sural sensory, peroneal motor, tibial motor, ulnar sensory, median sensory, median motor) and 17 parameters were measured. Quantitative sensory testing (QST) measurements of vibration detection thresholds were performed using the WR Medical Electronics Co. Computer Aided Sensory Evaluator (CASE) IV. The CASE IV vibration stimulator was placed on the dorsum of the dominant great toe. The patient’s vibration detection threshold was measured as the Just Noticeable Difference (JND). Monofilament testing was performed with a Semmes Weinstein 5.07/10-g monofilament on the dorsum of the dominant great toe. Monofilament testing was normal if the participant felt 8 or more out of 10 responses, reduced for 1-7 responses, and absent for zero responses. Neurothesiometer testing was performed using the Scientific Laboratory Supplies device on the plantar surface of the dominant great toe. The Neurothesiometer applies 0-50 Volts, which provides a corresponding vibration amplitude between 0-250 microns. Intensity was increased until it was reliably felt, and we used the average of three trials. The Michigan Neuropathy Screening Instrument (MNSI) questionnaire and examination (performed by a neuromuscular specialist) were performed as previously described.(Feldman et al., 1994) We also calculated the MNSI reduced combined index, which utilizes the most predictive questionnaire and examination components, based on a previous study.(Herman et al., 2012)
Measures of small fiber nerve injury
NFD was evaluated using brightfield immunohistochemistry. Fibers were labeled with rabbit anti-PGP 9.5 antibody and individual nerve fibers that cross into the epidermis were counted based on an established protocol.(Lauria et al., 2010) The total fiber count was calculated by averaging the fibers in 4 sections of skin at each biopsy site (fibers per millimeter). NFD was measured at the distal leg (10cm above the lateral malleolus) and proximal thigh (20cm below the anterior superior iliac spine) of the patients left leg from a 3mm skin biopsy.(Callaghan et al., 2012) Quantitative sensory testing (QST) measurements of cold detection thresholds were performed using CASE IV as described above. The thermal stimulator was placed on the dorsum of the dominant foot and the JND was recorded. The Utah Early Neuropathy Scale (UENS), performed by a neuromuscular specialist, was completed as previously described.(Singleton et al., 2008) Quantitative sudomotor axon reflex testing (QSART) measurements were performed on the dominant foot, distal leg, proximal leg, and arm using the WR Medical Electronics Co. Q-Sweat, Quantitative Sweat Measurement System.(Low et al., 2006) The Sudoscan (Impeto Medical) measured the electrochemical skin conductance (ESC) of the hands and feet through reverse iontophoresis and chronoamperometry, and we report the average hand and foot values.(Selvarajah et al., 2015) All cardiovascular autonomic tests were performed using the ANX 3.0 device (Ansar Group, Inc). Specific measurements that were recorded include the resting mean heart rate, frequency-domain measures (low frequency area (LFA, measure of sympathetic activity), respiratory frequency area (RFA, measure of parasympathetic activity), and LFA/RFA (measure of sympathovagal balance), and time-domain measures (standard deviation of the normal to normal interval (sdNN) and root mean square of successive differences of the normal to normal interval (rmsSD).
Of note, 61 obese participants had the neurothesiometer performed, 62 had UENS performed, and 70 had the Sudoscan performed because these tests were added after the study had already commenced.
Statistical analyses
Descriptive statistics were used to characterize the obese population. Univariable logistic regression models were constructed for DSP (dependent variable) and for each of the 42 neuropathy measures (independent variables). When modeling SFN and CAN, only the 19 small fiber nerve measures (excluding the cardiovascular reflex tests for autonomic neuropathy) were analyzed. Receiver operating characteristic (ROC) curves were generated as a result of each logistic regression model and the area under the ROC curve (AUC) was calculated along with 95% confidence intervals (CI). To determine whether a combination of neuropathy measures could lead to increased classification ability, multivariable logistic regression models were utilized. The neuropathy measures that collectively created the best fitting models were determined using stepwise and score subset selection procedures. The neuropathy measures considered in the model selection procedures were those that performed the best as classifiers in the univariate models for DSP and SFN respectively. Only one test per category and those tests not requiring a physician were included. Sudoscan and neurothesiometer were not included because they were only performed on a subset of the population. All 17 NCS parameters were included in the model selection procedures to determine the best combination of NCS studies for DSP. Pearson’s Correlations were used to evaluate relationships between large fiber and between small fiber neuropathy measures.
All analyses were performed with SAS 9.3 (Cary, NC).
Results
Population
During the recruitment time period, the Investigational Weight Management Clinic enrolled 752 patients. Of these patients, 468 consented to be contacted about research studies with 120 enrolling in our study. Of the 120 obese participants, 27 had DSP and 18 had SFN, and 21 had CAN.
Demographics
The obese population had a mean age (SD) of 52.9 years (10.6) with 44.2% males (Table 1). Those without diabetes had a fasting glucose of 96.0 mg/dL (10.2) and 2 hour glucose level of 117.3 mg/dL (28.9). The mean BMI was 41.1 kg/m^2 with a waist circumference of 122.5 cm (17.2).
Table 1.
Demographics of the obese population.
| Variable | Obese group N=120 |
|---|---|
|
| |
| Age (years), mean (SD) | 52.9 (10.6) |
|
| |
| Male, N (%) | 53 (44.2%) |
|
| |
| Race, N (%) | |
| White | 107 (89.2%) |
| Black | 9 (7.5%) |
| Asian | 1 (0.8%) |
| Other/Unknown | 3 (2.5%) |
|
| |
| Hispanic, N (%) | 2 (1.7%) |
|
| |
| Marital status | |
| Single | 22 (18.3%) |
| Married | 91 (75.8%) |
| Divorced | 6 (5.0%) |
| Widowed | 1 (0.8%) |
|
| |
| Smoking status | |
| Current | 3 (2.5%) |
| Never | 74 (62.7%) |
| Former | 41 (34.8%) |
|
| |
| Education level | |
| High school | 2 (1.7%) |
| Some college | 21 (17.7%) |
| College degree | 51 (42.9%) |
| Graduate degree | 45 (37.8%) |
|
| |
| Height (cm), mean (SD) | 171.5 (9.38) |
|
| |
| Fasting glucose mg/dL, mean (SD) | 96.0 (10.2) * |
|
| |
| 2 hour glucose mg/dL, mean (SD) | 117.3 (28.9)* |
|
| |
| BMI kg/m^2, mean (SD) | 41.1 (6.4) |
|
| |
| Waist circumference (cm), mean (SD) | 122.5 (17.2) |
|
| |
| Female Waist circumference (cm), mean (SD) | 115.0 (12.5) |
|
| |
| Male Waist circumference (cm), mean (SD) | 132.2 (17.6) |
Only reported for those without diabetes.
BMI= body mass index.
Area under the curve (AUC)
For DSP, the highest AUC was for the UENS (0.92, 95% CI 0.85-1.00), followed by the MNSI reduced combined index (0.86, 95% CI 0.78-0.93), MNSI examination (0.81, 95% CI 0.71-0.91), NFD leg (0.76, 95% CI 0.64-0.87), tibial F response (0.76, 95% CI 0.65-0.87), MNSI questionnaire (0.75, 95% CI 0.63-0.86), and peroneal DML (0.75, 95% CI 0.64-0.86) (Table 2). No other neuropathy measures were higher than an AUC of 0.73 (peroneal F response, tibial amplitude, and ulnar sensory amplitude). Other measures of large fiber nerve injury, such as QST vibration, monofilament, and neurothesiometer had AUC’s ranging from 0.66-0.72.
Table 2.
The diagnostic test performance of neuropathy measures for distal symmetric polyneuropathy and small fiber predominant neuropathy.
| Variable | DSP AUC (95%CI) |
SFN AUC (95%CI) |
CAN AUC (95%CI) |
|---|---|---|---|
| NFD leg | 0.76 (0.64–0.87) | 0.82 (0.70–0.95) | 0.60 (0.47–0.73) |
| NFD thigh | 0.65 (0.52–0.79) | 0.67 (0.50–0.83) | 0.57 (0.45–0.70) |
| UENS* | 0.92 (0.85–1.00) | 0.96 (0.90–1.00) | 0.70 (0.53–0.86) |
| Valsalva ratio | 0.55 (0.43–0.67) | 0.52 (0.36–0.67) | Part of definition |
| E:I ratio | 0.68 (0.56–0.80) | 0.61 (0.45–0.76) | Part of definition |
| 30:15 ratio | 0.64 (0.53–0.75) | 0.63 (0.49–0.78) | Part of definition |
| MHR | 0.54 (0.42–0.67) | 0.57 (0.42–0.72) | 0.58 (0.44–0.73) |
| LFA | 0.50 (0.37–0.64) | 0.48 (0.30–0.65) | 0.42 (0.29–0.55) |
| RFA | 0.38 (0.25–0.50) | 0.37 (0.22–0.53) | 0.34 (0.21–0.47) |
| LFA/RFA ratio | 0.62 (0.50–0.75) | 0.55 (0.40–0.69) | 0.63 (0.52–0.75) |
| sdNN | 0.60 (0.46–0.73) | 0.49 (0.32–0.67) | 0.65 (0.52–0.77) |
| rmsSD | 0.60 (0.48–0.71) | 0.45 (0.30–0.60) | 0.66 (0.54–0.79) |
| Sudoscan feet* | 0.68 (0.51–0.84) | 0.77 (0.58–0.96) | 0.61 (0.42–0.79) |
| Sudoscan hands* | 0.56 (0.39–0.72) | 0.57 (0.40–0.75) | 0.53 (0.35–0.71) |
| QSART foot | 0.48 (0.35–0.61) | 0.57 (0.41–0.74) | 0.45 (0.32–0.59) |
| QSART distal leg | 0.54 (0.41–0.68) | 0.52 (0.35–0.68) | 0.50 (0.37–0.63) |
| QSART proximal leg | 0.51 (0.38–0.64) | 0.48 (0.32–0.65) | 0.52 (0.40–0.65) |
| QSART arm | 0.66 (0.55–0.77) | 0.70 (0.58–0.81) | 0.48 (0.33–0.63) |
| QST cold | 0.64 (0.51–0.78) | 0.67 (0.52–0.83) | 0.60 (0.46–0.74) |
| QST vibration | 0.71 (0.60–0.81) | ||
| Sural amplitude | 0.65 (0.52–0.79) | ||
| Sural PL | 0.68 (0.55–0.81) | ||
| Peroneal amplitude | 0.63 (0.51–0.76) | ||
| Peroneal DML | 0.75 (0.64–0.86) | ||
| Peroneal CV | 0.66 (0.53–0.80) | ||
| Peroneal F response | 0.73 (0.62–0.84) | ||
| Tibial amplitude | 0.73 (0.60–0.86) | ||
| Tibial DML | 0.67 (0.55–0.78) | ||
| Tibial F response | 0.76 (0.65–0.87) | ||
| Ulnar sensory amplitude | 0.73 (0.63–0.84) | ||
| Ulnar sensory PL | 0.58 (0.46–0.70) | ||
| Median sensory amplitude | 0.68 (0.56–0.80) | ||
| Median sensory PL | 0.57 (0.44–0.70) | ||
| Median motor amplitude | 0.47 (0.33–0.60) | ||
| Median motor DML | 0.54 (0.41–0.68) | ||
| Median motor CV | 0.56 (0.43–0.69) | ||
| Median F response | 0.36 (0.23–0.49) | ||
| MNSI Questionnaire | 0.75 (0.63–0.86) | ||
| MNSI Examination | 0.81 (0.71–0.91) | ||
| MNSI Reduced Combined index | 0.86 (0.78–0.93) | ||
| Monofilament | 0.67 (0.57–0.77) | ||
| Neurothesiometer** | 0.72 (0.54–0.89) |
The Sudoscan was only performed on 70 participants.
The Neurothesiometer and UENS were only performed on 61 and 62 participants respectively.
DSP= distal symmetric polyneuropathy, SFN= small fiber neuropathy, CAN=cardiovascular autonomic neuropathy, AUC=area under the curve, NFD=nerve fiber density, PL=peak latency, DML=distal motor latency, CV=conduction velocity, QSART=quantitative sudomotor axonal reflex testing, QST=quantitative sensory testing, MNSI-Michigan Neuropathy Screening Instrument, UENS=Utah Early Neuropathy Scale, E:I=Expiration, Inspiration, MHR=mean heart rate, LFA= low frequency area, RFA= respiratory frequency area, sdNN= standard deviation of the normal to normal interval, rmsSD= root mean square of successive differences of the normal to normal interval.
For SFN, the highest AUC was for UENS (0.96, 95% CI 0.90-1.00), followed by NFD leg (0.82, 95% CI 0.70-0.95) and Sudoscan of the feet (0.77, 95% CI 0.58-0.96). No other neuropathy measure was higher than an AUC of 0.70 (QSART arm). QST cold, a measure of small fiber nerve injury, had an AUC of 0.67 (95% CI 0.52-0.83).
For CAN (Table 3), the highest AUC was for UENS (0.70, 95% CI 0.53-0.86) followed by rmsSD (0.66, 95% CI 0.54-0.79), sdNN (0.65, 95% CI 0.52-0.77). No other small fiber measure was higher than an AUC of 0.63 (LFA/RFA ratio).
Table 3.
Correlations amongst large fiber nerve measures and amongst small fiber nerve measures.
| (A) Large fiber neuropathy measures. | |||||
|---|---|---|---|---|---|
| Variable | Tibial F response | QST vibration | MNSI Examination | Monofilament | Neurothesiometer |
| Tibial F response | 1.0 | 0.26 (<0.01) | 0.23 (0.01) | 0.41 (<0.01) | 0.33 (<0.01) |
| QST vibration | 0.26 (<0.01) | 1.0 | 0.33 (<0.01) | 0.37 (<0.01) | 0.56 (<0.01) |
| MNSI Examination | 0.23 (0.01) | 0.33 (<0.01) | 1.0 | 0.52 (<0.01) | 0.50 (<0.01) |
| Monofilament | 0.41 (<0.01) | 0.37 (<0.01) | 0.52 (<0.01) | 1.0 | 0.61 (<0.01) |
| Neurothesiometer | 0.33 (<0.01) | 0.56 (<0.01) | 0.50 (<0.01) | 0.61 (<0.01) | 1.0 |
| (B) Small fiber neuropathy measures. | |||||||
|---|---|---|---|---|---|---|---|
| Variable | NFD Leg | QSART arm | QST cold | UENS | Sudoscan feet | 30:15 Ratio | MHR |
| NFD leg | 1.00 | −0.08 (0.38) | −0.14 (0.14) | −0.39 (<0.01) | 0.25 (0.04) | 0.11 (0.26) | 0.01 (0.88) |
| QSART arm | −0.08 (0.38) | 1.00 | 0.18 (0.06) | 0.04 (0.77) | −0.04 (0.75) | 0.01 (0.90) | 0.18 (0.05) |
| QST cold | −0.14 (0.14) | 0.18 (0.06) | 1.00 | 0.34 (<0.01) | −0.32 (<0.01) | 0.02 (0.85) | 0.15 (0.11) |
| UENS | −0.39 (<0.01) | 0.04 (0.77) | 0.34 (<0.01) | 1.00 | −0.27 (0.03) | −0.03 (0.85) | −0.06 (0.66) |
| Sudoscan feet | 0.25 (0.04) | −0.04 (0.75) | −0.32 (<0.01) | −0.27 (0.03) | 1.00 | 0.07 (0.56) | −0.13 (0.28) |
| 30:15 Ratio | 0.11 (0.26) | 0.01 (0.90) | 0.02 (0.85) | −0.03 (0.85) | 0.07 (0.56) | 1.00 | 0.12 (0.20) |
| MHR | 0.01 (0.88) | 0.18 (0.05) | 0.15 (0.11) | −0.06 (0.66) | −0.13 (0.28) | 0.12 (0.20) | 1.00 |
P values in parentheses.
Combination of tests without physician involvement
Stepwise selection models revealed that the best combination of tests for DSP is MNSI questionnaire, tibial F response, and monofilament testing, and for SFN is NFD of the leg alone Supplementary Table S1).
Score subset selection models show that the AUC curve for DSP plateaus around an AUC of 0.82 (Figure 1A) with only two parameters (MNSI questionnaire and tibial F response). For SFN, the AUC curve plateaus around an AUC of 0.84 (Figure 1B) with three parameters (NFD leg, QST cold, and 30:15 ratio).
Figure 1.
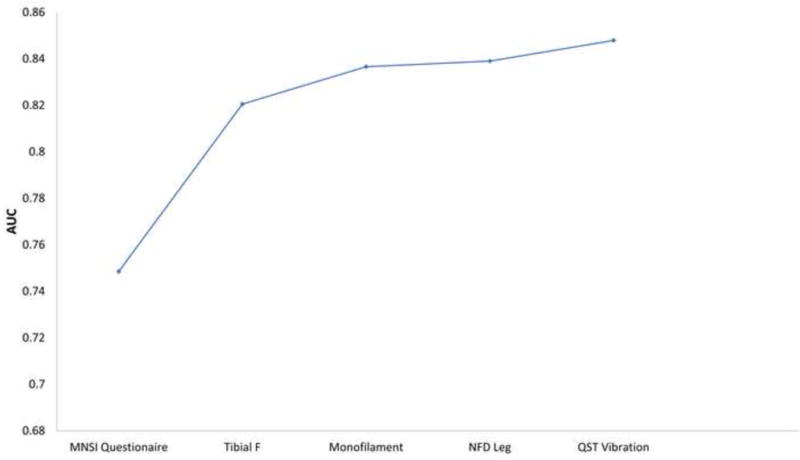
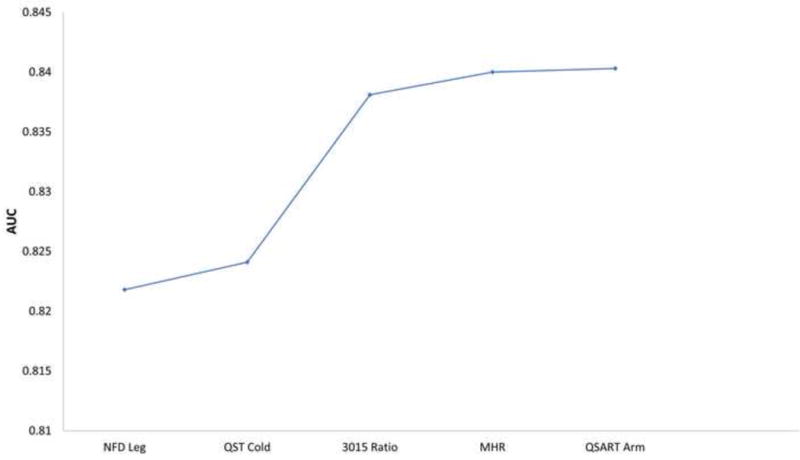
The diagnostic test performance of combinations of neuropathy measures for distal symmetric polyneuropathy and small fiber neuropathy based on score subset selection models.
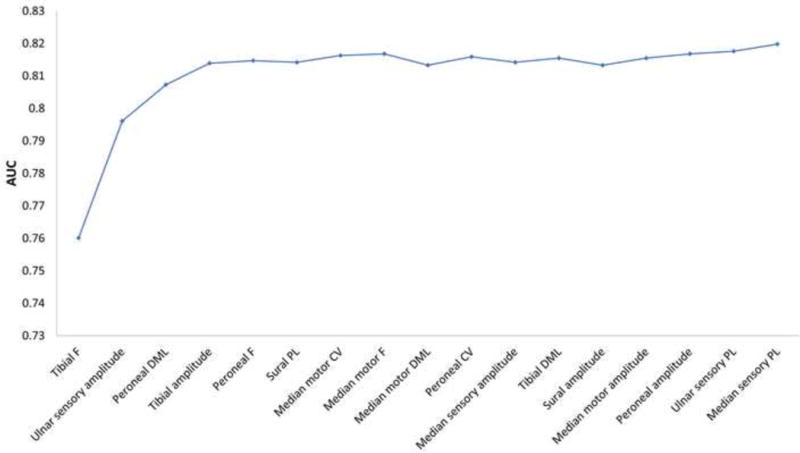
The area under the curve of combinations of neuropathy measures for: (A) distal symmetric polyneuropathy, (B) small fiber neuropathy, and (C) distal symmetric polyneuropathy using only nerve conduction study parameters. Additional neuropathy measures are added going left to right.
Stepwise selection models revealed that the best combination of tests for DSP using only NCS parameters is tibial F response and ulnar sensory amplitude. Score subset selection models show that the AUC curve plateaus around an AUC of 0.81 (Figure 1C) with four parameters.
Correlation between neuropathy measures
All five large fiber neuropathy measures revealed statistically significant correlations with each other (Table 3A). The highest correlations were between the monofilament and the neurothesiometer (0.61), between the neurothesiometer and QST vibration (0.56), and between the monofilament and the MNSI examination (0.52). The tibial F response demonstrated correlations ranging from 0.23-0.41.
Among the measures of small fiber and autonomic nerve injury, the only statistically significant correlations were between UENS and NFD leg (−0.39, p<0.01), UENS and QST cold (0.34, p<0.01), Sudoscan feet and NFD leg (0.25, p=0.04), and Sudoscan feet and QST cold (−0.32, p<0.01) (Table 3B).
Neuropathy measures in obese with and without DSP and lean controls
Supplementary Table S2 summarizes the neuropathy measures. Of note, NFD at the leg and thigh are significantly reduced in obese individuals with DSP compared to obese individuals without DSP. For NCS parameters, sural amplitude, peroneal amplitude, DML, and F response, tibial amplitude, DML, and F response, ulnar and median sensory amplitudes are worse in obese individuals with DSP compared to obese individuals without DSP.
Discussion
In the current study, we addressed the diagnostic accuracy of a battery of clinical neuropathy measures in an obese population. We found that many neuropathy measures, including questionnaires (MNSI), examination scales (MNSI and UENS), electrophysiologic tests (many NCS parameters and QST vibration), and histologic tests (NFD leg), had good test characteristics for DSP. In contrast, only a few small fiber nerve measures revealed good test characteristics for either SFN (UENS, NFD leg, and Sudoscan of the feet) or CAN (none). While measures of large fiber nerve injury were significantly correlated in these obese patients, few measures of small fiber nerve injury were significantly correlated, and the magnitude of the correlations was low. Furthermore, combinations of tests improved the diagnostic characteristics for DSP, which should inform investigators as they select endpoints for future research studies. However, investigators must weigh the resources needed to obtain additional measures against the added diagnostic accuracy provided. Using combinations of NCS measures may be particularly important for classifying DSP in obese populations compared with non-obese populations. Given the rising prevalence of obesity throughout the world, our results from an obese population complement previous studies that have focused mainly on subjects with diabetes and pre-diabetes.
DSP
UENS had the highest AUC at 0.92, which is consistent with two previous studies performed in diabetic and pre-diabetic populations (AUC 0.88-0.94).(Singleton et al., 2008, Zilliox et al., 2015) Similarly, the MNSI examination (AUC=0.81) and reduced combined index (AUC=0.86) also revealed high AUCs that were comparable to studies performed in patients with type 1 diabetes (AUCs= 0.76 and 0.81 respectively).(Herman et al., 2012) Therefore, these examination scales can be used by themselves to accurately classify DSP status in obese populations. However, these scales were performed by a neuromuscular specialist, and future studies should determine if non-physician personnel can use these tools with similar test characteristics. For research studies that are unable to have a neurologist examine patients, other tests are needed. Unlike the MNSI examination scale, the MSNI questionnaire was not performed by a physician and revealed an AUC of 0.75, which was comparable to previous studies.(Herman et al., 2012) For NFD of the leg (AUC=0.76), we found a slightly higher AUC than three previous studies (AUCs range from 0.66-0.75).(Pourhamidi et al., 2014, Smith et al., 2014, Chen et al., 2015) In contrast, for lower extremity NCS, our results revealed AUCs ranging from 0.63-0.76, compared with 0.76-0.90 from a recent study in patients with diabetes.(Weisman et al., 2013) One key difference between these studies is that the mean BMI of our population was 41 and the mean BMI of their diabetic population was 29. Overall, the UENS and MNSI examination scales perform the best, but may require a physician’s assessment, whereas the MNSI questionnaire and NFD of the leg also perform well without the need for a physician. These test characteristics are similar to previous results in non-obese populations. In contrast, NCS do not perform as well in our obese cohort and may require combining multiple NCS parameters.
While many neuropathy measures demonstrated good diagnostic characteristics for DSP, other measures only showed fair or poor characteristics. Monofilament, cardiovascular reflex tests, and Sudoscan of the feet had fair characteristics, while QSART, autonomic time-domain, and autonomic frequency-domain had poor characteristics. Few previous studies exist that evaluate these tests in DSP, but one previous study revealed similar results for one of the cardiovascular reflex tests in those with type 2 diabetes.(Farooqi et al., 2016) Moreover, three studies have shown higher AUCs for Sudoscan (AUC0.76-0.88 vs. 0.68) in populations primarily with mean BMIs ranging from 27-31.(Casellini et al., 2013, Smith et al., 2014, Selvarajah et al., 2015) Unlike the many large fiber neuropathy measures that performed well compared to a neuromuscular specialist’s determination of DSP, most small fiber nerve measures did not.
SFN
Similar to DSP, the tests with the highest AUC for SFN was the UENS (AUC=0.96). As above, the UENS should be used to classify SFN when a neurologist’s exam is possible. NFD of the leg (AUC=0.82) and Sudoscan of the feet (AUC=0.77) also had good diagnostic performance for tests that do not require a neurologist. Unfortunately, few previous studies have investigated the test characteristics of neuropathy measures using a clinical SFN definition, and none in obese subjects. One group demonstrated a comparable AUC for NFD of the leg utilizing a similar SFN definition.(Nebuchennykh et al., 2009) We also observed a comparable AUC for Sudoscan of the feet compared with a previous study of SFN patients.(Lefaucheur et al., 2015) QSART had a low sensitivity for SFN, but an AUC was not presented in a previous study.(Kamel et al., 2015) Given the limited reliability of QSART, the lack of quality data to support this test in SFN in obese patients is expected.(Peltier et al., 2009, Berger et al., 2013) QST cold has been shown to have a high AUC for DSP (AUCs range from 0.79-0.86) and for SFN (AUC=0.78) in populations with mean BMIs ranging from 23-30.(Lysy et al., 2014, Lefaucheur et al., 2015, Farooqi et al., 2016) We would expect a higher AUC for SFN, but we found a low AUC for DSP (AUC=0.66) and a similar AUC for SFN (AUC=0.67). On the whole, only a few small fiber neuropathy measures demonstrated good diagnostic characteristics in our obese cohort, compared to published studies in non-obese individuals. These findings may explain why large fiber nerve measures, many of which have good diagnostic performance, correlate with each other whereas many small fiber nerve measures do not. Importantly, NFD of the leg demonstrates high accuracy in an obese population, comparable to other populations, and does not require a neurologist.
CAN
The UENS had the best AUC for CAN (AUC=0.70), but no other small fiber measures had good test performance including NFD of the leg and thigh, QSART, QST cold, autonomic frequency-domain and time-domain measures, and Sudoscan. Two previous studies have demonstrated better diagnostic characteristics of Sudoscan in diabetic populations with mean BMIs ranging from 26-28 (AUC0.74-0.75 vs. 0.61).(Yajnik et al., 2013, Selvarajah et al., 2015) For QSART and Sudoscan, the low performance may be attributed to the fact that these are measures of sudomotor function and not cardiovascular autonomic function. Similarly, NFD and QST cold are measures of somatic small fiber nerve injury, and were not good classifiers of those with CAN. Surprisingly, other measures of CAN, such as the autonomic frequency-domain and time-domain measures, also do not demonstrate good test characteristics. Our results strongly support the continued use of cardiovascular reflex tests in obese patients for identification of autonomic neuropathy in an obese population as these are quick, simple, and abnormalities in these tests are well known to be associated with mortality.(Maser et al., 2003, Pop-Busui et al., 2010)
Combinations of tests
While understanding the performance of individual tests is important, determining the best combination of tests is essential for research studies, and may be particularly important in obese subjects. We determined the most parsimonious combination of tests that can distinguish those with and without DSP and SFN without physician involvement in our obese participants. While neurologists are extremely important in the evaluation of patients with suspected neuropathy, a neurologist’s assessment in large epidemiologic studies is often not feasible. Our results show the results of testing when the gold standard assessment by a neurologist is not available. Our findings also illustrate how much improvement is observed in the AUC as additional tests are added. For DSP, combinations of tests performed significantly better than single tests, but for SFN, the improvement in accuracy was less dramatic. Finally, we were able to determine the best combination of NCS parameters for DSP in an obese cohort. Two to four parameters (2-3 nerves) had the best diagnostic performance, and additional parameters were not helpful. This is in contrast to a previous study that revealed that the diagnostic performance of one test was just as good as summative NCS parameters in a population with diabetes and mean BMI of 29,(Weisman et al., 2013) highlighting another crucial difference between our obese cohort and previously reported data on non-obese cohorts. Overall, our data strongly suggest that combinations of NCS parameters and/or other neuropathy measures are needed in an obese population, but may not be as important in non-obese populations.
Limitations
Our study include the small sample size, which reduces the precision of the AUC estimates. Since our aim was to determine the comparative diagnostic characteristics of neuropathy measures including NCS parameters and NFD, we were also unable to use the Toronto consensus definitions of definite DSP and definite SFN because these definitions require an abnormality of NCS or NFD. However, 26 of the 27 patients with DSP also met the Toronto consensus definition of definite DSP (25 with abnormal NCS parameters in two different nerves and 1 additional patient with abnormal NFD in the distal leg). We have previously demonstrated that this obese population with DSP has more pain, worse neuropathy specific quality of life, and higher vibration and cold threshold on quantitative sensory testing compared to obese individuals without DSP, which further validates that these patients have significant and clinically meaningful neuropathy.(Callaghan et al., 2016) In addition, the MNSI examination and UENS were performed by the same clinician who performed the standardized history and examination to determine DSP status, which may influence their diagnostic test performance. Furthermore, these instruments also include some elements that are included in the DSP definition (sensory examination and reflexes), which may introduce incorporation bias.
Summary
UENS revealed great test accuracy for classifying DSP and SFN in an obese population, but may require a neurologist to perform. For tests that do not require a neurologist, combinations of neuropathy parameters, NCS alone or in combination with other tests, performed better than single measures for DSP. The combination of tests may be more important in obese populations than in other populations, but the tradeoff between the resources required and the increase in diagnostic accuracy must be considered. NFD of the leg demonstrated high accuracy for classifying SFN in our obese population, which was comparable to previous reports in a non-obese population. No tests performed well enough to be considered as a potential replacement of cardiovascular reflex tests for CAN in our obese cohort. Overall, QSART, QST, neurothesiometer, monofilament, and autonomic time domain and frequency-domain testing revealed disappointing test performance in our obese population. With the growing worldwide obesity epidemic, choosing the best neuropathy measures for this group is becoming increasingly important.
Supplementary Material
Highlights.
Specific combinations of neuropathy measures should be used to maximize performance in obese cohorts.
More neuropathy measures have good test characteristics for distal symmetric polyneuropathy than for small fiber neuropathy or cardiovascular autonomic neuropathy.
Large fiber measures are more highly correlated than small fiber measures.
Acknowledgments
Brian Callaghan is the guarantor and takes full responsibility for the work as a whole, including the study design, access to data, and the decision to submit and publish the manuscript. Brian Callaghan was involved in the study design, interpretation of the statistical analysis, and wrote the manuscript. Rong Xia, Evan Reynolds, and Mousumi Banerjee were involved in the study design, statistical analyses, interpretation of the data, and critical revisions of the manuscript. Charles Burant, Amy Rothberg, Rodica Pop-Busui, and Eva Feldman were involved in the study design, interpretation of the data, and critical revisions of the manuscript. Emily Villegas-Umana was involved in the study design and critical revisions of the manuscript.
Study Funding
Drs. Callaghan, Burant, and Feldman are supported by the A. Alfred Taubman Medical Research Institute. Dr. Callaghan is supported by a NIH K23 grant (NS079417). Drs. Feldman and Pop-Busui are supported by grant NIH/NIDDK-1-R01-DK-107956-01. Dr. Pop-Busui is also supported by grant NIH/NIDDK 1UC4DK101108. Dr Feldman is supported by grant R24 082841. Drs. Burant and Rothberg receive are supported by P30DK089503-01. This study was also supported by the Michigan Institute for Clinical & Health Research (UL1TR000433) and the Michigan Nutrition Obesity Research Center (P30DK089503).
Footnotes
Publisher's Disclaimer: This is a PDF file of an unedited manuscript that has been accepted for publication. As a service to our customers we are providing this early version of the manuscript. The manuscript will undergo copyediting, typesetting, and review of the resulting proof before it is published in its final citable form. Please note that during the production process errors may be discovered which could affect the content, and all legal disclaimers that apply to the journal pertain.
Disclosures
Dr. Callaghan receives research support from Impeto Medical Inc, the maker of Sudoscan, which was included in the neuropathy outcome measures studied. He performs medical consultations for Advance Medical, performs medical legal consultations, and consults for a PCORI grant. Dr. Pop-Busui receives research support from Impeto Medical Inc, the maker of Sudoscan, which was included in the neuropathy outcome measures studied. Dr. Rothberg receives research support from Nestle, SW. Mr. Xia, Mr. Reynolds, Dr. Banerjee, Dr. Burant, Mrs. Villegas-Umana, and Dr. Feldman report no disclosures.
References
- Baraz S, Zarea K, Shahbazian HB, Latifi SM. Comparison of the accuracy of monofilament testing at various points of feet in peripheral diabetic neuropathy screening. J Diabetes Metab Disord. 2014;13:19. doi: 10.1186/2251-6581-13-19. [DOI] [PMC free article] [PubMed] [Google Scholar]
- Berger MJ, Kimpinski K. Test-retest reliability of quantitative sudomotor axon reflex testing. J Clin Neurophysiol. 2013;30:308–12. doi: 10.1097/WNP.0b013e3182873254. [DOI] [PubMed] [Google Scholar]
- Boyraz O, Saracoglu M. The effect of obesity on the assessment of diabetic peripheral neuropathy: a comparison of Michigan patient version test and Michigan physical assessment. Diabetes Res Clin Pract. 2010;90:256–60. doi: 10.1016/j.diabres.2010.09.014. [DOI] [PubMed] [Google Scholar]
- Callaghan BC, Cheng HT, Stables CL, Smith AL, Feldman EL. Diabetic neuropathy: clinical manifestations and current treatments. Lancet Neurol. 2012;11:521–34. doi: 10.1016/S1474-4422(12)70065-0. [DOI] [PMC free article] [PubMed] [Google Scholar]
- Callaghan BC, Price RS, Feldman EL. Distal Symmetric Polyneuropathy: A Review. JAMA. 2015;314:2172–81. doi: 10.1001/jama.2015.13611. [DOI] [PMC free article] [PubMed] [Google Scholar]
- Callaghan BC, Xia R, Reynolds E, Banerjee M, Rothberg AE, Burant CF, et al. Association Between Metabolic Syndrome Components and Polyneuropathy in an Obese Population. JAMA Neurol. 2016;73:1468–1476. doi: 10.1001/jamaneurol.2016.3745. [DOI] [PMC free article] [PubMed] [Google Scholar]
- Casellini CM, Parson HK, Richardson MS, Nevoret ML, Vinik AI. Sudoscan, a noninvasive tool for detecting diabetic small fiber neuropathy and autonomic dysfunction. Diabetes Technol Ther. 2013;15:948–53. doi: 10.1089/dia.2013.0129. [DOI] [PMC free article] [PubMed] [Google Scholar]
- Chen X, Graham J, Dabbah MA, Petropoulos IN, Ponirakis G, Asghar O, et al. Small nerve fiber quantification in the diagnosis of diabetic sensorimotor polyneuropathy: comparing corneal confocal microscopy with intraepidermal nerve fiber density. Diabetes Care. 2015;38:1138–44. doi: 10.2337/dc14-2422. [DOI] [PMC free article] [PubMed] [Google Scholar]
- Denys EH. AAEM minimonograph #14: The influence of temperature in clinical neurophysiology. Muscle Nerve. 1991;14:795–811. doi: 10.1002/mus.880140902. [DOI] [PubMed] [Google Scholar]
- Dyck PJ, Albers JW, Andersen H, Arezzo JC, Biessels GJ, Bril V, et al. Diabetic polyneuropathies: update on research definition, diagnostic criteria and estimation of severity. Diabetes Metab Res Rev. 2011;27:620–8. doi: 10.1002/dmrr.1226. [DOI] [PubMed] [Google Scholar]
- England JD, Gronseth GS, Franklin G, Miller RG, Asbury AK, Carter GT, et al. Distal symmetric polyneuropathy: a definition for clinical research: report of the American Academy of Neurology, the American Association of Electrodiagnostic Medicine, and the American Academy of Physical Medicine and Rehabilitation. Neurology. 2005;64:199–207. doi: 10.1212/01.WNL.0000149522.32823.EA. [DOI] [PubMed] [Google Scholar]
- Farooqi MA, Lovblom LE, Lysy Z, Ostrovski I, Halpern EM, Ngo M, et al. Validation of cooling detection threshold as a marker of sensorimotor polyneuropathy in type 2 diabetes. J Diabetes Complicat. 2016;30:716–22. doi: 10.1016/j.jdiacomp.2015.12.023. [DOI] [PubMed] [Google Scholar]
- Feldman EL, Stevens MJ, Thomas PK, Brown MB, Canal N, Greene DA. A practical two-step quantitative clinical and electrophysiological assessment for the diagnosis and staging of diabetic neuropathy. Diabetes Care. 1994;17:1281–9. doi: 10.2337/diacare.17.11.1281. [DOI] [PubMed] [Google Scholar]
- Herman WH, Pop-Busui R, Braffett BH, Martin CL, Cleary PA, Albers JW, et al. Use of the Michigan Neuropathy Screening Instrument as a measure of distal symmetrical peripheral neuropathy in Type 1 diabetes: results from the Diabetes Control and Complications Trial/Epidemiology of Diabetes Interventions and Complications. Diabet Med. 2012;29:937–44. doi: 10.1111/j.1464-5491.2012.03644.x. [DOI] [PMC free article] [PubMed] [Google Scholar]
- Kamel JT, Vogrin SJ, Knight-Sadler RJ, Willems NK, Seiderer L, Cook MJ, et al. Combining cutaneous silent periods with quantitative sudomotor axon reflex testing in the assessment of diabetic small fiber neuropathy. Clin Neurophysiol. 2015;126:1047–53. doi: 10.1016/j.clinph.2014.09.011. [DOI] [PubMed] [Google Scholar]
- Lauria G, Hsieh ST, Johansson O, Kennedy WR, Leger JM, Mellgren SI, et al. European Federation of Neurological Societies/Peripheral Nerve Society Guideline on the use of skin biopsy in the diagnosis of small fiber neuropathy. Report of a joint task force of the European Federation of Neurological Societies and the Peripheral Nerve Society. Eur J Neurol. 2010;17:903–12. e44–9. doi: 10.1111/j.1468-1331.2010.03023.x. [DOI] [PubMed] [Google Scholar]
- Lefaucheur JP, Wahab A, Plante-Bordeneuve V, Sene D, Menard-Lefaucheur I, Rouie D, et al. Diagnosis of small fiber neuropathy: A comparative study of five neurophysiological tests. Neurophysiol Clin. 2015;45:445–55. doi: 10.1016/j.neucli.2015.09.012. [DOI] [PubMed] [Google Scholar]
- Low PA, Benrud-Larson LM, Sletten DM, Opfer-Gehrking TL, Weigand SD, O’Brien PC, et al. Autonomic symptoms and diabetic neuropathy: a population-based study. Diabetes Care. 2004;27:2942–7. doi: 10.2337/diacare.27.12.2942. [DOI] [PubMed] [Google Scholar]
- Low VA, Sandroni P, Fealey RD, Low PA. Detection of small-fiber neuropathy by sudomotor testing. Muscle Nerve. 2006;34:57–61. doi: 10.1002/mus.20551. [DOI] [PubMed] [Google Scholar]
- Lysy Z, Lovblom LE, Halpern EM, Ngo M, Ng E, Orszag A, et al. Measurement of cooling detection thresholds for identification of diabetic sensorimotor polyneuropathy in type 1 diabetes. PloS One. 2014;9:e106995. doi: 10.1371/journal.pone.0106995. [DOI] [PMC free article] [PubMed] [Google Scholar]
- Malik RA, Veves A, Tesfaye S, Smith G, Cameron N, Zochodne D, et al. Small fibre neuropathy: role in the diagnosis of diabetic sensorimotor polyneuropathy. Diabetes Metab Res Rev. 2011;27:678–84. doi: 10.1002/dmrr.1222. [DOI] [PubMed] [Google Scholar]
- Maser RE, Mitchell BD, Vinik AI, Freeman R. The association between cardiovascular autonomic neuropathy and mortality in individuals with diabetes: a meta-analysis. Diabetes Care. 2003;26:1895–901. doi: 10.2337/diacare.26.6.1895. [DOI] [PubMed] [Google Scholar]
- McArthur JC, Stocks EA, Hauer P, Cornblath DR, Griffin JW. Epidermal nerve fiber density: normative reference range and diagnostic efficiency. Arch Neurol. 1998;55:1513–20. doi: 10.1001/archneur.55.12.1513. [DOI] [PubMed] [Google Scholar]
- Nebuchennykh M, Loseth S, Lindal S, Mellgren SI. The value of skin biopsy with recording of intraepidermal nerve fiber density and quantitative sensory testing in the assessment of small fiber involvement in patients with different causes of polyneuropathy. J Neurol. 2009;256:1067–75. doi: 10.1007/s00415-009-5065-y. [DOI] [PubMed] [Google Scholar]
- Ng M, Fleming T, Robinson M, Thomson B, Graetz N, Margono C, et al. Global, regional, and national prevalence of overweight and obesity in children and adults during 1980–2013: a systematic analysis for the Global Burden of Disease Study 2013. Lancet. 2014;384:766–81. doi: 10.1016/S0140-6736(14)60460-8. [DOI] [PMC free article] [PubMed] [Google Scholar]
- Peltier A, Smith AG, Russell JW, Sheikh K, Bixby B, Howard J, et al. Reliability of quantitative sudomotor axon reflex testing and quantitative sensory testing in neuropathy of impaired glucose regulation. Muscle Nerve. 2009;39:529–35. doi: 10.1002/mus.21210. [DOI] [PMC free article] [PubMed] [Google Scholar]
- Pop-Busui R, Boulton AJ, Feldman EL, Bril V, Freeman R, Malik RA, et al. Diabetic Neuropathy: A Position Statement by the American Diabetes Association. Diabetes Care. 2017;40:136–54. doi: 10.2337/dc16-2042. [DOI] [PMC free article] [PubMed] [Google Scholar]
- Pop-Busui R, Evans GW, Gerstein HC, Fonseca V, Fleg JL, Hoogwerf BJ, et al. Effects of cardiac autonomic dysfunction on mortality risk in the Action to Control Cardiovascular Risk in Diabetes (ACCORD) trial. Diabetes Care. 2010;33:1578–84. doi: 10.2337/dc10-0125. [DOI] [PMC free article] [PubMed] [Google Scholar]
- Pop-Busui R, Low PA, Waberski BH, Martin CL, Albers JW, Feldman EL, et al. Effects of prior intensive insulin therapy on cardiac autonomic nervous system function in type 1 diabetes mellitus: the Diabetes Control and Complications Trial/Epidemiology of Diabetes Interventions and Complications study (DCCT/EDIC) Circulation. 2009;119:2886–93. doi: 10.1161/CIRCULATIONAHA.108.837369. [DOI] [PMC free article] [PubMed] [Google Scholar]
- Pourhamidi K, Dahlin LB, Englund E, Rolandsson O. Evaluation of clinical tools and their diagnostic use in distal symmetric polyneuropathy. Prim Care Diabetes. 2014;8:77–84. doi: 10.1016/j.pcd.2013.04.004. [DOI] [PubMed] [Google Scholar]
- Rivner MH, Swift TR, Malik K. Influence of age and height on nerve conduction. Muscle Nerve. 2001;24:1134–41. doi: 10.1002/mus.1124. [DOI] [PubMed] [Google Scholar]
- Rothberg AE, McEwen LN, Kraftson AT, Ajluni N, Fowler CE, Miller NM, et al. Factors associated with participant retention in a clinical, intensive, behavioral weight management program. BMC Obes. 2015;2:11. doi: 10.1186/s40608-015-0041-9. [DOI] [PMC free article] [PubMed] [Google Scholar]
- Selvarajah D, Cash T, Davies J, Sankar A, Rao G, Grieg M, et al. SUDOSCAN: A Simple, Rapid, and Objective Method with Potential for Screening for Diabetic Peripheral Neuropathy. PloS One. 2015;10:e0138224. doi: 10.1371/journal.pone.0138224. [DOI] [PMC free article] [PubMed] [Google Scholar]
- Singleton JR, Bixby B, Russell JW, Feldman EL, Peltier A, Goldstein J, et al. The Utah Early Neuropathy Scale: a sensitive clinical scale for early sensory predominant neuropathy. J Peripher Nerv Syst. 2008;13:218–27. doi: 10.1111/j.1529-8027.2008.00180.x. [DOI] [PubMed] [Google Scholar]
- Smith AG, Lessard M, Reyna S, Doudova M, Singleton JR. The diagnostic utility of Sudoscan for distal symmetric peripheral neuropathy. J Diabetes Complicat. 2014;28:511–6. doi: 10.1016/j.jdiacomp.2014.02.013. [DOI] [PMC free article] [PubMed] [Google Scholar]
- Spallone V, Ziegler D, Freeman R, Bernardi L, Frontoni S, Pop-Busui R, et al. Cardiovascular autonomic neuropathy in diabetes: clinical impact, assessment, diagnosis, and management. Diabetes Metab Res Rev. 2011;27:639–53. doi: 10.1002/dmrr.1239. [DOI] [PubMed] [Google Scholar]
- Tesfaye S, Chaturvedi N, Eaton SE, Ward JD, Manes C, Ionescu-Tirgoviste C, et al. Vascular risk factors and diabetic neuropathy. N Engl J Med. 2005;352:341–50. doi: 10.1056/NEJMoa032782. [DOI] [PubMed] [Google Scholar]
- Van Acker K, Bouhassira D, De Bacquer D, Weiss S, Matthys K, Raemen H, et al. Prevalence and impact on quality of life of peripheral neuropathy with or without neuropathic pain in type 1 and type 2 diabetic patients attending hospital outpatients clinics. Diabetes Metab. 2009;35:206–13. doi: 10.1016/j.diabet.2008.11.004. [DOI] [PubMed] [Google Scholar]
- Weisman A, Bril V, Ngo M, Lovblom LE, Halpern EM, Orszag A, et al. Identification and prediction of diabetic sensorimotor polyneuropathy using individual and simple combinations of nerve conduction study parameters. PloS One. 2013;8:e58783. doi: 10.1371/journal.pone.0058783. [DOI] [PMC free article] [PubMed] [Google Scholar]
- Yajnik CS, Kantikar V, Pande A, Deslypere JP, Dupin J, Calvet JH, et al. Screening of cardiovascular autonomic neuropathy in patients with diabetes using non-invasive quick and simple assessment of sudomotor function. Diabetes Metab. 2013;39:126–31. doi: 10.1016/j.diabet.2012.09.004. [DOI] [PubMed] [Google Scholar]
- Zilliox LA, Ruby SK, Singh S, Zhan M, Russell JW. Clinical neuropathy scales in neuropathy associated with impaired glucose tolerance. J Diabetes Complicat. 2015;29:372–7. doi: 10.1016/j.jdiacomp.2015.01.011. [DOI] [PMC free article] [PubMed] [Google Scholar]
Associated Data
This section collects any data citations, data availability statements, or supplementary materials included in this article.