

Abstract
Background and Purpose
Doxorubicin (DOX) is an effective cancer therapeutic agent but causes therapy‐limiting cardiotoxicity. The effects of DOX and its metabolite doxorubicinol (DOXL) on individual channels have been well characterized in isolation. However, it is unknown how the action and interaction of affected channels combine to generate the phenotypic cardiotoxic outcome. We sought to develop an in silico model that links drug effects on channels to action potential duration (APD) and intracellular Ca2+ concentration in order to address this gap in knowledge.
Experimental Approach
We first propose two methods to obtain, from published values, consensus drug effects on the currents of individual channels, transporters and pumps. Separately, we obtained equivalent values for APD and Ca2+ concentration (the readouts used as surrogates for cardiotoxicity). Once derived, the consensus effects on the currents were incorporated into established biophysical models of the cardiac myocyte and were refined adjusting the sarcoplasmic reticulum Ca2+ leak current (I Leak) until the consensus effects on APD and Ca2+ dynamics were replicated. Using factorial analysis, we then quantified the relative contribution of each channel to DOX and DOXL cardiotoxicity.
Key Results
The factorial analysis identified the rapid delayed rectifying K+ current, the L‐type Ca2+ current and the sarcoplasmic reticulum I Leak as the targets primarily responsible for the cardiotoxic effects on APD and Ca2+ dynamics.
Conclusions and Implications
This study provides insight into the mechanisms of DOX‐induced cardiotoxicity and a framework for the development of future diagnostic and therapeutic strategies.
Abbreviations
- AP
action potential
- APD
action potential duration
- DOX
doxorubicin
- DOXL
doxorubicinol
- ICaL
L‐type Ca2+ current
- IKr
rapid delayed rectifying K+ current
- ILeak
sarcoplasmic reticulum Ca2+ leak current
- INaCa
Na+/Ca2+ exchange current
- INaK
Na+/K+ pump current
- IRel
ryanodine receptor current
- IUp
sarcoplasmic reticulum Ca2+‐ATPase pump current
- SR
sarcoplasmic reticulum
Introduction
Anthracyclines play an important role in the treatment of neoplastic cancers due to their efficiency and broad activity spectrum. Doxorubicin (DOX) is the predominant anthracycline, but its use is limited due to cardiotoxicity (Octavia et al., 2012).
In humans, DOX cardiotoxicity manifests over two time scales: acute and chronic. Acute effects occur within 48 h of infusion and are generally reversible and clinically manageable (Takemura and Fujiwara, 2007). They develop in up to 40% of the patient population and are manifested as primary electrophysiological dysfunction: atypical ST‐segment and T‐wave abnormalities, reduced QRS voltages, sinus tachycardia, QT interval prolongation and ventricular and atrial arrhythmias (Singal et al., 1987; Yeh et al., 2004; Octavia et al., 2012). Chronic toxicity is manifested as progressive hypotension, tachycardia with a characteristic decrease in the QRS voltage, cardiac dilatation and ventricular failure (Lefrak et al., 1973; Singal et al., 1987) and may not become evident until 4 to 20 years after the last administration of DOX (Octavia et al., 2012). Chronic toxicity affects >60% of patients receiving maximal acceptable cumulative dosages (Dresdale et al., 1983) and has a poor prognosis (Takemura and Fujiwara, 2007; Octavia et al., 2012). This combination of electrical and mechanical dysfunction represents cellular electrophysiology and excitation–contraction coupling toxicity.
Investigations of the mechanisms of DOX toxicity, whether after acute or chronic exposure, have made use of ex vivo isolated cardiac myocyte preparations. These studies have shown that changes in action potential (AP) (Wang and Korth, 1995; Wang et al., 2001) and Ca2+ handling dynamics (Wang and Korth, 1995; Wang et al., 2001; Sag et al., 2011) in acute studies differ from outcomes after chronic exposure (Jensen, 1986; Shenasa et al., 1990). Based on this and the range of known effects on different relevant molecular targets, it can be surmised that acute and chronic DOX cardiotoxicity reflect a combination of direct DOX effects on channel, pump and exchanger function and indirect effects on expression levels. The metabolite doxorubicinol (DOXL) which accumulates in cardiac tissue (Del Tacca et al., 1985) is a possible contributor to the chronic toxicity (Olson and Mushlin, 1990). Unfortunately, although such a cause and effect matrix may be inferred, the mechanistic details remain unclear.
Quantifying drug effects on relevant molecular targets may help inform earlier diagnosis of toxicity and better targeted treatment. Previous studies have primarily focused on characterizing drug effects on individual molecular targets. How such effects account for the changes in AP and Ca2+ homeostasis is a gap in knowledge. Biophysical models of cellular electrophysiology and Ca2+ dynamics (Fink et al., 2011) may provide a framework for bridging this gap.
We have focused on modelling DOX and DOXL effects on electrophysiology and calcium handling. This is because these are important end effectors mediating adverse DOX and DOXL actions on rhythm and force. Changes in these effectors may be caused by direct drug–molecule interactions or may be secondary to known effects on mitochondrial DNA (Serrano et al., 1999), ROS production (Davies and Doroshow, 1986), the electron transport chain (Marcillat et al., 1989) and mitochondrial permeability (Montaigne et al., 2011). Whether the effects on ion channels and calcium handling are ‘direct’ or ‘indirect’ does not affect the modelling results, which incorporates ‘end’ effects and concentrations without the need to specify whether or not the outcomes are directly or indirectly mediated.
In this study, we modified two pre‐existing mathematical models to investigate the contributions of different transporters, pumps and channels, hereafter called ‘channels’ when described collectively, to overall DOX and DOXL cardiotoxicity. The first task was to ensure standardization of the input data. Owing to the heterogeneity of the way drug effects are described in published papers, we undertook a parallel investigation to determine the best method to obtain a consensus drug effect on individual channels, action potential duration (APD) and Ca2+ dynamics. The method of deriving and processing these effects is thus part of the study. Once derived, the consensus effect values for drug actions on channels were incorporated into biophysical models of cardiac myocyte electrophysiology and Ca2+ dynamics. We then refined the models until the consensus drug effect on APD and Ca2+ dynamics were reproduced. Using factorial analysis, we then alternated the inclusion of individual consensus drug effects and their combinations to reveal the relative contribution of each channel, and their interactions, in mediating DOX and DOXL cardiotoxicity.
The study shows that biophysical modelling can replicate DOX cardiotoxicity well in both human and rabbit models, with some caveats. Using the models, we make three testable predictions. First, that acute DOX and DOXL and chronic DOX exposure will increase the sarcoplasmic reticulum (SR) Ca2+ leak (I Leak). Second, that reported increased K+ permeability in cells chronically exposed to DOX is consistent with an increase in the rapid delayed rectifying K+ current (I Kr). Third, that acute DOXL exposure is unlikely to cause inhibition of the Na+/Ca2+ exchangers (I NaCa).
Methods
Cell models
The bulk of the input data were from rabbit, and because of this, simulations were made for rabbit (Morotti et al., 2012) and human (ten Tusscher and Panfilov, 2006) models of cardiac ventricular myocyte electrophysiology and intracellular Ca2+ regulation. The independent variables in these models were the I Kr , the L‐type Ca2+ current (I CaL), I Leak and currents associated with the Na+/K+ pump (I NaK), SR Ca2+‐ATPase (I Up), I NaCa (capable of operating in forward and reverse mode) and the ryanodine receptor (I Rel). A full description of the model equations and parameters for both these models are available through the CellML repository (https://models.physiomeproject.org/workspace/49c) and were converted to C and MATLAB code through COR (http://opencor.ws/cor/) (Garny et al., 2003), now superseded by OpenCOR (http://opencor.ws).
In these models, the general form of the current through a given channel is as follows:
| (1) |
where Ii is the current through the channel, Gi is the channel conductance, V is the membrane potential and Vi is the Nernst potential for the channel.
The models simulate changes in currents during a simulated electrical field stimulation to generate values for AP and intracellular Ca2+ concentration. AP duration (APD) was expressed as millisecond at 90% repolarization, and intracellular Ca2+ concentration was expressed as an absolute value at the systolic peak. We also determined the time in milliseconds taken for the Ca2+ concentration to recover to 10% of its peak value (Ca2+ relaxation time), a variable that has been used in published literature as an index of recovery of diastolic Ca2+ concentration (Wang et al., 2001).
Drug effects
The models allow variation in the influence of each current on AP and intracellular Ca2+ concentration, by using an α factor as follows:
| (2) |
where αi is the consensus value for the effect of DOX (or DOXL) on each current.
Drug‐induced changes in APD, systolic Ca2+ concentration and Ca2+ relaxation time were expressed as a % change from control values generated with α = 1.
The consensus values of α, % change of APD, % change of systolic Ca2+ concentration and % change of Ca2+ relaxation time were determined by searching PubMed using the following keywords: doxorubucin, adriamycin, doxorubicinol, calcium, action potential, myocyte, ion currents, channels, pump and exchanger. Data selected for acute exposure of DOX and DOXL modelling were limited to cells exposed to the drug in vitro for up to 180 min. Data selected for simulating the chronic DOX exposure were limited to cells from hearts removed from subjects exposed chronically in vivo to DOX for a minimum of 1 week and a maximum of 9 weeks. These measurements reflect the combined effects of DOX and DOXL, which will both be present in the biophase, and their combined effects on protein targets are used to constrain the model. In studies where surrogate readouts of channel function were reported, these were treated as equivalent to direct measures. In the specific case where changes in channel mRNA expression were the primary information source, the fold change in mRNA between drug exposure and control was used as an estimate of the drug effect on function. The volume of available human tissue data was found to be insufficient for our purposes. Therefore, all data used to determine consensus effects were derived from dog, rabbit, guinea pig and rat. To avoid bias, no exclusion criteria based on data completeness, provenance or quality were used with a single exception: rat data on APD was not included since rat ventricular APD is distinctively unrelated to IKr (Rees and Curtis, 1996).
We discovered that experimental methods and data reporting are very heterogeneous. Consequently, we evaluated two different methods for estimating the consensus effects of DOX and DOXL, that is, values of α, % change of APD, % change of systolic Ca2+ concentration and % change of Ca2+ relaxation time.
Method 1
The first approach was based on an assumption that the maximum concentration used in a given study is the concentration causing the maximum effect on each given target. The values thus obtained therefore have accuracy but uncertain precision.
A single % change α value was calculated for each channel as the mean of the % change values reported from different studies rounded to the nearest 10%, ranging between 0.1 and 0.9 to represent a % change between 10 and 90% (Table 1, column 2). We used a similar approach when calculating the consensus values for the % change in APD, systolic Ca2+ concentration and Ca2+ relaxation time (Table 2, column 2).
Table 1.
Consensus % change values (α values) derived using method 1 and method 2 for all currents after exposure to DOX and DOXL
| Method 1 | Method 2 | Data | |||||||||
|---|---|---|---|---|---|---|---|---|---|---|---|
| Current | Average % change | % change 100/10 μM | Mean IC50/EC50 (μM) | IC50/EC50 (μM) | % change in current activity | Method | Concentration/ Dose | Time of exposure | Temp | Reference | |
| Acute DOX | |||||||||||
| α | α | ||||||||||
| I Rel | +60% | +78% | 29 | 13 | Rat | +43% | Fractional release in % | 10 μM | 30 min | 37°C | (Sag et al., 2011) |
| 0.125 | R | +96% | Ca2+ release | 10 μM | 180 min | 32°C | (Mushlin et al., 1993) | ||||
| 75 | Dog | +40% | Ca2+ release (nmol·mg−1) | 50 μM | 2 min | 37°C | (Qing et al., 1991) | ||||
| I Up | −30% | −7% | 1289 | 210 | R | −30% | Ca2+ ATPase | 90 μM | – | – | (Boucek et al., 1987b) |
| 2344 | Dog | −23% | μM of Ca2+ per mg of protein per min | 700 μM | 60 min | 37°C | (Olson et al., 1988) | ||||
| 967 | −42% | μM of Pi per mg of protein per min | 700 μM | 60 min | 37°C | (Olson et al., 1988) | |||||
| 1633 | −30% | μM of Pi per mg of protein per min | 700 μM | Every 30 min | 37°C | (Boucek et al., 1987b) | |||||
| I CaL | +40% | +32% | 217 | 58 | R | +61% | Peak Ca2+ current (pA·pF−1) | 90 μM | 120 min | 35–37°C | (Earm et al., 1994) |
| 376 | GP | +21% | Peak Ca2+ current (pA·pF−1) | 100 μM | 60 min | 35–36°C | (Wang and Korth, 1995) | ||||
| I NaCa | −40% | −6% | 1581 | 4410 | R | −2% | Peak NCX current (pA·pF−1) | 90 μM | 60 min | 35–37°C | (Earm et al., 1994) |
| 319 | −22% | NCX exchange rate | 90 μM | – | – | (Boucek et al., 1987b) | |||||
| 14 | Dog | −85% | Ca2+ uptake on NCX exchanger | 80 μM | 20 min | 37°C | (Caroni et al., 1981) | ||||
| I NaK | −20% | −1% | 7251 | 106 | Rat | −46% | μM of Pi per mg of protein per h | 90 μM | 30 min | 35°C | (Miwa et al., 1986) |
| 6300 | R | −10% | μM of Pi per mg of protein per h | 700 μM | 60 min | 37°C | (Olson et al., 1988) | ||||
| 9300 | Dog | −7% | μM of Pi per mg of protein per h | 700 μM | Every 30 min | 37°C | (Boucek et al., 1987b) | ||||
| 13 300 | −5% | μM of Pi per mg of protein per h | 700 μM | 60 min | 37°C | (Olson et al., 1988) | |||||
| I Kr | −40% | −44% | 127 | 127 | GP | −44% | Ik tail current (pA) | 100 μM | 60 min | 37°C | (Wang and Korth, 1995) |
| Chronic DOX | |||||||||||
| I Rel | −40% | – | – | – | R | −24% | mRNA | 2 mg·kg−1 | 8 weeks (1) | NA | (Huang et al., 2003) |
| −29% | – | 1 mg·kg−1 | 8 weeks (2) | 37°C | (Olson et al., 2005) | ||||||
| −65% | – | 2.5 mg·kg−1 | 8 weeks (1) | 30°C | (Arai et al., 1998) | ||||||
| I Up | −10% | – | – | – | R | −26% | Ca2+ uptake (nmol·mg−1) | 2.5 mg·kg−1 | 8 weeks (1) | 30°C | (Arai et al., 1998) |
| −7% | 1 mg·kg−1 | 6–9 weeks (2) | 30°C | (Dodd et al., 1993) | |||||||
| −11% | 1 mg·kg−1 | 8 weeks (2) | 32°C | (Olson et al., 2005) | |||||||
| I CaL | +30% | – | – | – | Rat | +26% | Peak Ca2+ current (pA·pF−1) | 2.5 mg·kg−1 | 10 weeks (2) | 22–25°C | (Keung et al., 1991) |
| I NaCa | −20% | – | – | – | R | −13% | mRNA | 2.5 mg·kg−1 | 8 weeks (1) | 30°C | (Arai et al., 1998) |
| −25% | NCX exchanger | 1 mg·kg−1 | 8 weeks (2) | NA | (Olson et al., 2005) | ||||||
| I NaK | −20% | – | – | – | R | −15% | nM·mg−1 | 1 mg·kg−1 | 6–9 weeks (2) | 37°C | (Dodd et al., 1993) |
| I Kr | +50% | – | – | – | R | +50% | K+ permeability | NA | NA | NA | (Shenasa et al., 1990) |
| Acute DOXL | |||||||||||
| I Rel | +0% | – | 240 | 240 | R | +4% | Ca2+ release | 10 μM | 180 min | 32°C | (Mushlin et al., 1993) |
| I Up | −60% | −56% | 8 | 8 | Dog | −55% | Ca2+ loading in % of control | 9 μM | Every 30 min | 25°C | (Boucek et al., 1987b) |
| I CaL | −10% | −5% | 190 | 190 | GP | −5% | Peak Ca2+ current (nA) | 10 μM | 15 min | 37°C | (Wang et al., 2001) |
| I NaCa | −100% | – | – | – | R | −100% | NCX exchange rate | 90 μM | – | – | (Boucek et al., 1987b) |
| I NaK | −50% | −50% | 10 | 10 | Dog | −50% | Na+/K+ ATPase in % of control | 10 μM | Every 30 min | 37°C | (Boucek et al., 1987b) |
| I Kr | +50% | +48% | 11 | 11 | GP | +48% | Ik tail current (pA) | 10 μM | 15 min | 37°C | (Wang et al., 2001) |
Experimental observations (columns 6–10) and average estimates (α values in column 2) of changes in ion currents generated using method 1 for INaK, IKr, IUp, INaCa, IRel and ICaL after acute DOX, chronic DOX and acute DOXL exposure. Extrapolated values of IC50 and EC50 for each dose concentration after acute exposure to DOX and DOXL and their average value are also included (columns 4–5). From these IC50/EC50 values, estimates of change in the currents after exposure to 100 μM of DOX and 10 μM of DOXL are calculated using method 2 (α values in column 3). Chronic DOX time of exposure is expressed in number of weeks that protocol was applied and the number of doses delivered each weak indicated in brackets. APD90, APD at 90% repolarization; GP, guinea pig; R, rabbit; RT, relaxation time; [Ca2+]i, intracellular calcium concentration.
Table 2.
Consensus values of % change derived using method 1 for APD, systolic Ca2+ concentration and Ca2+ relaxation time after exposure to DOX and DOXL
| Method 1 | Method 2 | Data | |||||||||
|---|---|---|---|---|---|---|---|---|---|---|---|
| Average % change | Average IC50/EC50 (μM) | IC50/EC50 (μM) | Measurements of % change | Description | Concentration/Dose | Time of exposure | Temp | Reference | |||
| Acute DOX | |||||||||||
| APD | +50% | 142 | 61 | GP | +62% | APD90 | 100 μM | 60 min | 35–36°C | (Wang and Korth, 1995) | |
| 223 | +31% | APD90 | 100 μM | 20 min | 34–35°C | (Wang et al., 2001) | |||||
| Ca2+ C | +50% | 92 | 92 | GP | +52% | [Ca2+]i | 100 μM | 60 min | 35–36°C | (Wang and Korth, 1995) | |
| Ca2+ RT | +30% | 233 | 233 | +30% | [Ca2+]i RT | (Wang and Korth, 1995) | |||||
| Ca2+ C | −40% | 13 | 13 | Rat | −43% | [Ca2+]i | 10 μM | 15 min | 37°C | (Sag et al., 2011) | |
| Chronic DOX | |||||||||||
| APD | −20% | − | − | R | −20% | APD90 | 0.75 mg·kg−1 | 6–9 weeks (3) | 37°C | (Shenasa et al., 1990) | |
| R | −23% | APD90 | 1 mg·kg−1 | 8 weeks (2) | 32°C | (Doherty and Cobbe, 1990) | |||||
| R | +10% | APD90 | 1.5 mg·kg−1 | 6 weeks (2) | 37°C | (Milberg et al., 2007) | |||||
| Ca2+ C | −55% | − | − | Rat | − | [Ca2+]i | 2.5 mg·kg−1 | 8 weeks (1) | 30°C | (Jensen, 1986) | |
| −55% | [Ca2+]i | 2.5 mg·kg | 2 weeks (3) | 37°C | (De Angelis et al., 2010) | ||||||
| +38% | [Ca2+]i | 2 mg·kg−1 | 1 week (3) | 30°C | (Kapelko et al., 1996) | ||||||
| +74% | [Ca2+]i | 2.5 mg·kg−1 | 6 weeks (1) | 37°C | (Szenczi et al., 2005) | ||||||
| Ca2+ RT | +10% | − | − | Rat | +20% | [Ca2+]i RT | 2.5 mg·kg−1 | 2 weeks (3) | 37°C | (De Angelis et al., 2010) | |
| 0% | [Ca2+]i RT | 2 mg·kg−1 | 1 week (3) | 30°C | (Kapelko et al., 1996) | ||||||
| Acute DOXL | |||||||||||
| APD | −30% | 30 | 30 | GP | −25% | APD90 | 10 μM | 20 min | 34–35°C | (Wang et al., 2001) | |
| Ca2+ C | −20% | 34 | 34 | GP | −23% | [Ca2+]i | 10 μM | 15 min | 34–35°C | (Wang et al., 2001) | |
| Ca2+ RT | +50% | 92 | 92 | +52% | [Ca2+]i RT | (Wang et al., 2001) | |||||
Experimental observations (columns 5–9) for APD, Ca2+ concentration (Ca2+ C) and relaxation time (Ca2+ RT) after acute DOX, chronic DOX and acute DOXL exposure. Column 2 is the average % change estimates of changes derived using method 1. Columns 3 and 4 are the extrapolated values of IC50 and EC50 for each dose concentration after acute exposure to DOX and DOXL, and their average value is generated using method 2. Chronic DOX time of exposure is expressed in number of weeks that protocol was applied, and the number of doses delivered each weak is indicated in brackets. Two large and opposite changes are reported for acute DOX effects on Ca2+ C, both values are reported as the consensus value and these different results are rationalized in the body text. APD90, APD at 90% repolarization; GP, guinea pig; R, rabbit; RT, relaxation time; [Ca2+]i, intracellular calcium concentration.
This approach allows for the fact that a given drug concentration may have different effects in different preparations. However, this method disregards the concentration dependence of drug effects.
Unlike the α value for all other targets, the α value for I Leak was fitted to achieve the consensus cellular Ca2+ transient and was not inferred from direct experimental measurements of I Leak. This parameter is a prediction of the modelling framework and not an experimental measurement. The α for I Leak is calculated as the factor needed for the simulated % systolic Ca2+ concentration to match the consensus % systolic Ca2+ concentration, with α bounded to fall between 2 and 10, representing a % increase ranging between 100 and 900%. Some qualitative data are available (Wang and Korth, 1995; Sag et al., 2011) that indicates a likely effect of DOX on this current, but no reliable quantitative values are available to date.
Method 2
The second approach was based on a different assumption: that drug inhibition or activation of each channel can be described by a Hill equation with no co‐operativity, with the maximum effect of the drug (Emax) equalling 100% inhibition or a 100% increase. The values obtained have precision, but uncertain accuracy. The resulting scalars are given as
| (3) |
where IC50 or EC50 corresponds to the drug concentration that causes 50% inhibition or activation, respectively, [drug] is the concentration of the drug and Hill is the co‐operativity parameter which is set to 1.
This approach allows EC50 or IC50 values to be estimated for all channels (Table 1, columns 4 and 5; Table 2, columns 3 and 4), even in cases where only a single data point was available. From this, we were able to construct Hill plots that permitted estimation of % change in α after exposure to 100 μM of DOX and 10 μM of DOXL by extrapolation (Table 1, column 3). These concentrations were selected because they are direct counterparts of the concentrations most commonly evaluated in ‘wet’ tissue studies (Table 1 column 8 and Table 2 column 7). This method was not applied to estimate consensus values of % change of APD, systolic Ca2+ concentration and Ca2+ relaxation time as the concentrations in these studies are predominantly consistent with the chosen concentrations of 100 μM of DOX and 10 μM of DOXL.
The α values for I Leak were estimated for the case of 100 μM of DOX and 10 μM of DOXL by first simulating the effect of DOX or DOXL to permit determination of an α value for I Leak, which was inferred by fitting the model predictions of Ca2+ concentration to experimental measurements of Ca2+ concentration when cells were exposed to either 100 μM of DOX and 10 μM of DOXL. This gave α values for I Leak for 100 μM of DOX and 10 μM of DOXL.
Chronic DOX exposure was not evaluated by this approach since changes in current activity develop over time and are not dose dependent in the classical sense owing to their genomic basis and therefore not appropriately represented by a simple mass action model.
Provenance of input data and methods for best estimation
The processes described above for determining consensus values were difficult to execute in certain cases. These cases included data that lacked precision (too few studies and/or semi‐quantitative estimates) or accuracy (several studies reporting contradictory estimates) as described below.
Estimates of % change of systolic Ca2+ concentration after acute DOX exposure
The change in systolic Ca2+ concentration caused by acute DOX exposure varies, with some authors reporting a decrease while others report an increase. Thus, Sag et al. (2011) reported a decrease of 43%, whereas Wang and Korth (1995) reported a 50% increase. This inconsistency in response is also reflected in inotropy measurements which are equally inconsistent (De Beer et al., 2001). The +50% value was chosen as the consensus effect because the drug concentration used in this study (100 μM) was the same as the reference concentration used in the acute DOX simulation.
Estimates of % change of Na+/Ca2+ exchanger inhibition after acute DOXL exposure
Acute exposure to DOXL has been reported to cause up to 100% inhibition of the Na+/Ca2+ exchanger (Table 1, column 2) (Boucek et al., 1987a), but when this effect was incorporated into the human and rabbit models, the outcome was asystole due to failure of repolarization. It is difficult to explore this observation further since the study (Boucek et al., 1987a) did not state whether the measurements were corrected for changes in intracellular Na+ due to Na+/K+ pump inhibition.
In view of the potential importance of this, and the meagre provenance of the source data (Boucek et al., 1987a), we conducted a separate simulation to test if the reported 100% inhibition of the Na+/Ca2+ exchanger could be explained by the secondary effect of intracellular Na+ accumulation following the Na+/K+ pump inhibition by DOXL. To do this, we simulated the recovery of Ca2+ concentration following a caffeine exposure [a Na+/Ca2+ exchanger‐dependent process (Bers, 2000)] for the human cell model, with the Na+/K+ pump set at 50% (Table 1, column 2). This revealed that the published inhibition of the Na+/Ca2+ exchanger can be explained by the inhibitory effects of accumulation of intracellular Na+ due to Na+/K+ inhibition (Figure 1). For this reason, we deduced that DOXL has a negligible direct effect on the Na+/Ca2+ exchanger and set α to 1 in the simulations that follow below.
Figure 1.
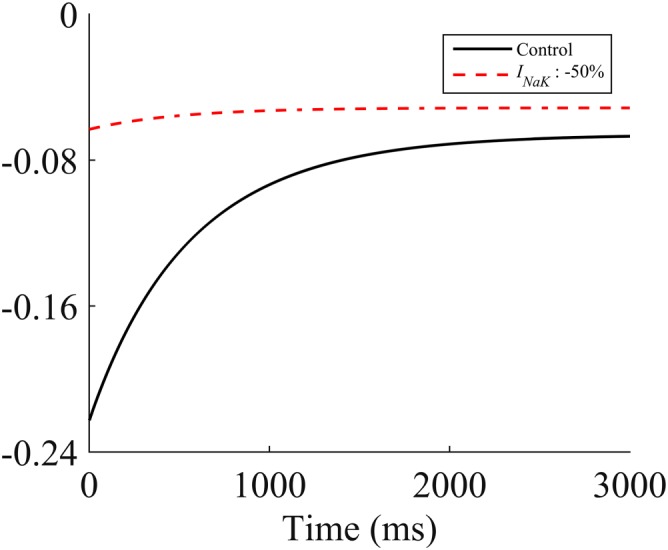
Simulated caffeine exposure in the human model. The red dashed line shows the predicted I NaCa current following a simulated caffeine exposure with no change in I NaCa but with inhibition of I NaK by 50%. The black line shows the simulated INaCa current following a simulated caffeine exposure using the reference model.
Estimates of % change of APD after chronic DOX exposure
Chronic DOX experiments are fewer, and the resultant α estimates are therefore less reliable than those for acute DOX exposure. Indeed, reported effects on APD are conspicuously inconsistent, with changes ranging from an increase of 10% (Milberg et al., 2007) to a decrease of 20% (Doherty and Cobbe, 1990; Shenasa et al., 1990). We selected a −20% value as the consensus acute effect on APD.
Estimates of α value for IKr after chronic DOX exposure
Chronic DOX increases K+ permeability (Shenasa et al., 1990), but the channel responsible has not been identified. We represented this qualitative observation by assuming, in the first instance, a 50% activation of the most commonly drug‐affected repolarizing K+ current, I Kr. The limitations of this assumption are considered further in the Discussion section.
Estimates of % change of systolic Ca2+ concentration after chronic DOX exposure
Data on effects of chronic DOX exposure on Ca2+ concentration suggest longer exposures cause an increase (Kapelko et al., 1996; Szenczi et al., 2005) and shorter exposures cause a decrease (De Angelis et al., 2010). This may reflect chronic DOX causing a decrease in intracellular Ca2+ that gives rise to heart failure which then leads to Ca2+ accumulation (Olson and Mushlin, 1990) that is not seen with acute exposure.
As we are primarily interested in DOX toxicity, we aimed to simulate the decrease in Ca2+ concentration attributed to chronic DOX exposure (which has been examined only in rats to date). The idea of a decrease is compatible with data from humans in which heart failure caused by chronic exposure to DOX has been associated with a depressed contractile state (Singal et al., 1987), which would be consistent with a reduction in Ca2+ concentration.
Simulations
The α values from method 1 were incorporated into human and rabbit models described above, and the resulting models labelled as acute DOX, chronic DOX and acute DOXL. Separately, the α values from method 2 were incorporated and the models labelled as acute 100 μM DOX and acute 10 μM DOXL.
The field stimulation protocol used to generate APs consisted of 3000 depolarizations at 1 Hz. This ensures equilibrium and is based on physiological and standard experimental pacing rate (Wang et al., 2001). APD, systolic Ca2+ concentration Ca2+ and relaxation time values for analysis were generated from the 3001st depolarization.
We then compared the generated % change of APD, systolic Ca2+ concentration and relaxation time with the consensus values of the % change of APD, systolic Ca2+ concentration and Ca2+ relaxation time observed in experimental studies (Table 2, column 2). We then modified the consensus value of α for ILeak (the explanation for this is given later) until we recapitulated the consensus % change values. A synopsis of predicted model function at different pacing rates for the final fitted models is provided in the Supporting Information.
Factorial analysis
The overall process of computation ended with factorial analysis. APD, systolic Ca2+ concentration and Ca2+ relaxation time were generated by simulation with α values defined either as 1 (drug free simulation) or equal to the consensus values derived by method 1 and then by method 2 (consensus altered simulation values). All combinations of α values (drug free and consensus altered value) were examined, thus revealing independent contributions of currents on APD, systolic Ca2+ concentration and Ca2+ relaxation. Current–current interactions were also considered by introducing simultaneous changes of α values in pairs of currents.
Nomenclature of targets and ligands
Key protein targets and ligands in this article are hyperlinked to corresponding entries in http://www.guidetopharmacology.org, the common portal for data from the IUPHAR/BPS Guide to PHARMACOLOGY (Southan et al., 2016), and are permanently archived in the Concise Guide to PHARMACOLOGY 2017/18 (Alexander et al., 2017a,b,c).
Results
Acute DOX effects assessed by method 1
Rabbit
The APD, Ca2+ concentration and Ca2+ relaxation time were initially +4, +174 and −1%, respectively, when there is no increase in the SR leak (α = 1 for I Leak). Increasing the SR leak flux by +300% (α = 4 for I Leak) caused the effect of simulated acute DOX on APD, Ca2+ concentration and Ca2+ relaxation time to be +7, +23 and +17%, respectively, compared to consensus values of +50, +50 and +30%, respectively (Figure 2 and Tables 2 and 3).
Figure 2.
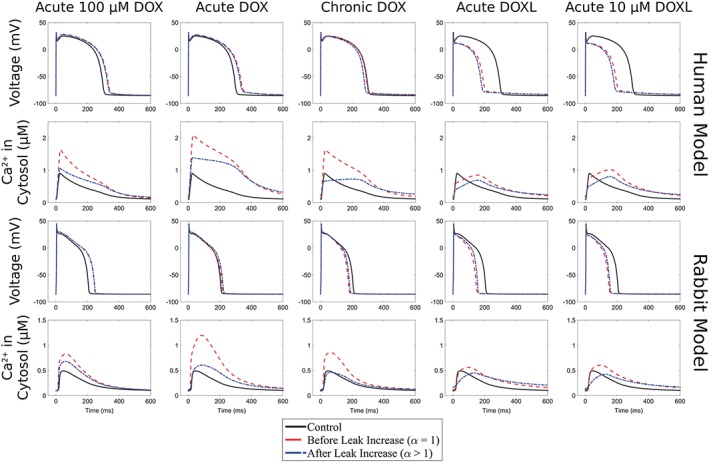
Rabbit and human models: changes in APD and Ca2+ concentration for acute DOX, chronic DOX, acute DOXL, acute 100 μM DOX and acute 10 μM DOXL before and after leak increase with respect to the corresponding control model with no drug effects.
Table 3.
Model predictions of % change in APD, systolic Ca2+ concentration (Ca2+ C) and Ca2+ relaxation time (Ca2+ RT) before and after leak is increased
| Acute 100 μM DOX | Acute DOX | Chronic DOX | Acute DOXL | Acute 10 μM DOXL | |||||||||||
|---|---|---|---|---|---|---|---|---|---|---|---|---|---|---|---|
| APD | Ca2+ C | Ca2+ RT | APD | Ca2+ C | Ca2+ RT | APD | Ca2+ C | Ca2+ RT | APD | Ca2+ C | Ca2+ RT | APD | Ca2+ C | Ca2+ RT | |
| Rabbit | α = 1 | ||||||||||||||
| +18% | +84% | −6% | +4% | +174% | −1% | −14% | +87% | −13% | −28% | +11% | +44% | −27% | +23% | +37% | |
| Human | α = 1 | ||||||||||||||
| +12% | +90% | +10% | +15% | +141% | +41% | −1% | +84% | +17% | −32% | −14% | +13% | −30% | +6% | +7% | |
| Rabbit | α = 2 | α = 4 | α = 4 | α = 10 | |||||||||||
| +19% | +48% | +0% | +7% | +23% | +17% | −11% | −12% | +9% | −24% | −29% | +57% | −24% | −28% | +47% | |
| Human | α = 2 | α = 2 | α = 3 | α = 2 | |||||||||||
| +11% | +13% | +20% | +13% | +47% | +58% | −7% | −38% | +3% | −38% | −38% | +18% | −37% | −26% | +13% | |
| Consensus % change | +50% | +50% | +30% | +50% | +50% | +30% | −20% | −55% | +10% | −30% | −20% | +50% | −30% | −20% | +50% |
Predictions of % change for APD, systolic Ca2+ concentration (Ca2+ C) and Ca2+ relaxation time (Ca2+ RT) for acute DOX, chronic DOX, acute DOXL, acute 100 μM DOX and acute 10 μM DOXL exposures in rabbit and human models before leak is increased (α = 1) and after leak is increased (α = 2, 3, 4, 10) and comparison with consensus values for the average % change in APD, systolic Ca2+ concentration and Ca2+ relaxation time derived using method 1 (Table 2).
Human
The APD, Ca2+ concentration and Ca2+ relaxation time were initially +15, +141 and +41%, respectively, when there is no increase in the SR leak (α = 1 for I Leak). Increasing the SR leak flux by +100% (α = 2 for I Leak) caused the effect of simulated acute DOX on APD, Ca2+ concentration and Ca2+ relaxation time to be +13, +47 and +58%, respectively, compared to consensus values of +50, +50 and +30, respectively (Figure 2 and Tables 2 and 3).
Acute DOXL effects assessed by method 1
Rabbit
Estimates of APD, Ca2+ concentration and Ca2+ relaxation time were −28, +11 and +44% respectively. As these values differ from the consensus values of −30, −20 and +50%, respectively, leak flux was then increased by +900% (α = 10 for I Leak). Consequently, APD, Ca2+ concentration and Ca2+ relaxation time became −24, −29 and +57%, respectively, in closer agreement with the consensus values shown above (Figure 2 and Tables 2 and 3).
Human
Estimates of APD, Ca2+ concentration and Ca2+ relaxation time were −32, −14 and +13% respectively. Leak flux was then increased by +100% (α = 2 for I Leak) and APD, Ca2+ concentration and Ca2+ relaxation time became −38, −38 and +18%, respectively, in closer agreement with the consensus values of −30, −20 and +50% respectively (Figure 2 and Tables 2 and 3).
Chronic DOX effects assessed by method 1
Rabbit
Effects of chronic DOX on SR leak were set at +300% (α = 4 for I Leak) in the rabbit model. The inclusion of these changes caused APD, Ca2+ concentration and Ca2+ relaxation time determined by method 1 to change from −14, +87 and −13% to −11, −12 and +9%, consistent with consensus values of −20, −55 and +10% respectively (Figure 2 and Tables 2 and 3).
Human
Effects of chronic DOX on SR leak were set at +200% (α = 3 for I Leak) which caused APD, Ca2+ concentration and Ca2+ relaxation time determined by method 1 to change from −1%, +84% and +17% to −7%, −38% and +3%, consistent with consensus values of −20%, −55% and +10%, respectively (Figure 2 and Tables 2 and 3).
Acute DOX effects assessed by method 2
Rabbit
Method 2 predicted DOX‐induced changes in APD, Ca2+ concentration and Ca2+ relaxation time, of +18%, +84% and −6% in rabbit, values that digress from the consensus values of +50%, +50% and +30% respectively. When leak flux was increased by +100% (α = 2 for I Leak) changes were +19%, +48% and +0%, respectively, in closer agreement with consensus values (Figure 2 and Tables 2 and 3).
Human
Method 2 predicted DOX‐induced changes in APD, Ca2+ concentration and Ca2+ relaxation time, of +12%, +90% and +10%. When leak flux was increased by +100% (α = 2 for I Leak), changes were +11%, +13% and +20%, respectively, in good agreement with consensus values +50%, +50% and +30%, respectively (Figure 2 and Tables 2 and 3).
Acute DOXL effects assessed by method 2
Rabbit
Method 2 predicted DOXL‐induced changes in APD, Ca2+ concentration and Ca2+ relaxation time of −27%, +23%, +37% (rabbit) respectively. After leak was increased by +900% (α = 10 for I Leak) values changed to −24%, −28% and +47%, respectively, in better agreement with consensus values of −30%, −20% and +50%, respectively (Figure 2 and Tables 2 and 3).
Human
Method 2 predicted DOXL‐induced changes in APD, Ca2+ concentration and Ca2+ relaxation time of −30%, +6%, +7% respectively. After leak was increased by +100% (α = 2 for I Leak), values changed to −37%, −26%, and +13%, respectively, in closer agreement with consensus values of −30%, −20% and +50%, respectively (Figure 2 and Tables 2 and 3).
Factorial analysis
We undertook factorial analysis on data for the human model only (Figure 3 and Table 4) having found that the simulation of drug effects in rabbit and human models were comparable (Figure 4).
Figure 3.
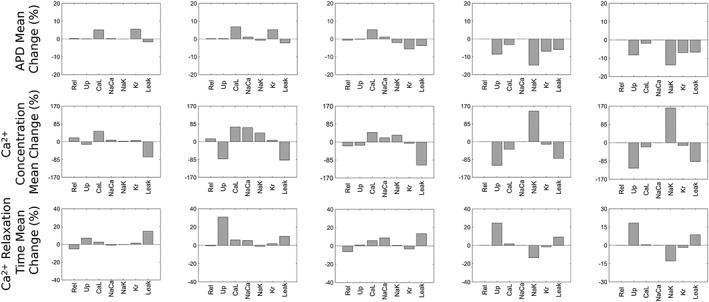
Factorial analysis of the effects of currents on APD, systolic Ca2+ concentration and Ca2+ relaxation time for (left) acute DOX model derived at 100 μM (centre) acute DOX, chronic DOX and acute DOXL models obtained at a range of experimental dosages and (right) acute DOXL model derived at 10 μM.
Table 4.
Effects of currents on APD, Ca2+ concentration (Ca2+ C) and relaxation time (Ca2+ RT) calculated using factorial analysis
| Acute 100 μM DOX | Acute DOX | Chronic DOX | Acute DOXL | Acute 10 μM DOXL | ||||||
|---|---|---|---|---|---|---|---|---|---|---|
| APD |
I
Kr
I CaL |
+6% +5% |
I
Kr
I CaL |
+5% +7% |
I
Kr
I CaL I Leak |
−6% +5% −4% |
I
Kr
I Up I NaK I Leak |
−7% −9% −15% −6% |
I
Kr
I Up I NaK I Leak |
−7% −8% −14% −7% |
| Ca2+ C |
I
CaL
I Leak |
+50% −72% |
I
Up
I CaL I NaCa I Leak |
−81% +70% −67% −88% |
I
CaL
I Leak |
+46% −109% |
I
Up
I NaK I Leak |
−113% +145% −79% |
I
Up
I NaK I Leak |
−118% +161% −87% |
| Ca2+ RT | I Leak | +15% | I Up | +31% |
I
NaCa
I Leak |
+9% +13% |
I
Up
I NaK I Leak |
+24% −13% −9% |
I
Up
I NaK I Leak |
+18% −13% +9% |
Figure 4.
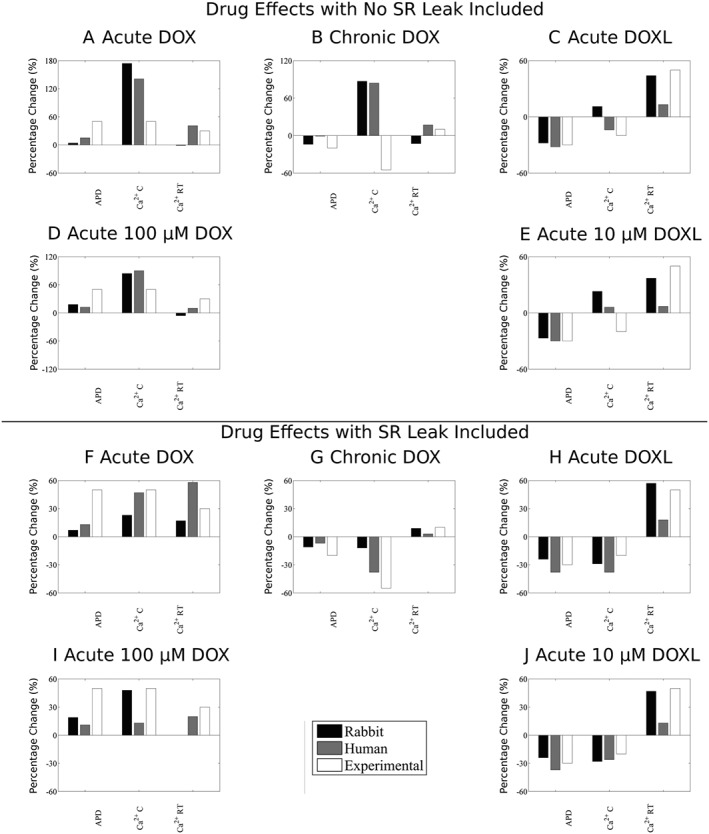
Comparison between rabbit and human models. Panels A–E show results with no change in SR leak, and panels F–J show results after SR leak is optimized for changes in APD, Ca2+ concentration (Ca2+ C) and Ca2+ relaxation time (Ca2+ RT) for acute DOX, chronic DOX, acute DOXL, acute 100 μM DOX and acute 10 μM DOXL.
Factorial analysis effects are expressed as % values (referring to the size of the change attributable to the current or current interactions). We first considered the acute effects of DOX using method 1. In this case, the current with the greatest role in the effect of DOX on APD (method 1) was I CaL (+7%) followed by I Kr (+5%), with I Up, I CaL, I NaCa and I Leak having the largest role in the effect on Ca2+ concentration (−81, +70, −67 and −88%, respectively). I Up had the largest role in the effect on Ca2+ relaxation time (+31%). Interactions with maximum role in the effect were I Up × I Leak (23%) and I Up × I NaCa (21%) for Ca2+ concentration and I Up × I NaCa (7%) and I NaCa × I Leak (6%) for Ca2+ relaxation time. All interactions for APD were negligible (<1%).
Method 2 outcomes were similar to method 1 outcomes. The current with the greatest role in the effect of DOX on APD using method 2 was I CaL (+5%) followed by I Kr (+6%), with I CaL and I Leak having the most substantial role in the effects on Ca2+ concentration (+50% and −72%, respectively). In contrast, Ca2+ relaxation time was affected by I Leak only (+15%). Interactions with maximum roles in the effect were I CaL × I Leak (13%) for Ca2+ concentration and I Rel × I Leak (3%) for Ca2+ relaxation time. All interactions for APD were negligible (<1%).
Next, we considered acute effects on DOXL. In method 1, changes in APD were predominantly determined by effects on I NaK, I Up, I Kr and I Leak (−15, −9, −7 and −6%, respectively), with effects on I NaK, I Up and I Leak contributing the most to changes in Ca2+ concentration (+145, −113 and −79%, respectively) and changes in Ca2+ relaxation time (−13, +24 and +9%, respectively). Interactions with maximum influence were effects on I Up × I NaK (7%) for changes in APD, effects on I Up × I NaK (85%) for changes in Ca2+ concentration and effects on I Up × I Leak (8%) for changes in Ca2+ relaxation time.
In method 2, acute effects of DOXL exposure were accounted for by actions on targets that are in close agreement with findings for method 1, with effects on I NaK, I Up, I Kr and I Leak (−14, −8, −7 and −7%, respectively), I NaK, I Up and I Leak (+161, −118 and −87%, respectively) and I NaK, I Up,and I Leak (−13, +18 and +9, respectively) having the major role in the effects on APD, Ca2+ concentration and Ca2+ relaxation time respectively. Interactions with maximum influence were I Up × I NaK (7%) for APD, I Up × I NaK (82%) for Ca2+ concentration and I Up × I NaK (5%) for Ca2+ relaxation time.
Finally, we considered effects of chronic DOX exposure. Here, effects on I Kr (−6%), I CaL (+5%) and I Leak (−4%) played the predominant role in changes in APD (similar to findings for effects of acute DOX exposure). Effects on I CaL and I Leak had the major contribution to changes in Ca2+ concentration (+46 and −109%, respectively), while effects on I NaCa and I Leak had the greatest contribution to changes in Ca2+ relaxation time (+9 and +13%, respectively). Interactions having the greatest contribution to effects were I CaL × I Leak (23%) for Ca2+ concentration and I Rel × I Leak (10%) for Ca2+ relaxation time. All interactions for APD were negligible (<1%).
Testing model assumptions
While the effects of DOX on the heart have been studied extensively, we have shown that these measurements are very heterogeneous spanning a broad range of species, preparations and temperatures. We have proposed and applied two frameworks for quantitatively combining heterogeneous pharmacological data. However, a number of assumptions, indirect inferences and simplifications were required to combine all of the experimental data. Here, we have performed additional simulations to interrogate whether these assumptions are robust.
Acute DOX causes a decrease in heart rate (Suzuki et al., 1997). To explore whether bradycardia affects the modelling, we imposed a large reduction in rate (to 0.5 Hz) and found a range of modifications in outcome. There was no particular pattern within or between human and rabbit comparisons. However, given that the derived default model used 1 Hz stimulation (for reasons explained) and yet 1 Hz is severely bradycardic for rabbit while normal for human, and given that baseline Ca2+ and Na+ values are highly heart rate dependent, and this dependence is species related, it is no surprise that the effects of this severe bradycardia differed from a setting of acute DOX, human to a setting of chronic DOX, rabbit (Table 5).
Table 5.
Sensitivity analysis testing model and data assumptions. In each case the derived default is the value from the main modelling reported in Results and consensus values derived from experiments (data shown in Table 4)
| Drug model | Results from | Model | Change in APD | Change in Peak Ca2+ | Change in RT50 |
|---|---|---|---|---|---|
| Acute DOX | Human model | Derived default | +13% | +47% | +58% |
| 0.5 Hz | +10% | +131% | +12% | ||
| I Kr = −30% | +11% | +45% | +58% | ||
| I Kr = −20% | +10% | +43% | +57% | ||
| I Kr = −10% | +8% | +41% | +56% | ||
| NCX = −10% | +13% | +17% | +23% | ||
| Acute DOX | Rabbit model | Derived default | +7% | +23% | +17% |
| 0.5 Hz | +24% | +3% | +49% | ||
| I Kr = −30% | +4% | +23% | +17% | ||
| I Kr = −20% | +1% | +23% | +16% | ||
| I Kr = −10% | −1% | +23% | +16% | ||
| NCX = −10% | +14% | +23% | +21% | ||
| Acute DOX | Consensus values | – | +50% | +50% | +30% |
| Chronic DOX | Human model | Derived default | −6% | −49% | +6% |
| 0.5 Hz | −4% | +5% | −19% | ||
| I Kr = +25% | −3% | −36% | +4% | ||
| I Kr = 0% | +0% | −35% | +7% | ||
| Chronic DOX | Rabbit model | Derived default | −11% | −12% | +9% |
| 0.5 Hz | +6% | −40% | +52% | ||
| I Kr = +25% | −6% | −8% | +9% | ||
| I Kr = 0% | −1% | −4% | +9% | ||
| Chronic DOX | Consensus values | – | −20% | −55% | +10% |
| Acute DOXL | Human model | Derived default | −35% | −38% | +27% |
| 0.5 Hz | −20% | +93% | −11% | ||
| Acute DOXL | Rabbit model | Derived default | −24% | −29% | +57% |
| 0.5 Hz | −12% | −45% | +122% | ||
| Acute DOXL | Consensus values | – | −30% | −20% | +50% |
| Acute 100 uM DOX | Human model | Derived default | +11% | +13% | +20% |
| 0.5 Hz | +9% | +4% | −20% | ||
| I Kr = −30% | +9% | +11% | +19% | ||
| I Kr = −20% | +8% | +9% | +19% | ||
| I Kr = −10% | +6% | +7% | +19% | ||
| NCX = −10% | +11% | +18% | +20% | ||
| I Ks = −95%, IKr no effect | +71% | +102% | +43% | ||
| I Ks = −95%, IKr = −50% | +111% | +150% | +46% | ||
| Acute 100 uM DOX | Rabbit model | Derived default | +19% | +48% | +0% |
| 0.5 Hz | +31% | +33% | +11% | ||
| I Kr = −30% | +14% | +41% | +1% | ||
| I Kr = −20% | +11% | +37% | +1% | ||
| I Kr = −10% | +8% | +33% | +1% | ||
| NCX = −10% | +18% | +51% | −1% | ||
| I Ks = −95%, IKr no effect | +12% | +40% | +0% | ||
| I Ks = −95%, IKr = −50% | +33% | +68% | −1% | ||
| Acute 100 uM DOX | Consensus values | – | +50% | +50% | +30% |
| Acute 10 uM DOXL | Human model | Derived default | −37% | −26% | +2% |
| 0.5 Hz | −19% | +104% | −15% | ||
| Acute 10 uM DOXL | Rabbit model | Derived default | −24% | −28% | +47% |
| 0.5 Hz | −6% | −44% | +105% | ||
| Acute 10 uM DOXL | Consensus values | – | −30% | −20% | +50% |
In the Supporting Information, we present the frequency dependence of drug effects in the human and rabbit models. Frequency did not qualitatively affect the model results (e.g. for acute DOX APD, peak Ca+ and Ca2+ RT all increased). However, for a number of models, there was a marked effect on diastolic Ca2+ and intracellular Na+ frequency response. In the majority of cases, there is no reverse rate dependence, the exception being the DOX 100 μM rabbit model. There are insufficient wet biology data sets to examine these model predictions, and whether they reflect outcomes in human or rabbits will require experimental validation.
The level of inhibition of I NaCa in the simulations of acute exposure to DOX was derived from a combination of the available experimental measurements from the three relevant publications. Two values were from rabbit, and one was from canine studies (Table 1). Considering the mean of only the rabbit measurements would give an inhibition of I NaCa of 10% instead of the original 40% consensus value derived from the mean of the three studies. The simulation outcomes for rabbit are not strongly affected by the level of I NaCa inhibition (Table 5). However, in the human model, while the effect of DOX on APD remained unchanged, the level of I NaCa inhibition by DOX did affect the Ca2+ transient (Table 5). This may be due to the greater increase in SR leak flux in the rabbit model resulting in an already attenuated Ca2+ transient that is less dependent on INaCa.
Estimations for DOX inhibition of I Kr were based in part from guinea pig measurements performed by Wang and Korth (1995) who found that DOX caused a 40% inhibition of what they called ‘IK’. Because I Ks is up to 10 times larger than I Kr in guinea pigs (Sanguinetti and Jurkiewicz, 1990), it cannot be assumed that the Wang and Korth effects are entirely attributable to block of I Kr (these investigators used tail current as their readout and the work was done before it was mandatory to distinguish I Kr from I Ks) meaning that relying on their data alone may overestimate the effect of DOX on I Kr. Fortunately, in an expression system, Ducroq et al. (2010) reported that DOX had an IC50 for I Ks of ~5 μM and limited inhibition of I Kr at a DOX concentration of 30 μM. With these two (albeit limited) estimates of effects, we tested the impact of potentially over estimating DOX effects on I Kr by running simulations with the α value of I Kr set to −30, −20 and −10%. The results are presented in Table 5. In all simulations, decreasing the inhibition of I Kr decreased the prolongation of the APD, making the model less able to reproduce the experimentally measured effects of DOX on APD. To test if blocking I Ks as opposed to or in combination with I Kr alters the predicted effect of DOX, we simulated the effects of I Kr and I Ks inhibition in the DOX 100 μM model in two simulations. First, we assumed that I Kr was not inhibited by DOX and that I Ks inhibition has an IC50 of 5 μM. In the second simulation, we assumed DOX had an IC50 of 100 μM on I Kr (significantly larger than 30 μM and causing a −50% inhibition of I Kr inferred from Wang and Korth (1995) and, for I Ks, the IC50 was 5 μM. The predicted effects on cellular function are reported in Table 5 and show that all combinations of possible K+ channel inhibition due to acute DOX exposure predict changes in APD and the Ca2+ transient consistent with consensus values.
The input data for I Kr effects in the simulations of chronic DOX relied on K+ permeability data (Shenasa et al., 1990) as a surrogate since no direct data on I Kr exists. We made the assumption that chronic DOX caused an increase of I Kr of +50%. To test the effects of this assumption, we performed simulations with the α value for I Kr varying from 0 to +25% and reported the results in Table 5. Although this decreased the ability of the simulations to predict DOX effects on APD and Ca2+ concentration, the changes were small, indicating that the uncertainty in this parameter is unlikely to alter our study conclusions.
Discussion
In this study, we showed for the first time that it is possible for two well‐known mathematical models of rabbit and human ventricular electrophysiology, when provided with appropriate scaling factors, to reproduce the consensus effects of acute DOX, chronic DOX and acute DOXL exposure on APD, systolic Ca2+ concentration and Ca2+ relaxation time. The consensus values were determined using a novel combination of two different methods. Reassuringly, they generated similar predictions of the drug effect on APD, Ca2+ concentration and Ca2+ relaxation time.
The process of model development identified the need to introduce drug effects on the SR Ca2+ leak to reproduce observed drug induced changes in cellular function, including the increase in K+ permeability following chronic DOX exposure that is consistent with DOX effects on I Kr and also showed that acute DOXL exposure is unlikely to inhibit I NaCa.
Using the models, we quantified the relative contributions of drug effects on each target to the toxic phenotype. Consideration of the scaling factors revealed that the consensus drug effects were different for simulation of acute DOX, compared with chronic DOX and acute DOXL exposure.
Inhibition of I NaCa
The modelling indicates that reports that I NaCa is inhibited by DOXL (Olson et al., 1988) by up to 100% may not be correct (or, at least, relevant to the clinical use of the drug, owing perhaps to the selection of inappropriately high drug concentrations for study, as considered further at the end of the discussion). Unfortunately, it is not possible to analyse this in detail as Boucek et al. (1987a) did not reveal whether the effects of elevated intracellular Na+ that result from DOXL inhibiting the Na+/K+ pump were accounted for. Our simulation of Ca2+ concentration following a caffeine exposure and inhibition of the Na+/K+ pump (Figure 1) suggests the increase in Na+ would inhibit the activity of the Na+/Ca2+ exchanger, and therefore, we cannot assume that in a functioning cell, the effects of DOXL on the Na+/Ca2+ exchanger current would result exclusively from direct effects.
SR leak
The introduction in the modelling of an increase in SR leak due to DOX and DOXL allowed the models to reproduce consensus APD and Ca2+ ‘wet’ values. The estimated increase in SR leak was approximated from qualitative observations (Wang and Korth, 1995; Sag et al., 2011) and is potentially due to an increase in reactive oxygen species production that is known to increase SR leak (Bers, 2014), an effect caused by DOX (Terentyev et al., 2008; Octavia et al., 2012).
The SR leak was fitted to achieve the experimentally observed change in systolic Ca2+ concentration. In the acute DOX studies, systolic Ca2+ was reported to increase and decrease in two different publications. We chose the 50% increase in Ca2+ as the consensus value, because it was recorded at the reference DOX concentration (100 μM). Had we aimed to fit the SR leak to achieve a 40% decrease in systolic Ca2+, the magnitude of SR leak would have needed to be increased even further, indicating that the current estimates of the increase in SR leak flux may be conservative.
The wide range of SR leak predicted by the model may reflect true differences in leak for different drugs under different conditions. The magnitudes, 2–10‐fold, are within the range of reported changes in SR leak or surrogate measures in response to pharmacological agents, disease and in genetic models (~2–6‐fold) (Kohlhaas et al., 2006; Terentyev et al., 2008). At the same time, the SR leak was inferred to maximize the similarity between the model predictions and experimentally observed cellular readouts. This means that all uncertainty and error in the drug effects on all the channels will be accumulated in this fitted parameter. This has the potential to increase the variability in the absolute magnitude of the change in the leak; however, the consistent qualitative finding of increased leak flux supports this model prediction.
Action potential duration
DOX and DOXL are known to affect many channels after acute exposure to DOX (Caroni et al., 1981; Miwa et al., 1986; Boucek et al., 1987a,b; Olson et al., 1988; Qing et al., 1991; Mushlin et al., 1993; Earm et al., 1994; Wang and Korth, 1995; Sag et al., 2011), chronic DOX (Shenasa et al., 1990; Keung et al., 1991; Dodd et al., 1993; Arai et al., 1998; Huang et al., 2003; Olson et al., 2005) and acute DOXL (Boucek et al., 1987a,b; Mushlin et al., 1993; Wang et al., 2001). However, we found that not all effects are important for determining the cardiotoxicity.
The factorial analysis revealed that actions on I Up, I NaK, I Kr and I Leak were responsible for the majority of acute DOXL effects on APD, whereas actions on I Up, I NaK and I Leak resulted in the changes in systolic Ca2+ concentration. In contrast, actions on I CaL and I Kr were identified as the principal determinants of the effects of acute and chronic DOX on APD, with I Leak also affecting the APD in chronic DOX. Actions on I CaL and I Leak were identified as the principal determinants of their effects on systolic Ca2+ concentration in acute and chronic DOX, with I Up and I NaCa also having an effect in acute DOX. This analysis therefore identifies I Kr, I CaL and I Leak as the channels to be targeted for preventive intervention or early detection of DOX cardiotoxicity, with I Up and I NaK also relevant owing to the effects of DOXL.
The importance of effects on several ion currents, specifically I Kr and I CaL, in determining changes in APD is consistent with findings from previous modelling (Mirams et al., 2011) and single cell experimental studies (Kramer et al., 2013).
We showed that DOX‐ and DOXL‐induced increases in α for I Leak were necessary for optimal predictiveness, regardless of the model. In all cases, the increased leak depleted the SR of Ca2+ and lowered the systolic Ca2+ concentration. Additionally, and importantly, it also caused a shortening of the APD (Table 4). This may explain the counterintuitive finding that these I Kr blocking drugs shorten APD (see above). I Leak does not act directly on the transmembrane potential but due to the decrease in SR load and the subsequent decrease in systolic Ca2+ concentration, there will be a decrease in I NaCa flux that in turn shortens the APD (Janvier and Boyett, 1996).
I NaK was found to play a role in the APD effects of acute exposure to DOXL. Inhibition of I NaK causes an increase in intracellular Na+ concentration reducing the electrochemical gradient driving Ca2+ entry via I NaCa, accounting for the positive inotropic effect of I NaK blockade (Altamirano et al., 2006) and the known effects of acute DOXL (Bueno‐Orovio et al., 2014) on Ca2+ and APD (Table 4).
The large changes in α for I Rel (Table 1, column 2) did not account for the acute or chronic DOX effects on APD or systolic Ca2+ concentration. The inability of I Rel to change the Ca2+ concentration is as predicted from other studies (Eisner et al., 2013) and can be explained by the fact that increasing or decreasing IRel will cause a subsequent decrease or increase in SR Ca2+ uptake which in turn functionally antagonizes the effect of changes in IRel on Ca2+ concentration.
Role of effects of DOXL in mediating the effects of chronic DOX exposure
The metabolism of DOX under clinical conditions to produce DOXL means that the heart will be exposed to both compounds, albeit in concentrations that will vary in absolute terms and in terms of concentration ratios, both in the short term (over a day) and in the long term. We have not simulated the dynamic changing exposure of the heart to DOX and DOXL concentrations nor have we attempted to model a specific DOX to DOXL absolute or relative concentration. However, to create a representative simulation of chronic DOX exposure, we combined several measurements (unavoidably derived from different species) exposed to 1 to 9 weeks of DOX. To examine which of the two compounds is likely to exert the dominant effect on any variable, we compared individual effects for in vivo DOX exposure with the individual effects for in vitro DOX and DOXL exposure (Figure 3).
Our modelling study predicts that despite the similarity between chronic DOX and acute DOXL models in terms of changes in APD and systolic Ca2+ concentration (Figure 2), their effects on individual channels appear to be different (Figure 3). This means that DOXL accumulation is unlikely to explain the toxicity of chronic DOX exposure, consistent with the findings of Mushlin et al. (1993). Likewise, the effect of acute DOX and chronic DOX on channels is similar, yet they have different effects on APD and systolic Ca2+ concentration (Figure 3). This finding suggests that studying the effects of acute DOX could be useful for predicting the toxic effect of the chronic exposure to DOX.
Clinical relevance
In order to assess the clinical relevance of the findings, it is useful to consider concentration dependence. However, the pertinent concentration may not be the plasma concentration, owing to possible accumulation of drug inside cells and other factors.
The range of acute DOX IC50/EC50 values for channel effects derived from cellular preparations from the literature were between 29 and 7251 μM (Table 1, column 4), while the IC50 values derived for DOX for I Ks in an expression system were ~5 μM, and the equivalent derived values for effects on APD, systolic Ca2+ concentration and Ca2+ relaxation time were 92 to 233 μM [Table 2, column 3, with one published value (Sag et al., 2011) excluded as explained]. Similarly, estimates of DOXL IC50 and EC50 values were 8–240 μM for channel effects and 30–92 μM for effects on APD, systolic Ca2+ concentration and Ca2+ relaxation time (Table 1, column 4 and Table 2, column 3, respectively).
The DOX peak plasma concentrations in the clinical setting are reported as 1–10 μM (Cummings and Smyth, 1988; Gianni et al., 1997; Barpe et al., 2010), and the equivalent value for DOXL is 0.2 μM (Cummings and Smyth, 1988). With the exception of reported I Ks inhibition (Ducroq et al., 2010), these plasma levels are somewhat lower than those required to obtain channel effects and actions on APD, Ca2+ concentration and Ca2+ relaxation time, according to the experimental pharmacology papers. One explanation for this mismatch is that the acute cardiac toxicity associated with DOX in vivo may not be attributable to the acute ion channel effects. Alternatively, intracellular drug accumulation may be the primary determinant of the cardiotoxicity, as suggested previously (Olson et al., 1974), meaning that plasma concentration may not be indicative of the active concentration. A third explanation is the possible existence of an unknown DOX metabolite that accounts for the toxicity. Finally, the low IC50 value reported for I Ks (compared with reported IC50 values for other targets) raises the possibility that I Ks block is the primary contributor to acute DOX toxicity. In the Supporting Information, we provide reference simulations of I Kr inhibition alone or I Ks inhibition alone in the human and rabbit models. For a 50% inhibition of I Ks, (occurring at a clinically relevant drug concentration), the rabbit model shows negligible effects (all changes <3%). In contrast, the human model shows a much larger response (changes range from 5 to 28%). It would appear from these findings that the role of I Ks in mediating some of the cardiotoxicity of DOX may have been underestimated, and our recommendation would be that this be given more consideration in future analyses.
We should note that plasma concentrations after a single dose do not give insight into the concentration dependence of chronic toxicity.
In summary, the present findings illustrate that the majority of published data on DOX and DOXL IC50/EC50 values for individual channels and none of the cellular function IC50/EC50 values directly relate to macro‐cardiac toxicity, in terms of concentration dependence. This is not likely to be resolved until an exact matching data set of in vivo and channel actions is available, one in which exposure times are identical, and free drug concentrations and cell accumulation over time are better characterized. Nevertheless, the models provide a novel tool for linking channel effects to cellular phenotypes, despite the limitations inherent to the data. This study is therefore a first step towards linking channel effects to multi‐scale emergent cellular phenotypes.
Limitations and future directions
A novel combination of two proposed data integration methodologies was proposed to provide a rational framework for data integration. In the current version, we treat each experimental read out as independent and ignore the variability of measurements. Specifically, we have not made any assumptions about whether two or more observations derive from a single protocol or separate protocols, and we do not place more weight on measurements that are less variable. This is exemplified by the acute effects of DOX on I CaL where Wang and Korth (1995) report a mean 21% increase in I CaL. However, when the mean changes were interpreted in the context of the variation in the experimental measurements, they were reported to not be statistically significant (Wang and Korth, 1995). Further, while reporting no significant change in I CaL (Wang and Korth, 1995), these investigators reported a significant increase in peak Ca2+ concertation and APD. Hence, while we include the values from this study, our approach does not necessarily generate conclusions that are consistent with Wang and Korth's experimental results.
Data from across all species were used to inform the model. The majority of data are available from rabbit preparations, although key measurements are not recorded in rabbit. Specifically, none of the cellular readouts were recorded in rabbit for acute DOX or DOXL, and the effect of chronic DOX on ICaL was not recorded in rabbit, despite being identified as an important contributor to chronic DOX effects on APD. This means that there was not a complete species specific data set for any of the drug conditions we studied, and so, we have assumed that species differences were small.
The effects of acute DOX on K+ currents and the consequences in terms of APD alterations are contentious issues. The outcomes of modelling are reasonably consistent and predict that acute DOX will cause APD prolongation, regardless of whether inhibition of I Kr or I Ks is the predominant effect of DOX on K+ currents. The findings from studies that measure K+ currents are however somewhat inconsistent and contradictory. Thus, Wang and Korth (1995) reported that acute DOX causes inhibition of I Kr, whereas Ducroq et al. (2010) reported that acute DOX inhibits I Ks and not I Kr. In neither study was it possible to infer whether APD effects were the result in whole or part from block of either current. When the effect of acute DOX toxicity on K+ currents was modelled using the Ducroq et al IC50 values for I Kr and I Ks (or the IC50 value for I Ks alone), there was a pronounced increase in APD, an effect more consistent with the consensus reported changes in APD compared with when no effect of DOX on I Ks was included in the modelling. Unfortunately, the effect of I Ks inhibition on APD in the absence of I Kr inhibition is unclear, with no effect found in human (Jost et al., 2005) or rabbit (Lengyel et al., 2001) ventricular myocytes yet; in contrast, APD prolongation was found in human and rabbit ventricular myocytes by other investigators (Bosch et al., 1998; Lu et al., 2001). Separately, the simulated effect of I Ks inhibition varies from one human cardiac myocyte cell model to the next (Mirams et al., 2014) with the 10 Tusscher model used in the present study exhibiting a far greater APD sensitivity to I Ks inhibition than other models. These confounding factors mean that it is not possible to conclude if DOX predominantly affects I Ks or I Kr from simulation results alone. Nevertheless, and importantly, varying the specific effect of acute DOX on K+ currents did not qualitatively alter our prediction that acute DOX increases SR leak. Regardless of the simulated effect of acute DOX on K+ currents (inhibiting I Ks only or inhibiting both I Ks and I Kr), for both human and rabbit models the simulated results were closer to experimental measurements if SR leak was increased (see Supporting Information).
We have made use of only two cardiac myocyte models (rabbit and human) for interpreting our results. Others have proposed using species‐dependent methods for interpreting preclinical data in species‐specific models (O'Hara and Rudy, 2011). However, insufficient data were available for any of the compounds we studied to attempt this level of specificity.
We have assumed that the Hill coefficient is equal to 1 for all targets for both drugs. There are limited measurements of the Hill coefficient, and cooperative inhibition is a possibility. However, Boucek et al. (1987b) did find that the slopes of their Dixon plots for doxorubicin inhibition of I NaK and I Up, were consistent with a Hill coefficient of 1.
Finally, we have simulated cellular phenotypes as surrogates for measures of organ scale function. Simulating full heart electro‐mechanics and pseudo‐ECGs may provide further insight into the link between changes in cellular function and clinical readouts.
In conclusion, we have presented the first model to capture the effects of DOX on cardiac electrophysiology and Ca2+ handling in the human and the rabbit incorporating acute and chronic effects as well as effects of the DOX metabolite DOXL. The human and rabbit models reproduce qualitative changes in APD and Ca2+ concentration morphology. For future reference, our simulations predict three important actions of DOX that require confirmation by pharmacological experimentation. These are (i) the apparent importance of an hitherto overlooked increase in SR Ca2+ leak flux, (ii) the apparent unimportance of acute DOXL effects on I NaCa and (iii) the inference that the increased K+ permeability caused by chronic DOX exposure results from an increase in I Kr.
The factorial analysis shows that a limited number of changes to specific channels may explain the majority of drug effects on cellular function and that changes in Ca2+ dynamics are caused by DOX and DOXL acting directly on Ca2+ handling and are not a secondary effect caused by changes in AP.
The current modelling approach provides a means of testing the relevance of single target effects in determining the cardiotoxic phenotype and, in the case of DOX, emerging information on time courses of effects and drug accumulation in cells can be incorporated to provide refinement and greater insight.
Author contributions
M.F. performed the experiments, S.A.N. and M.J.C. designed the study and experiments and all three wrote the manuscript.
Conflicts of interest
The authors declare no conflicts of interest.
Declaration of transparency and scientific rigour
This Declaration acknowledges that this paper adheres to the principles for transparent reporting and scientific rigour of preclinical research recommended by funding agencies, publishers and other organisations engaged with supporting research.
Supporting information
Table S1 References cellular read outs for human cardiac myocyte model for differing heart rates.
Table S2 Acute DOX Cellular Phenotypes for human model for differing heart rates.
Table S3 Chronic DOX Cellular Phenotypes for human model for differing heart rates.
Table S4 Acute DOXL Cellular Phenotypes for human model for differing heart rates.
Table S5 Acute 100 μM DOX Cellular Phenotypes for human model for differing heart rates.
Table S6 Acute 10 μM DOXL Cellular Phenotypes for human model for differing heart rates.
Table S7 References cellular read outs for rabbit cardiac myocyte model for differing heart rates.
Table S8 Acute DOX Cellular Phenotypes for rabbit model for differing heart rates.
Table S9 Chronic DOX Cellular Phenotypes for rabbit model for differing heart rates.
Table S10 Acute DOXL Cellular Phenotypes for rabbit model for differing heart rates.
Table S11 Acute 100 μM DOX Cellular Phenotypes for rabbit model for differing heart rates.
Table S12 Acute 10 μM DOXL Cellular Phenotypes for human model for differing heart rates.
Table S13 Effect of either I Kr or I ks inhibition in human cell model on APD and calcium transient.
Table S14 Effect of either I Kr or I ks inhibition in rabbit cell model on APD and calcium transient.
Table S15 Predicted SR leak in the rabbit and human acute DOX 100 μM exposure model for different postulated models of acute DOX on K+ channels. Consensus values wer a 50% increase in APD, 50% increase in systolic Ca2+ and a 30% increase in Ca2+ RT. Where IK = X% corresponds to an X% change in the conductivity of the corresponding K+ channel.
Acknowledgements
This study was supported by the Daphne Jackson Trust and the Royal Academy of Engineering and King's College London. The research leading to these results has received funding from the European Community's Seventh Framework Programme (FP7/2007‐2013) under grant agreement number 602156‐HeCaToS. The research was supported by the National Institute for Health Research Biomedical Research Centre, the Wellcome EPSRC Centre for Medical Engineering (WT 203148/Z/16/Z) and the British Heart Foundation award (RE/08/003) at King's College London.
Fernandez‐Chas, M. , Curtis, M. J. , and Niederer, S. A. (2018) Mechanism of doxorubicin cardiotoxicity evaluated by integrating multiple molecular effects into a biophysical model. British Journal of Pharmacology, 175: 763–781. doi: 10.1111/bph.14104.
References
- Alexander SPH, Kelly E, Marrion NV, Peters JA, Faccenda E, Harding SD et al (2017a). The Concise Guide to PHARMACOLOGY 2017/18: Transporters. Br J Pharmacol 174: S360–S446. [DOI] [PMC free article] [PubMed] [Google Scholar]
- Alexander SPH, Striessnig J, Kelly E, Marrion NV, Peters JA, Faccenda E et al (2017b). The Concise Guide to PHARMACOLOGY 2017/18: Voltage‐gated ion channels. Br J Pharmacol 174: S160–S194. [DOI] [PMC free article] [PubMed] [Google Scholar]
- Alexander SPH, Fabbro D, Kelly E, Marrion NV, Peters JA, Faccenda E et al (2017c). The Concise Guide to PHARMACOLOGY 2017/18: Enzymes. Br J Pharmacol 174: S272–S359. [DOI] [PMC free article] [PubMed] [Google Scholar]
- Altamirano J, Li Y, DeSantiago J, Piacentino V, Houser SR, Bers DM (2006). The inotropic effect of cardioactive glycosides in ventricular myocytes requires Na+−Ca2+exchanger function. J Physiol 575: 845–854. [DOI] [PMC free article] [PubMed] [Google Scholar]
- Arai M, Tomaru K, Takizawa T, Sekiguchi K, Yokoyama T, Suzuki T et al (1998). Sarcoplasmic reticulum genes are selectively down‐regulated in cardiomyopathy produced by doxorubicin in rabbits. J Mol Cell Cardiol 30: 243–254. [DOI] [PubMed] [Google Scholar]
- Barpe DR, Rosa DD, Froehlich PE (2010). Pharmacokinetic evaluation of doxorubicin plasma levels in normal and overweight patients with breast cancer and simulation of dose adjustment by different indexes of body mass. Eur J Pharm Sci 41: 458–463. [DOI] [PubMed] [Google Scholar]
- Bers DM (2000). Calcium fluxes involved in control of cardiac myocyte contraction. Circ Res 87: 275–281. [DOI] [PubMed] [Google Scholar]
- Bers DM (2014). Cardiac sarcoplasmic reticulum calcium leak: basis and roles in cardiac dysfunction. Annu Rev Physiol 76: 107–127. [DOI] [PubMed] [Google Scholar]
- Boucek RJ, Kunkel EM, Graham TP, Brenner D, Olson RD (1987a). Doxorubicinol, the metabolite of doxorubicin, is more cardiotoxic than doxorubicin. Pediatr Res 21: 187A–187A. [Google Scholar]
- Boucek RJ, Olson RD, Brenner DE, Ogunbunmi EM, Inui M, Fleischer S (1987b). The major metabolite of doxorubicin is a potent inhibitor of membrane‐associated ion pumps. A correlative study of cardiac muscle with isolated membrane fractions. J Biol Chem 262: 15851–15856. [PubMed] [Google Scholar]
- Bosch RF, Gaspo R, Busch AE, Lang HJ, Li GR, Nattel S (1998). Effects of the chromanol 293B, a selective blocker of the slow, component of the delayed rectifier K+ current, on repolarization in human and guinea pig ventricular myocytes. Cardiovasc Res 38: 441–450. [DOI] [PubMed] [Google Scholar]
- Bueno‐Orovio A, Sánchez C, Pueyo E, Rodriguez B (2014). Na/K pump regulation of cardiac repolarization: insights from a systems biology approach. Pflugers Arch ‐ Eur J Physiol 466: 183–193. [DOI] [PubMed] [Google Scholar]
- Caroni P, Villani F, Carafoli E (1981). The cardiotoxic antibiotic doxorubicin inhibits the Na+/Ca2+ exchange of dog heart sarcolemmal vesicles. FEBS Lett 130: 184–186. [DOI] [PubMed] [Google Scholar]
- Cummings J, Smyth JF (1988). Pharmacology of adriamycin: the message to the clinician. Eur J Cancer Clin Oncol 24: 579–582. [DOI] [PubMed] [Google Scholar]
- Davies KJ, Doroshow JH (1986). Redox cycling of anthracyclines by cardiac mitochondria. I. Anthracycline radical formation by NADH dehydrogenase. J Biol Chem 261: 3060–3067. [PubMed] [Google Scholar]
- De Angelis A, Piegari E, Cappetta D, Marino L, Filippelli A, Berrino L et al (2010). Anthracycline cardiomyopathy is mediated by depletion of the cardiac stem cell pool and is rescued by restoration of progenitor cell function. Circulation 121: 276–292. [DOI] [PMC free article] [PubMed] [Google Scholar]
- De Beer EL, Bottone AE, Voest EE (2001). Doxorubicin and mechanical performance of cardiac trabeculae after acute and chronic treatment: a review. Eur J Pharmacol 415: 1–11. [DOI] [PubMed] [Google Scholar]
- Del Tacca M, Danesi R, Ducci M, Bernardini C, Romanini A (1985). Might adriamycinol contribute to adriamycin‐induced cardiotoxicity? Pharmacol Res Commun 17: 1073–1084. [DOI] [PubMed] [Google Scholar]
- Dodd DA, Atkinson JB, Olson RD, Buck S, Cusack BJ, Fleischer S et al (1993). Doxorubicin cardiomyopathy is associated with a decrease in calcium release channel of the sarcoplasmic reticulum in a chronic rabbit model. J Clin Investig 91: 1697–1705. [DOI] [PMC free article] [PubMed] [Google Scholar]
- Doherty JD, Cobbe SM (1990). Electrophysiological changes in animal model of chronic cardiac failure. Cardiovasc Res 24: 309–316. [DOI] [PubMed] [Google Scholar]
- Dresdale A, Bonow RO, Wesley R, Palmeri ST, Barr L, Mathison D et al (1983). Prospective evaluation of doxorubicin‐induced cardiomyopathy resulting from postsurgical adjuvant treatment of patients with soft tissue sarcomas. Cancer 52: 51–60. [DOI] [PubMed] [Google Scholar]
- Ducroq J, Moha ou Maati H, Guilbot S, Dilly S, Laemmel E, Pons‐Himbert C et al (2010). Dexrazoxane protects the heart from acute doxorubicin‐induced QT prolongation: a key role for I(Ks). Br J Pharmacol 159: 93–101. [DOI] [PMC free article] [PubMed] [Google Scholar]
- Earm YE, Ho W‐K, So I (1994). Effects of adriamycin on ionic currents in single cardiac myocytes of the rabbit. J Mol Cell Cardiol 26: 163–172. [DOI] [PubMed] [Google Scholar]
- Eisner D, Bode E, Venetucci L, Trafford A (2013). Calcium flux balance in the heart. J Mol Cell Cardiol 58: 110–117. [DOI] [PubMed] [Google Scholar]
- Fink M, Niederer SA, Cherry EM, Fenton FH, Koivumäki JT, Seemann G et al (2011). Cardiac cell modelling: observations from the heart of the cardiac physiome project. Prog Biophys Mol Biol 104: 2–21. [DOI] [PubMed] [Google Scholar]
- Garny A, Kohl P, Noble D (2003). Cellular open resource (COR): a public CellML based environment for modeling biological function. Int J Bifurc Chaos 13: 3579–3590. [Google Scholar]
- Gianni L, Viganò L, Locatelli A, Capri G, Giani A, Tarenzi E et al (1997). Human pharmacokinetic characterization and in vitro study of the interaction between doxorubicin and paclitaxel in patients with breast cancer. J Clin Oncol 15: 1906–1915. [DOI] [PubMed] [Google Scholar]
- Huang X‐M, Zhu W‐H, Kang M‐L (2003). Study on the effect of doxorubicin on expressions of genes encoding myocardial sarcoplasmic reticulum Ca2+ transport proteins and the effect of taurine on myocardial protection in rabbits. J Zhejiang Univ Sci 4: 114–120. [DOI] [PubMed] [Google Scholar]
- Janvier NC, Boyett MR (1996). The role of Na–Ca exchange current in the cardiac action potential. Cardiovasc Res 32: 69–84. [PubMed] [Google Scholar]
- Jensen RA (1986). Dororubicin cardiotoxicity: contractile changes after long‐term treatment in rat. J Pharmacol Exp Ther 236: 197–203. [PubMed] [Google Scholar]
- Jost N, Virág L, Bitay M, Takács J, Lengyel C, Biliczki P et al (2005). Restricting Excessive Cardiac Action Potential and QT Prolongation. A Vital Role for I_Ks in Human Ventricular Muscle 112: 1392–1399. [DOI] [PubMed] [Google Scholar]
- Kapelko VI, Williams CP, Gutstein DE, Morgan JP (1996). Abnormal myocardial calcium handling in the early stage of adriamycin cardiomyopathy. Arch Physiol Biochem 104: 185–191. [DOI] [PubMed] [Google Scholar]
- Keung EC, Toll L, Ellis M, Jensen RA (1991). L‐type cardiac calcium channels in doxorubicin cardiomyopathy in rats morphological, biochemical, and functional correlations. J Clin Investig 87: 2108–2113. [DOI] [PMC free article] [PubMed] [Google Scholar]
- Kohlhaas M, Zhang T, Seidler T, Zibrova D, Dybkova N, Steen A et al (2006). Increased sarcoplasmic reticulum calcium leak but unaltered contractility by acute CaMKII overexpression in isolated rabbit cardiac myocytes. Circ Res 98: 235–244. [DOI] [PubMed] [Google Scholar]
- Kramer J, Obejero‐Paz CA, Myatt G, Kuryshev YA, Bruening‐Wright A, Verducci JS et al (2013). MICE models: superior to the HERG model in predicting Torsade de Pointes. Sci Rep 3. [DOI] [PMC free article] [PubMed] [Google Scholar]
- Lefrak EA, Piťha J, Rosenheim S, Gottlieb JA (1973). A clinicopathologic analysis of adriamycin cardiotoxicity. Cancer 32: 302–314. [DOI] [PubMed] [Google Scholar]
- Lengyel C, Iost N, Virág L, Varró A, Lathrop DA, Papp JG (2001). Pharmacological block of the slow component of the outward delayed rectifier current (IKs) fails to lengthen rabbit ventricular muscle QTc and action potential duration. Br J Pharmacol 132: 101–110. [DOI] [PMC free article] [PubMed] [Google Scholar]
- Lu Z, Kamiya K, Opthof T, Yasui K, Kodama I (2001). Density and Kinetics of I Kr and I Ks in Guinea Pig and Rabbit Ventricular Myocytes Explain Different Efficacy of I Ks Blockade at High Heart Rate in Guinea Pig and Rabbit. Implications for Arrhythmogenesis in Humans 104: 951–956. [DOI] [PubMed] [Google Scholar]
- Marcillat O, Zhang Y, Davies KJA (1989). Oxidative and non‐oxidative mechanisms in the inactivation of cardiac mitochondrial electron transport chain components by doxorubicin. Biochem J 259: 181–189. [DOI] [PMC free article] [PubMed] [Google Scholar]
- Milberg P, Fleischer D, Stypmann J, Osada N, Mönnig G, Engelen MA et al (2007). Reduced repolarisation reserve due to anthracycline therapy facilitates torsade de pointes induded by Ikr blockers. Basic Res Cardiol 102: 42–51. [DOI] [PubMed] [Google Scholar]
- Mirams GR, Cui Y, Sher A, Fink M, Cooper J, Heath BM et al (2011). Simulation of multiple ion channel block provides improved early prediction of compounds' clinical torsadogenic risk. Cardiovasc Res 91: 53–61. [DOI] [PMC free article] [PubMed] [Google Scholar]
- Mirams GR, Davies MR, Brough SJ, Bridgland‐Taylor MH, Cui Y, Gavaghan DJ et al (2014). Prediction of Thorough QT study results using action potential simulations based on ion channel screens. J Pharmacol Toxicol Methods 70: 246–254. [DOI] [PMC free article] [PubMed] [Google Scholar]
- Miwa N, Kanaide H, Meno H, Nakamura M (1986). Adriamycin and altered membrane functions in rat hearts. Br J Exp Pathol 67: 747–755. [PMC free article] [PubMed] [Google Scholar]
- Montaigne D, Marechal X, Preau S, Baccouch R, Modine T, Fayad G et al (2011). Doxorubicin induces mitochondrial permeability transition and contractile dysfunction in the human myocardium. Mitochondrion 11: 22–26. [DOI] [PubMed] [Google Scholar]
- Morotti S, Grandi E, Summa A, Ginsburg KS, Bers DM (2012). Theoretical study of L‐type Ca2+ current inactivation kinetics during action potential repolarization and early afterdepolarizations. J Physiol 590: 4465–4481. [DOI] [PMC free article] [PubMed] [Google Scholar]
- Mushlin PS, Cusack BJ, Boucek RJ, Andrejuk T, Li X, Olson RD (1993). Time‐related increases in cardiac concentrations of doxorubicinol could interact with doxorubicin to depress myocardial contractile function. Br J Pharmacol 110: 975–982. [DOI] [PMC free article] [PubMed] [Google Scholar]
- Octavia Y, Tocchetti CG, Gabrielson KL, Janssens S, Crijns HJ, Moens AL (2012). Doxorubicin‐induced cardiomyopathy: from molecular mechanisms to therapeutic strategies. J Mol Cell Cardiol 52: 1213–1225. [DOI] [PubMed] [Google Scholar]
- O'Hara T, Rudy Y (2011). Quantitative comparison of cardiac ventricular myocyte electrophysiology and response to drugs in human and non‐human species. Am J Physiol Heart Circ Physiol . [DOI] [PMC free article] [PubMed] [Google Scholar]
- Olson HM, Young DM, Prieur DJ, LeRoy AF, Reagan RL (1974). Electrolyte and morphologic alterations of myocardium in adriamycin‐treated rabbits. Am J Pathol 77: 439–454. [PMC free article] [PubMed] [Google Scholar]
- Olson RD, Gambliel HA, Vestal RE, Shadle SE, Charlier JHA, Cusack BJ (2005). Doxorubicin cardiac dysfunction: effects on calcium regulatory proteins, sarcoplasmic reticulum, and triiiodothyronine. Cardiovasc Toxicol 5: 269–283. [DOI] [PubMed] [Google Scholar]
- Olson RD, Mushlin PS (1990). Doxorubicin cardiotoxicity: analysis of prevailing hypotheses. FASEB J 4: 3076–3086. [PubMed] [Google Scholar]
- Olson RD, Mushlin PS, Brenner DE, Fleischer S, Cusack BJ, Chang BK et al (1988). Doxorubicin cardiotoxicity may be caused by its metabolite, doxorubicinol. Proc Natl Acad Sci 85: 3585–3589. [DOI] [PMC free article] [PubMed] [Google Scholar]
- Qing T, Katz AM, Kim DH (1991). Effects of azumolene on doxorubicin‐induced Ca2+ release from skeletal and cardiac muscle sarcoplasmic reticulum. Biochim Biophys Acta 1094: 27–34. [DOI] [PubMed] [Google Scholar]
- Rees S, Curtis MJ (1996). Which cardiac potassium channel subtype is the preferable target for suppression of ventricular arrhythmias? Pharmacol Ther 69: 199–217. [DOI] [PubMed] [Google Scholar]
- Sag CM, Köhler AC, Anderson ME, Backs J, Maier LS (2011). CaMKII‐dependent SR Ca leak contributes to doxorubicin‐induced impaired Ca handling in isolated cardiac myocytes. J Mol Cell Cardiol 51: 749–759. [DOI] [PMC free article] [PubMed] [Google Scholar]
- Sanguinetti MC, Jurkiewicz NK (1990). Two components of cardiac delayed rectifier K+ current. Differential sensitivity to block by class III antiarrhythmic agents. J Gen Physiol 96: 195–215. [DOI] [PMC free article] [PubMed] [Google Scholar]
- Serrano J, Palmeira CM, Kuehl DW, Wallace KB (1999). Cardioselective and cumulative oxidation of mitochondrial DNA following subchronic doxorubicin administration1. Biochim Biophys Acta Bioenerg 1411: 201–205. [DOI] [PubMed] [Google Scholar]
- Shenasa H, Calderone A, Vermeulen M, Paradis P, Stephens H, Cardinal R et al (1990). Chronic doxorubicin induced cardiomyopathy in rabbits: mechanical, intracellular action potential, and adrenergic characteristics of the failing myocardium. Cardiovasc Res 24: 591–604. [DOI] [PubMed] [Google Scholar]
- Singal PK, Deally CMR, Weinberg LE (1987). Subcellular effects of adryamicin in the heart: a concise review. J Mol Cell Cardiol 19: 817–828. [DOI] [PubMed] [Google Scholar]
- Southan C, Sharman JL, Benson HE, Faccenda E, Pawson AJ, Alexander SPH et al (2016). The IUPHAR/BPS Guide to PHARMACOLOGY in 2016: towards curated quantitative interactions between 1300 protein targets and 6000 ligands. Nucl Acids Res 44: D1054–D1068. [DOI] [PMC free article] [PubMed] [Google Scholar]
- Suzuki T, Minamide S, Iwasaki T, Yamamoto H, Kanda H (1997). Cardiotoxicity of a new anthracycline derivative (SM‐5887) following intravenous administration to rabbits: comparative study with doxorubicin. Invest New Drugs 15: 219–225. [DOI] [PubMed] [Google Scholar]
- Szenczi O, Kemecsei P, Holthuijsen MFJ, van Riel NAW, van der Vusse GJ, Pacher P et al (2005). Poly(ADP‐ribose) polymerase regulates myocardial calcium handling in doxorubicin‐induced heart failure. Biochem Pharmacol 69: 725–732. [DOI] [PMC free article] [PubMed] [Google Scholar]
- Takemura G, Fujiwara H (2007). Doxorubicin‐induced cardiomyopathy: from the cardiotoxic mechanisms to management. Prog Cardiovasc Dis 49: 330–352. [DOI] [PubMed] [Google Scholar]
- Terentyev D, Gyorke I, Belevych AE, Terentyeva R, Sridhar A, Nishijima Y et al (2008). Redox modification of ryanodine receptors contributes to sarcoplasmic reticulum Ca2+ leak in chronic heart failure. Circ Res 103: 1466–1472. [DOI] [PMC free article] [PubMed] [Google Scholar]
- ten Tusscher KH, Panfilov AV (2006). Alternans and spiral breakup in a human ventricular tissue model. Am J Physiol Heart Circ Physiol 291: H1088–H1100. [DOI] [PubMed] [Google Scholar]
- Wang G‐X, Wang Y‐X, Zhou X‐B, Korth M (2001). Effects of doxorubicinol on excitation–contraction coupling in guinea pig ventricular myocytes. Eur J Pharmacol 423: 99–107. [DOI] [PubMed] [Google Scholar]
- Wang YX, Korth M (1995). Effects of doxorubicin on excitation‐contraction coupling in guinea pig ventricular myocardium. Circ Res 76: 645–653. [DOI] [PubMed] [Google Scholar]
- Yeh ETH, Tong AT, Lenihan DJ, Yusuf SW, Swafford J, Champion C et al (2004). Cardiovascular complications of cancer therapy: diagnosis, pathogenesis, and management. Circulation 109: 3122–3131. [DOI] [PubMed] [Google Scholar]
Associated Data
This section collects any data citations, data availability statements, or supplementary materials included in this article.
Supplementary Materials
Table S1 References cellular read outs for human cardiac myocyte model for differing heart rates.
Table S2 Acute DOX Cellular Phenotypes for human model for differing heart rates.
Table S3 Chronic DOX Cellular Phenotypes for human model for differing heart rates.
Table S4 Acute DOXL Cellular Phenotypes for human model for differing heart rates.
Table S5 Acute 100 μM DOX Cellular Phenotypes for human model for differing heart rates.
Table S6 Acute 10 μM DOXL Cellular Phenotypes for human model for differing heart rates.
Table S7 References cellular read outs for rabbit cardiac myocyte model for differing heart rates.
Table S8 Acute DOX Cellular Phenotypes for rabbit model for differing heart rates.
Table S9 Chronic DOX Cellular Phenotypes for rabbit model for differing heart rates.
Table S10 Acute DOXL Cellular Phenotypes for rabbit model for differing heart rates.
Table S11 Acute 100 μM DOX Cellular Phenotypes for rabbit model for differing heart rates.
Table S12 Acute 10 μM DOXL Cellular Phenotypes for human model for differing heart rates.
Table S13 Effect of either I Kr or I ks inhibition in human cell model on APD and calcium transient.
Table S14 Effect of either I Kr or I ks inhibition in rabbit cell model on APD and calcium transient.
Table S15 Predicted SR leak in the rabbit and human acute DOX 100 μM exposure model for different postulated models of acute DOX on K+ channels. Consensus values wer a 50% increase in APD, 50% increase in systolic Ca2+ and a 30% increase in Ca2+ RT. Where IK = X% corresponds to an X% change in the conductivity of the corresponding K+ channel.