Abstract
Programmed cell death ligand 1 (PD-L1) is a major immune checkpoint protein that mediates antitumor immune suppression and response. Preliminary data suggest that its detection using immunohistochemistry (IHC) in formalin-fixed and paraffin-embedded tissues may predict clinical response to PD-1/PD-L1 therapy. In diagnostic pathology, it is essential to count with a validated IHC that can reliably detect PD-L1-positive cases. The present study was conducted to compare and validate different PD-L1 commercial clones and identify which ones can be reliably used by surgical pathologist to detect PD-L1 expression in human cancer tissues. Eight commercial available PD-L1 clones were tested and compared with a noncommercial PD-L1 antibody clone 5H1. Western blot and IHC using cell lines and human tissues were used to validate these clones. From all PD-L1 antibodies, only the clones E1L3N, E1J2J, SP142, 28-8, 22C3, and SP263 passed the Western blot and IHC validation, providing similar pattern than the clone 5H1 and then they were tested in 259 non–small cell lung cancer cases placed in 9 tissue microarrays. Among all cases, only those with ≥2 cores were included (185 cases). Positive and significant correlation was found between the median PD-L1 H-score in tumor and stroma compartments, for all selected antibodies. Overall, 56 of 185 cases were detected as positive cases in malignant cells expressing membranous PD-L1 by all the clones. However, the clone SP263 identified more PD-L1-positive cases compared with the other clones. Our results show that clones E1L3N, E1J2J, SP142, 28-8, 22C3, and SP263 provide positive membrane staining pattern comparable with clone 5H1. These commercial clones are comparable, but a careful evaluation by the pathologist is necessary to minimize error of positive misinterpretations.
Key Words: PD-L1, immunohistochemistry, Western blot, TMA lung cancer
Programmed cell death ligand 1 (PD-L1, also known as CD274 and B7-H1) is a major immune checkpoint protein that mediates antitumor immune suppression and response.1 Indeed, the importance of PD-L1-based immune suppression is highlighted by the advent of antiprogramed death 1 (PD-1)/PD-L1 immunotherapies that have moved to the forefront of cancer treatment.2,3 PD-L1 is an immunomodulatory transmembrane glycoprotein of ∼43 kDa (290 amino acids). The protein’s structure includes a short cytoplasmic domain, a membrane domain, and an extracellular domain.4,5 PD-L1 is a member of the B7 family of costimulatory molecules6 and his gene is mapped in chromosome 9p24.2.7
Expression of PD-L1 was observed in macrophages from normal tissues, and could be upregulated in a large variety of cell types, such as antigen-presenting cells, B cells, T cells, epithelial cells, muscle cells, endothelial cells, and various malignant cells (MCs) lines.8 PD-L1 is differentially expressed across gestation by the trophoblast to induce fetal-maternal tolerance.9 Some studies also showed that PD-L1 is constitutively expressed on endothelial corneal cells protecting the eye from activated T cells10,11 to maintain the immune tolerance status.12
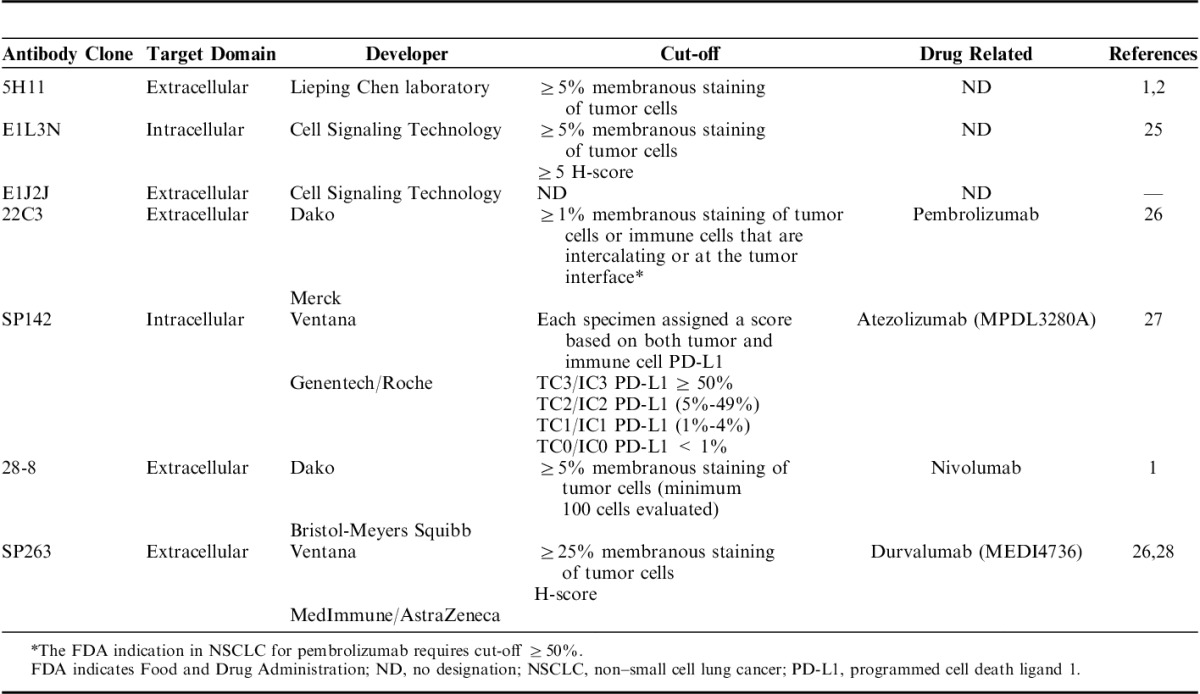
The physiological role of PD-L1 is to bind PD-1 receptor expressed on the surface of activated cytotoxic T cells.8 This binding causes inhibition of interleukin-2 production and T-cell activation via reduction of the phosphorylation of ζ-chain-associated protein kinase 70 and protein kinase C θ.13 PD-L1 expression has been observed and evaluated in MCs from several tumor types including, among others, melanoma, breast, colorectal, lung, and pancreatic cancers.14–19 The recent development of new agents blocking the interaction between PD-L1 and his receptor, PD-1, has opened a new therapeutic strategy.3 In routine practice, immunohistochemistry (IHC) analysis of PD-L1 expression using routinely processed histologic sections is essential to judge the eligibility of a patient for PD-1/PD-L1immunotherapies and quantitative detection of its expression could be useful for monitoring the treatment responses. Furthermore, preliminary studies showed PD-L1 expression on human cancers using IHC in formalin-fixed and paraffin-embedded (FFPE) tissue samples may predict clinical response to PD-1/PD-L1 therapy.1,17,20–22 For this reason, in diagnostic pathology it is essential to count with a validated IHC23 that can reliably detect the real PD-L1-positive cases. Unfortunately, there are many PD-L1 commercial clones as well as different type of specimens used [whole histologic sections vs. tissue microarrays (TMAs)], type of protein expression analysis (IHC vs. immunofluorescence), and quantification assessment (image analysis vs. microscopic observation), which can provide different results, particularly important in clinical use,24 (Table 1).
TABLE 1.
Companion PD-L1 Assays Using to Detect PD-L1 Expression in NSCLC
An appropriate validation and evaluation of PD-L1 expression on tissues is important, because PD-L1 is currently regarded as a molecular target for immunotherapy on various malignant tumors. The present study was conducted to compare and validate the available commercial PD-L1 clones and identify which ones can be reliably used by the surgical pathologist to evaluate the IHC PD-L1 expression on FFPE specimens, using lung cancer as a model.
MATERIALS AND METHODS
Western Blot (WB) Validation of PD-L1 Antibodies
For WB analysis, a human tonsil lysate tissue; 6 human’s lung MCs lines (H23, H157, H461, H4006, H1171, H193); a human embryonic kidney 293 (HEK293) cell line nontransfected and transfected with PD-L1 gene were used to validate the different PD-L1 commercial and noncommercial antibodies. In total, 2 μg of protein from different lysates cell lines were extracted and subjected to 4% to 12% NuPAGE Novex Bis-Tris polyacrylamide gel and transferred to a nitrocellulose membrane according to the manufacturer’s protocols (Invitrogen, Carlsbad, CA). The membranes were blocked with Tris Buffered Saline with Tween (TBST) (50 mM Tris, pH 7.5; 150 mM NaCl, 0.05% Tween-20) containing 5% nonfat dry milk for 1 hour, washed, and subsequently incubated overnight at 4°C in Tris Buffered Saline with Tween with 5% bovine serum albumin containing the following PD-L1 clones: EPR1161-2 (dilution 1:2000; Epitomics-Abcam, Burlingame, CA, cat#ab174838); E1L3N (dilution 1:2000; Cell Signaling Technology, Beverly, MA, cat#13684); clone E1J2J (dilution 1:2000; Cell Signaling Technology, cat#15165), 7G11 (dilution 1:2000; Gordon Freeman Laboratory, Boston University, Boston, MA), SP142 (dilution 1:2000; Spring Bioscience, Pleasanton, CA, cat#M4424), PD-L1 rabbit polyclonal (dilution 1:2000; Abcam, cat#ab58810), 28-8 (dilution 1:2000; Abcam, Cambridge, MA, cat#ab205921), SP263 (dilution 1:500; Ventana Medical System Inc., Tucson, AZ, cat#790-4905), 1H5 (dilution1:1000; Lieping Chen Laboratory, Yale University, New Haven, CT), and β actin (dilution 1:2000; Chemicon International, Temecula, CA). Regarding clone 22C3 (Dako, Carpinteria, CA, Kit cat#SK006) we used several dilutions without results in our hands. The specific molecules were detected with anti-mouse or rabbit secondary antibody (Chemicon International) and enhanced with SuperSignal Chemiluminescence kit (Pierce Biotechnology). Signals were detected on Kodak Biomax MR x-ray film (Kodak). For reliable signal development on the same blot, we used Re-Blot Plus stripping solution (Chemicon International) according to the manufacturer’s protocols.
Immunohistochemical Validation
FFPE histologic positive and negative controls were used for PD-L1 IHC analysis validation: HEK293 cell line as negative control, and HEK293-transfected with PD-L1 human gene as positive control (same cell lines tested in WB), HDLM-2 (positive), and PC3 (negative) (SignalSlide #13747; Cell Signaling Technology, Danvers, MA), human mature placenta, and human tonsil FFPE tissues. For IHC staining 4-μm thick sections were cut and staining was done using an automated staining system (Leica Bond Max, Leica Biosystems, Nussloch GmbH) with antibodies against PD-L1 using clones EPR1161-2 (dilution 1:100; Epitomics-Abcam); E1L3N (dilution 1:100; Cell Signaling Technology); clone E1J2J (dilution 1:100; Cell Signaling Technology), 7G11 (dilution 1:40; Boston University), SP142 (dilution 1:100; Spring Bioscience), rabbit polyclonal ab58810 (dilution 1:200; Abcam), 28-8 (dilution1:400; Abcam), and SP263 (ready to use, Ventana Medical System Inc.) using previously optimized IHC conditions and performed according to the standard automated protocols. All these antibodies were detected with the Leica Bond Polymer Refine detection kit (Leica Biosystems, cat# DS9800), including diaminobenzidine reaction to detect the antibody labeling and hematoxylin counterstaining. The selection of the correct titration of the clones were based on minimum and maximum range of dilution and staining negative to positive in the different control tissues and cell lines. For PD-L1 antibody clone 22C3 we used the DAKO autostainer Link 48 (Code AS480, DAKO) following the PD-L1 DAKO protocol. The uniformity and a correct membrane staining pattern within tissues and cell lines were considered accurate and positive. The staining pattern was also compared with the noncommercial clone 5H1 (dilution 1:40; Lieping Chen, Yale University) as a reference being a well-validated antibody in the literature.
In addition, based on the titers for the specifics antibodies obtained with the WB and IHC validations, we stained a TMA set (9 slides) of non–small cell lung cancer (NSCLC), stage I to III without neoadjuvant therapy, [NSCLC, N=185; 122 adenocarcinomas (ADCs) and 63 squamous cell carcinomas (SCCs)] to compare PD-L1 IHC expression between different clones. Of these, all 3 TMA cores were available in 110 ADC and 53 SCC, whereas the rest of the cases had 2 cores available for analysis. The TMA sections were prepared using three 1.0 mm tissue cores obtained from the center, middle, and periphery of the tumor, as described previously.29 The IHC staining, including positive and negative controls, were reviewed for quality control by 3 pathologists of the study (E.R.P., J.R.-C., and P.V.).
Image Acquisition and Digital Analysis
To analyze and measure the IHC PD-L1 expression from positive and negative controls and TMA cases, the stained slides were digitally scanned using the Aperio ScanScope AT2 slide scanner (Leica Biosystems) and were captured with a ×20 objective. The images were visualized using ImageScope software (Leica Biosystems) and analyzed by 2 pathologists (E.R.P. and P.V.) using Aperio Image Toolbox analysis software (Aperio, Leica Biosystems). Only membranous cellular PD-L1 IHC expression on MCs, macrophages and lymphocytes, was considered as a positive PD-L1 expression in these different cells.
The pathologists who performed the image analysis (E.R.P. and P.V.) were blinded to PD-L1 antibodies used. Membranous PD-L1 expression on MCs (tumor compartment), and on tumor-associated inflammatory cells (TAICs, stroma compartment) were analyzed separately (Fig. 1) using a same cell membrane algorithm to each clone. The staining intensity scored as 0 (no staining), 1+ (weak staining), 2+ (moderate staining), or 3+ (strong staining), and extension (percentage) of expression were determined in both areas. PD-L1 H-score from each compartment was determined by multiplying the staining intensity and the percentage of positive cells (range, 0 to 300). Histology assessment of each TMA core was performed to ensure the presence tumor. TMA cores with at least 90% of MCs were included in the selected tumor compartment, and areas without malignant cells were included in the tumor-associated stroma compartment. The average of the median PD-L1 H-score from each case and from each compartment on the 3 cores of the TMA representing the same patient was expressed as final result. In addition, the pathologists (E.R.P. and P.V.) independently reviewed all the cases under light microscopy considering a partial or complete membranous staining at any intensity and ≥1% of expression as the criteria for positive cases. Cases without agreement were resolved with consensus discussion with third pathologist (J.R.-C.).
FIGURE 1.
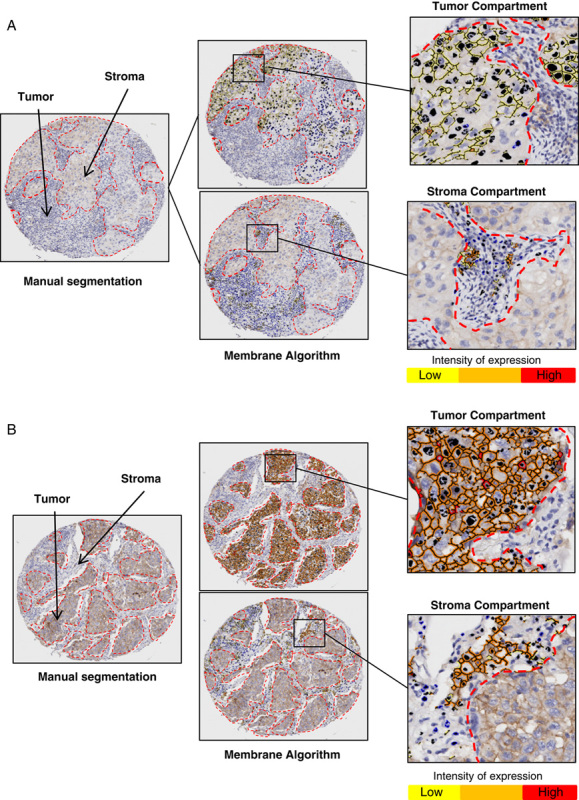
Microphotographs of representative examples of the computer algorithm (Aperio toolbox) used to analyze the IHC PD-L1 expression (brown staining) in MCs on tumor compartment and TAICs on stroma compartment (A and B). Images of PD-L1 IHC expression processed using a manual segmentation of tumor and stroma compartments (left), membrane algorithm using to the analysis (upper and lower meddle) and image analysis quantification using the membrane algorithm by intensity in tumor compartment (upper right) and in the tumor and stroma compartments (lower right). IHC indicates immunohistochemistry; MCs, malignant cells; PD-L1, programmed cell death ligand 1; TAICs, tumor-associated inflammatory cells.
Statistical Analyses
The Spearman test was used to detect differences in continuous variables between the different antibodies. The statistical software program IBM SPSS (version 22; Armonk, NY) was used to perform the computations for all analyses.
RESULTS
Validation of PD-L1by WB
For PD-L1 validation, several commercial clones were screened using WB with cell lysates preparing from tonsil, lung MCs lines, and PD-L1 nontransfected and transfected cells line. IHC validation, specificity, and applicability on the FFPE also were checked. These analyses gave important data about protein size and its expression. As shown in Figures 2A, B, the WB analysis showed a specific staining with a band in different lung cancer cell lines and HEK293 cell line transfected with PD-L1 gene by several commercial clones. The antibodies E1L3N, E1J2J, SP142, 28-8, and SP263, showed a molecular mass around 43 kDa, providing the same banding pattern observed with 5H1 clone. In addition, no band was observed in HEK293 cell line nontransfected with PD-L1 gene with the different clones. Unexpectedly, in human tonsil lysate tissue we observed a variable banding PD-L1 expression between clones. A molecular weight around 50 kDa band was observed with the PD-L1 clones E1L3N and E1J2J, also a band around 43 kDA was observed with the clones SP142 and SP263 and 2 molecular weights bands around 50 and 40 kDA were observed with the clones 28-8 and 5H1. In lung cancer cell lines, a positive banding pattern around 43 kDa was observed in 4 from 6 cell lines with the antibodies E1L3N, SP142, and 5H1 and 3 from 6 cell lines with the antibodies E1J2J, 28-8, and SP263. All these antibodies showed a correct band expression in the transfected cell lines with PD-L1 gene. For the other clones, EPR1161-2, 7G11, and rabbit polyclonal ab58810, unspecific and additional bands were detected (data no shown). Unfortunately, with the PD-L1 22C3 no band was observed on the WB with different dilutions tested in our hands.
FIGURE 2.
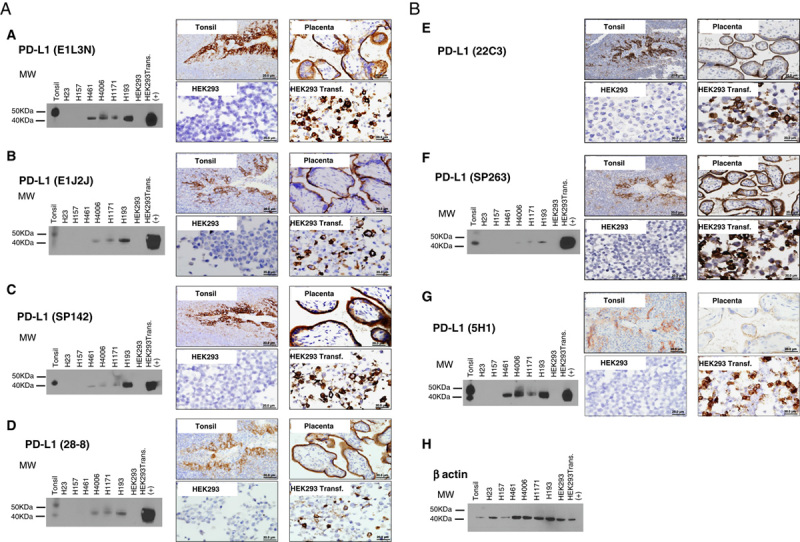
Western blot and microphotographs of representative examples from PD-L1 clones validation (A and B). PD-L1 MW area from human tonsil cell line, human lung cancer cell lines (H23, H157, H461, H4006, H1171, H193), HEK293, and HEK293-PD-L1 transfected are showing using PD-L1 E1L3N (A), E1J2J (B), SP142 (C), 28-8 (D), 22C3 (E), SP362 (F) 5H1(G) clones, and β-actin (H) by Western blot and immunohistochemistry. Positive membrane staining (brown) and negative PD-L1 staining are shown in reactive tonsil tissue, human placenta, cell pellet from HEK293-PD-L1 nontransfected and transfected cell line. HEK293 indicates human embryonic kidney 293 cell line; MW, molecular weight; PD-L1, programmed cell death ligand 1; transf., transfected.
Validation of PD-L1 by IHC
To the IHC validation, all clones were stained in FFPE tissues including, human reactive tonsil, human placenta, and cell blocks HEK293 cell line nontransfected and transfected with PD-L1 gene as positive and negative controls (Figs. 2A, B). The commercial clones, E1L3N, E1J2J, SP142, 28-8, 22C3, and SP263 showed a membrane staining and an identical staining pattern as 5H1 clone in the placenta and transfected cell line with PD-L1 gene. Similar membrane positivity in the reticulated epithelium of the tonsil crypts was observed with those clones. The disappearance of PD-L1 staining in the negative control (HEK293 cell line nontransfected with PD-L1 gene) was interpreted as evidence that the membrane pattern observed in the positive controls was specific and recognized the expected target. The other clones did not exhibit a specific membrane staining, showing some ones a massive expression through the entire cell population.
IHC PD-L1 in TMA Cases
Once the clones were validated by WB and IHC, it became feasible to characterize those protein expressions in TMA NSCLC tissues to determine the variations of PD-L1 expression between those selected clones. PD-L1 E1L3N, E1J2J, SP142, 28-8, 22C3, and SP362 showed a clear and positive membrane expression in many MCs, macrophages, and some lymphocytes in the TMA tissues. Although the heterogeneity and levels of expression varies from weak to strong and focal to diffuse in the different cells and cores from each case (Fig. 3). Our image analysis-based examination of tumor sections obtained from 122 ADC and 63 SCC patients demonstrated that the median PD-L1 H-score in the tumor compartment was 39.56 for E1L3N, 92.04 for E1J2J, 71.37 for SP142, 68.62 for 22-8, 36.48 for 22C3, and 63.32 for SP263, showing variability of intensity expression between the clones used (Table 2 and Fig. 3). Although we showed variability of IHC PD-L1 expression in the tumor and stroma compartments between the different antibodies, we observed a significant and positive correlation between clones (Fig. 4), although we observed a “r”<0.500 between E1L3N, SP142 (intracellular domain), and SP263 (extracellular domain) in the tumor compartment. In addition, we determined the median percent value to assess IHC PD-L1 expressing by MCs in NSCLC patients. This median PD-L1 value in the tumor compartment was 28.34% with E1L3N, 81.90% with E1J2J, 55.98% with SP142, 57.65% with 28-8, 26.36% with 22C3, and 62.37% with SP263 clone (Table 3). Furthermore, using a partial or complete membranous staining at any intensity and ≥1% as positive MCs expression criteria under optical microscopy, the pathologists observed 67 positive cases with E1L3N, 71 positives cases with E1J2J, 78 positive cases with SP142, 69 positive cases with 28-8, 68 positives with 22C3, and 89 positives with SP263 clone (Table 4). Variability of positivity by the markers in the same case was also observed (Fig. 3) and the pathologists reviewers identified 54 positive cases to all the markers, 10 cases positives to 5 markers, 6 case positives to 4 markers, 3 cases positives to 3 markers, 9 cases positives to 2 markers, and 17 cases positives for only 1 marker. In addition, we determined the distribution of lung tumors using 2 cut-off percentages (5% and 50%), of MCs with PD-L1 expression as shown in the Table 4.
FIGURE 3.
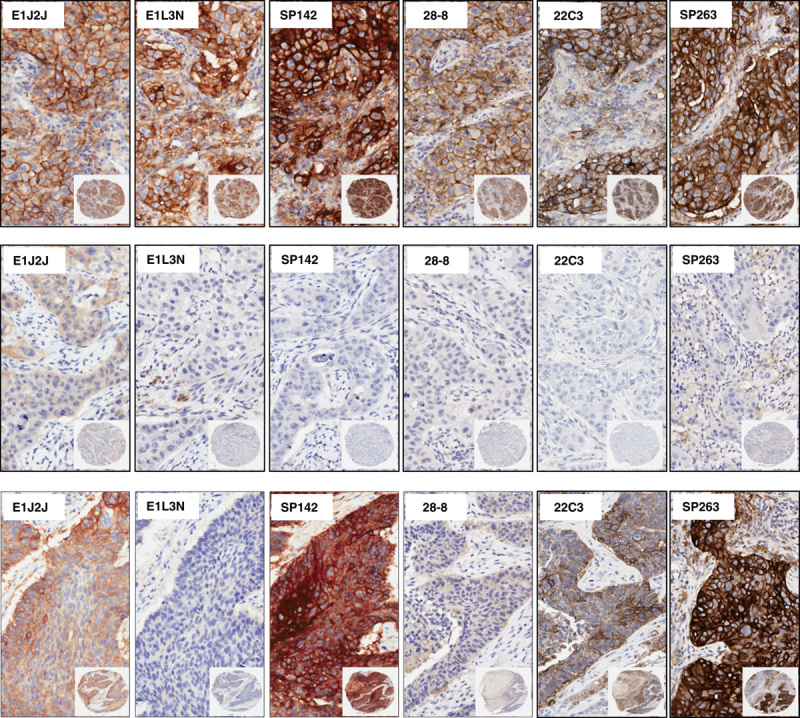
Microphotographs of representative examples of IHC PD-L1 heterogeneity expression in MCs from lung cancer specimens. Positive membrane staining (brown) and negative PD-L1 staining are shown with PD-L1 E1L3N, E1J2J, SP142, 28-8, 22C3, and SP362 clone.×4 magnification and detail at×200 magnification. IHC indicates immunohistochemistry; MCs, malignant cells; PD-L1, programmed cell death ligand 1.
TABLE 2.
Comparison of PD-L1 H-score Expression in Tumor and Stroma Compartments Using Image Analysis-based Assessment

FIGURE 4.
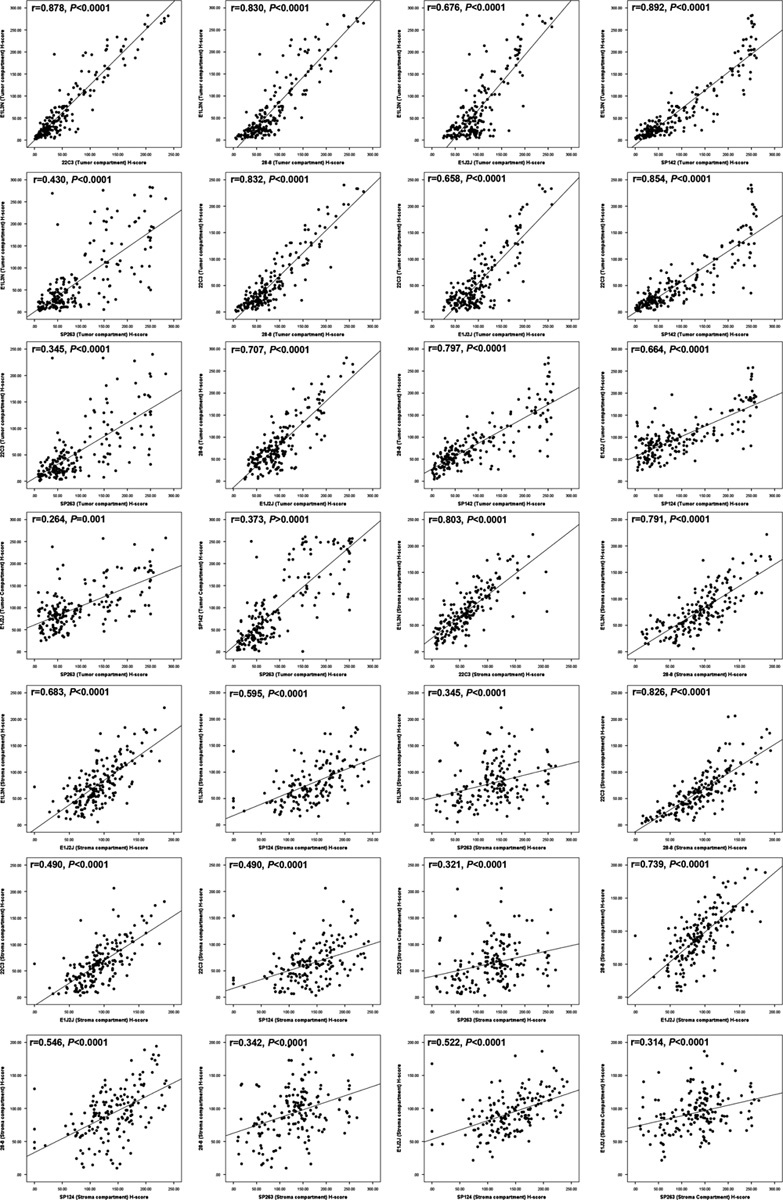
Scatterplot showed the correlation of IHC PD-L1 H-score expression in the tumoral and stroma compartment between different clones. IHC indicates immunohistochemistry; PD-L1, programmed cell death ligand 1.
TABLE 3.
Comparison of PD-L1 Using Percentage of Staining in Tumor and Stroma Compartments by Image Analysis-based Assessment

TABLE 4.
Comparison of PD-L1 Expression in MCs in a TMA Non–Small Cells Lung Cancer Patients (N=185)

In the same way, we observed a variable distribution of PD-L1 in the stroma compartment expressing predominantly in lymphocytes and cells with macrophages characteristic. In the stroma compartment the median PD-L1 H-score from these cells (TAICs), was 71.88 for E1L3N, 89.32 for E1J2J, 138.81 for PS142, 91.77 for 28-8, 60.76 for 22C3, and 136.36 for PS263 clone (Table 1). Furthermore, the percentage of TAICs expressing PD-L1 showed 47.70% for E1L3N, 72.71% for E1J2J, 90.04% for PS142, 70.04% for 28-8, 42.35% for 22C3, and 92.44% for SP263 clone (Table 3). Indeed, SP263 clone showed more positive membrane PD-L1 expression in the stroma compartment cells than the other clones, with heterogenous distribution (Fig. 5). In general, overinterpretation of the staining intensity by the Aperio system was observed in all the cases in the tumor compartment, predominantly in cases where was difficult to exclude TAIC expressing PD-L1 between and over the tumor cells (Fig. 6) showing that the pathologist intervention and supervision during the analysis is important to categorize these cases properly or find a right cut-off point to this type of marker.
FIGURE 5.
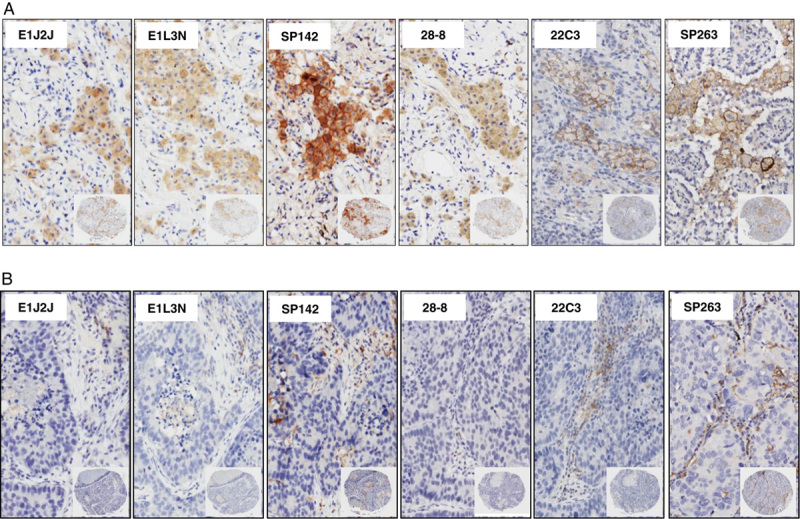
Microphotographs of representative examples of IHC PD-L1 heterogeneity expression in TAICs in TMA lung cancer specimens. Positive membrane staining (brown) in macrophages (A) and lymphocytes (B) are shown with PD-L1 E1L3N, E1J2J, SP142, 28-8, 22C3, and SP263 clone. ×4 magnification and detail at ×200 magnification. IHC indicates immunohistochemistry; PD-L1, programmed cell death ligand 1; TAICs, tumor-associated inflammatory cells; TMA, tissue microarrays.
FIGURE 6.
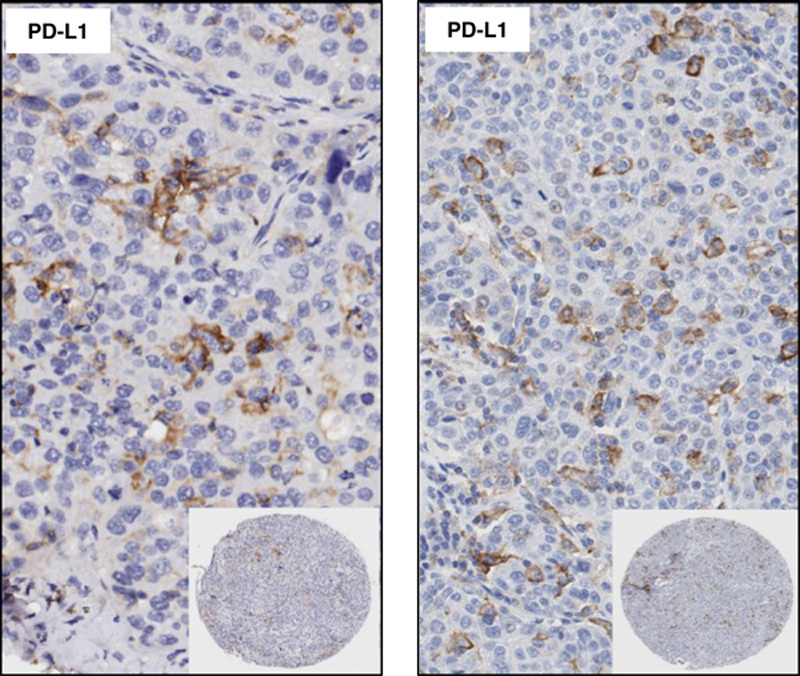
Microphotographs of representative examples of IHC PD-L1 expression by TAICs in the tumor compartment. ×4 magnification and detail at ×200 magnification. IHC indicates immunohistochemistry; PD-L1, programmed cell death ligand 1; TAICs, tumor-associated inflammatory cells.
DISCUSSION
The objective of this study was to compare and validate commercial PD-L1 clones and identify which ones can be reliably used by surgical pathologist. Also, we analyzed PD-L1expression in a set of TMA NSCLC tissues to determinate if there are differences in its expression using the validated PD-L1 antibodies.
An important issue for all tissue immunoprofiling is the specificity and sensitivity of the antibody clone.30 Currently, specificity is determined by several binding assays such as routinely used WB, immunoprecipitation, enzyme-linked immunosorbent assays, quantitative immunofluorescence, and in addition, IHC is applied to tissue controls and cell lines, in the validation process.23 The most frequently used method is the WB analysis, which yields confirmation of the size of the target and might give additional information about posttranslational modifications or the presence of splice variants or proteolytic fragments. The IHC was also important to determine the specific PD-L1 expression in human tissue.31 In this way, the WB analysis showed important information about the band and molecular size of the PD-L1 proteins tested especially from the commercial clones, E1L3N, E1J2J, SP142, 28-8, and SP263 that showed a molecular mass around 43 kDa in several MCs lines and HEK293-transfected cells line with the PD-L1 gene, providing the same banding pattern observed with 5H1 clone. The 5H1 monoclonal antibody has more recently been successfully applied to the staining of FFPE tumor tissues including lung cancer, renal cells carcinomas, cervical carcinoma, bladder cancer, and melanomas1,32–34 and it is the noncommercial clone very well validated in the literature. Although the cellular epitope target of those clones are different, E1J2J, 22C3, 28-8, and SP263 have its target in the extracellular domain and E1L3N and SP124 clones have its target in the intracellular domain; the 5 clones showed a specific membrane pattern and positive correlations between them in FFPE tissues. Indeed, the membrane domain is actually considered the active portion of the protein and the membranous staining is used as specific expression pattern by MCs in clinical evaluations.35 Once the clones were validated by WB and IHC in controls, PD-L1 E1L3N, E1J2J, SP142, 28-8, 22C3, and SP263 were staining in a set of TMA NSCLC. Although the level of expression ranged from weak to strong and from focal to diffuse on MCs with each clone, a specific membrane positive expression was not different between the clones. We also observed heterogenous PD-L1 expression from each individual clone when the same core was analyzed using the H-score or percentage of positive cells by image analysis assessment and this heterogeneity was detected not just in MCs but also in macrophages and lymphocytes, especially in the tumor compartment, showing that determination of a positive threshold is a difficult issue to consider when we are working with a no specific antibody that may be staining different types of cells.36 This can be maybe one of the factors that would explain the different results obtained in the literature, also considering the different methods of quantification (image analysis vs. microscopic observation), staining procedures (manually vs. automated staining vs. specific approved protocol), and different type of specimens used (whole histologic sections vs. TMAs).37–40 The clinically relevant threshold for IHC PD-L1 expression in NSCLC cells has not yet defined, and researchers have examined various cut-offs of PD-L1 positivity36; including, at least 1%,41,42 5%,26,41,43–45 10%,28 and 50%27,42,46 of positive cells and greater than the median H-score.47 Although the heterogeneity and levels of expression in MCs were different among the cases, 29% of cases were considered positives using PD-L1 E1L3N, E1J2J, 22C3, SP142, 28-8, and SP263 clones under light microscopy using the most frequently cut-off used to assess IHC PD-L1 expression in MCs in NSCLC patients given PD-1/PD-L1 inhibitors: ≥1%. This cut-off value has been associated with durable tumor regression and prolonged disease stabilization in response to anti-PD-L1 treatment in advanced NSCLC cases. The SP263 clone detected more positive cases, 48%, following by SP142 with 42%, E1J2J with 38%, 28-8, and 22C3 with 37%, and E1L3N with 36%, being the clone which detected the less quantity of positive cases. The variability of positive or negative case detection by those clones in our study is probably related in part to the variability of affinity from each clone to detect cells expressing PD-L1, suggesting that the clones have a different power to binding the protein. Deterioration of PD-L1 antigen at bio-bank storage in tissue samples, saved for long periods of time, as has been showed with other antibodies48 maybe can explain in part some negative PD-L1 cases, which respond to therapy. The variation of the TMA cores along the different clones markers also need to be considered as important factor of limitation and variation showing the heterogenous staining pattern of those markers. In addition, our H-score image analysis from TAICs as macrophages in the stroma compartment showed also this heterogeneity of membrane expression and staining distribution through the different cases analyzed. The variability of PD-L1 distribution in these cells, exhibit again another factor that may be implicated in the different results observed in several studies by using different clones to detect PD-L1 expression when is observed in the entire population of cells expressing PD-L1. We believe that the more accurate method to analyze and quantify those markers is by a pathologist microscopic observation, using his knowledge and experience to identify only MCs’ expression following simple rules such as; to consider just membrane staining or reinforcement of membrane staining at any intensity as positive expression, to consider at least 100 MCs available in the tissue as the minimum number of cells required for analysis and finally report their quantifications as a percent of MCs positives to PD-L1. However, these results increased the necessity to standardized methodologies and validation techniques to report and to interpret the results of those markers as shown in literature25,49,50 as well as the necessity of new initiatives to homogenize the assays to address these problems51 and organized a joint effort between drug manufacturers and research people from different cancer organizations to creating a standard criterion to compare the performances of these PD-L1 assays.
In summary, after tests including WB and IHC on diverse controls and a NSCLC TMA we concluded that overall the clones, E1L3N, E1J2J, 22C3, SP142, 28-8, and SP263 show a similar staining membrane pattern as 5H1 clone in controls and in NSCLC cases. In our TMA, SP263 clone detected more positive cases than the other clones showing an individual positive variability of expression through the cases. Furthermore, more tests are necessary in different cancer tissues and whole section to understand much better the differences between the different clones used to detect PD-L1 expression.
ACKNOWLEDGMENTS
The authors thank Dr Lieping Chen at Yale University for kindly providing the antibody (5H1) to their validation and Dr Jie Qing Chen at MD Anderson Cancer Center to providing the cell line 293 transfected with the gene PD-L1.
Footnotes
Supported in part by a Department of Defence PROSPECT grant (W81XWH-07-1-0306), Lung Cancer Moon Shot projects (P30 CA01667), SPORE grant (5P50CA070907-18), CPRIT grant (MIRA-RP160688), The University of Texas Lung Specialized Programs of Research Excellence grant (P50CA70907; to I.I.W.), MD Anderson’s Institutional Tissue Bank Award (2P30CA016672) from the National Cancer Institute, and National Counsel of Technological and Scientific Development of the Ministry of Science, Technology and Innovation of Brazil (P246042/2012-5).
The authors declare no conflict of interest.
REFERENCES
- 1.Brahmer JR, Tykodi SS, Chow LQ, et al. Safety and activity of anti-PD-L1 antibody in patients with advanced cancer. N Engl J Med. 2012;366:2455–2465. [DOI] [PMC free article] [PubMed] [Google Scholar]
- 2.Topalian SL, Hodi FS, Brahmer JR, et al. Safety, activity, and immune correlates of anti-PD-1 antibody in cancer. N Engl J Med. 2012;366:2443–2454. [DOI] [PMC free article] [PubMed] [Google Scholar]
- 3.Ribas A, Tumeh PC. The future of cancer therapy: selecting patients likely to respond to PD1/L1 blockade. Clin Cancer Res. 2014;20:4982–4984. [DOI] [PMC free article] [PubMed] [Google Scholar]
- 4.Dong H, Zhu G, Tamada K, et al. B7-H1, a third member of the B7 family, co-stimulates T-cell proliferation and interleukin-10 secretion. Nat Med. 1999;5:1365–1369. [DOI] [PubMed] [Google Scholar]
- 5.Freeman GJ, Long AJ, Iwai Y, et al. Engagement of the PD-1 immunoinhibitory receptor by a novel B7 family member leads to negative regulation of lymphocyte activation. J Exp Med. 2000;192:1027–1034. [DOI] [PMC free article] [PubMed] [Google Scholar]
- 6.Keir ME, Butte MJ, Freeman GJ, et al. PD-1 and its ligands in tolerance and immunity. Annu Rev Immunol. 2008;26:677–704. [DOI] [PMC free article] [PubMed] [Google Scholar]
- 7.Carreno BM, Collins M. The B7 family of ligands and its receptors: new pathways for costimulation and inhibition of immune responses. Annu Rev Immunol. 2002;20:29–53. [DOI] [PubMed] [Google Scholar]
- 8.Sharpe AH, Wherry EJ, Ahmed R, et al. The function of programmed cell death 1 and its ligands in regulating autoimmunity and infection. Nat Immunol. 2007;8:239–245. [DOI] [PubMed] [Google Scholar]
- 9.Guleria I, Khosroshahi A, Ansari MJ, et al. A critical role for the programmed death ligand 1 in fetomaternal tolerance. J Exp Med. 2005;202:231–237. [DOI] [PMC free article] [PubMed] [Google Scholar]
- 10.Hori J, Wang M, Miyashita M, et al. B7-H1-induced apoptosis as a mechanism of immune privilege of corneal allografts. J Immunol. 2006;177:5928–5935. [DOI] [PubMed] [Google Scholar]
- 11.Watson MP, George AJ, Larkin DF. Differential effects of costimulatory pathway modulation on corneal allograft survival. Invest Ophthalmol Vis Sci. 2006;47:3417–3422. [DOI] [PubMed] [Google Scholar]
- 12.Sugita S, Usui Y, Horie S, et al. Human corneal endothelial cells expressing programmed death-ligand 1 (PD-L1) suppress PD-1+ T helper 1 cells by a contact-dependent mechanism. Invest Ophthalmol Vis Sci. 2009;50:263–272. [DOI] [PubMed] [Google Scholar]
- 13.Sheppard KA, Fitz LJ, Lee JM, et al. PD-1 inhibits T-cell receptor induced phosphorylation of the ZAP70/CD3 zeta signalosome and downstream signaling to PKC theta. FEBS Lett. 2004;574:37–41. [DOI] [PubMed] [Google Scholar]
- 14.Eggermont AM, Spatz A, Robert C. Cutaneous melanoma. Lancet. 2014;383:816–827. [DOI] [PubMed] [Google Scholar]
- 15.Droeser RA, Hirt C, Viehl CT, et al. Clinical impact of programmed cell death ligand 1 expression in colorectal cancer. Eur J Cancer. 2013;49:2233–2242. [DOI] [PubMed] [Google Scholar]
- 16.Ghebeh H, Mohammed S, Al-Omair A, et al. The B7-H1 (PD-L1) T lymphocyte-inhibitory molecule is expressed in breast cancer patients with infiltrating ductal carcinoma: correlation with important high-risk prognostic factors. Neoplasia. 2006;8:190–198. [DOI] [PMC free article] [PubMed] [Google Scholar]
- 17.Bigelow E, Bever KM, Xu H, et al. Immunohistochemical staining of B7-H1 (PD-L1) on paraffin-embedded slides of pancreatic adenocarcinoma tissue. J Vis Exp. 2013;71:e4059. [DOI] [PMC free article] [PubMed] [Google Scholar]
- 18.Lin C, Chen X, Liu J, et al. Advances of PD-1/PD-L1 signaling pathway in immune escape and treatment for non-small cell lung cancer. Zhongguo fei ai za zhi. 2014;17:734–740. [DOI] [PMC free article] [PubMed] [Google Scholar]
- 19.Parra ER, Behrens C, Rodriguez-Canales J, et al. Image analysis-based assessment of PD-L1 and tumor-associated immune cells density supports distinct intratumoral microenvironment groups in non-small cell lung carcinoma patients. Clin Cancer Res. 2016;22:6278–6289. [DOI] [PMC free article] [PubMed] [Google Scholar]
- 20.Sznol M, Chen L. Antagonist antibodies to PD-1 and B7-H1 (PD-L1) in the treatment of advanced human cancer—response. Clin Cancer Res. 2013;19:1021–1034. [DOI] [PMC free article] [PubMed] [Google Scholar]
- 21.Taube JM, Klein A, Brahmer JR, et al. Association of PD-1, PD-1 ligands, and other features of the tumor immune microenvironment with response to anti-PD-1 therapy. Clin Cancer Res. 2014;20:5064–5074. [DOI] [PMC free article] [PubMed] [Google Scholar]
- 22.Berghoff AS, Ricken G, Widhalm G, et al. PD1 (CD279) and PD-L1 (CD274, B7H1) expression in primary central nervous system lymphomas (PCNSL). Clin Neuropathol. 2014;33:42–49. [DOI] [PubMed] [Google Scholar]
- 23.Bordeaux J, Welsh A, Agarwal S, et al. Antibody validation. Biotechniques. 2010;48:197–209. [DOI] [PMC free article] [PubMed] [Google Scholar]
- 24.Rimm D, Schalper K, Pusztai L. Unvalidated antibodies and misleading results. Breast Cancer Res Treat. 2014;147:457–458. [DOI] [PMC free article] [PubMed] [Google Scholar]
- 25.Ilie M, Hofman V, Dietel M, et al. Assessment of the PD-L1 status by immunohistochemistry: challenges and perspectives for therapeutic strategies in lung cancer patients. Virchows Arch. 2016;468:511–525. [DOI] [PubMed] [Google Scholar]
- 26.Boland JM, Kwon ED, Harrington SM, et al. Tumor B7-H1 and B7-H3 expression in squamous cell carcinoma of the lung. Clin Lung Cancer. 2013;14:157–163. [DOI] [PubMed] [Google Scholar]
- 27.Fehrenbacher L, Spira A, Ballinger M, et al. Atezolizumab versus docetaxel for patients with previously treated non-small-cell lung cancer (POPLAR): a multicentre, open-label, phase 2 randomised controlled trial. Lancet. 2016;387:1837–1846. [DOI] [PubMed] [Google Scholar]
- 28.Kim MY, Koh J, Kim S, et al. Clinicopathological analysis of PD-L1 and PD-L2 expression in pulmonary squamous cell carcinoma: comparison with tumor-infiltrating T cells and the status of oncogenic drivers. Lung Cancer. 2015;88:24–33. [DOI] [PubMed] [Google Scholar]
- 29.Guo C, Shao R, Correa AM, et al. Prognostic significance of combinations of RNA-dependent protein kinase and EphA2 biomarkers for NSCLC. J Thorac Oncol. 2013;8:301–308. [DOI] [PMC free article] [PubMed] [Google Scholar]
- 30.Howat WJ, Lewis A, Jones P, et al. Antibody validation of immunohistochemistry for biomarker discovery: recommendations of a consortium of academic and pharmaceutical based histopathology researchers. Methods. 2014;70:34–38. [DOI] [PMC free article] [PubMed] [Google Scholar]
- 31.Algenas C, Agaton C, Fagerberg L, et al. Antibody performance in western blot applications is context-dependent. Biotechnol J. 2014;9:435–445. [DOI] [PubMed] [Google Scholar]
- 32.Thompson RH, Webster WS, Cheville JC, et al. B7-H1 glycoprotein blockade: a novel strategy to enhance immunotherapy in patients with renal cell carcinoma. Urology. 2005;66(suppl):10–14. [DOI] [PubMed] [Google Scholar]
- 33.Thompson RH, Dong H, Kwon ED. Implications of B7-H1 expression in clear cell carcinoma of the kidney for prognostication and therapy. Clin Cancer Res. 2007;13(pt 2):709s–715s. [DOI] [PubMed] [Google Scholar]
- 34.Karim R, Jordanova ES, Piersma SJ, et al. Tumor-expressed B7-H1 and B7-DC in relation to PD-1+ T-cell infiltration and survival of patients with cervical carcinoma. Clin Cancer Res. 2009;15:6341–6347. [DOI] [PubMed] [Google Scholar]
- 35.Topalian SL, Drake CG, Pardoll DM. Targeting the PD-1/B7-H1(PD-L1) pathway to activate anti-tumor immunity. Curr Opin Immunol. 2012;24:207–212. [DOI] [PMC free article] [PubMed] [Google Scholar]
- 36.Kerr KM, Nicolson MC. Non-small cell lung cancer, PD-L1, and the pathologist. Arch Pathol Lab Med. 2016;140:249–254. [DOI] [PubMed] [Google Scholar]
- 37.Konishi J, Yamazaki K, Azuma M, et al. B7-H1 expression on non-small cell lung cancer cells and its relationship with tumor-infiltrating lymphocytes and their PD-1 expression. Clin Cancer Res. 2004;10:5094–5100. [DOI] [PubMed] [Google Scholar]
- 38.Velcheti V, Schalper KA, Carvajal DE, et al. Programmed death ligand-1 expression in non-small cell lung cancer. Lab Invest. 2014;94:107–116. [DOI] [PMC free article] [PubMed] [Google Scholar]
- 39.Yu H, Boyle TA, Zhou C, et al. PD-L1 expression in lung cancer. J Thorac Oncol. 2016;11:964–975. [DOI] [PMC free article] [PubMed] [Google Scholar]
- 40.Kerr KM, Tsao MS, Nicholson AG, et al. Committee IP. Programmed death-ligand 1 immunohistochemistry in lung cancer: in what state is this art? J Thorac Oncol. 2015;10:985–989. [DOI] [PubMed] [Google Scholar]
- 41.Brahmer J, Reckamp KL, Baas P, et al. Nivolumab versus docetaxel in advanced squamous-cell non-small-cell lung cancer. N Engl J Med. 2015;373:123–135. [DOI] [PMC free article] [PubMed] [Google Scholar]
- 42.Garon EB, Rizvi NA, Hui R, et al. Pembrolizumab for the treatment of non-small-cell lung cancer. N Engl J Med. 2015;372:2018–2028. [DOI] [PubMed] [Google Scholar]
- 43.D'Incecco A, Andreozzi M, Ludovini V, et al. PD-1 and PD-L1 expression in molecularly selected non-small-cell lung cancer patients. Br J Cancer. 2015;112:95–102. [DOI] [PMC free article] [PubMed] [Google Scholar]
- 44.Yang CY, Lin MW, Chang YL, et al. Programmed cell death-ligand 1 expression in surgically resected stage I pulmonary adenocarcinoma and its correlation with driver mutations and clinical outcomes. Eur J Cancer. 2014;50:1361–1369. [DOI] [PubMed] [Google Scholar]
- 45.Rizvi NA, Mazieres J, Planchard D, et al. Activity and safety of nivolumab, an anti-PD-1 immune checkpoint inhibitor, for patients with advanced, refractory squamous non-small-cell lung cancer (CheckMate 063): a phase 2, single-arm trial. Lancet Oncol. 2015;16:257–265. [DOI] [PMC free article] [PubMed] [Google Scholar]
- 46.Gatalica Z, Snyder C, Maney T, et al. Programmed cell death 1 (PD-1) and its ligand (PD-L1) in common cancers and their correlation with molecular cancer type. Cancer Epidemiol Biomarkers Prev. 2014;23:2965–2970. [DOI] [PubMed] [Google Scholar]
- 47.Smith J, Robida MD, Acosta K, et al. Quantitative and qualitative characterization of two PD-L1 clones: SP263 and E1L3N. Diagn Pathol. 2016;11:44. [DOI] [PMC free article] [PubMed] [Google Scholar]
- 48.Karlsson C, Karlsson MG. Effects of long-term storage on the detection of proteins, DNA, and mRNA in tissue microarray slides. J Histochem Cytochem. 2011;59:1113–1121. [DOI] [PMC free article] [PubMed] [Google Scholar]
- 49.Cree IA, Booton R, Cane P, et al. PD-L1 testing for lung cancer in the UK: recognizing the challenges for implementation. Histopathology. 2016;69:177–186. [DOI] [PubMed] [Google Scholar]
- 50.Sholl LM, Aisner DL, Allen TC, et al. Programmed death ligand-1 immunohistochemistry—a new challenge for pathologists: a perspective from members of the Pulmonary Pathology Society. Arch Pathol Lab Med. 2016;140:341–344. [DOI] [PubMed] [Google Scholar]
- 51.Rehman JA, Han G, Carvajal-Hausdorf DE, et al. Quantitative and pathologist-read comparison of the heterogeneity of programmed death-ligand 1 (PD-L1) expression in non-small cell lung cancer. Modern Pathol. 2017;30:340–349. [DOI] [PMC free article] [PubMed] [Google Scholar]


