Abstract
In living systems, it is frequently stated that form follows function by virtue of evolutionary pressures on organism development, but in the study of how functions emerge at the cellular level, function often follows form. We study this chicken versus egg problem of emergent structure-property relationships in living systems in the context of primary human bone marrow stromal cells cultured in a variety of microenvironments that have been shown to cause distinct patterns of cell function and differentiation. Through analysis of a publicly available catalogue of three-dimensional (3D) cell shape data, we introduce a family of metrics to characterize the “form” of the cell populations that emerge from a variety of diverse microenvironments. In particular, measures of form are considered that are expected to have direct significance for cell function, signaling and metabolic activity: dimensionality, polarizability and capacitance. Dimensionality was assessed by an intrinsic measure of cell shape obtained from the polarizability tensor. This tensor defines ellipsoids for arbitrary cell shapes and the thinnest dimension of these ellipsoids, P1, defines a reference minimal scale for cells cultured in a 3D microenvironment. Polarizability governs the electric field generated by a cell, and determines the cell’s ability to detect electric fields. Capacitance controls the shape dependence of the rate at which diffusing molecules contact the surface of the cell, and this has great significance for inter-cellular signaling. These results invite new approaches for designing scaffolds which explicitly direct cell dimensionality, polarizability and capacitance to guide the emergence of new cell functions derived from the acquired form.
Keywords: bone marrow stromal cell, biomaterial, cell morphology, dimensionality, mesenchymal stem cell, polarizability, scaffold, structure-function relationship
Introduction
The relationship between form and function was codified by American architect Louis Sullivan, who used this principle of design efficiency to draft the modern skyscraper. Given evolutionary pressures, it is reasonable to apply this same rationality to cells [1–4]. Cells have characteristic morphotypes, such as epithelial cells that can have elongated (columnar), planar (squamous), or equiaxial (cuboidal) shapes [5] and these morphotypes may be linked to their function. We previously generated a catalog of 3D cell shape populations from a variety of culture microenvironments [6]. Herein, new metrics for interpreting how these cell forms affect cell function are applied. These metrologies include intrinsic measures of cell shape that govern cell signaling events, cell response to inherent electric fields and detection of soluble factors in the microenvironment.
A variety of biomaterial scaffolds have been advanced [7–10]. As the microenvironment influences the shape of the cells, the shape influences the concentration, distribution and transport of reactants and signaling molecules, which alters signal transduction and cell metabolism [11–16]. There is a contiguous physical link from the cell surface to the nuclear genome through the nucleoskeleton, indicating that changes in cell shape may directly impact gene expression [17]. Additionally, changes to cell shape may cause conformational changes in the promoter regions of genes that enable transcription factor binding and gene expression [18–21].
Unfortunately, there is a lack of quantitative information about the 3D morphology of cells in biomaterial scaffolds. To address these issues, the 3D shape of primary human bone marrow stromal cells (hBMSCs) was quantitatively evaluated in several biomaterial substrates and scaffolds. hBMSCs are an adult fibroblastic cell preparation which has osteogenic capability in vivo and which are being tested for therapeutic activity in many human clinical trials [22]. Substrate effects on the shape of hBMSCs can influence their behavior [2, 3] and culture of hBMSCs within fibrous scaffolds has been shown to induce their osteogenic differentiation [23–25].
In particular, we consider measures of form that are expected to have direct impact on cell physical properties, including dimensionality, polarizability and capacitance. The polarizability tensor yields a characteristic ellipsoid that was used to assess cell dimensionality. Effective dimensionality is a cell property of critical importance for biological diffusion processes which mediate tissue regeneration and dictate the likelihood that a ligand will find its target cell [13, 15, 26]. Polarizability describes the ability of a cell to detect and respond to electric fields [27]. Living systems contain a complex milieu of electrical fields and polarizability is relevant for understanding cell response to these fields [28–32]. Neurons cultured on charged substrates demonstrated enhanced neurite outgrowth [33] and culture of osteoblasts on electrically polarized calcium phosphate substrates influenced their osteogenic differentiation [34]. Capacitance describes the propensity that a randomly diffusing solute (signaling molecule, nutrient, etc.) will collide with a cell boundary [27]. Cell shape may influence signal transduction through the cell’s ability to detect soluble signals. Polarizability and capacitance increase with the average size of objects, but they also define intrinsic measures of shape that are minimized by a spherical object [35].
Herein, we employ a variety of cell shape metrics to analyze hBMSC morphology. Approximately 1000 cells were analyzed with 3D metrics to improve statistical confidence in the results. Cell polarizability and capacitance were determined with a probabilistic algorithm called ZENO [27, 36], which launches particles using a random-walk and determines the probability of encountering the cell. The development of a new, streamlined version of the ZENO code was required by the large data set analyzed in this work (1000 3D cells, 125 GB) in order to reduce run times from years to days [37]. These analyses provide new means for relating cell shape to cell function via changes in dimensionality, response to electric fields (polarizability) and in the sensing of diffusing signaling molecules (capacitance).
2. Methods
2.1. Catalogue of 3D cell shape data
We previously generated a publicly available catalogue of 3D cell shape data [6]: https://isg.nist.gov/deepzoomweb/zstackDownload (https://doi.org/doi:10.18434/M3ZP4Q). A brief description of the how the catalogue was generated is presented below and a more detailed description is present in the Supporting Information.
2.1.1 Substrates and scaffolds
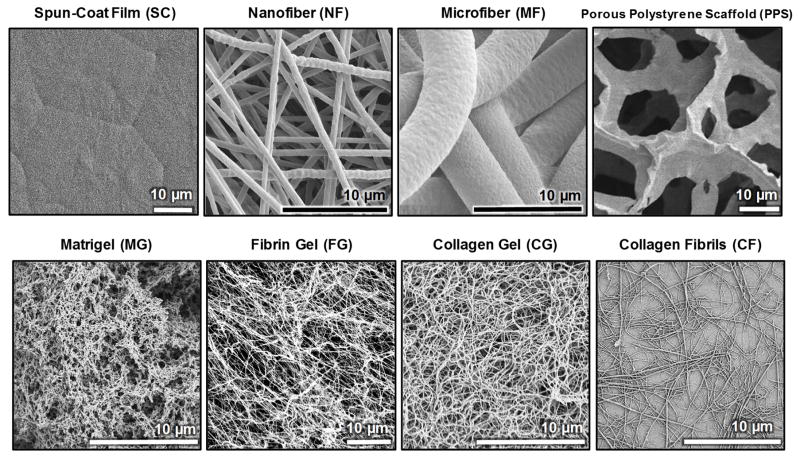
Ten different substrates and scaffolds were used to assess hBMSC morphology (Fig. 1, Table 1). Films of poly(ε-caprolactone) (PCL, relative molecular mass 80,000 g/mol, Sigma Aldrich) were prepared by spin-coating (SC). Nanofibers (NF) and microfiber (MF) were prepared from PCL by electrospinning. Porous polystyrene scaffolds (PPS) were purchased (Alvetex, 6-well insert, Reinnervate). Reduced-growth factor Matrigel (MG) was purchased (BD Biosciences, cat. num. 354230) [38]. Fibrin gels (FG) were prepared from fibrinogen (human plasma fibrinogen, cat. num. F3879, Sigma Aldrich) and thrombin (human plasma thrombin, cat. num. T6884, Sigma Aldrich). Collagen gels (CG) and collagen fibrils (CF) [39] were prepared from type I collagen (PureCol bovine type I collagen, cat. num. 5005-B, Advanced BioMatrix). Some SC and NF cultures included osteogenic supplements (OS) (dexamethasone, β-glycerophosphate, L-ascorbic acid) in the culture medium (SC+OS, NF+OS). Substrates were characterized by scanning electron microscopy and atomic force microscopy as previously reported [6].
Fig. 1.
Scanning electron micrographs of substrate and scaffold morphology.
Table 1.
Scaffold Descriptions & Characteristics
| Abbrev. | Description | Properties [mean (S.D.)] | # of Cells Analyzed |
|---|---|---|---|
| SC | Flat PCLa Spun Coat Films | Surface Roughness = 93 nm (11 nm) | 99 |
| SC+OS | Flat PCL Spun Coat Films with OSb | Surface Roughness = 93 nm (11 nm) | 96 |
| NF | Electrospun PCL Nanofibers | Fiber Dia. 589 nm (116 nm) | 101 |
| NF+OS | Electrospun PCL Nanofibers with OS | Fiber Dia. 589 nm (116 nm) | 95 |
| MF | Electrospun PCL Microfibers | Fiber Dia. 4.38 μm (0.42 μm) | 87 |
| PPS | Porous Polystyrene Scaffold (Alvetex) | Pore Size 36 μm to 40 μm | 98 |
| MG | Matrigel | Mouse tumor extract, rich in Type IV collagen | 98 |
| FG | Fibrin Gel | Polymerized fibrinogen (6 mg/mL) | 92 |
| CG | Collagen Gel | Type I collagen (2.4 mg/mL) | 101 |
| CF | Collagen Fibrils | Type I collagen (300 μg/mL), fibril dia. ≈ 200 nm | 102 |
PCL = Poly(ε-Caprolactone);
OS = Osteogenic Supplements
2.1.2 Cell culture, confocal imaging and image analysis
Primary human bone marrow stromal cells (hBMSCs) were obtained from Tulane Center for Gene Therapy (donor 7038, healthy 29-year-old female, marrow harvest from iliac crest) and were cultured for 24 h in 10 different treatments (Table 1). A 24 h culture time was selected because it is long enough for the cells to achieve a stable morphology, but not too long to allow the cells to proliferate and contact one another. For SC, NF, MF, PPS, NF+OS and SC+OS, cells were seeded onto the substrates by adding cell suspensions to the substrates. For MG, FG and CG, cells were mixed with the proteins prior to gelation to embed the cells within the hydrogels. After 24 h of culture, hBMSCs were fixed, stained for actin (AlexaFluor 546-phalloidin), stained for nucleus (DAPI, 4′,6-diamidino-2-phenylindole, dihydrochloride) and imaged (confocal laser scanning microscope, Leica SP5 II, Leica Microsystems, 63× water immersion objective). Z-stacks of images (TIFF, voxel dimensions of 240 nm × 240 nm × 710 nm) of hBMSCs were captured for each substrate using two channels (actin and nucleus). Only individual hBMSCs that were not touching other cells (one nucleus per object) were imaged. For 3D imaging using actin stain, cell shape analysis is not possible when the cells are touching because the cell boundaries are not clear. Approximately 100 cells were imaged for each substrate. An automated process for segmenting thousands of Z-stacks was developed and used as described in a separate publication [40].
2.2. ZENO program for probabilistic determinations of shape-dependent cell properties
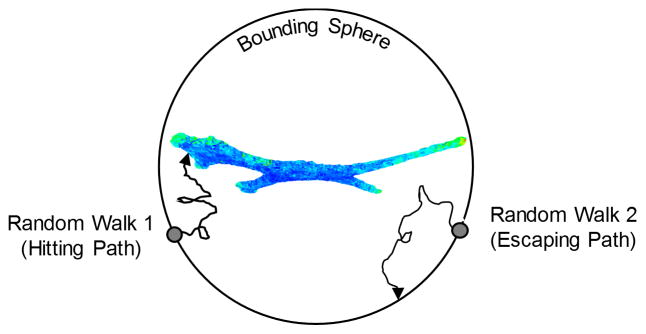
A program called ZENO (https://web.stevens.edu/zeno/) was used to compute metrics for the 3D cell shapes, including polarizability and capacitance [27, 36]. ZENO is a numerical path-integrator program that efficiently generates solutions to many transport properties for objects with arbitrary shapes. ZENO encloses the object inside of a bounding sphere (sphere dia. = 1.5 times the maximum dimension of the cell) and launches particles from random locations on the surface of the bounding sphere (Fig. 2). The particles follow a random-walk trajectory that either hits the cell surface or hits the bounding sphere (escape). Based on the probability of hitting the object (the number of hits divided by the number of launches) and the trajectory of the random walks, ZENO computes the polarizability tensor, capacity, and intrinsic viscosity for an arbitrarily shaped object [27, 36]. One million particles were launched at each cell from the bounding sphere for determining the transport metrics. ZENO, originally written in FORTRAN, was rewritten in C++ and parallelized to execute the massive number of random walks required for the calculations for 969 Z-stacks [37] (https://doi.org/10.18434/T48W2J). The 3D renderings of the cell surface hit density maps were generated from “.obj” files using MeshLab (v1.3.3, http://sourceforge.net/projects/meshlab/files/).
Fig. 2.
Diagram of how the probabilistic ZENO program operates. Each 3D cell was enclosed with a bounding sphere and 1 million particles were launched from random locations on the bounding sphere towards the cell. The particles were random-walked until they either hit the cell surface or hit the bounding sphere.
2.3. Verification of results
The algorithms used to calculate shape metrics were verified using a synthetic in silico Z-stack of a 3D sphere whose voxel dimensions matched that used for the confocal imaging of the cells (Fig. S5). To assess the performance of the confocal imaging and image analysis pipeline, fluorescent microspheres with known diameter distributions were imaged and analyzed (Fig. S5).
2.4. Statistical analysis
Approximately 100 cells were imaged and analyzed for each of the ten groups. Minitab 17 was used for statistical analyses. Anderson-Darling test was used for assessing the normality of the data distributions. Since the data were generally non-normally distributed, the Kruskal-Wallis test, which compares medians, was used for statistical analyses.
3. Results
3.1. ZENO analysis
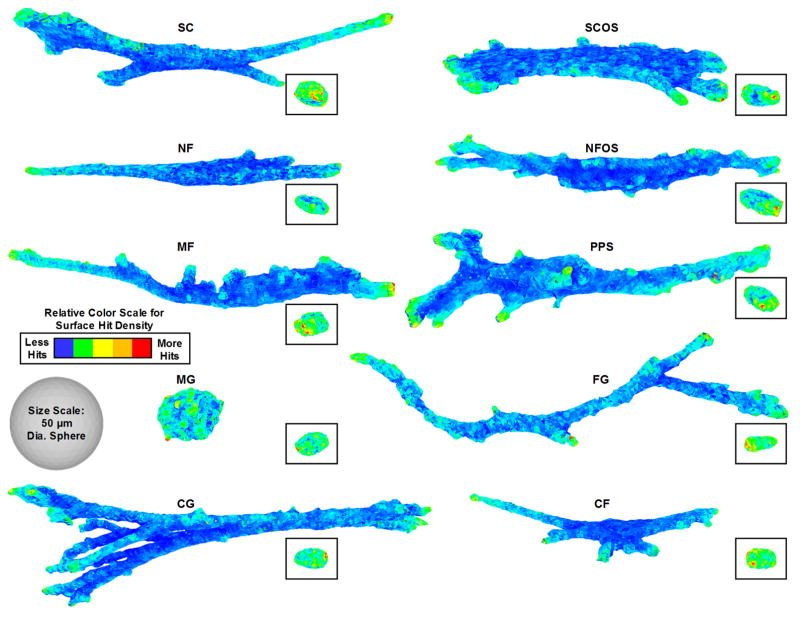
The ZENO program was used to determine ten shape metrics (Table 2). 3D surface hit density maps for representative cells from each of the 10 treatment groups are shown in Fig. 3. The red areas indicate regions on the cell with greater hits where there will be a high flux of diffusing growth factors or nutrients. The high-flux areas occur on the cell extensions away from the cell centroid.
Table 2.
Description of Shape Metrics
| Shape Metric | Description |
|---|---|
| P1 | Shortest eigenvalue of the polarizability tensor |
| P2 | Middle eigenvalue of the polarizability tensor |
| P3 | Longest eigenvalue of the polarizability tensor |
| P3/P1 | Ratio of P3 to P1 |
| P3/P2 | Ratio of P3 to P2 |
| P2/P1 | Ratio of P2 to P1 |
| Polarizability Trace (PCell or PNuc) | P1 + P2 + P3 |
| Capacitance (CCell or CNuc) | Steady-state solution of the Laplace equation |
| Normalized Capacitance | Capacitance divided by cell volume |
| Intrinsic Viscosity | Measure of a solute’s contribution to the viscosity of a solution |
Fig. 3.
3D cell surface hit density maps. A representative cell from each of the 10 treatments is shown. Insets show the cell nuclei. Color scales are relative to each cell and red indicates regions of high ligand and nutrient flux.
3.2. Polarizability and capacitance
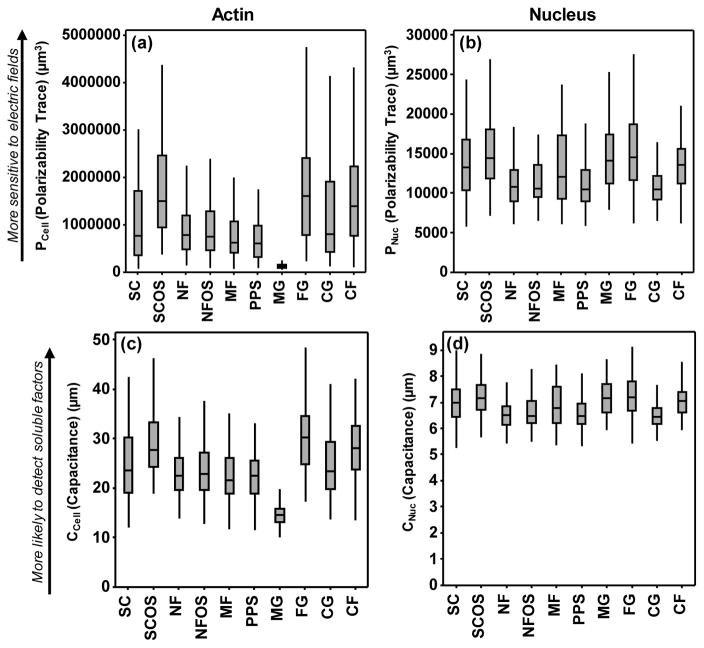
Box and whisker plots for the cell shape metrics are in Fig. 4 and Fig. S1 with statistical analyses in Fig. S2. The Kruskal-Wallis non-parametric test, which compares medians, was used for statistical testing since the cell shape data were non-normally distributed (Fig. S3). There were many differences in PCell (the trace of the polarizability tensor) and CCell for the different microenvironments. PCell describes the propensity of charges on a conductive object to redistribute when exposed to an electric field [27]. Electric fields are ubiquitous and large in living systems and serve as cues to direct cell behavior, wound healing and regeneration [28–32]. In the case of a cell, these charges include the counterions in proximity to the cell membrane. CCell describes the likelihood that a diffusing molecule will collide with an object [36, 41] and these data are relevant to signaling molecules, such as hormones or growth factors, which may diffuse through the medium until they encounter a cell. For a given volume, a sphere shape has the lowest PCell and CCell [27, 35]. For a given shape, a larger volume has a higher PCell and CCell. Cells in MG were the most spherical and had the lowest PCell and CCell. Cells in FG had extended shapes, the largest volume and the highest PCell and CCell. These elongated cell shapes, that often include cell extensions or pseudopodia, improve the odds that a diffusing molecule will collide with a cell.
Fig. 4.
Plots of the polarizability trace for (a) actin and (b) nucleus and of capacitance for (c) actin and (d) nucleus. The trace (referred to as polarizability or PCell) is the sum of the principal moments of the polarizability tensor (P1+ P2+ P3). A larger trace indicates higher propensity to detect and be perturbed by electric fields. Capacitance represents the likelihood that a random-walked particle launched from a bounding sphere collides with the cell, and describes the likelihood that a soluble factor in the cellular microenvironment would collide with the cell. Plots indicate median with boxes marking the first and third quartiles and whiskers marking the range. Approximately 100 cells were imaged for each scaffold (see Table 1). There were many statistically significant differences in the data which have been omitted for clarity. A full statistical analysis is given in Fig. S2.
The data afford several enlightening comparisons. The three natural hydrogels (MG, FG, CG) are significantly different from one another for PCell and CCell. The “red circles” in Fig. S2 identify these comparisons. FG yielded cell shapes that would be the most sensitive to electric signals (highest PCell) and would be the most likely to detect soluble signals (highest CCell) (Fig. 4a,c). Next, the same lot of collagen was processed into both planar films of fibrils (CF) and into 3D hydrogels (CG). PCell and CCell were significantly higher for cells on CF (“orange star” in Fig. S2), suggesting that culturing cells on collagen fibrils (CF), instead of in collagen gels (CG), may increase cell sensitivity to electric fields and to soluble signals.
Third, NF and SC were tested with and without the addition of osteogenic differentiation supplements (OS). For nanofibers (NF vs. NF+OS), the addition of OS had little effect on cell shape and there was not a significant difference in PCell or CCell (“green diamond” in Fig. S2). However, for films (SC vs. SC+OS), the addition of OS caused a significant increase in PCell and CCell (“purple triangle” in Fig. S2), indicating that soluble factors may also influence cell shape. A final set of groupings (“blue squares”) contrasts planar substrates (SC, CF) with scaffolds (NF, MF, PPS, MG, FG, CG), excluding the OS treatments (SC+OS and NF+OS). Planar substrates had higher PCell and CCell than all the scaffold treatments except for FG (Fig. 4). Thus, in general, cells on planar substrates may have shapes that enhance their sensitivity to electric fields and soluble signals..
3.3. Effective dimensionality
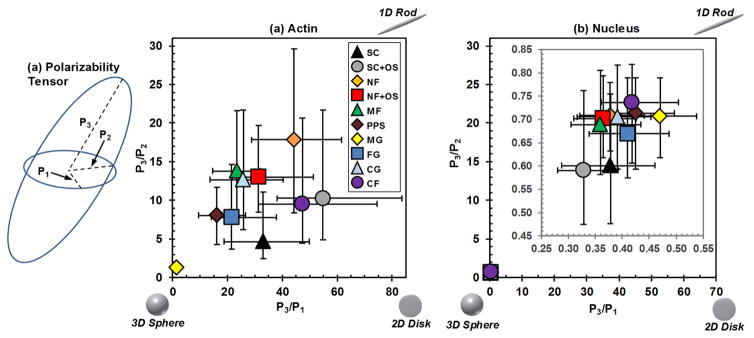
The principal moments of the polarizability tensor define the semi-axis lengths of an ellipsoid that approximates shape of a 3D cell (Fig. 5a). The relative lengths of the ellipsoid semi-axes determine the effective cell dimensionality [42, 43], much like “aspect ratio” describes the shape of a 2D object. The ratios of the semi-axes of the ellipsoids can be displayed in a “dimensionality plot” where objects are organized so that the spherical shapes are in the bottom left, planar shapes are on the bottom right and elongated shapes are in the top right (Fig. 5b).
Fig. 5.
(a) The principal moments of the polarizability tensor yield a characteristic ellipsoid for each cell where P1 is the shortest semi-axis, P2 is the middle semi-axis and P3 is the longest semi-axis. (b,c) A polarizability “dimensionality” plot is constructed by plotting the ratios of the lengths of the semi-axes, where the upper right corner has more 1D-character (rod), bottom right corner has more 2D-character (disk) and bottom left corner has more 3D-character (sphere). Polarizability “dimensionality” plots are shown for (b) actin and (c) nucleus. (c) Inset: Since the nucleus data were tightly clustered, the inset provides an expanded view of the data. Data are median with first and third quartiles. Approximately 100 cells were imaged for each scaffold (see Table 1). Statistical analysis is in Fig. S2. There were many statistically significant differences in the data which have been omitted for clarity. A full statistical analysis is given in Fig. S2.
Cells from planar substrates (SC, SC+OS, CF) were closest to the bottom right “2D” corner of the polarizability dimensionality plot. MG was closest to the bottom left “3D” corner having the most spherical morphology. NF was closest to the upper right “1D” corner with the most elongated shape. In the case of a diffusible signaling molecule that emanates from the cell membrane and decays due to an inactivation event, such as dephosphorylation by a cytoplasmic phosphatase, signal strength can be enhanced in cells with a flat morphology [13]. Thus, these types of signals may be strengthened in cells on planar substrates (SC, SC+OS, CF), which have greater 2D character (Fig. 5a). The elongated, 1D-like shape observed for hBMSCs on NF was in agreement with two previous studies [44, 45].
Dimensionality can perturb the reaction and diffusion of soluble ligands and receptors in the cell membrane [15]. In the case of a growth factor binding to a membrane receptor, gradients of signaling molecules may form inside elongated cells that are not observed for spherical cells, which can lead to a stronger signal for elongated cells. Thus, these types of signals may be enhanced for cells on NF, since these cells on NF had the most 1D-character in the dimensionality plots (Fig. 5a).
3.4. Cell shape distributions
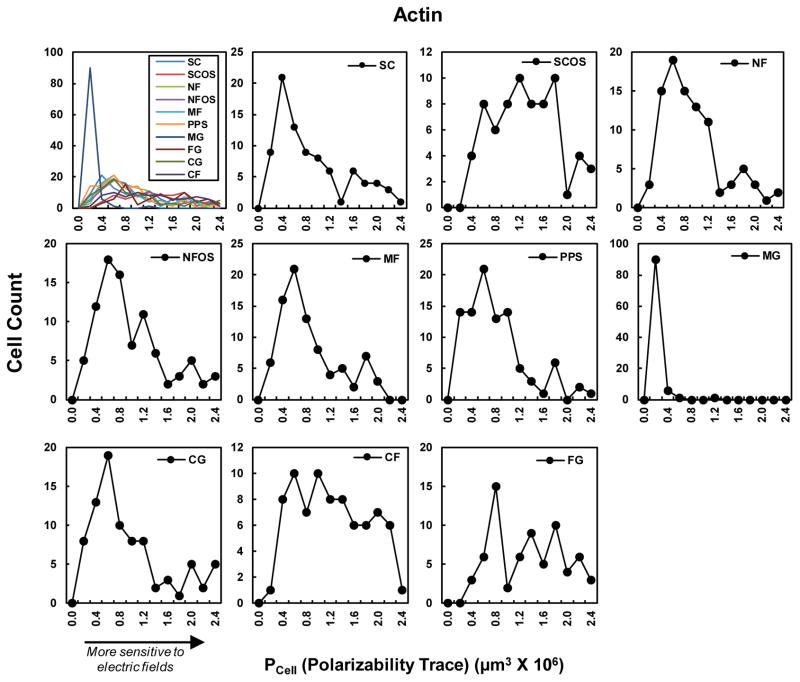
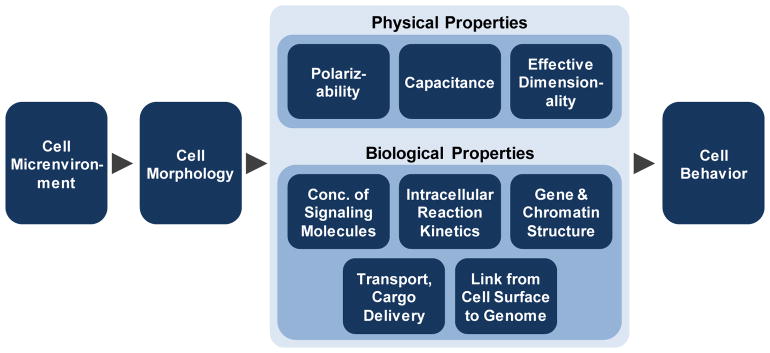
Fig. 6 shows the cell shape distributions for the Polarizability Trace (PCell). The shape distribution is an inherent property of a cell population and captures the state or “fingerprint” of the population. hBMSCs in MG had a very narrow distribution of polarizabilities, while cells from CF, SCOS and FG had a broad distribution. Cells from SC, NF, NFOS, MF, PPS, and CG had a peak with a tail off the to the right. The cells in these right-hand tails have larger polarizabilities would be more sensitive to the electric fields. It is tempting to consider how this heterogeneity in the cell shape population could affect cell behavior. One could imagine that the more polarizable cells, which are present in lower abundance, could serve as “sentinel” cells. These sentinel cells may more ably detect weak electric fields and then signal to the more abundant but less polarizable cells. Fig. 7 provides an overview of how different types of physical phenomena may contribute to the relationship between the scaffold, cell shape, and biological outcomes [11–18, 21].
Fig. 6.
Histograms of cell shape (actin) distributions for Polarizability Trace. Each histogram has approximately 100 cells (see Table 1). The Anderson-Darling normality test indicated that none of the Polarizability Trace distributions were Gaussian (Fig. S3).
Fig. 7.
Relationship between microenvironment, cell morphology and cell behavior. Microenvironmental cues, such as substrate or scaffold, influence cell morphology. Cell morphology affects physical properties of the cell, such as polarizability, capacitance and effective dimensionality, which were assessed in the current work. Microenvironmental cues may also affect biological properties such as concentrations of intracellular signaling molecules, reaction kinetics (diffusion times), structure of gene promoters and chromatin, cargo delivery times via molecular motors and the physical link between the extracellular matrix and the nuclear genome. These effects of cell shape on physical and biological properties can guide cell behavior.
3.5. Nucleus shape
The scaffold substrate can influence the shape of the nucleus to affect gene expression and cell function [16, 46–48]. The hit density maps for representative nuclei are shown Fig. 3 Insets and demonstrate that nuclei generally had ellipsoidal, 3D-like shapes for all the tested conditions. The polarizability and capacitance for nuclei (Fig. 4b,c; Fig. S1b) were smaller than for the cell body, which is to be expected since nuclei are much smaller. The nuclei from the different treatments are more tightly grouped than the cell body data, indicating less variance in polarizability and capacitance. In the dimensionality plot (Fig. 5b), the nuclei data points overlap in the bottom left corner, indicating that nuclei had a similar ellipsoidal, 3D-like shape. The nuclei Polarizability Trace distributions for the different scaffolds were narrower and more uniform than for the cell body.
4. Discussion
The 10 scaffolds/treatments that were tested herein represent a wide range of chemistries and structures that can influence cell function. Cells interact with materials through cell surface adhesion receptors such as integrins. For synthetic polymers (PCL for SC, SCOS, NF, NFOS and MF; polystyrene for PPS), the adhesion receptors will interact with adhesive proteins that adsorb to the polymer. Adhesive proteins in serum that can adsorb to polymers include fibrinogen, vitronectin and osteopontin. For the natural materials, the adhesion molecules will bind to the proteins that comprise the material: fibrin for FG, laminin for MG and collagen for CG and CF. hBMSCs express integrin dimers that could mediate adhesion to each of these proteins: α1β1, (collagen, laminin), α2β1 (collagen, laminin), α5β1 (fibrin, osteopontin), α6β1 (laminin), αVβ3 (fibrin, vitronectin, laminin) and αVβ5 (osteopontin, vitronectin) [49–51]. Testing of hBMSC adhesion to proteins adsorbed to culture dishes indicated that hBMSCs can adhere to vitronectin, fibronectin, laminin, collagen I, collagen III and collagen IV [50]. Different cell types may express their own complement of surface adhesion molecules which may affect response to the different microenvironments. Cell types that are more closely related to hBMSCs may respond similarly, while more distantly related cell types may respond more differently.
The current work addressed the 3D shape of individual cells that were cultured for 24 h. For future work, it may be insightful to determine how 3D cell shape changes during longer term culture when the cells proliferate, contact one another and form clusters. This may require a new experimental design where boundaries between cells within a cluster can be determined.
Significant differences in polarizability and capacitance were calculated for the 3D cell shapes observed in the different microenvironments. Using piezoelectric fibrous scaffolds, Damaraju et al. found that low voltage output scaffolds potentiated chondrogenic differentiation of hBMSCs and that high voltage output scaffolds promoted osteogenic differentiation. It is noteworthy that chondrocytes have a spherical morphology [5] and the results herein showed that the most spherical cells (MG) had the lowest polarizability (Fig. 4a). In contrast, culturing hBMSCs on nanofibers enhances their osteogenic differentiation [23–25], and induces an elongated morphology (Fig. 5a) [23, 45] with higher polarizability (Fig. 4a). These observations suggest that cell shapes that are more sensitive to electrical fields (higher polarizability) may promote osteogenic differentiation (or suppress chondrogenic differentiation). These results provide fertile ground for developing hypotheses that can be tested in future studies. It could be insightful to measure cell capacitance and polarizability during culture in different types of scaffolds to see how this relates to their differentiation.
5. Summary
There is a complex interplay between the microenvironment, cell shape and cell function, which has been challenging to unravel. Several physical phenomena contribute to these relationships. The current work presents a quantitative examination of the 3D shape of hBMSCs in a variety of biomaterial microenvironments. These results suggest that transport phenomena, polarizability and capacitance, may be critical to this interplay. The current data indicate that scaffolds elicit characteristic cellular morphotypes and that the PCell of the representative cellular morphotype for each scaffold may determine how the cells in the scaffold sense and respond to electric fields. Likewise, the CCell of the cellular morphotype from each scaffold may affect the propensity that diffusing soluble factors will collide with cells in the scaffold. These data provide new hypotheses to link cell shape and cell behavior, which may be leveraged when engineering scaffolds: the scaffold may be designed to elicit cellular morphotypes with the desired PCell and CCell. Further, these findings provide a rationale to explore how cell PCell and CCell may be engineered to optimize tissue regeneration through scaffold design or other microenvironmental advancements.
Supplementary Material
Acknowledgments
SJF was supported by NIST-NRC Research Associateships. The authors acknowledge Charles Camp (NIST) for input on imaging, Nathan Hotaling (NIST) for input on statistics, Young Jong Lee (NIST) for assistance with plotting and Elissa Williams (NIST) for assistance with atomic force microscopy. For assistance with the 3D web-based visualization, we acknowledge Andrew Wang (NIST) and Jacob Siegel (NIST) and the support of the NIST Summer High School Internship Program (SHIP) and the Summer Undergraduate Research Fellowship programs. Christopher Lee (NIST) was supported by the NIST Summer High School Internship Program. The hBMSCs employed in this work were obtained from the Tulane Center for Gene Therapy (NCRR-NIH P40RR017447). Quartiles are the same as the “combined standard uncertainty of the mean” for the purposes of this work. This article, a contribution of NIST, is not subject to US copyright. Certain equipment and instruments or materials are identified in the paper to adequately specify the experimental details. Such identification does not imply recommendation by NIST, nor does it imply the materials are necessarily the best available for the purpose.
References
- 1.Chen CS, Mrksich M, Huang S, Whitesides GM, Ingber DE. Geometric Control of Cell Life and Death. Science. 1997;276:1425–1428. doi: 10.1126/science.276.5317.1425. [DOI] [PubMed] [Google Scholar]
- 2.McBeath R, Pirone DM, Nelson CM, Bhadriraju K, Chen CS. Cell shape, cytoskeletal tension, and RhoA regulate stem cell lineage commitment. Developmental Cell. 2004;6:483–495. doi: 10.1016/s1534-5807(04)00075-9. [DOI] [PubMed] [Google Scholar]
- 3.Dalby MJ, Gadegaard N, Tare R, Andar A, Riehle MO, Herzyk P, Wilkinson CD, Oreffo RO. The control of human mesenchymal cell differentiation using nanoscale symmetry and disorder. Nat Mater. 2007;6:997–1003. doi: 10.1038/nmat2013. [DOI] [PubMed] [Google Scholar]
- 4.Kilian KA, Bugarija B, Lahn BT, Mrksich M. Geometric cues for directing the differentiation of mesenchymal stem cells. Proceedings of the National Academy of Sciences. 2010;107:4872–4877. doi: 10.1073/pnas.0903269107. [DOI] [PMC free article] [PubMed] [Google Scholar]
- 5.Ross MH, Reith EJ, Romrell LJ. Histology, A Text and Atlas. 2. Williams & Wilkins; Baltimore, MD: 1989. [Google Scholar]
- 6.Florczyk SJ, Simon M, Juba D, Pine PS, Sarkar S, Chen D, Baker PJ, Bodhak S, Cardone A, Brady MC, Bajcsy P, Simon JCG. A bioinformatics 3D cellular morphotyping strategy for assessing biomaterial scaffold niches. ACS Biomaterials Science & Engineering. 2017;3:2301–2313. doi: 10.1021/acsbiomaterials.7b00473. [DOI] [PMC free article] [PubMed] [Google Scholar]
- 7.Liao S, Nguyen LTH, Ngiam M, Wang C, Cheng Z, Chan CK, Ramakrishna S. Biomimetic nanocomposites to control osteogenic differentiation of human mesenchymal stem cells. Adv Healthcare Mater. 2014;3:737–751. doi: 10.1002/adhm.201300207. [DOI] [PubMed] [Google Scholar]
- 8.Florczyk SJ, Leung M, Li Z, Huang JI, Hopper RA, Zhang M. Evaluation of three-dimensional porous chitosan-alginate scaffolds in rat calvarial defects for bone regeneration applications. Journal of Biomedical Materials Research Part A. 2013;101:2974–2983. doi: 10.1002/jbm.a.34593. [DOI] [PubMed] [Google Scholar]
- 9.Chatterjee K, Lin-Gibson S, Wallace WE, Parekh SH, Lee YJ, Cicerone MT, Young MF, Simon CG., Jr The effect of 3D hydrogel scaffold modulus on osteoblast differentiation and mineralization revealed by combinatorial screening. Biomaterials. 2010;31:5051–5062. doi: 10.1016/j.biomaterials.2010.03.024. [DOI] [PMC free article] [PubMed] [Google Scholar]
- 10.Khetan S, Guvendiren M, Legant WR, Cohen DM, Chen CS, Burdick JA. Degradation-mediated cellular traction directs stem cell fate in covalently crosslinked three-dimensional hydrogels. Nature Materials. 2013;12:458–465. doi: 10.1038/nmat3586. [DOI] [PMC free article] [PubMed] [Google Scholar]
- 11.Else PL, Hulbert AJ. Comparison of the “mammal machine” and the “reptile machine”: energy production. Am J Physiol. 1981;240:R3–9. doi: 10.1152/ajpregu.1981.240.1.R3. [DOI] [PubMed] [Google Scholar]
- 12.Koch AL. What size should a bacterium be? A question of scale. Annu Rev Microbiol. 1996;50:317–348. doi: 10.1146/annurev.micro.50.1.317. [DOI] [PubMed] [Google Scholar]
- 13.Meyers J, Craig J, Odde DJ. Potential for control of signaling pathways via cell size and shape. Curr Biol. 2006;16:1685–1693. doi: 10.1016/j.cub.2006.07.056. [DOI] [PubMed] [Google Scholar]
- 14.Chan YH, Marshall WF. Scaling properties of cell and organelle size. Organogenesis. 2010;6:88–96. doi: 10.4161/org.6.2.11464. [DOI] [PMC free article] [PubMed] [Google Scholar]
- 15.Rangamani P, Lipshtat A, Azeloglu EU, Calizo RC, Hu M, Ghassemi S, Hone J, Scarlata S, Neves SR, Iyengar R. Decoding information in cell shape. Cell. 2013;154:1356–1369. doi: 10.1016/j.cell.2013.08.026. [DOI] [PMC free article] [PubMed] [Google Scholar]
- 16.Tutak W, Jyotsnendu G, Bajcsy P, Simon CG., Jr Nanofiber scaffolds influence organelle structure and function in bone marrow stromal cells. J Biomed Mater Res B Appl Biomater. 2016 doi: 10.1002/jbm.b.33624. [DOI] [PMC free article] [PubMed] [Google Scholar]
- 17.Bidwell JP, Alvarez M, Feister H, Onyia J, Hock J. Nuclear matrix proteins and osteoblast gene expression. J Bone Miner Res. 1998;13:155–167. doi: 10.1359/jbmr.1998.13.2.155. [DOI] [PubMed] [Google Scholar]
- 18.Khatau SB, Hale CM, Stewart-Hutchinson PJ, Patel MS, Stewart CL, Searson PC, Hodzic D, Wirtz D. A perinuclear actin cap regulates nuclear shape. Proc Natl Acad Sci U S A. 2009;106:19017–19022. doi: 10.1073/pnas.0908686106. [DOI] [PMC free article] [PubMed] [Google Scholar]
- 19.Wang N, Tytell JD, Ingber DE. Mechanotransduction at a distance: mechanically coupling the extracellular matrix with the nucleus. Nat Rev Mol Cell Biol. 2009;10:75–82. doi: 10.1038/nrm2594. [DOI] [PubMed] [Google Scholar]
- 20.Halder G, Dupont S, Piccolo S. Transduction of mechanical and cytoskeletal cues by YAP and TAZ. Nat Rev Mol Cell Biol. 2012;13:591–600. doi: 10.1038/nrm3416. [DOI] [PubMed] [Google Scholar]
- 21.Chambliss AB, Khatau SB, Erdenberger N, Robinson DK, Hodzic D, Longmore GD, Wirtz D. The LINC-anchored actin cap connects the extracellular milieu to the nucleus for ultrafast mechanotransduction. Sci Rep. 2013;3:1087. doi: 10.1038/srep01087. [DOI] [PMC free article] [PubMed] [Google Scholar]
- 22.Mendicino M, Bailey AM, Wonnacott K, Puri RK, Bauer SR. MSC-based product characterization for clinical trials: an FDA perspective. Cell Stem Cell. 2014;14:141–145. doi: 10.1016/j.stem.2014.01.013. [DOI] [PubMed] [Google Scholar]
- 23.Kumar G, Tison CK, Chatterjee K, Pine PS, McDaniel JH, Salit ML, Young MF, Simon CG., Jr The determination of stem cell fate by 3D scaffold structures through the control of cell shape. Biomaterials. 2011;32:9188–9196. doi: 10.1016/j.biomaterials.2011.08.054. [DOI] [PMC free article] [PubMed] [Google Scholar]
- 24.Ruckh TT, Kumar K, Kipper MJ, Popat KC. Osteogenic differentiation of bone marrow stromal cells on poly(epsilon-caprolactone) nanofiber scaffolds. Acta Biomaterialia. 2010;6:2949–2959. doi: 10.1016/j.actbio.2010.02.006. [DOI] [PubMed] [Google Scholar]
- 25.Sarkar S, Baker BA, Chen D, Pine PS, McDaniel JH, Salit ML, Losert W, Simon CG, Dunkers J. Roles of nanofiber scaffold structure and chemistry in directing human bone marrow stromal cell response. Advances in Tissue Engineering and Regenerative Medicine. 2016;1:00003. [Google Scholar]
- 26.Adam G, Delbruck M. Structural Chemistry and Molecular Biology. W. H. Freeman and Co; San Francisco, CA: 1968. Reduction of dimensionality in biological diffusion processes. [Google Scholar]
- 27.Mansfield ML, Douglas JF, Garboczi EJ. Intrinsic viscosity and the electrical polarizability of arbitrarily shaped objects. Phys Rev E Stat Nonlin Soft Matter Phys. 2001;64:061401. doi: 10.1103/PhysRevE.64.061401. [DOI] [PubMed] [Google Scholar]
- 28.Borgens RB, Vanable JW, Jr, Jaffe LF. Bioelectricity and regeneration: large currents leave the stumps of regenerating newt limbs. Proc Natl Acad Sci U S A. 1977;74:4528–4532. doi: 10.1073/pnas.74.10.4528. [DOI] [PMC free article] [PubMed] [Google Scholar]
- 29.Song B, Zhao M, Forrester JV, McCaig CD. Electrical cues regulate the orientation and frequency of cell division and the rate of wound healing in vivo. Proc Natl Acad Sci U S A. 2002;99:13577–13582. doi: 10.1073/pnas.202235299. [DOI] [PMC free article] [PubMed] [Google Scholar]
- 30.Zhao M, Song B, Pu J, Wada T, Reid B, Tai G, Wang F, Guo A, Walczysko P, Gu Y, Sasaki T, Suzuki A, Forrester JV, Bourne HR, Devreotes PN, McCaig CD, Penninger JM. Electrical signals control wound healing through phosphatidylinositol-3-OH kinase-gamma and PTEN. Nature. 2006;442:457–460. doi: 10.1038/nature04925. [DOI] [PubMed] [Google Scholar]
- 31.Adams DS, Masi A, Levin M. H+ pump-dependent changes in membrane voltage are an early mechanism necessary and sufficient to induce Xenopus tail regeneration. Development. 2007;134:1323–1335. doi: 10.1242/dev.02812. [DOI] [PubMed] [Google Scholar]
- 32.Messerli MA, Graham DM. Extracellular electrical fields direct wound healing and regeneration. Biol Bull. 2011;221:79–92. doi: 10.1086/BBLv221n1p79. [DOI] [PubMed] [Google Scholar]
- 33.Valentini RF, Vargo TG, Gardella JA, Jr, Aebischer P. Electrically charged polymeric substrates enhance nerve fibre outgrowth in vitro. Biomaterials. 1992;13:183–190. doi: 10.1016/0142-9612(92)90069-z. [DOI] [PubMed] [Google Scholar]
- 34.Bodhak S, Bose S, Bandyopadhyay A. Electrically polarized HAp-coated Ti: in vitro bone cell-material interactions. Acta Biomater. 2010;6:641–651. doi: 10.1016/j.actbio.2009.08.008. [DOI] [PubMed] [Google Scholar]
- 35.Pólya G, Szegő Gb. Isoperimetric inequalities in mathematical physics. Princeton University Press; Princeton, NJ: 1951. [Google Scholar]
- 36.Douglas JF, Zhou HX, Hubbard JB. Hydrodynamic friction and the capacitance of arbitrarily shaped objects. Phys Rev E Stat Phys Plasmas Fluids Relat Interdiscip Topics. 1994;49:5319–5331. doi: 10.1103/physreve.49.5319. [DOI] [PubMed] [Google Scholar]
- 37.Juba D, Audus DJ, Mascagni M, Douglas JF, Keyrouz W. ZENO: Software for calculating hydrodynamic, electrical, and shape properties of polymer and particle suspensions. Journal of Research of National Institute of Standards and Technology. 2017;122:1–2. doi: 10.6028/jres.122.020. [DOI] [PMC free article] [PubMed] [Google Scholar]
- 38.Lee GY, Kenny PA, Lee EH, Bissell MJ. Three-dimensional culture models of normal and malignant breast epithelial cells. Nat Methods. 2007;4:359–365. doi: 10.1038/nmeth1015. [DOI] [PMC free article] [PubMed] [Google Scholar]
- 39.Elliott JT, Halter M, Plant AL, Woodward JT, Langenbach KJ, Tona A. Evaluating the performance of fibrillar collagen films formed at polystyrene surfaces as cell culture substrates. Biointerphases. 2008;3:19–28. doi: 10.1116/1.2912936. [DOI] [PubMed] [Google Scholar]
- 40.Bajcsy P, Simon M, Florczyk SJ, Simon CG, Jr, Juba D, Brady MC. A method for the evaluation of thousands of automated 3D stem cell segmentations. J Microsc. 2015;260:363–376. doi: 10.1111/jmi.12303. [DOI] [PMC free article] [PubMed] [Google Scholar]
- 41.Berg HC, Purcell EM. Physics of chemoreception. Biophys J. 1977;20:193–219. doi: 10.1016/S0006-3495(77)85544-6. [DOI] [PMC free article] [PubMed] [Google Scholar]
- 42.Farooque TM, Camp CH, Jr, Tison CK, Kumar G, Parekh SH, Simon CG., Jr Measuring stem cell dimensionality in tissue scaffolds. Biomaterials. 2014;35:2558–2567. doi: 10.1016/j.biomaterials.2013.12.092. [DOI] [PubMed] [Google Scholar]
- 43.Carter Y, Thomas CD, Clement JG, Peele AG, Hannah K, Cooper DM. Variation in osteocyte lacunar morphology and density in the human femur--a synchrotron radiation micro-CT study. Bone. 2013;52:126–132. doi: 10.1016/j.bone.2012.09.010. [DOI] [PubMed] [Google Scholar]
- 44.Marklein RA, Lo Surdo JL, Bellayr IH, Godil SA, Puri RK, Bauer SR. High Content Imaging of Early Morphological Signatures Predicts Long Term Mineralization Capacity of Human Mesenchymal Stem Cells upon Osteogenic Induction. Stem Cells. 2016;34:935–947. doi: 10.1002/stem.2322. [DOI] [PubMed] [Google Scholar]
- 45.Chen D, Sarkar S, Candia J, Florczyk SJ, Bodhak S, Driscoll MK, Simon CG, Jr, Dunkers JP, Losert W. Machine learning based methodology to identify cell shape phenotypes associated with microenvironmental cues. Biomaterials. 2016;104:104–118. doi: 10.1016/j.biomaterials.2016.06.040. [DOI] [PMC free article] [PubMed] [Google Scholar]
- 46.Wang N, Tytell JD, Ingber DE. Mechanotransduction at a distance: mechanically coupling the extracellular matrix with the nucleus. Nat Rev Mol Cell Biol. 2009;10:75–82. doi: 10.1038/nrm2594. [DOI] [PubMed] [Google Scholar]
- 47.Khatau SB, Hale CM, Stewart-Hutchinson PJ, Patel MS, Stewart CL, Searson PC, Hodzic D, Wirtz D. A perinuclear actin cap regulates nuclear shape. Proc Natl Acad Sci U S A. 2009;106:19017–19022. doi: 10.1073/pnas.0908686106. [DOI] [PMC free article] [PubMed] [Google Scholar]
- 48.Halder G, Dupont S, Piccolo S. Transduction of mechanical and cytoskeletal cues by YAP and TAZ. Nat Rev Mol Cell Biol. 2012;13:591–600. doi: 10.1038/nrm3416. [DOI] [PubMed] [Google Scholar]
- 49.Plow EF, Haas TA, Zhang L, Loftus J, Smith JW. Ligand binding to integrins. J Biol Chem. 2000;275:21785–21788. doi: 10.1074/jbc.R000003200. [DOI] [PubMed] [Google Scholar]
- 50.Gronthos S, Simmons PJ, Graves SE, Robey PG. Integrin-mediated interactions between human bone marrow stromal precursor cells and the extracellular matrix. Bone. 2001;28:174–181. doi: 10.1016/s8756-3282(00)00424-5. [DOI] [PubMed] [Google Scholar]
- 51.Humphries JD, Byron A, Humphries MJ. Integrin ligands at a glance. J Cell Sci. 2006;119:3901–3903. doi: 10.1242/jcs.03098. [DOI] [PMC free article] [PubMed] [Google Scholar]
Associated Data
This section collects any data citations, data availability statements, or supplementary materials included in this article.


