Significance
We increasingly rely on global models to project impacts of humans and climate on water resources. How reliable are these models? While past model intercomparison projects focused on water fluxes, we provide here the first comprehensive comparison of land total water storage trends from seven global models to trends from Gravity Recovery and Climate Experiment (GRACE) satellites, which have been likened to giant weighing scales in the sky. The models underestimate the large decadal (2002–2014) trends in water storage relative to GRACE satellites, both decreasing trends related to human intervention and climate and increasing trends related primarily to climate variations. The poor agreement between models and GRACE underscores the challenges remaining for global models to capture human or climate impacts on global water storage trends.
Keywords: global hydrological models, land surface models, GRACE satellites, terrestrial total water storage anomalies, global mean sea level
Abstract
Assessing reliability of global models is critical because of increasing reliance on these models to address past and projected future climate and human stresses on global water resources. Here, we evaluate model reliability based on a comprehensive comparison of decadal trends (2002–2014) in land water storage from seven global models (WGHM, PCR-GLOBWB, GLDAS NOAH, MOSAIC, VIC, CLM, and CLSM) to trends from three Gravity Recovery and Climate Experiment (GRACE) satellite solutions in 186 river basins (∼60% of global land area). Medians of modeled basin water storage trends greatly underestimate GRACE-derived large decreasing (≤−0.5 km3/y) and increasing (≥0.5 km3/y) trends. Decreasing trends from GRACE are mostly related to human use (irrigation) and climate variations, whereas increasing trends reflect climate variations. For example, in the Amazon, GRACE estimates a large increasing trend of ∼43 km3/y, whereas most models estimate decreasing trends (−71 to 11 km3/y). Land water storage trends, summed over all basins, are positive for GRACE (∼71–82 km3/y) but negative for models (−450 to −12 km3/y), contributing opposing trends to global mean sea level change. Impacts of climate forcing on decadal land water storage trends exceed those of modeled human intervention by about a factor of 2. The model-GRACE comparison highlights potential areas of future model development, particularly simulated water storage. The inability of models to capture large decadal water storage trends based on GRACE indicates that model projections of climate and human-induced water storage changes may be underestimated.
There has been an unprecedented increase in evaluation of global hydrology using models, as seen in the exponential increase in publications on these topics. For example, an Institute for Scientific Information Web of Science search of the topic “global hydrological models” (GHMs) yielded almost 4,000 papers since the year 2000 with ∼100,000 citations. However, many studies of global hydrology are based on single models. Although there are more and more multimodel studies, such studies are rarely used to explain historical trends. The greatly increased emphasis on global hydrology raises questions about the reliability of these models.
Understanding the origin of the global models is important because current applications of models may differ from the original model development goals. The term global hydrological models has been used to include both global land surface models (LSMs) and global hydrological and water resource models (GHWRMs) (1, 2). LSMs are defined as models that are integrated into general circulation models (3) and were originally developed by the atmospheric community to simulate fluxes from the land to the atmosphere because of linkages between the land surface and climate (1). Because of their emphasis on fluxes, LSMs may not accurately simulate water storage changes (4). GHWRMs were developed in response to global water scarcity concerns (1). Therefore, one of the primary differences between LSMs and GHWRMs is the more physical basis for LSMs, including water and energy balances, relative to the empirical water budget approaches of GHWRMs. In addition, GHWRMs model human water use, whereas most LSMs do not.
Remote sensing products are also used to assess global hydrology, such as Gravity Recovery and Climate Experiment (GRACE) satellite data (5). GRACE satellites have been likened to giant weighing scales in the sky that monitor monthly changes in mass as water storage increases or decreases related to climate variability and human impacts. GRACE satellites provide data on continental total water storage anomalies (TWSAs) globally since the satellites were launched in 2002. These satellites provide a more direct estimate than models of global changes in TWSAs that are derived from monitoring the time variable gravity field (5). The coarse spatial resolution of GRACE data (∼100,000 km2) may actually be a benefit when estimating changes in TWSAs at continental to global scales. GRACE data are considered to provide the “big picture” in terms of global water storage (6).
Quantifying global water storage trends from models or GRACE satellites is critical for assessing water availability. Land or terrestrial total water storage (TWS) includes the following components:
| [1] |
where SnWS refers to snow water storage, CWS is canopy water storage, SWS is surface water storage, SMS is soil moisture storage, and GWS is groundwater storage. Land water storage, defined by the Intergovernmental Panel on Climate Change (IPCC) as all components excluding glaciers and ice sheets (Greenland and Antarctica) (7), is equivalent to TWS in this study. By integrating all water storage components, TWS can be used to estimate water availability, which is critical for water resources management. Changes in continental TWS affect the water balance between land and oceans, impacting sea level changes (8). TWS changes are also used to evaluate climate extremes, including floods and droughts (9, 10). Surface water (SW) and groundwater (GW) are critical for human use and irrigation, whereas SM is essential for natural vegetation and crop production. Many LSMs only simulate snow and SMS compartments, whereas most GHWRMs simulate all storage compartments, excluding glaciers (Eq. 1 and Table 1).
Table 1.
Summary of attributes of different models used in this study
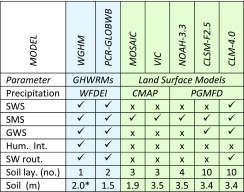 |
All models include SWS, CWS, and SMS compartments. C, CLSM-F2.5; CLM, CLM-4.0; CMAP, SI Appendix Acronyms; Hum. Int., human intervention; M, MOSAIC; N, NOAH-3.3; P, PCR-GLOBWB; Precip., precipitation; Soil lay. (no.), number of soil layers; SW rout., SW routing; V, VIC; W, WGHM.
*Soil thickness for WGHM ranges from 0.1 to 4.0 depending on land use type.
Important Role of Models and Remote Sensing in Global Hydrology
Applications of these global products are continually increasing. As Bierkens (1) highlights, GHWRMs are an integral part of global assessments of water resources conducted within the Global Water Systems Project; United Nations Educational, Scientific, and Cultural Organization World Water Assessment Program; and United Nations Environment Program Environmental Outlook. GHWRMs are used to evaluate global water availability and sustainability (11), water scarcity (12), and GW depletion (13, 14). Global Land Data Assimilation System (GLDAS) LSMs have been used to provide model initialization for forecasting (15) and for comparison to remotely sensed observations (16). Models have been used to assess the contribution of land TWSAs to global mean sea level (GMSL) change (17, 18). Models are required to develop projections of the impacts of climate change and human intervention on water resources (2, 19).
Reliability of GRACE Data and Global Models for Estimating Water Storage Trends
GRACE data have been used to validate global model output in many studies (20–22); however, some question the reliability of GRACE data for model validation. Advances in GRACE processing from traditional spherical harmonics to more recent mass concentration (mascon) solutions have increased the signal-to-noise ratio and reduced uncertainties (23–26). Changes in gravity monitored by GRACE satellites are interpreted as changes in water storage; however, declining TWSA trends in melting glaciers could reduce trends in neighboring basins because of leakage (SI Appendix, Fig. S1).
Model reliability is increasingly being evaluated using model intercomparison projects (MIPs). Recent studies have compared GHWRMs and LSMs for quantifying impacts of past and projected future climate on water resources (2, 27). Within the Water-MIP, results for naturalized flows [no human intervention (NHI)] (i.e., human water abstractions, reservoir management) from six LSMs and five GHWRMs forced with common climate data (1985–1999) show up to 40–60% variation in fluxes [evapotranspiration (ET): 60,000–85,000 km3/y, runoff: 42,000–66,000 km3/y] (27). The Inter-Sectoral Impact-MIP (ISIMIP; www.isimip.org) assesses climate impacts on water resources using 11 models, mostly GHWRMs (9), forced with a consistent set of global climate models (28). The ISIMIP shows that uncertainties in GHMs are as large as those in global climate models in some studies (2).
Study Objective
The objective of this study was to address the following questions:
-
i)
How do modeled water storage trends compare with those from GRACE solutions?
-
ii)
How does human intervention impact global water storage trends?
-
iii)
How well can we estimate the net impact of land storage trends on GMSL change?
(i) While hydrological MIPs have focused on water fluxes (e.g., ET, runoff) (19, 27) to date, we compare modeled approximately decadal TWSA trends (2002–2014) with trends from GRACE satellites to provide a comprehensive assessment of model reliability using TWSA. This study builds on a previous study that compared TWSA trends among different GRACE solutions (25). The focus on decadal TWSA trends (April 2002–December 2014) is important for future impact assessments related to climate and human intervention but contrasts with many previous model-GRACE comparisons that emphasize raw time series or seasonal variations (16, 21, 22). (ii) Evaluating impacts of human intervention on water storage trends is important for estimating future impacts but was not considered in the Water-MIP (27). This study focuses on past climate forcing on water storage trends, whereas many ISIMIP studies focus on impacts of climate projections on water fluxes (2, 28). Specific aspects of the current study include use of greatly improved GRACE mascon solutions (SI Appendix, section 2), whereas many previous studies relied on traditional GRACE spherical harmonic solutions that use LSMs in data processing (16, 21, 22, 29); inclusion of two widely used GHWRMs (WGHM and PCR-GLOBWB), along with five LSMs (GLDAS NOAH, MOSAIC, VIC, CLM, and CLSM) (SI Appendix, section 3); and analysis of 186 river basins relative to many previous studies that were limited to the largest 30–50 basins (21, 29) (Fig. 1). (iii) Many previous studies estimated land water storage impacts on sea level change from single models (17, 18, 30)* or GRACE data (31), whereas we use multiple models and GRACE solutions here. Global models have many degrees of freedom and are too complex to reliably isolate causes of differences between models and GRACE, as suggested in previous model intercomparisons (27, 32). However, we used output from the suite of models to assess impacts of storage compartments and capacity, climate forcing, and model calibration on modeled TWSA trends. This comprehensive comparison of TWSA trends from models and GRACE should provide a preliminary assessment of model-GRACE TWSA trends that can be used to guide future model development and GRACE processing.
Fig. 1.
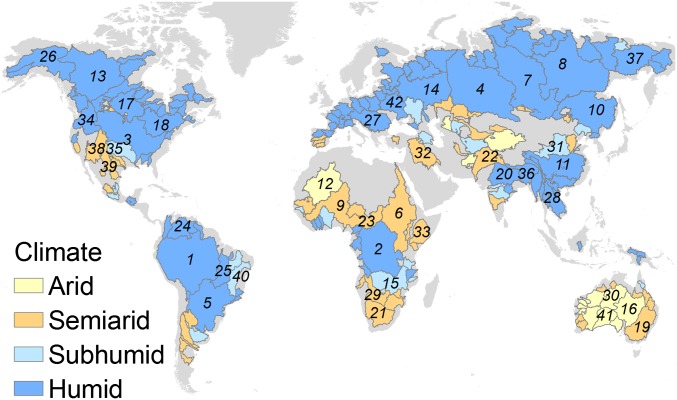
River basins (n = 186) examined in this study, with areas based on the Total Runoff Integrating Pathway (TRIP) database, with the 42 largest river basins (>500,000 km2) numbered and the associated aridity index (AI) based on the Koppen classification [14 basins in the arid class (AI: 0.0–0.2), 48 in the semiarid class (AI: 0.22–0.50), 20 in the subhumid class (AI: 0.50–0.65), and 104 in the humid class (AI > 0.65)]. The numbered river basins include the following: 1, Amazon; 2, Congo; 3, Mississippi; 4, Ob; 5, Parana; 6, Nile; 7, Yenisei; 8, Lena; 9, Niger; 10, Amur; 11, Yangtze; 12, Tamanrasset; 13, MacKenzie; 14, Volga; 15, Zambezi; 16, Lake Eyre; 17, Nelson; 18, St. Lawrence; 19, Murray; 20, Ganges; 21, Orange; 22, Indus; 23, Chari; 24, Orinoco; 25, Tocantins; 26, Yukon; 27, Danube; 28, Mekong; 29, Okavango; 30, Victoria; 31, Huang He (Yellow River); 32, Euphrates; 33, Jubba; 34, Columbia; 35, Arkansas; 36, Brahmaputra; 37, Kolyma; 38, Colorado; 39, Rio Grande; 40, Sao Francisco; 41, Nullarbor; and 42, Dnieper (SI Appendix, Table S3).
Results and Discussion
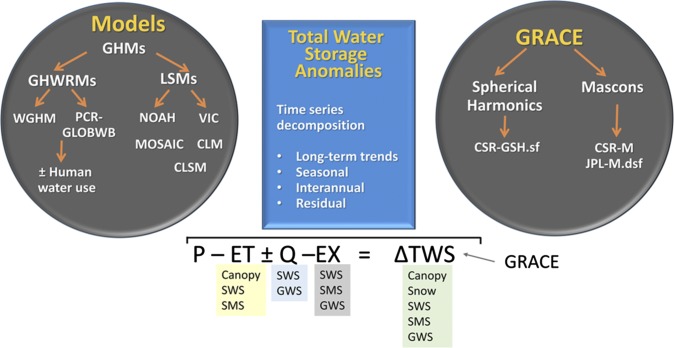
All acronyms are defined at the beginning of the SI Appendix. The GRACE solutions and models compared in this study are shown in a schematic (Fig. 2). The 186 river basins (83 × 106 km2) cover ∼63% of the total global land area, excluding Antarctica and Greenland. Basin areas range from 40,000–6,234,000 km2 (Amazon; Fig. 1). Model attributes are provided in Table 1 and SI Appendix, Table S2 and are described in SI Appendix, section 3.
Fig. 2.
Schematic depicting the data sources and analyses conducted in this study. See SI Appendix for acronyms. The water budget equation includes input from precipitation (P, snow and rain) and simulated output fluxes, including ET, runoff (Q), and extraction (EX). The storage compartments from which the fluxes derive include CWS, SWS, and SMS; Q from SWS; human EX from SWS and GWS; and residual total water storage (TWS), including all storages. Change in TWS (ΔTWS) is calculated as a residual, accumulating errors from all of the fluxes. GRACE estimates change in TWS more directly.
How Do Modeled TWSA Trends Compare with Those from GRACE Solutions?
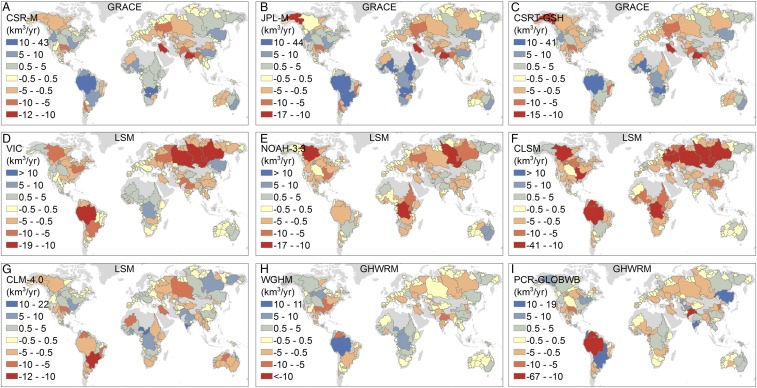
Global maps show mostly consistent TWSA trends for basins among the three GRACE solutions, with large differences among solutions for a limited number of basins (e.g., Mississippi, Parana, Yangtze, Nile basins) (Fig. 3 A–C and Table 2). TWSA trends refer to linear trends based on regression analysis (SI Appendix, section 1). The focus is on volumetric TWSA trends (cubic kilometers per year) because this study emphasizes continental- to global-scale TWSA trends; however, basin-averaged trends in equivalent water thickness (millimeters per year) are also provided (SI Appendix, Fig. S7 and Table S4).
Fig. 3.
TWSA trends expressed in volume (cubic kilometers per year) from three GRACE solutions: CSR-M (A), JPL-M.dsf (B), and CSR-Tellus-gridded spherical harmonic with scaling factor (CSRT-GSH.sf) (C); four LSMs: VIC (D), NOAH-3.3 (E), CLSM-F2.5 (F), and CLM-4.0 (G); and two GHWRMs: WGHM (H) and PCR-GLOBWB (I). Output from MOSAIC is not shown because of space restrictions.
Table 2.
Approximately decadal (2002–2014) trends in TWSA in cubic kilometers per year in selected basins (river basin names) showing decreasing and increasing trends ranked according to trends in GRACE CSR-M
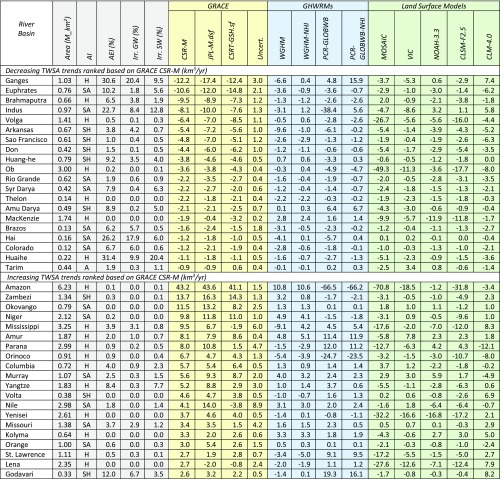 |
AEI %, area equipped for irrigation in percent of basin based on GW (Irr. GW %) and SW (SW %); AI, aridity index.
All models generally underestimate GRACE-derived TWSA trends (Fig. 3 D–I). For example, the largest GRACE-based TWSA declining trend is found in the Ganges (−12 to −17 km3/y), with WGHM underestimating the trend (−6.6 km3/y) and PCR-GLOBWB yielding the opposite trend (4.8 km3/y). LSMs yield a large range in TWSA trends for the Ganges (−5.3 to 7.4 km3/y). Models also underestimate the largest GRACE-based TWSA rising trend in the Amazon (41–44 km3/y), with WGHM simulating a lower trend (11 km3/y), whereas PCR-GLOBWB and all LSMs yield opposite trends [PCR-GLOBWB (−67 km3/y) and LSMs (−71 to −1 km3/y)]. Many of the LSMs seem to be dominated by declining trends, as shown by the predominance of red colors in the global maps, but less so in VIC and CLM-4.0 (Fig. 3 D–G). Similarity in global maps of TWSA trends in millimeters per year (SI Appendix, Fig. S7) and cubic kilometers per year (Fig. 3) indicates that the TWSA volumetric trends do not simply reflect variations in basin areas.
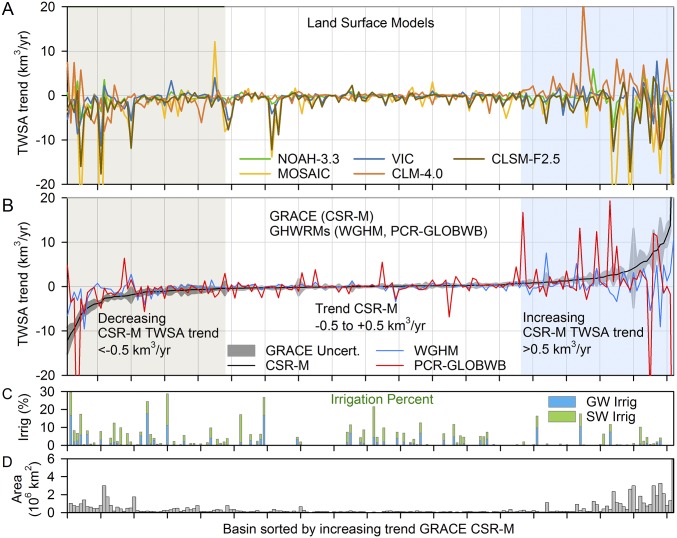
Ranking TWSA trends based on the GRACE Center for Space Research–Mascons data (CSR-M) shows TWSA trends ranging from large decreasing trends (≤−0.5 km3/y) [largest decline in Ganges (−12 km3/y)] to large increasing trends (≥0.5 km3/y) [largest rise in Amazon (43 km3/y)] (Fig. 4B and Table 2). GRACE CSR-M output was selected for reference because models were not used in processing CSR-M data and there is no confusion in comparing model output with GRACE CSR-M trends. However, uncertainty from all three GRACE solutions, along with other uncertainties, is shown in the gray-shaded region surrounding the CSR-M data (Fig. 4B) described below in the section on uncertainties in TWSA trends from GRACE and in SI Appendix, section 4. Basins with large trends in cubic kilometers per year also correspond to basins with large trends in millimeters per year (Table 2 and SI Appendix, Table S4). Throughout this paper, large decreasing and increasing TWSA trends refer to these basins ranked according to CSR-M in cubic kilometers per year. Decreasing TWSA trends are found mostly in irrigated basins (Fig. 4C) and in basins in northern latitudes (Table 2). Models underestimate median GRACE-derived decreasing TWSA trends (−2.2 to −1.5 km3/y) by up to a factor of ∼20 in GHWRMs [WGHM (−0.1 km3/y) and PCR-GLOBWB (−0.3 km3/y)] (Fig. 4 A and B and Table 3). Median decreasing trends in LSMs are also less negative than those from GRACE but much more variable (−1.4 to −0.4 km3/y).
Fig. 4.
(A–D) TWSA trends ranked according to trends from GRACE CSR-M from decreasing trends (buff background, ≤−0.5 km3/y) and increasing trends (blue, ≥0.5 km3/y). The black line in B represents GRACE CSR-M TWSA trends, and the gray-shaded area represents uncertainty (Uncert.) in TWSA trends (SI Appendix, section 4.2). Irrig, irrigation.
Table 3.
Median TWSA trends in GRACE and models in basins with large rising CSR-M trends (≥0.5 km3/y) and large declining CSR-M trends (≤−0.5 km3/y)
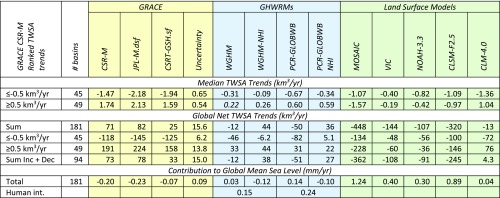 |
More details are provided in SI Appendix, Tables S10 and S11. Dec, decreasing; Inc, increasing; int., intervention.
Increasing TWSA trends are found primarily in nonirrigated basins (Fig. 4C), mostly in humid regions (Table 2), and may be related to climate variations. Models also underestimate median GRACE increasing trends (1.6–2.1 km3/y) by up to a factor of ∼8 in GHWRMs (0.3–0.6 km3/y) (Fig. 4B and Table 3). Underestimation of GRACE-derived TWSA increasing trends is much greater for LSMs, with four of the five LSMs yielding opposite trends (i.e., median negative rather than positive trends) (Fig. 4A and Table 3). The closest agreement between GRACE and LSMs is found in the CLM-4.0 model output. Box plots show strong overlap in the interquartile range (IQR) for the GRACE solutions, indicating good agreement, but much less IQR overlap between models and GRACE, particularly for the increasing TWSA trends (SI Appendix, Fig. S10). Decreasing and increasing trends from all three GRACE solutions are from the same population based on the Kruskal–Wallis nonparametric analysis of variance test (33) (SI Appendix, Table S7). This test also shows that many of the models and GRACE solutions are from the same population for the GRACE TWSA decreasing trends but from different populations for the increasing GRACE TWSA trends.
Comparison Between Modeled and GRACE-Derived TWSA Trends for Selected Basins.
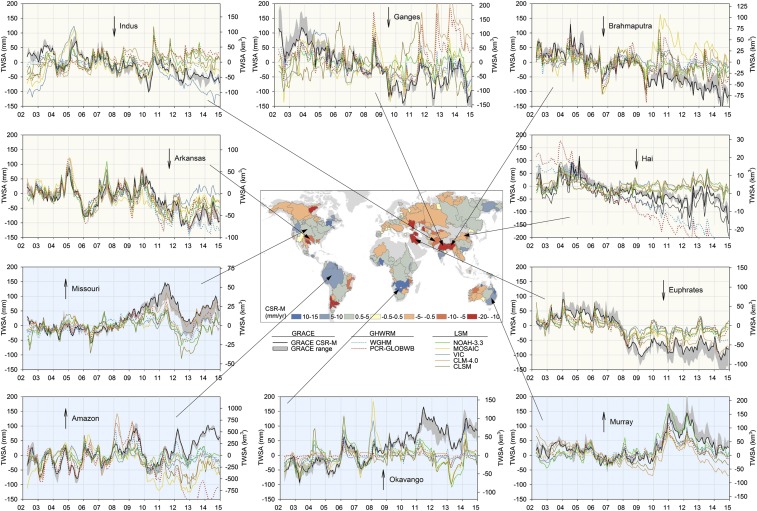
TWSA time series are shown for selected basins with decreasing and increasing trends (Fig. 5 and Table 2), with larger plots and additional basins shown in SI Appendix, Fig. S9. Models do not track the GRACE TWSA output in many of the basins. For example, there are large discrepancies between models and GRACE throughout the Ganges time series, with model output being relatively flat, underestimating both the highs in the early time series and the declines in the later time series. Similar results are found for the neighboring Indus and Brahmaputra basins, with all three basins corresponding to well-known hotspots of depletion attributed to irrigation (34, 35). GRACE-derived trends range from −7 to −17 km3/y in these basins, with a much larger range in trends from models [e.g., PCR-GLOBWB: Indus (−38 km3/y), Ganges (+5 km3/y)]. The Hai Basin is unusual in that both WGHM and PCR-GLOBWB overestimate GRACE-derived TWSA declines. WGHM was specifically calibrated for the Hai Basin because of much greater depletion in the original version (−56 km3/y; SI Appendix, section 3.1). GRACE-based decreasing TWSA trends in the Euphrates (−11 to −15 km3/y), related to the 2007–2009 drought and irrigation (36, 37), are consistently underestimated by all models.
Fig. 5.
Time series of TWSA after removal of seasonal signal for selected basins globally from GRACE CSR-M (black line) and minimum and maximum of three GRACE solutions (gray-shaded area; CSRT-GSH.sf, CSR-M, and JPL-M.dsf), two GHWRMs (WGHM and PCR-GLOBWB), and five LSMs (MOSAIC, VIC, NOAH-3.3, CLSM-F2.5, and CLM-4.0). The global map includes TWSA trends based on GRACE CSR-M in millimeters per year.
Models underestimate GRACE-based TWSA increasing trends more than decreasing trends. All models underestimate GRACE-derived trends in the Amazon (41–44 km3/y), with negative trends in six of the seven models down to −71 km3/y (Table 2). Increasing GRACE trends are also found in surrounding basins [e.g., GRACE, Orinoco, Parana (2–11 km3/y)], with most models yielding negative trends. Models greatly underestimate the increasing trends in Africa, particularly in southern Africa. GRACE-derived increasing TWSA trends in the Okavango and Zambezi basins (8–16 km3/y) are related to rising precipitation, consistent with previous GRACE regional studies (38). All models underestimate the rising trends in these basins (−5 to 3 km3/y). GRACE-derived increasing TWSA trends in the midlatitudes in North America [Mississippi: CSR-M and NASA Jet Propulsion Laboratory–Mascons (JPL-M) (7–10 km3/y)] may be related to flooding (39) but some models yield opposite trends [e.g., WGHM (−9 km3/y)]. Increasing GRACE-derived TWSA trends in the Murray Basin in southeast Australia (6–9 km3/y), attributed to flooding in 2010 after the millennial drought, are underestimated by models (−5 to 6 km3/y) (40). TWSA trends from GRACE in northeast Asia are generally increasing [Amur and Yenisei (4–9 km3/y)] (41), but many models show decreasing trends, particularly in the Yenisei.
Modeled and GRACE-derived TWSA trends were also compared using regression analysis for basins with decreasing and increasing GRACE-derived TWSA trends (94 basins) (SI Appendix, Table S6B). Perfect agreement between modeled and GRACE trends would result in an r2 value of 1.0 and a slope of 1. Values of r2 are generally low and close to 0.0 for many comparisons. Low regression slopes for WGHM versus GRACE (0.24–0.28) indicate large underestimation of GRACE-derived TWSA trends, and negative slopes for PCR-GLOBWB (−0.46 to −0.66) indicate opposite trends to GRACE. The LSMs MOSAIC, VIC, and CLSM-F2.5 have negative slopes with values as low as −0.85 for MOSAIC, while the LSMs NOAH-3.3 and CLM-4.0 have slopes up to 0.10, indicating large underestimation of GRACE TWSA trends.
Intermodel comparisons of TWSA trends based on regression analysis show poor agreement between GHWRMs and LSMs based on all 181 basins (SI Appendix, Table S8). Values of r2 for LSMs vs. WGHM are ≤0.08 and slightly higher for LSMs vs. PCR-GLOBWB (≤0.21). Slopes of regression between LSMs and GHWRMS are quite variable depending on the model (−0.76 to 0.55). Even similar model types show poor agreement (GHWRMs PCR-GLOBWB vs. WGHM: r2 = 0.01, slope = −0.39) (SI Appendix, Fig. S11). The scatter plot between PCR-GLOBWB and WGHM highlights some large outliers in the Amazon, Orinoco, and Indus basins. Values of r2 among LSMs are quite variable, and some higher values may result from similarity in model structures and forcing within GLDAS 1.0 and GLDAS 2.1 model groups.
What Are the Uncertainties in TWSA Trends from GRACE?
Differences between models and GRACE TWSA trends may result from uncertainties in GRACE data (SI Appendix, section 4). Generally good agreement in TWSA trends from the different GRACE solutions, with slopes close to 1 (range: 0.8–1.1) and high r2 values (range: 0.85–0.94), provides confidence in the GRACE trend estimates (SI Appendix, Table S6A). Decreasing and increasing TWSA trends in TWSA from JPL-M tend to be larger than those from CSR-M, as shown by more intense colors in the global maps (Fig. 3 A and B) and slightly larger net trends from JPL-M relative to CSR-M trends (Table 3).
GRACE measurement and leakage uncertainties increase with decreasing basin size (25). The focus of this study is on large decadal TWSA trends, which are mostly found in large basins exceeding 100,000 km2 (Fig. 4 B and D), with lower measurement and leakage uncertainties (SI Appendix, Figs. S3 and S4 and Table S1). These measurement and leakage uncertainties do not contribute to trend uncertainties, consistent with findings from previous studies (31). TWSA trend uncertainties are more important for this study (SI Appendix, section 4.2). Only basins with statistically significant TWSA trends were included in net TWSA trends in this study. TWSA trends were found to be significant (P = 0.05) in at least one of the GRACE solutions for all basins with large decreasing and increasing TWSA trends (94 basins), except the Congo Basin (Mann–Kendall Test; SI Appendix, section 4.2b). Approximately 85% of the basins have significant trends in all three GRACE solutions. To test the impacts of glacier leakage, basins containing any ice were excluded from JPL-M processing (SI Appendix, Fig. S1) and TWSA trends were recalculated. Results show that leakage from the Alaskan glaciers reduced the TWSA trend in the nearby Yukon Basin from 1.1 to −10.8 km3/y. However, leakage from the Asian High Mountain Glaciers reduced the trend in the Ganges by only 20%. TWSA trends in the Salado basins in South America are affected by both glacier leakage and the 2010 Maule earthquake in Chile (magnitude of 8.8). These basins (Congo, Yukon, and Salado basins) were excluded from net TWSA trends in this study.
The remaining GRACE TWSA trend uncertainties include the following: (i) solution trend uncertainty based on variations in TWSA trends among the three GRACE solutions (SI Appendix, Table S5), (ii) trend (slope) uncertainty for each GRACE solution based on linear regression, and (iii) uncertainty related to glacial isostatic adjustment (GIA) from rebound from Pleistocene glaciation in northern latitude basins in North America and Fennoscandia (Table 2 and SI Appendix, sections 4.2 and 4.3 and Table S5). Example basins with large GIA uncertainties include the MacKenzie and Nelson basins in North America. GRACE trend uncertainties are dominated by variability among GRACE solutions (SI Appendix, Table S5).
What Is the Impact of Human Intervention on Global Water Storage Trends?
Human intervention (water abstractions and reservoir management) on TWSA trends can be evaluated qualitatively by comparing TWSA trends with irrigation intensities, indicated only by irrigated areas rather than irrigation water extractions. Many basins with large TWSA declines are heavily irrigated [e.g., Ganges (irrigation of 31% of land area)] (Figs. 4 and 6 and Table 2). Large TWSA declines in some of these basins are attributed mostly to human-induced GW abstractions, as described in regional studies (34, 42, 43). Depletion linked to irrigation is also consistent with low irrigation intensities (irrigated areas < 5%) in basins showing large increasing TWSA trends, except for a few basins that are irrigated with SW and GW (e.g., Godavari basin in India) and the filling of the Three Gorges reservoir in the Yangtze Basin (44) (Fig. 4C). This qualitative comparison is insufficient to determine human intervention, as some of the basins in the zone with low TWSA trends (trends within ±0.5 km3/y) also have large irrigated areas with varying levels of SW or GW irrigation (Fig. 4C).
Fig. 6.
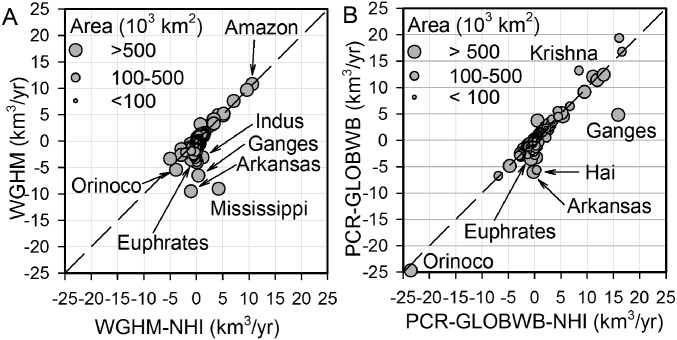
Relationship between TWSA trends from models with human intervention WGHM (A) and PCR-GLOBWB (B) relative to models with no human intervention (NHI). Selected outlying basins are labeled. Trends for some PCR-GLOBWB basins plot outside the diagram [e.g., Indus (−38.4 km3/y)].
To further isolate effects of human intervention on TWSA trends, WGHM and PCR-GLOBWB models were run without human intervention (WGHM-NHI and PCR-GLOB-NHI) (27) (Fig. 6, Table 2, and SI Appendix, Fig. S12). Both models vary water demand over time (2002–2014) for the irrigation sector based on changes in irrigated area from Food and Agriculture Organization data and for nonirrigation sectors based on population growth, per capita gross domestic product, and electricity demand (SI Appendix, section 3). TWSA trends from WGHM and PCR-GLOBWB are more negative than NHI runs by ≥0.5 km3/y in ∼13% of the basins (∼24–25 basins) (Fig. 6). The magnitude of human intervention was found to be largest in the Mississippi for WGHM [13 km3/y (WGHM minus WHGM-NHI)] and in the Indus in PCR-GLOBWB (44 km3/y) (Table 2).
The total contribution of human intervention to TWSA trends (estimated by summing trends over all basins with and without human intervention) is −12 km3/y versus 44 km3/y for WGHM-NHI, resulting in a net contribution from human intervention of 56 km3/y (Table 3). The net contribution is larger for PCR-GLOBWB (86 km3/y). The impact of human intervention is dominated by TWSA trends in basins in the zone with GRACE decreasing trends (e.g., 40 km3/y for WGHM) relative to GRACE increasing trends (e.g., 11 km3/y for WGHM) accounting for 70–90% of the WGHM and PCR-GLOBWB net trends (Table 3 and SI Appendix, Table S11).
If human interventions were the main driver of global trends in water storage, we would expect net trends from LSMs, which do not simulate human interventions, to be less negative than those from GHWRMs. However, the opposite is true, with more negative net trends from LSMs (−13 to −448 km3/y) than from GHWRMs (−12 to −50 km3/y) (Table 3). The LSMs show net declining TWSA trends that are similar to or slightly more negative than those from GHWRMs in the zone of GRACE declining trends (≤−0.5 km3/y). However, LSMs show much more negative net trends than GHWRMs in the zone of GRACE-derived rising TWSA trends (≥0.5 km3/y), with four of five LSMs yielding net negative trends, with the exception of the CLM-4.0 LSM.
How Well Can We Estimate the Net Impact of Land Water Storage Trends on GMSL?
The contribution of decadal trends in land water storage to GMSL in millimeters per year is calculated by dividing the net TWSA trends in cubic kilometers per year by the ocean area (361 × 106 km2). Net TWSA trends, after summing trends over basins, vary markedly between GRACE and models and among models (Table 3). Net TWSA trends from GRACE mascons are positive, with a relatively narrow range (71–82 ± 16 km3/y) with lower trends from spherical harmonics solution (∼25 km3/y). Net TWSA trends from GRACE are similar whether we consider all 181 basins or only basins with large trends [94 basins: ≤−0.5 km3/y and ≥0.5 km3/y (range: 73–78 km3/y)]. Therefore, although the 186 basins analyzed in this study only cover 63% of the global land area, excluding Greenland and Antarctica, net TWSA trends are dominated by a much smaller number of basins with large TWSA trends. GRACE-derived net increasing TWSA trends exceed net decreasing trends, resulting in an overall positive net TWSA trend. In contrast to the positive trends from GRACE solutions, net TWSA trends from models are all negative. Net TWSA trends from GHWRMs range from ∼−50 km3/y (PCR-GLOBWB) to ∼−12 km3/y (WGHM), whereas those from LSMs are mostly lower, with a much larger range (−448 to −13 km3/y).
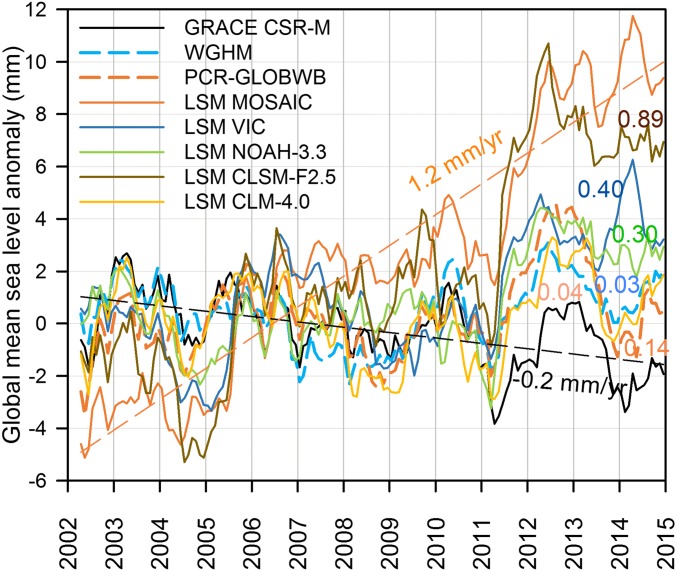
Increases in land water storage would negatively contribute to GMSL, lowering the rate of sea level rise, and vice versa. Net positive trends in land water storage from GRACE mascons (71–82 km3/y) negatively contribute to GMSL, with rates ranging from −0.23 to −0.20 mm/y (April 2002–December 2014) (Fig. 7, Table 3, and SI Appendix, Figs. S13 and S14). In contrast to GRACE output, decreases in land water storage from models (net negative TWSA trends) would contribute positively to GMSL, increasing the rate of GMSL rise. The contributions range from 0.03 mm/y from WGHM to 0.14 mm/y from PCR-GLOBWB, with a much larger range from LSMs (0.04–1.2 mm/y) (Fig. 7 and Table 3). Such large differences between models and GRACE and among models indicate that we may not be able to reliably estimate contributions from land water storage to GMSL change using models.
Fig. 7.
GMSL change derived from TWSA trends for GRACE CSR-M, GHWRMs (PCR-GLOBWB and WGHM; dashed lines), and LSMs (MOSAIC, VIC, NOAH-3.3, CLSM-F2.5, and CLM-4.0). The black dashed line represents the downward contribution of GRACE CSR-M trends to GMSL, and the orange dashed line represents the upward contribution from LSM-MOSAIC. GRACE-positive TWSA trends (71 km3/y) contribute negatively (−0.2 mm/y) to GMSL, slowing the rate of rise of GMSL, whereas models contribute positively to GMSL, increasing the rate of rise of GMSL (Table 3).
We can also estimate the human and climate contributions to land water storage and GMSL change (SI Appendix, Fig. S14). Human intervention results in depletion of land water storage ranging from 0.15 mm/y (WGHM) to 0.24 mm/y (PCR-GLOBWB) in this study (Table 3 and SI Appendix, Fig. S14 and Table S12). Subtracting the modeled human intervention contribution from the total land water storage contribution from GRACE results in an estimated climate-driven contribution of −0.44 to −0.38 mm/y. Therefore, the magnitude of the estimated climate contribution to GMSL is twice that of the human contribution and opposite in sign. While many previous studies emphasize the large contribution of human intervention to GMSL, it has been more than counteracted by climate-driven storage increase on land over the past decade.
The GRACE mascon-derived estimates of land water storage from this study (−0.20 to −0.23 mm/y) are similar to those from previous studies covering the same time period (−0.29 and −0.33 mm/y) (8, 31) (SI Appendix, Fig. S14 and Table S12). The modeled human intervention in this study is within the range of those from recent studies (0.12 mm/y) (18) and the IPCC (0.38 mm/y) (7), both for longer periods (1993–2010). Calculated climate contributions to GMSL (GRACE minus human contribution) range from −0.38 to −0.44 from this study relative to −0.41 to −0.71 from previous studies. Therefore, net increases in glacier-free land water storage in this study should have slowed the rate of sea level rise since 2002, with climate variations contributing about twofold more to GMSL than human intervention. The other components of the sea level budget from previous studies are described in SI Appendix, Table S12.
What Causes the Differences in Water Storage Trends Between Models and GRACE?
Discrepancies in TWSA trends may be related to uncertainties in GRACE (SI Appendix, section 4) and in models. Basins with insignificant GRACE-derived TWSA trends and large uncertainties related to glacier leakage and earthquakes were excluded from net TWSA trends.
Factors related to modeling that can contribute to discrepancies between models and GRACE include initial conditions, climate forcing, land cover input, model structure, human intervention, and calibration. Here, we focus on a few of the main factors, including:
-
i)
Initial conditions and model spin-up
-
ii)
Water storage compartments and capacity related to model structure
-
iii)
Precipitation uncertainty
-
iv)
Model calibration
Initial conditions and model spin-up.
Long-term trends can be impacted by model initial conditions if the model spin-up (number of years the model is run) is insufficient for the model to equilibrate with the climate forcing. We evaluated global trends in TWSA and component storages using gridded global model output (excluding Greenland, Antarctica, and mountain glaciers) to examine if model trends during the GRACE period (2002–2014) may be an artifact of initial conditions. WGHM and CLM-4.0 models were selected because both include GWS. The WGHM model shows that SnWS is fairly stable, except for a period in the mid-1940s to mid-1960s when storage increases (SI Appendix, Fig. S15). CWS is temporally invariant. SWS increases gradually to the mid-1950s, followed by a period with no systematic storage variation. SMS and GWS are initialized dry in WGHM. SMS is fairly stable over the entire period (1901–2014). GWS increases, particularly in the 1970s. Trends in the storage components contribute to the trends in TWSA. The component storages suggest that the 2002–2014 trends considered in this study should be minimally impacted by the initial conditions because of the long spin-up. Output from CLM-4.0 shows that SnWS and SWS are fairly stable over time (SI Appendix, Fig. S16). SMS and GWS are initialized wet. SMS shows a large decline in the first ∼30 y, and GWS markedly declines, particularly in the first 40 y and more gradually after that period. Although the trends are large during the early period, output from the recent decade should not be substantially affected by the initial conditions because of the long spin-up period.
Water storage.
One of the obvious factors is that most LSMs do not model SWS and GWS compartments, with the exception of CLM-4.0 (Table 1). Inclusion of these compartments in CLM-4.0 may explain the much better agreement between CLM-4.0 and GRACE net decreasing (−72 km3/y) and increasing (76 km3/y) TWSA trends relative to other LSMs (Table 3). Comparison of TWSA trends between CLM-4.0 and an earlier version of CLM (CLM-2.0) without SWS or GWS shows significant improvement in modeled TWSA trends in CLM-4.0 (SI Appendix, Fig. S17). Although WGHM and PCR-GLOBWB models include all storage compartments, these models also underestimate TWSA trends relative to GRACE. The models may lack sufficient storage capacity to accommodate the range in TWSA trends. Underestimation of GRACE-derived rising TWSA trends more than declining trends may be related to limited storage capacity because of lack of storage compartments (most LSMs); soil profiles that are too thin (all models); or exclusion of processes, such as river flooding. A previous study used the CLM-4.0 model to estimate the soil storage capacity required to replicate the GRACE TWSA variability showing profile thicknesses up to 8–10 m in tropical regions (e.g., Amazon, Congo) and in southern Africa (45), whereas most models have soil thickness ranging from 1–4 m (Table 1). NASA expanded the soil profile in the CLSM model to capture the range in storage from GRACE associated with droughts and floods (46).
Climate forcing.
Different climate forcings among the models may be considered a drawback of this study. However, TWSA trends in models with the same climate forcing, such as WGHM and PCR-GLOBWB [Watch Forcing Data + Era Interim Reanalysis (WFDEI)] (47) differ markedly, with r2 values close to 0.0 for basin TWSA trends (SI Appendix, Fig. S11 and Table S8). Although we could not apply the same climate forcing to all of the models, we tried to isolate the impacts of climate forcing on TWSA trends by running WGHM using different climate forcings. Results show variations in net TWSA trends summed over all basins: WFDEI forcing (−12 km3/y), Global Precipitation Climatology Center (GPCC) v.7 (−6.1 km3/y), and Climate Research Unit (CRU) TS 3.23 (−23 km3/y) (SI Appendix, Fig. S18). Agreement between TWSA trends based on WFDEI and GPCC is high (r2 = 0.7, slope = 0.9) but is much lower for trends based on WFDEI and CRU (r2 = 0.0, slope = 0.3). We show TWSA time series for many basins, including precipitation forcing from WFDEI and the Princeton Global Meteorological Forcing Dataset (PGMFD) from NOAH-3.3, to highlight variability in these two forcings. The relationship between TWSA trends and cumulative precipitation anomalies from PGMFD indicates variable correlations between the two in different basins (SI Appendix, Table S9).
Model calibration.
WGHM is the only model considered in this study that is calibrated based on long-term average river discharge at 1,319 gages (SI Appendix, section 3). Comparison between calibrated and noncalibrated WGHM only resulted in slight differences in net long-term TWSA trends [calibrated (−12 km3/y), noncalibrated (−5.8 km3/y)]. However, calibration can result in large differences in TWSA in certain basins, with absolute differences up to 7.5 km3/y. However, it is unlikely that calibration can account for the large differences between WGHM and PCR-GLOBWB TWSA trends because differences between calibrated and noncalibrated TWSA trends in WGHM are much less than differences between WGHM and PCR-GLOBWB TWSA basin trends (SI Appendix, Fig. S19).
Future Research
This study focuses on comparisons in TWSA trends between models and GRACE to complement previous studies that focused on fluxes (e.g., river discharge, ET). However, future studies should consider a multivalidation exercise that includes both storage and fluxes. Previous MIPs did not include modeled TWSA output; however, the ISIMIP group is now requesting TWSA output (ISIMIP2b) from modeling groups, and all of the relevant data should be available to compare both storage and fluxes among models.
Discrepancies in TWSA between GRACE and models can reflect uncertainties in both GRACE and models. Uncertainties in GRACE output may be related to GRACE processing, which is continually improving and is currently at level 5. Future research should explore differences between GRACE solutions in different regions [e.g., Nile basin between CSR and JPL mascons (4–14 km3/y)]. The GRACE Follow On mission is projected to be launched in early 2018, and technology improvements may result in enhanced signal.
Single-model sensitivity analyses may provide more insights into controls on model-GRACE differences by changing one factor at a time, such as a recent WGHM study that examined precipitation forcing and human intervention (48). Multiparameterization of single models may be valuable, such as NOAH multiparameterization, which allows various options for vegetation, runoff, and GWS to be used within a single-model framework to quantify the effect of different processes on model output (49). The structure for unifying multiple modeling alternatives (SUMMA) is another approach with a single modeling framework, based on a general set of conservation equations that allows different model parameterizations and other factors to be varied, that should provide improved understanding of sources of model uncertainties (50, 51). The SUMMA approach may be used to identify future model improvements and related data and research needs.
Reliable data sources are also critical for modeling analyses. The International Land Model Benchmarking Project includes a number of data sources for hydrology, energy, fluxes, and vegetation dynamics (https://www.ilamb.org/benchmarks/). Such efforts should be expanded in the future.
Large discrepancies between models and GRACE TWSA trends in many regions in this study indicate that detailed regional modeling efforts could complement global models. The current round of ISIMIP models includes impacts on global water and regional water (https://www.isimip.org/about/). The Amazon and surrounding basins represent an obvious target area for regional modeling because of their large contribution to net TWSA trends (e.g., 50–60% of net TWSA in WGHM and PCR-GLOBWB) and opposing trends simulated by many models in this study. Hotspots of human intervention, including the Indus, Ganges, Brahmaputra, and Euphrates, would benefit from detailed regional studies with intensive efforts on quantifying water demand. Other regions of interest include endorheic basins, including the Okavango and similar basins. Basins in northern latitudes should also be a focus because of problems with climate forcing, precipitation phase, snowmelt, and permafrost issues. High-resolution continental scale models, such as the ParFlow model, are also being applied with more detailed physics than global models (52). Global model output may be developed by combining output from different global models with varying performance in different regions, as is done with global climate models.
Continual advances in GRACE data and modeling should enhance our understanding of global water resources. Integration of modeling and remote sensing should provide constraints on uncertainties in model results. Often, the focus of hydrological models is on simulating discharge; however, with increased availability of water storage data, future modeling should consider multiobjective calibration using multiple (in situ and remote sensing) calibration data to improve the models.
Conclusions
Comparison of TWSA trends from models (GHWRMs and LSMs) and GRACE in river basins globally indicates that the models are not highly reliable because of the large spread in model results and poor correlation between models and GRACE and among models:
-
i)
All models, including GHWRMs and LSMs, underestimate large water storage trends relative to GRACE trends.
-
ii)
GRACE-derived large decreasing water storage trends are found in heavily irrigated and northern latitude basins, whereas increasing trends are found mostly in nonirrigated basins in humid regions. Models underestimate the GRACE-derived increasing trends more than the decreasing trends, with four of five LSMs yielding opposite trends to GRACE-derived increasing trends.
-
iii)
Net land water storage trends from GRACE, summed over the basins, are positive (71–82 ± 16 km3/y) over 2002–2014. In contrast, net storage trends from models are negative (−12 to −450 km3/y), indicating that models fail to capture GRACE-derived land water storage increases at the decadal time scale.
-
iv)
The large spread in net TWSA trends among models (summed over all basins) results in opposite contributions to GMSL change relative to estimated contributions from GRACE, highlighting uncertainties in modeled estimation of GMSL.
-
v)
Subtracting modeled net land water storage trends related to human intervention from GRACE trends (human + climate) results in climate contribution to land water storage and GMSL that exceeds human intervention by about a factor of 2 over the past decade.
-
vi)
Primary causes of model-GRACE discrepancies include lack of SWS and GWS compartments in most LSMs, low storage capacity in all models, uncertainties in climate forcing, and lack of human intervention in most LSMs.
The results of this analysis highlight the challenges for models to capture large historical water storage trends derived from GRACE satellites, implying that model projections may underestimate future climate and human-induced water storage trends.
Data and Analysis
Detailed descriptions of data sources and analyses are provided in SI Appendix.
Supplementary Material
Acknowledgments
We thank Sean Swenson for beneficial discussions and input. The senior author acknowledges support from the Jackson School of Geosciences and the Fisher Endowed Chair in Geological Sciences to conduct this study.
Footnotes
The authors declare no conflict of interest.
This article is a PNAS Direct Submission. Z.W.K. is a guest editor invited by the Editorial Board.
*van Beek LP, Wada Y, Bierkens MFP (2011) Global depletion of groundwater resources and its contribution to sea-level rise. Fall American Geophysical Union Meeting, 2011, abstr H14B-0.
This article contains supporting information online at www.pnas.org/lookup/suppl/doi:10.1073/pnas.1704665115/-/DCSupplemental.
References
- 1.Bierkens MFP. Global hydrology 2015: State, trends, and directions. Water Resour Res. 2015;51:4923–4947. [Google Scholar]
- 2.Schewe J, et al. Multimodel assessment of water scarcity under climate change. Proc Natl Acad Sci USA. 2014;111:3245–3250. doi: 10.1073/pnas.1222460110. [DOI] [PMC free article] [PubMed] [Google Scholar]
- 3.Pokhrel YN, et al. Incorporation of groundwater pumping in a global land surface model with the representation of human impacts. Water Resour Res. 2015;51:78–96. [Google Scholar]
- 4.Milly PCD, et al. Terrestrial water-storage contributions to sea-level rise and variability. In: Church JA, Woodworth PL, Aarup T, Wilson WS, editors. Understanding Sea-Level Rise and Variability. Wiley Blackwell; Oxford: 2010. pp. 226–255. [Google Scholar]
- 5.Tapley BD, Bettadpur S, Watkins M, Reigber C. The gravity recovery and climate experiment: Mission overview and early results. Geophys Res Lett. 2004;31:L09607. [Google Scholar]
- 6.Famiglietti JS, et al. Satellites provide the big picture. Science. 2015;349:684–685. doi: 10.1126/science.aac9238. [DOI] [PubMed] [Google Scholar]
- 7.Church JA, et al. Sea level change. In: Stocker TF, et al., editors. Climate Change 2013: The Physical Science Basis. Contribution of Working Group I to the Fifth Assessment Report of the Intergovernmental Panel on Climate Change. Cambridge Univ Press; New York: 2013. pp. 1137–1216. [Google Scholar]
- 8.Rietbroek R, Brunnabend SE, Kusche J, Schröter J, Dahle C. Revisiting the contemporary sea-level budget on global and regional scales. Proc Natl Acad Sci USA. 2016;113:1504–1509. doi: 10.1073/pnas.1519132113. [DOI] [PMC free article] [PubMed] [Google Scholar]
- 9.Scanlon BR, et al. Hydrologic implications of GRACE satellite data in the Colorado River Basin. Water Resour Res. 2015;51:9891–9903. [Google Scholar]
- 10.Long D, et al. GRACE satellite monitoring of large depletion in water storage in response to the 2011 drought in Texas. Geophys Res Lett. 2013;40:3395–3401. [Google Scholar]
- 11.Döll P, et al. Impact of water withdrawals from groundwater and surface water on continental water storage variations. J Geodyn. 2012;59–60:143–156. [Google Scholar]
- 12.Wada Y, et al. Global monthly water stress: 2. Water demand and severity of water stress. Water Resour Res. 2011;47:W07518. [Google Scholar]
- 13.Wada Y, et al. Global depletion of groundwater resources. Geophys Res Lett. 2010;37:L20402. [Google Scholar]
- 14.Döll P, Müller Schmied H, Schuh C, Portmann FT, Eicker A. Global-scale assessment of groundwater depletion and related groundwater abstractions: Combining hydrological modeling with information from well observations and GRACE satellites. Water Resour Res. 2014;50:5698–5720. [Google Scholar]
- 15.Koster RD, et al. Realistic initialization of land surface states: Impacts on subseasonal forecast skill. J Hydrometeorol. 2004;5:1049–1063. [Google Scholar]
- 16.Syed TH, Famiglietti JS, Rodell M, Chen J, Wilson CR. Analysis of terrestrial water storage changes from GRACE and GLDAS. Water Resour Res. 2008;44:W02433. [Google Scholar]
- 17.Pokhrel YN, et al. Model estimates of sea-level change due to anthropogenic impacts on terrestrial water storage. Nat Geosci. 2012;5:389–392. [Google Scholar]
- 18.Wada Y, et al. Fate of water pumped from underground and contributions to sea-level rise. Nat Clim Change. 2016;6:777–782. [Google Scholar]
- 19.Haddeland I, et al. Global water resources affected by human interventions and climate change. Proc Natl Acad Sci USA. 2014;111:3251–3256. doi: 10.1073/pnas.1222475110. [DOI] [PMC free article] [PubMed] [Google Scholar]
- 20.Werth S, Guntner A. Calibration analysis for water storage variability of the global hydrological model WGHM. Hydrol Earth Syst Sci. 2010;14:59–78. [Google Scholar]
- 21.Zhang L, et al. Validation of terrestrial water storage variations as simulated by different global numerical models with GRACE satellite observations. Hydrol Earth Syst Sci. 2017;21:821–837. [Google Scholar]
- 22.Doll P, Fritsche M, Eicker A, Mueller Schmied H. Seasonal water storage variations as impacted by water abstractions: Comparing the output of a global hydrological model with GRACE and GPS observations. Surv Geophys. 2014;35:1311–1331. [Google Scholar]
- 23.Watkins MM, Wiese DN, Yuan DN, Boening C, Landerer FW. Improved methods for observing Earth’s time variable mass distribution with GRACE using spherical cap mascons. J Geophys Res Solid Earth. 2015;120:2648–2671. [Google Scholar]
- 24.Wiese DN, Landerer FW, Watkins MM. Quantifying and reducing leakage errors in the JPL RL05M GRACE mascon solution. Water Resour Res. 2016;52:7490–7502. [Google Scholar]
- 25.Scanlon BR, et al. Global evaluation of new GRACE mascons products for hydrologic applications. Water Resour Res. 2016;52:9412–9429. [Google Scholar]
- 26.Save H, Bettadpur S, Tapley BD. High-resolution CSR GRACE RL05 mascons. J Geophys Res Solid Earth. 2016;121:7547–7569. [Google Scholar]
- 27.Haddeland I, et al. Multimodel estimate of the global terrestrial water balance: Setup and first results. J Hydrometeorol. 2011;12:869–884. [Google Scholar]
- 28.Warszawski L, et al. The inter-sectoral impact model intercomparison project (ISI-MIP): Project framework. Proc Natl Acad Sci USA. 2014;111:3228–3232. doi: 10.1073/pnas.1312330110. [DOI] [PMC free article] [PubMed] [Google Scholar]
- 29.Jensen L, Rietbroek R, Kusche J. Land water contribution to sea level from GRACE and Jason-1 measurements. J Geophys Res Oceans. 2013;118:212–226. [Google Scholar]
- 30.Wada Y, et al. Past and future contribution of global groundwater depletion to sea-level rise. Geophys Res Lett. 2012;39:L09402. [Google Scholar]
- 31.Reager JT, et al. A decade of sea level rise slowed by climate-driven hydrology. Science. 2016;351:699–703. doi: 10.1126/science.aad8386. [DOI] [PubMed] [Google Scholar]
- 32.Koster RD, Milly PCD. The interplay between transpiration and runoff formulations in land surface schemes used with atmospheric models. J Clim. 1997;10:1578–1591. [Google Scholar]
- 33.Kruskal WH, Wallis WA. Use of ranks in one-criterion variance analysis. J Am Stat Assoc. 1952;47:583–621. [Google Scholar]
- 34.Rodell M, Velicogna I, Famiglietti JS. Satellite-based estimates of groundwater depletion in India. Nature. 2009;460:999–1002. doi: 10.1038/nature08238. [DOI] [PubMed] [Google Scholar]
- 35.Shamsudduha M, Taylor RG, Longuevergne L. Monitoring groundwater storage changes in the highly seasonal humid tropics: Validation of GRACE measurements in the Bengal Basin. Water Resour Res. 2012;48:W02508. [Google Scholar]
- 36.Joodaki G, Wahr J, Swenson S. Estimating the human contribution to groundwater depletion in the middle east, from GRACE data, land surface models, and well observations. Water Resour Res. 2014;50:2679–2692. [Google Scholar]
- 37.Longuevergne L, Wilson CR, Scanlon BR, Cretaux JF. GRACE water storage estimates for the middle east and other regions with significant reservoir and lake storage. Hydrol Earth Syst Sci. 2013;17:4817–4830. [Google Scholar]
- 38.Ramillien G, Frappart F, Seoane L. Application of the regional water mass variations from GRACE satellite gravimetry to large-scale water management in Africa. Remote Sens. 2014;6:7379–7405. [Google Scholar]
- 39.Vining KC, Chase KJ, Loss GR. 2013. General Weather Conditions and Precipitation Contributing to the 2011 Flooding in the Mississippi River and Red River of the North Basins, December 2010 Through July 2011, US Geological Survey Professional Paper (US Geological Survey, Reston, VA), Vol 1798-B.
- 40.van Dijk A, et al. The Millennium Drought in southeast Australia (2001-2009): Natural and human causes and implications for water resources, ecosystems, economy, and society. Water Resour Res. 2013;49:1040–1057. [Google Scholar]
- 41.Muskett RR, Romanovsky VE. Groundwater storage changes in arctic permafrost watersheds from GRACE and in situ measurements. Environ Res Lett. 2009;4:045009. [Google Scholar]
- 42.Chen JL, Li J, Zhang ZZ, Ni SN. Long-term groundwater variations in Northwest India from satellite gravity measurements. Global Planet Change. 2014;116:130–138. [Google Scholar]
- 43.Long D, et al. Have GRACE satellites overestimated groundwater depletion in the Northwest India Aquifer? Sci Rep. 2016;6:24398. doi: 10.1038/srep24398. [DOI] [PMC free article] [PubMed] [Google Scholar]
- 44.Wang XW, de Linage C, Famiglietti J, Zender CS. Gravity recovery and climate experiment (GRACE) detection of water storage changes in the three gorges reservoir of China and comparison with in situ measurements. Water Resour Res. 2011;47:W12502. [Google Scholar]
- 45.Swenson SC, Lawrence DM. A GRACE-based assessment of interannual groundwater dynamics in the community land model. Water Resour Res. 2015;51:8817–8833. [Google Scholar]
- 46.Li BL, Rodell M. Evaluation of a model-based groundwater drought indicator in the conterminous US. J Hydrol (Amst) 2015;526:78–88. [Google Scholar]
- 47.Weedon GP, et al. The WFDEI meteorological forcing data set: WATCH forcing data methodology applied to ERA-interim reanalysis data. Water Resour Res. 2014;50:7505–7514. [Google Scholar]
- 48.Mueller Schmied H, et al. Sensitivity of simulated global-scale freshwater fluxes and storages to input data, hydrological model structure, human water use and calibration. Hydrol Earth Syst Sci. 2014;18:3511–3538. [Google Scholar]
- 49.Niu GY, et al. The community Noah land surface model with multiparameterization options (Noah-MP): 1. Model description and evaluation with local-scale measurements. J Geophys Res D Atmospheres. 2011;116:D12109. [Google Scholar]
- 50.Clark MP, et al. A unified approach for process-based hydrologic modeling: 1. Modeling concept. Water Resour Res. 2015;51:2498–2514. [Google Scholar]
- 51.Clark MP, et al. A unified approach for process-based hydrologic modeling: 2. Model implementation and case studies. Water Resour Res. 2015;51:2515–2542. [Google Scholar]
- 52.Maxwell RM, Miller NL. Development of a coupled land surface and groundwater model. J Hydrometeorol. 2005;6:233–247. [Google Scholar]
Associated Data
This section collects any data citations, data availability statements, or supplementary materials included in this article.


