Abstract
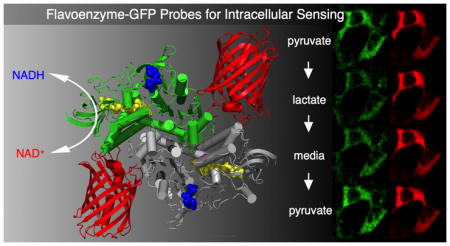
The development of genetically encoded fluorescent probes for analyte-specific imaging has revolutionized our understanding of intracellular processes. Current classes of intracellular probes depend on the selection of binding domains that either undergo conformational changes on analyte binding or can be linked to thiol redox chemistry. Here we have designed novel probes by fusing a flavoenzyme, whose fluorescence is quenched on reduction by the analyte of interest, with a GFP domain to allow for rapid and specific ratiometric sensing. Two flavoproteins, Escherichia coli thioredoxin reductase and Saccharomyces cerevisiae lipoamide dehydrogenase, were successfully developed into thioredoxin and NAD+/NADH specific probes respectively and their performance was evaluated in vitro and in vivo. A flow cell format, which allowed dynamic measurements, was utilized in both bacterial and mammalian systems. In E. coli the first reported intracellular steady-state of the cytoplasmic thioredoxin pool was measured. In HEK293T mammalian cells, the steady-state cytosolic ratio of NAD+/NADH induced by glucose was determined. These genetically encoded fluorescent constructs represent a modular approach to intracellular probe design that should extend the range of metabolites that can be quantitated in live cells.
Graphical Abstract
INTRODUCTION
Genetically encoded fluorescent protein sensors for analyte-specific measurements, can be placed into three basic classes (Figure 1). The first group, introduced by Tsien and colleagues,1 are the dual fluorescent protein sensors schematized in Figure 1A in which analyte binding modulates the Förster resonance energy transfer (FRET) efficiency between juxtaposed fluorophores. Such sensor designs have been utilized to measure diverse intracellular signals including Ca2+,1 Zn2+,2 Cu2+,3 Mg2+,4 ATP,5 glucose,6 glutamine,7 and inositol 1,4,5-trisphosphate.8
Figure 1.
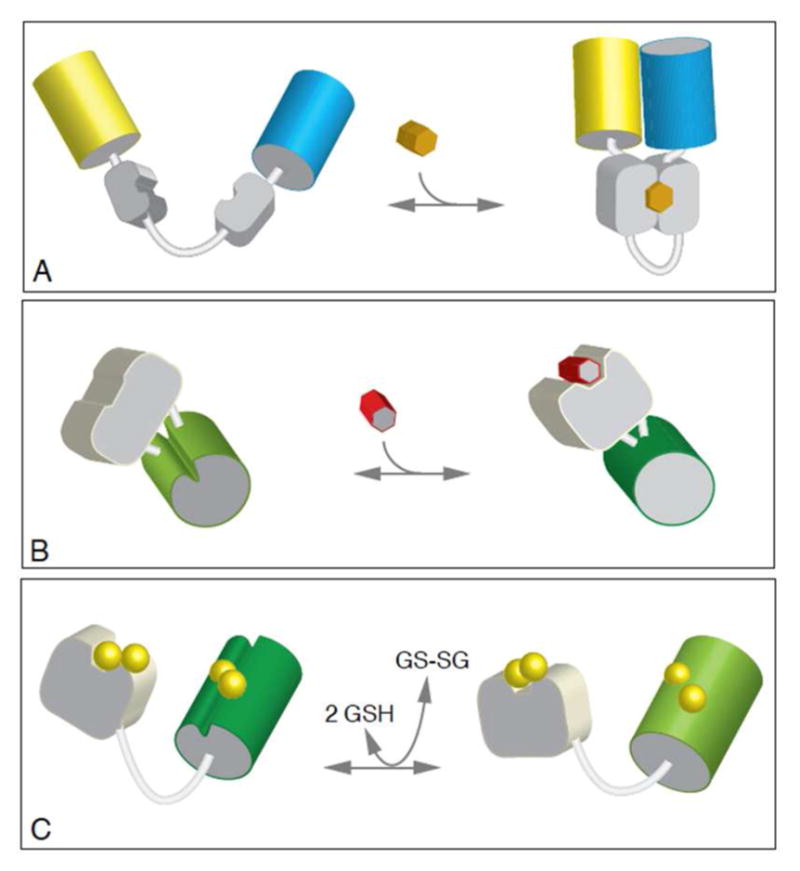
Three types of genetically encoded fluorescent protein sensors. Panel A depicts FRET-based dual fluorescent protein fusion (yellow and cyan cylinders represent variants of green fluorescent protein). Panel B exploits a circularly permuted fluorescent protein fused to a ligand-binding protein (gray). Panel C shows the fusion of a thiol-transferase to a redox-responsive fluorescent protein to generate a glutathione sensor.
A second strategy for genetically-encoded sensors features a circularly permuted fluorescent protein with a ligand binding protein inserted between the new N- and C-termini.9 Conformation changes in the sensor domain modulate the fluorescence of the construct (Figure 2B). These circularly-permuted fluorescent constructs have been utilized in a range of sensors including those for Ca2+,9 citrate,10 NADH,11 hydrogen peroxide,12 and R- and S-methionine sulfoxide.13
Figure 2.
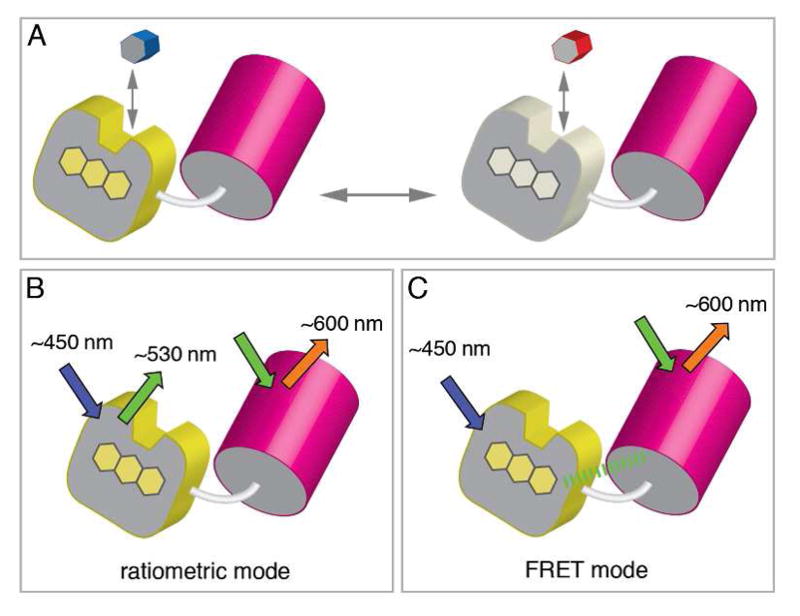
A new class of genetically encoded probes. Panel A: a flavoenzyme (yellow) with strong fluorescence in its oxidized state is fused to a GFP variant (red cylinder). Interaction with a specific substrate of the flavoenzyme ablates the flavin fluorescence and provides for analyte sensing. Two modes of analysis are depicted in panels B and C. In the ratiometric mode the GFP analog is used to normalize for net concentration and spatial presentation of the probe within the sample. Suitable matching of fluorophores permits a significant FRET signal as depicted in panel C.
A third sensor class are genetically encoded single fluorescent proteins incorporating a redox-active disulfide located adjacent to the fluorophore. They were first described by Winther and colleagues14 and then later fused to the thioltransferase, glutaredoxin 1, to facilitate communication with the intracellular glutathione pool (Figure 1C).15 Remington et al.16 developed an improved ratiometric probe, roGFP, now often coupled with glutaredoxins, or other thiol/disulfide oxidoreductases, for enhanced specificity towards their cognate substrates (e.g. glutathione, mycothiol, and H2O2).17–19
Figure 2 illustrates a new approach to analyte-specific probes based on the fusion of flavoenzymes with GFP or related fluorescent proteins. A number of flavoenzymes are notably fluorescent in their oxidized forms and this fluorescence is usually almost completely ablated on substrate-mediated reduction of the flavin chromophore.20–22 The selectivity and rapidity that typify enzyme-substrate interactions would be anticipated to facilitate analysis of substrate/product concentration ratios in the chosen flavoenzyme half-reaction.
Fusion to the GFP analog (Figure 2A) provides two avenues for analysis. In the first, the GFP can be excited independent of the flavin and thus serve to normalize the fluorescence of the flavoenzyme component (Figure 2B). Such ratiometric normalization has been used in a number of the genetically encoded sensors.23–25 Alternatively, pairing the flavin donor with a suitable acceptor GFP can exploit FRET between them (Figure 2C); this interaction will be eliminated on quenching the fluorescence of oxidized flavin by reduction or complexation.
In this contribution we present proof of principle for the design, characterization and application of two probes based on fluorescent flavoproteins. We introduce the first ratiometric probe for the redox state for bacterial and lower eukaryotic thioredoxins using Escherichia coli thioredoxin reductase. As a second example, we demonstrate sensing NAD+/NADH ratios in mammalian cells using a probe based on yeast lipoamide dehydrogenase. Finally, we discuss the performance and limitations of these flavoprotein-GFP probes and suggest avenues for extending their versatility.
MATERIALS AND METHODS
Materials
5,5′-Dithiobis-(2-nitrobenzoic acid) (DTNB), dithiothreitol (DTT), tris(hydroxypropyl)phosphine (THP), reduced and oxidized nicotinamide adenine dinucleotides (NADH, NAD+), and the corresponding phosphorylated derivatives (NADPH, NADP+), sodium pyruvate, sodium lactate, phenylmethylsulfonyl fluoride (PMSF), leupeptin, lysozyme, and poly-L-lysine hydrobromide (30–70 KDa) were purchased from Sigma. Isopropyl β-D-1-thiogalactopyranoside (IPTG), ampicillin, and kanamycin were purchased from GoldBio. Size-exclusion PD-10 columns were purchased from GE Healthcare. Genomic DNA sequences were supplied by GeneWiz and DNA primers were from Integrated DNA Technologies.
General Procedures
Unless otherwise indicated, phosphate buffer containing 50 mM potassium phosphate and 1 mM EDTA adjusted to pH 7.5 was used for all experiments. Proteins were concentrated using Amicon Ultra centrifugal filter units. Visible and ultraviolet spectra were recorded on a Hewlett-Packard 8453 diode-array spectrophotometer. Cuvette fluorescence measurements were conducted on an Aminco Bowman Series 2 Luminescence Spectrometer. Confocal images were captured utilizing a Zeiss LSM 880 laser scanning confocal microscope equipped with a Plan-Neofluar 40x/1.3NA oil-immersion objective. Data were plotted and fitted using GraphPad Prism software. Protein structures were visualized using PyMOL (Schrodinger, LLC).
Protein Expression in E. COLI
The expression and purification of E. coli thioredoxin 1 (EcTrx1) was as previously described.26 An E. coli-optimized DNA sequence for the E. coli thioredoxin reductase-mCherry fusion (TrxR-mCherry; Supporting Information) was inserted into a pTrcHisA vector via NheI and HindIII restriction sites. The corresponding G154V mutant (TrxRGV-mCherry) was derived from the same vector using the forward and reverse primers shown in Supporting Information. E. coli optimized DNA sequences for the G154V mutant of TrxR-mCherry (TrxRGV-mCherry), and the LipDH-mCherry were inserted into the pET28a vector via XbaI and NcoI and NcoI and HindIII restriction sites respectively. Transformed BL21(DE3) cells were grown in Luria Bertani (LB) medium containing 50 mg/L of ampillicin (pTrcHisA vectors) or kanamycin (pET28a vectors) and induced at an optical density of 0.6 at 600 nm with 1.0 mM IPTG. After 6 h cells were collected by centrifugation (5000 g, 4 °C, 30 min). Cell pellets from 2 L of culture) were resuspended in 25 mL of 50 mM phosphate buffer, pH 7.5, containing 20% v/v glycerol, 500 mM NaCl, 1 mM phenylmethylsulfonyl fluoride (PMSF), 300 μg/mL lysozyme, and 1 μM leupeptin. Cells were disrupted by French press using two passes at 10,000 psi. The resulting homogenate was briefly sonicated to shear DNA and centrifuged at 17,000 g. The clarified lysate was rocked for 1 h at 4 °C with 4 mL of nickel affinity resin (Ni-NTA Agarose). The resin was loaded into a 20 mL fritted glass column and washed with 40 mL of 50 mM phosphate buffer, pH 7.5, containing 500 mM NaCl, 20% v/v glycerol followed by 40 and 20 mL of the same solution supplemented with 5 and 20 mM imidazole respectively. The protein constructs were eluted with 20 mL of 50 mM phosphate buffer, pH 7.5, containing 500 mM NaCl and 200 mM imidazole and dialyzed overnight in 50 mM phosphate buffer, pH 7.5, containing 1 mM EDTA and 20% v/v glycerol. Proteins were concentrated by centrifugal filtration to ~1 mL and stored at −20 °C.
Protein Handling
Concentrations of thioredoxin, mCherry and mRuby2 proteins were calculated using extinction coefficients of 12.9, 72 and 113 mM−1cm−1 at 280, 587 and 559 nm respectively. Because the oxidized flavin absorbance envelope does not extent beyond 530 nm, the concentrations of mRuby2 and mCherry fusion proteins were determined at 559 and 587 nm respectively. Reduced EcTrx1 was prepared by incubating with a 10-fold molar excess of DTT over total cysteine residues for 1 h at 25 °C. The treated protein (0. 7 mL) was then applied to a PD-10 size-exclusion column (GE Healthcare) equilibrated with phosphate buffer. Baseline separation between reduced protein and excess DTT was verified by sampling small volumes of eluent using 5,5′-dithiobis(2-nitrobenzoate) (DTNB). Completely oxidized EcTrx1 was prepared by incubating the protein, as isolated, with 10 mM potassium ferricyanide in phosphate buffer for 30 min at 25 °C, followed by removal of small molecule reagents on a PD-10 column.
NADPH Reductase Activity of TrxR-mCherry and TrxRGV-mCherry
Wild type (10 nM) and mutant (1 μM) sensors were compared in a total volume of 200 μL solution containing 50 mM Tris, pH 7.5, 1 mM EDTA, 1 mM DTNB and 25 μM oxidized EcTrx1 at 25 °C. Reactions were initiated by the addition of 100 μM NADPH. The resulting increase in absorbance was followed at 415 nm and the initial rate from 4 replicate experiments was averaged.
In Vitro TrxRGV-mCherry Reduction Assay
The probe (1 μM) in 200 μL of 100 mM potassium phosphate solution, pH 7.0, containing 1 mM EDTA together with 10 mM glucose, 50 nM Aspergillus niger glucose oxidase and 50 nM bovine liver catalase to lower dissolved oxygen concentrations for prolonged measurements. Samples were then challenged with 10 mM DTT, 10 mM GSH, or 100 μM NADPH at 50 s. The data shown were the average of 3 experiments normalized to the same starting relative fluorescence (exciting and emitting at 456 and 520 nm respectively). The more rapid reduction of the probe with reduced thioredoxin was examined as above, but using 0.1 and 1.0 μM protein concentrations respectively.
Thioredoxin Titration of TrxRGV-mCherry
Aliquots of the probe (1 μM in the same buffer system used above) were combined with mixtures of reduced and oxidized thioredoxin totaling 200 μM in 200 μL. As before, solutions were gently mixed to avoid undue re-oxygenation of the solution and the fluorescence spectra exciting at 456 nm recorded after 30 s.
In Vivo TrxRGV-mCherry Reduction Assay
Keio parent strain E. coli cells27 containing the probe plasmid were grown overnight in LB broth containing 50 mg/L ampicillin and 1 mM IPTG. One milliliter of an overnight culture was transferred to 10 mL of the same media and grown to an optical density of 1.0 at 600 nm. The cells were collected by centrifugation, resuspended and washed three times in M9 minimal medium before final re-suspension to an optical density of 0.4 in ice-cold M9 medium. As needed, aliquots were warmed to room temperature and mixed with 10 mM DTT, 10 mM GSH, 100 μM NADPH or 1 μM reduced Trx1 at 50 s to give a final volume of 200 μL. Fluorescence measurements (excitation and emission at 456 and 520 nm, respectively) were recorded before and after the addition of reductants. Data were corrected for dilution and represent an average of 3 experiments.
Imaging E. COLI Cells
Plasmid-containing Keio E. coli cells were grown overnight in LB broth containing 50 mg/L ampicillin and 1 mM IPTG. A 100 mL flask containing 10 mL of the same medium was inoculated with 1 mL of starter culture. The culture was transferred with a sterile pipette, when the optical density at 600 nm reached 1.0, to an ibidi μ-Slide VI 0.4 flow-cell device previously treated with 0.1 mg/ml poly-L-lysine hydrobromide (as described by the manufacturer). After incubation in LB medium at 37 °C for 60 min, the flow cell was transferred to the microscope stage maintained at room temperature. The flow-cell channels were washed with M9 medium at 0.5 mL/min using a syringe pump to remove non-adherent cells prior to imaging using an inverted Zeiss LSM 880 laser scanning confocal microscope equipped with a Plan-Neofluar 40x/1.3NA oil-immersion objective. The 458 and 561 nm laser lines excited sensor flavin and mCherry fluorophores with corresponding emission band pass limits of 472–552 nm (green channel) and 588–659 nm (red channel) respectively. Images of 512 × 200 pixels were captured every second and processed using Zen 2010D software (Version 7.0.0.223; see later). Where indicated, the composition of the medium flowing through the channels was supplemented with 5 mM DTT or 5 mM diamide during data acquisition.
LipDH-mCherry Reduction and Titration Experiments
Reduction studies were performed as described for the thioredoxin reductase probe using 1 μM LipDH probe with 10 mM GSH or 100 μM NADPH and 0.2 μM of the probe with 1 μM NADH. Data were adjusted for dilution and the average of 3 experiments normalized to the same starting relative fluorescence. Titrations with NAD+/NADH mixtures employed the same procedure used for thioredoxin titrations of the reductase probe (see above). Samples were excited at 456 nm and the resulting fluorescence was recorded at 520 nm. Data shown represent average of 3 experiments.
Mammalian Cell Culture and Imaging
Stock HEK293T cells (ATCC CRL-11268) were grown and maintained at 37 °C using 5% CO2 in Dulbecco’s Modified Eagle Medium (DMEM) with high glucose supplemented with 10% fetal bovine serum and 100 units/mL penicillin and streptomycin. Cells (maintained under 20 passages) were grown to 70–90% confluence, trypsinized and about 10,000 cells were used to seed the channels of an ibidi μ-Slide VI 0.4 ibiTreat flow cell. After 24 h cells, adherent cells were transiently transfected with a human-optimized DNA sequence for LipDH-mCherry (see Supporting Information) that was inserted into a pCMV-Tag2A vector using Lipofectamine 2000 treatment as per product protocol. Media was exchanged for fresh DMEM at 24 h and cells were imaged 48 h after transfection using a flow cell mounting chamber that was maintained at 37 °C in an atmosphere supplemented with 5% CO2. During measurements, cells were perfused at 0.5 mL/min with FluoroBrite DMEM (Gibco) supplemented with or without 10 mM pyruvate or lactate.
Image and Data Processing for Bacterial and Mammalian Sensors
Each image was recorded in green (472–552 nm) and red (588–659 nm) channels with a ratiometric channel reflecting red divided by green signals. Images were processed using a median filter with a 5×5 kernel size. Green and red channels were false colored with green and red, and comparative images were adjusted equally to exclude over- and under-saturation. The ratiometric channel was false colored with a Rainbow2 lookup table. Using the Zen software, regions of interest containing transfected and untransfected HEK293T cells were manually selected for examination. Data were corrected for a slow photobleaching of the flavin (averaging 24% after 400 measurements). Bleaching was fit to a single exponential and used to correct the signal for the green channel. Insignificant photobleaching of the red channel was encountered over 400 s. In E. coli, no photobleaching correction for the TrxRGV-mCherry probe was necessary.
Redox Measurements
The Nernst equation was used to convert redox potentials to the ratio of a particular redox couple, Cred/Cox of standard redox potential, E′o:
E′o values used for E. coli Trx1 and NAD+/NADH were −270 mV28–30 and −320 mV31 respectively.
For in vivo redox poise measurements, the fluorescence response values (V) for complete oxidation and reduction of the sensor (Vox and Vred respectively) were established as described in the text. The redox poise corresponding to a measured response is then:
RESULTS AND DISCUSSION
Design of a New Probe for Thioredoxin Proteins
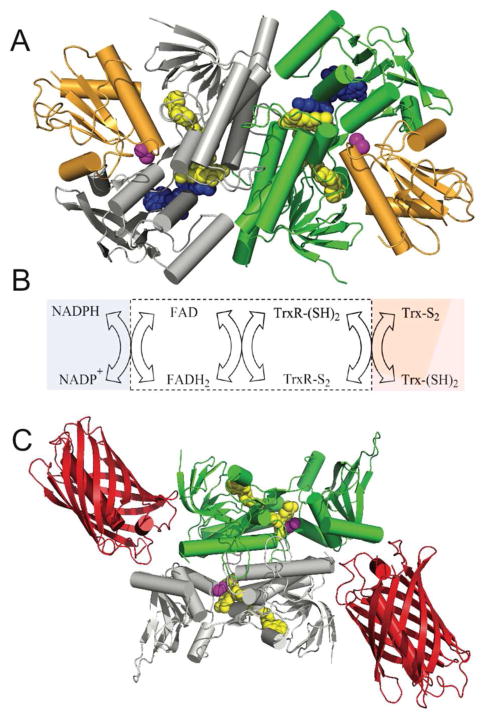
Thioredoxin reductase is a member of the flavoprotein disulfide oxidoreductase superfamily32–35 and plays important roles in mitigating oxidative stress and redox regulation, together with DNA synthesis and sulfur assimilation.29,36–39 The two subunits of the low molecular weight homo-dimeric E. coli thioredoxin reductase are delineated in grey and green in Figure 3A.40–42 Each subunit contains a bound FAD cofactor which is appreciably fluorescent in its oxidized form. During catalysis a conformational change brings the flavin cofactor in direct contact with either NADP+/NADPH (blue), or the redox active CxxC motif in the reductase (magenta). Reduction of this disulfide, generating the TrxR-(SH)2 form shown in Figure 3B, then mediates the reduction of bound thioredoxin (depicted in orange in Figure 3A). 33,35,43 It should be noted that there are two thioredoxins in E. coli (Trx1 and 2);29,39,44 both rapidly communicate with the reductase. Figure 3B shows the overall reversible flow of reducing equivalents; in the reductase direction, the pool of NADPH drives the reduction of oxidized intracellular thioredoxin via the mediation of flavin and a redox-active disulfide.33,35,43 We describe later how communication with the NADP+/NADPH pool can be disabled to allow this probe to specifically report thioredoxin redox state.
Figure 3.
E. coli thioredoxin reductase: structure, reactions and probe design. Panel A shows the three dimensional structure of E. coli thioredoxin reductase (PDB: 1F6M). The two subunits of this homodimer are depicted in green and grey and the bound thioredoxin (Trx1) is shown in orange. The space-filling representations of the flavin cofactor, a redox active disulfide, and the NADP+ analog, 3-aminopyridine adenine dinucleotide phosphate are in yellow, magenta, and blue respectively. Panel B shows the reductive and oxidative half-reactions without regard to protonation states of the reactants and products. The flavin and redox-active disulfide moieties of the reductase lie within the white box. Panel C is a schematic depiction of the sensor protein with the mCherry fluorescent protein (PDB: 2H5Q) fused to the C-terminus of thioredoxin reductase (PDB: 1CL0).
Expression and Characterization of Thioredoxin Sensors
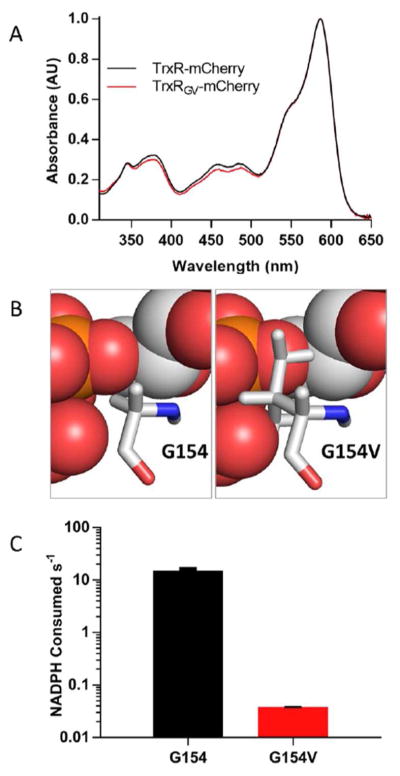
The monomeric fluorescent protein mCherry was initially chosen for the GFP domain component of the thioredoxin sensor (Figure 3C) and was fused to the C-terminus of thioredoxin reductase (DNA and protein sequences of all constructs are shown in the Supporting Information). The EcTrxR-mCherry fusion construct (TrxR-mCherry) was cloned into a pTrcHisA plasmid for expression in E. coli BL21-DE3 cells (see Methods). The protein was readily obtained in relatively high yield using the N-terminal HIS-tag. The construct was characterized by absorbance spectrum and found to contain the expected complement of flavin and mCherry (Figure 4A).
Figure 4.
UV-Vis spectrum of E. coli thioredoxin reductase-mCherry sensor and suppressing NADPH reactivity. Panel A shows the spectra of TrxR-mCherry and the NADPH binding-compromised mutant, TrxRGV-mCherry, recorded in 50 mM phosphate buffer, pH 7.5, containing 1 mM EDTA. Spectra are normalized using the absorbance at 587 nm. Panel B (left) represents the pyrophosphate moiety of an NADPH analog (red and orange spheres) bound to E. coli thioredoxin reductase (PDB 1F6M) with the glycine at position 154 depicted in stick representation. The right image depicts an in-silico G154V mutation at this position with the expected steric clash between the valine side chain and the pyrophosphate of the pyridine nucleotide. Panel C shows the NADPH reductase activity of native and G154V mutant probes.
With the probe in hand it was next necessary to disable communication with NADP+/NADPH. In a related pyridine nucleotide disulfide oxidoreductase, E. coli glutathione reductase, 32–35 replacement of a glycine for a valine in the dinucleotide binding site strongly disrupted NADP+/NADPH binding.45 The corresponding mutation in E. coli thioredoxin reductase is modeled in comparison to the wild type protein as shown in Figures 4B. We then prepared the corresponding GLY154VAL mutation (UV-Vis spectrum in Figure 4A) and found a similar ablation of the reactivity towards NADPH (Figure 4C; 391 ± 16 fold slower; from 15.0 ± 0.6 to 0.0384 ± 0.0006/s NADPH oxidized/s in the DTNB reductase assay; see Methods). This mutation was utilized in all subsequent thioredoxin probes to minimize their response to the intracellular NADPH/NADP+ pool (see later).
Emission profiles for the oxidized and reduced TrxR-G154V-mCherry probe (hereafter abbreviated TrxRGV-mCherry for convenience) are shown in Figure 5A. Here, FAD and mCherry fluorophores were independently excited at 456 nm and 520 nm (green and red spectra respectively). The characteristic oxidized flavin emission centered at ~520 nm is nearly completely quenched on reduction by a water soluble phosphine (THP) with a small residual bleed through at 610 nm reflecting minor direct excitation of mCherry. The emission spectrum of mCherry for the oxidized and reduced forms of the probe overlay (red spectra Figure 5A) and are therefore insensitive to the reduction of the EcTrxR domain. The inset to Figure 5B shows that micromolar concentrations of probe and reduced Trx1 equilibrate rapidly. This facile response allows the probe to sense oxidized/reduced Trx ratios (totaling 200 μM) as shown in Figure 5B and C. Calculating the redox poise of the mixtures using an E′o of −270 mV for E. coli Trx128–30 yields a midpoint value of −258 ± 1 mV for the probe (triplicate measurements; see Methods) consistent with the published midpoint potentials of the bacterial reductase.46 The measured redox potential is likely a combination of various EcTrxR redox states resulting from the similarity in redox potentials for flavin and disulfide at the 2- and 4-electron reduced level (E′o from −243 to −271 mV respectively).46
Figure 5.
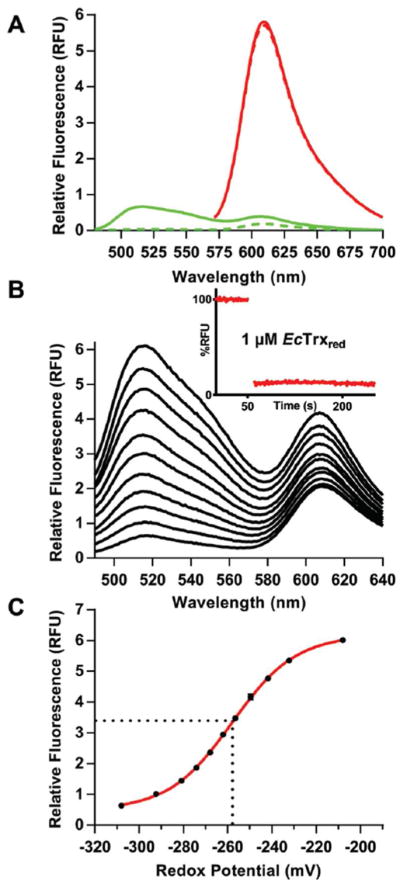
Characterization of TrxRGV-mCherry. Panel A shows the emission spectra of 1 μM of TrxRGV-mCherry before (solid line) and after reduction with 20 μM tris-hydroxpropylphosphine (THP, dashed line; see Methods) exciting into the flavin excitation envelope (456 nm; green curves) or into the mCherry chromophore using 520 nm light (red curves). Panel B represents the oxidized probe (top line) progressively reduced with mixtures of reduced and oxidized thioredoxin totaling 200 μM. The inset shows that the equilibration between TrxRGV-mCherry and reduced thioredoxin is rapid; even with 1 μM reagents. Panel C plots the amplitude of the 520 nm signal in Panel B against the redox potential of the mixture calculated from the Nernst equation. The standard redox potential of the probe was calculated to be −258 ± 1 mV (see Methods).
Thioredoxin Sensor Responds to Intracellular Thioredoxin
Figure 6A shows that TrxRGV-mCherry is refractory to reduction by 10 mM GSH and is reduced comparatively slowly by 10 mM DTT. The probe carrying the GLY/VAL mutation is sluggishly reduced by 100 μM NADPH in accord with the data presented earlier (Figure 4C). E. coli thioredoxin reductase is specific for NADPH over NADH47 and so the probe would be unable to effectively directly communicate with either pyridine nucleotide analog in vivo.
Figure 6.
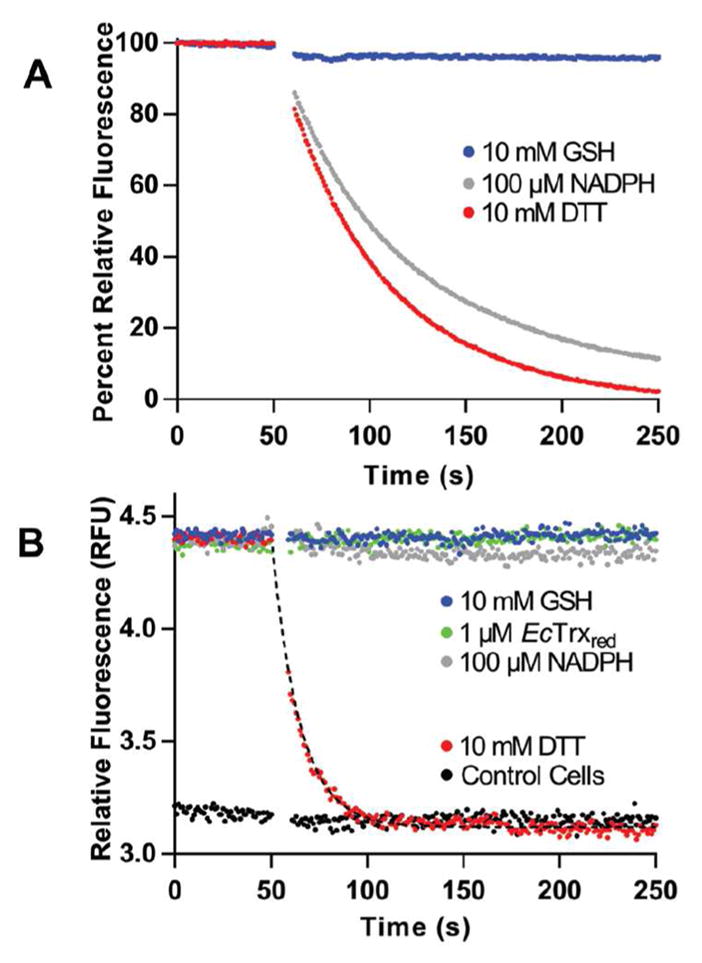
Reduction of TrxRGV-mCherry in vitro and in E. coli. Panel A shows the fluorescence of 1 μM probe mixed at 50 s with 10 mM of GSH or DTT or with 0.1 mM NADPH. Reduction for DTT and NADPH show half-times of 37 ± 2 s and 48 ± 2 s respectively analyzed by exponential fit. Panel B represents the fluorescence of E. coli cells expressing the thioredoxin probe before and after the addition of the indicated reagents. The lower lines represent a corresponding E. coli strain lacking the plasmid for TrxRGV-mCherry.
The sluggish response towards NADPH, and the non-reactivity of TrxR towards GSH provide the impetus to evaluate the probe in E. coli. We first examined a suspension of live bacterial cells expressing TrxRGV-mCherry in a conventional fluorimeter cuvette (see Methods). Figure 6B shows that the indicated concentrations of GSH, NADPH and reduced thioredoxin were ineffective when added to live bacterial cells suspended in M9 minimal media (see Methods). In contrast DTT is an effective reductant of the probe in E. coli, with reduction occurring about 4-fold faster than that recorded for the probe in buffer alone (compare Figure 6 panels A and B). This acceleration is rationalized below with the species within the bacterial cytosol depicted within square brackets.
Thus DTT is readily membrane permeant48–50 and the resulting internalized DTT is an efficient reductant of endogenous Trxox51 (see also Figure S1). The resulting Trxred then communicates rapidly with TrxRGV-mCherryox. Figure 6B also shows that a suspension of the corresponding E. coli strain lacking the plasmid for the probe (bottom horizontal data points) is completely unresponsive to treatment with DTT and the other reagents used above. Thus background cellular autofluorescence does not complicate these measurements.
TrxRGV-mCherry Sensor Imaged in Live E. coli Cells
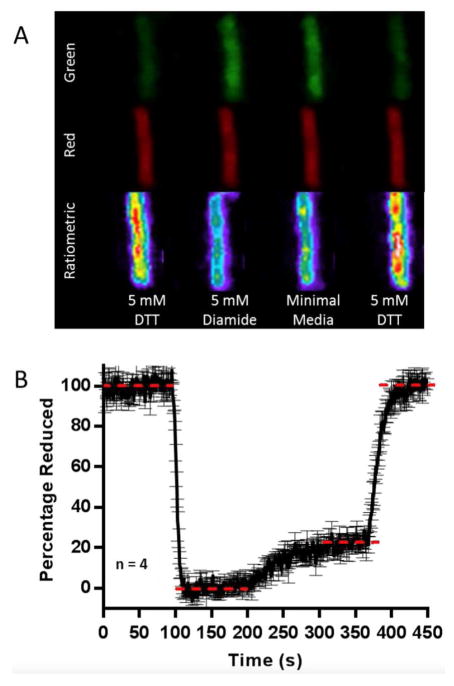
Figure 7A shows confocal images of an E. coli cell expressing TrxRGV-mCherry located on the bottom face of a flow chamber. Over 450 s the cell is treated with a series of redox-active permeant reagents dissolved in M9 minimal media. The sensor flavin and mCherry reference were excited using 458 and 561 nm laser lines and the ratiometric channel represents a division of the red by the green channel responses (see Methods). To establish fully reduced and oxidized limiting states, attached bacterial cells were first equilibrated with M9 media containing 5 mM DTT (Figure 7) and then exposed to the strong thiol oxidant diamide52–54 for the next 100 s. Diamide, at 5 mM, effects a rapid recovery of flavin fluorescence (Figure 7B; green channel). Diamide was removed by washing with minimal media allowing the intracellular thioredoxin pool to be visualized before the addition of 5 mM DTT to return the cells to their fully reduced state. Throughout the insensitivity of the red channel to cellular redox state (e.g. Figure 7A) allowed the red channel to serve as a crucial correction factor for confocal drift and cellular movement as described in Figure 2B. A wider field of view captured during the experiment in Figure 6 is presented in Supporting Information (Figure S2).
Figure 7.
Interrogating Thioredoxin Redox Poise in Live E. coli cells. Panel A displays sensor emission of three channels (green, red and ratiometric) of a single E. coli cell. Panel B depicts a quantification of the average of four replicate experiments using the ratiometric channel to express the percentage of TrxRGV-mCherry reduction.
Figure 7B shows the quantification of the average of four replicate experiments using the ratiometric channel to express the percentage of TrxRGV-mCherry reduction. Utilizing the minimum and maximum limits for the sensor in Figure 7B, together with the sensor response observed in minimal media allows the calculation of a redox poise of −242 ± 2 mV for the thioredoxin pool in the E. coli strain used in this work (Figure 7B, 4 determinations; see Methods). Under normal, non-stressed, conditions, Trx1 levels are 5- to 15-fold more abundant than Trx2 37,55 and therefore Trx1 would be expected to dominate the thioredoxin redox poise. Applying the Nernst equation using a value of −270 mV28,29 for the redox potential of Trx1 allows estimation of a 9:1 ratio of oxidized:reduced thioredoxin in the strain of E. coli used here. These data are consistent with pioneering work of Holmgren and Fagerstedt56 who found corresponding ratios of 9:1 to 3:2 oxidized:reduced in quenched extracts of E. coli.
While a number of organisms, including bacteria, yeast and plants have thioredoxin/thioredoxin reductase systems resembling that employed above,57,58 the TrxRGV-mCherry sensor will not communicate effectively with mammalian thioredoxins.57,58 The latter electron carriers interact with their cognate mechanistically divergent high molecular weight thioredoxin reductase via a C-terminal cysteine-selenocysteine dipeptide.35,58
Design of a New Probe for NAD+/NADH
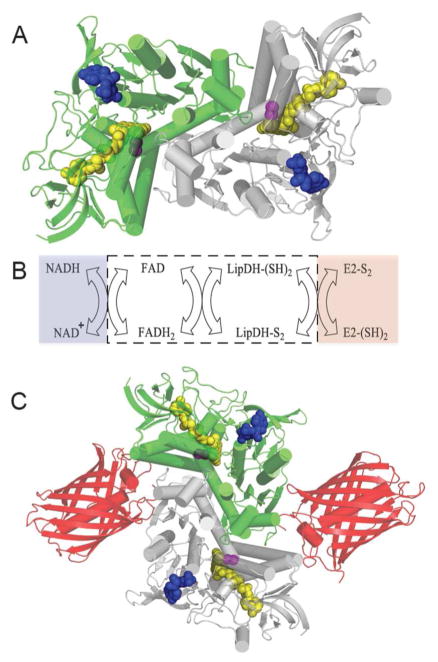
To explore whether a flavoenzyme-mCherry fusion could be constructed to sense a key redox pair in mammalian cells we exploited the intrinsic fluorescence of yeast lipoamide dehydrogenase (LipDH) to afford a facile and responsive sensor for NADH/NAD+. LipDH is a key enzyme best known for its involvement in role in the pyruvate dehydrogenase, α-ketoglutarate dehydrogenase, branched chain amino acid dehydrogenase and glycine cleavage multienzyme complexes. 59,60 We used LipDH from Saccharomyces cerevisiae in this work. Figure 8A shows a structure of this homodimeric protein; each subunit carries a bound FAD cofactor (yellow) and a binding pocket for NAD+/NADH (pyridine nucleotide in blue). The redox-active disulfide that communicates with the flavin prosthetic group within each subunit is shown in magenta and is located at the base of a deep tunnel that serves to isolate the enzyme from non-cognate thiol reductants. Intracellularly the physiological dithiol, dihydrolipoamide, is covalently attached to a lysine reside in a flexible region of dihydrolipoyl acetyl transferase (E2) and serves as the ultimate reductant for NAD+ via the series of transfers shown from right to left in Panel B. While it might be anticipated that development of a LipDH-based probe for NADH/NAD+ levels in mammalian cells would require disabling the dihydrolipoamide site, this is only necessary if the sensor is intended for use within the mitochondrial matrix; the lipoyllysine-E2 conjugate is exclusively mitochondrial.61–63 Here we test the new sensor using cytosolic expression.
Figure 8.
Lipoamide Dehydrogenase: structure, reactions and probe design. Panel A shows the three dimensional structure of S. cerevisiae lipoamide dehydrogenase (PDB: 1V59). The two subunits of this homodimer are depicted in green and grey and bound FAD, redox active disulfide, and NAD+ cofactors are shown as space-filling representations colored yellow, magenta, and blue respectively. Panel B shows the reductive and oxidative half reactions without regard to protonation states of the reactants and products. The flavin and redox active disulfide moieties of the dehydrogenase lie within the white box. Panel C is a schematic depiction of the fusion protein attached to the mCherry fluorescent protein (PDB: 2H5Q).
Expression and Characterization of NAD+/NADH Sensor
A schematic illustration of the fusion of mCherry to the C-terminus of LipDH is depicted in Figure 8C (with the nucleotide and protein sequences shown in Supporting Information). The sensor was first characterized after expression in E. coli BL21-DE3 cells (see Methods). The purified construct contained the expected complement of flavin and mCherry absorbance contributions (Figure 9A).
Figure 9.
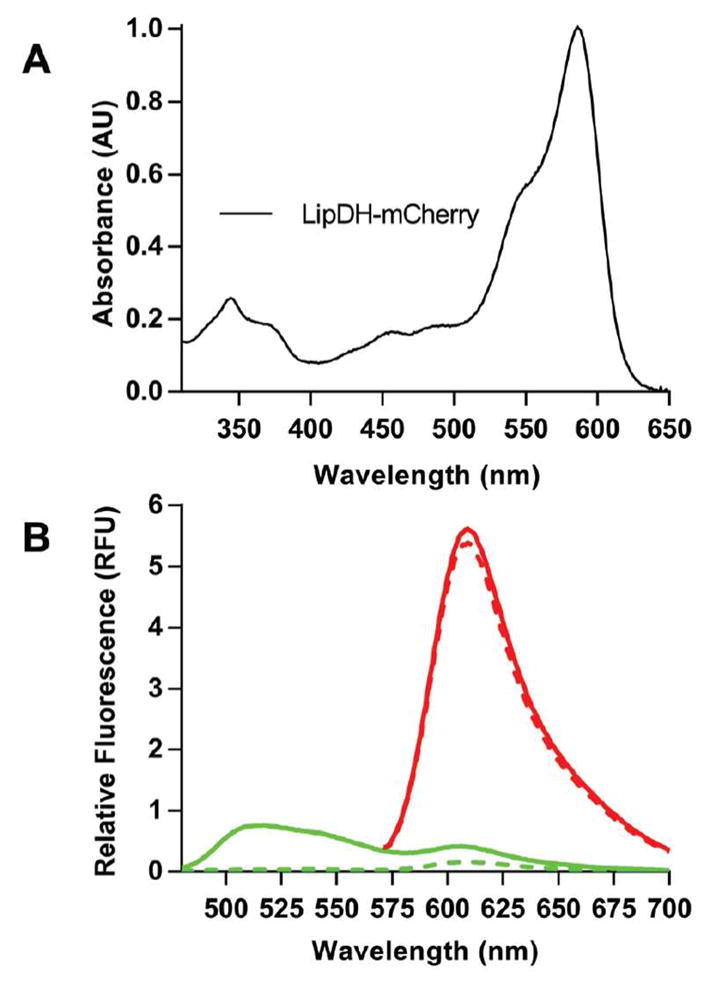
UV-Vis and fluorescence spectra of the LipDH-mCherry NAD+/NADH sensor. Spectra were recorded in 50 mM phosphate buffer, pH 7.5, containing 1 mM EDTA. Panel B shows the emission spectra of 1 μM of LipDH-mCherry before (solid line) and after reduction with 20 μM NADH (dashed line; see Methods) exciting into the flavin excitation envelope (456 nm; green curves) or into the mCherry chromophore using 520 nm light (red curves).
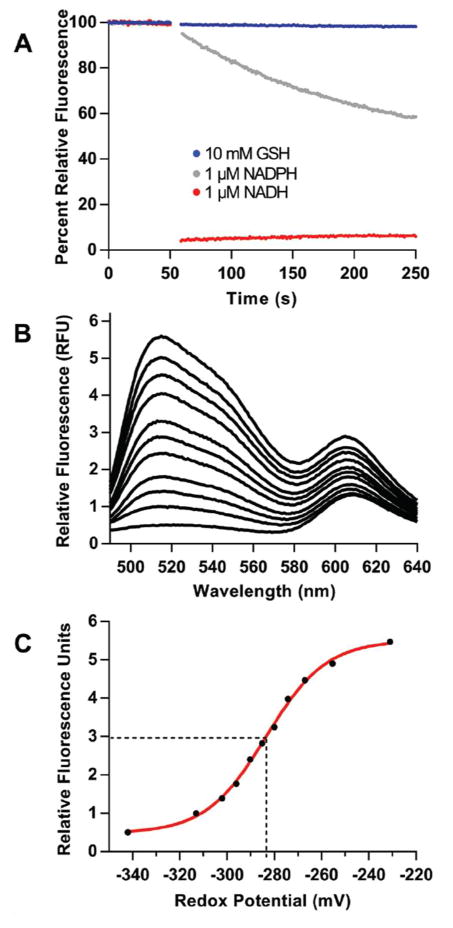
Emission profiles for the oxidized (solid lines) and reduced (dashed lines) LipDH-mCherry probe are shown in Figure 9B. FAD and mCherry fluorophores were independently excited at 456 and 520 nm (green and red lines respectively). The oxidized flavin emission at ~520 nm is almost completely quenched upon the addition of 20 μM NADH leaving a small residual signal at 610 nm due to weak direct excitation characteristic of mCherry (dashed line). Because of the minimal FRET contribution encountered in Figure 8A we again used the probe in a ratiometric mode by independently exciting mCherry at 520 nm so as to compensate for any change in the placement or concentration of the fluorophores. As before, the emission spectrum of mCherry is essentially insensitive to reduction of the sensor domain (Figure 9B). Figure 10A shows that bleaching of 100 nM probe by 1 μM NADH is complete in the time taken to mix reagents. NADPH is a very poor substrate of LipDH64,65 and the probe responds slowly to this pyridine nucleotide (Figure 10A; t1/2 of >300 s). The probe is unresponsive to 10 mM glutathione as would be expected. Figure 10B shows a titration of 1 μM LipDH-mCherry with mixtures of NAD+ and NADH totaling 200 μM and panel C plots the fluorescence at 520 nm against the redox potential of the pyridine nucleotide mixtures using a E′o value of −320 mV for NADH (see Methods).31 While published redox potentials of the yeast enzyme are not available, our measured midpoint −284 ± 1 mV (3 determinations) matches the value of −280 mV determined by Matthews and Williams for 2-electron reduction of the pig heart enzyme.66 This potential corresponds to reduction of the active-site disulfide immediately proximal to the flavin prosthetic group. The resulting thiolate to oxidized flavin charge-transfer complex32–35 ablates the strong fluorescence of the bound FAD generating the quenching shown in Figure 9B and 10B. Conversion to the 4-electron reduced enzyme with reduction of the flavin occurs at a considerably more negative redox potential of ~ −346 mV66 and would remain undetected here.
Figure 10.
Characterization of LipDH-mCherry. Panel A shows that the probe responds rapidly to 1 μM NADH, while being insensitive to glutathione and NADPH. Panel B depicts the fluorescence spectra of LipDH-mCherry after treatment with a series of mixtures of NAD+ and NADH totaling 200 μM; from all NAD+ (top curve) to solely NADH (bottom line). The fluorescence amplitude at 520 nm is plotted in panel C against the redox potential of the NAD+/NADH mixtures as calculated from the Nernst equation (see Methods) yielding the standard redox potential of the LipDH-mCherry probe.
NAD+/NADH Sensor Interacts Reversibly with Intracellular NAD+/NADH
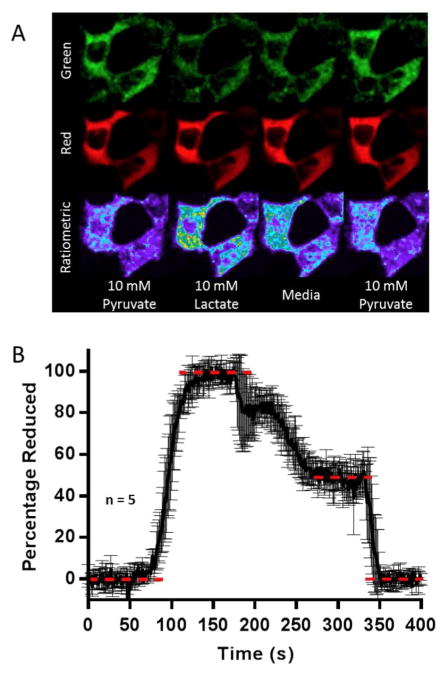
After an initial characterization of the LipDH-mCherry, we explored its performance in HEK293T mammalian cells. The sensor sequence was first optimized for expression in human cells and cloned into a pCMV-Tag 2A mammalian expression vector lacking organelle targeting sequences (Supporting Information).67 Cells visualized by confocal (Figures 11A and S3) show the expected cytosolic expression pattern for the mCherry signal. Using a flow cell (see Methods; 0.5 mL/min DMEM), supplements of 10 mM pyruvate and then 10 mM lactate were used to set the fully oxidized and fully reduced limits of the sensor. This strategy has been widely employed11,23,68 because intracellular lactate dehydrogenase catalyzes a rapid equilibration of lactate/pyruvate and NADH/NAD+ pools: 69
Figure 11.
Interrogating NADH/NAD+ Redox in Live HEK283T Cells. Panel A displays sensor emission of three channels (green, red and ratiometric) of HEK293T cells. Panel B depicts a quantification of the average of five replicate experiments using the ratiometric channel to express the percentage of LipDH-mCherry reduction.
The data in Figure 11A shows a collection of cells in the flow cell and the average of 5 experiments (see Methods) is shown in panel B. In each case the lactate wash was replaced with DMEM medium alone to assess the steady state of the intracellular NAD+/NADH pool, prior to a return to the limiting oxidized state upon reintroduction of pyruvate. The green oxidized flavin channel in panel A provides a clear visualization of the NAD+/NADH redox state. As before, the red channel is insensitive to media exchange allowing its use as an effective internal correction factor for confocal drift and the movement of live cells. Additional images of these experiments are provided in Figure S3. The value of 47 ± 6 % reduction of the LipDH-mCherry probe (midpoint potential of −284 ± 1 mV; see above) at 300 s in Figure 9 corresponds to a redox poise 282 ± 3 mV (see Methods). The corresponding NAD+/NADH ratio is then 18:1 (see Methods); a value falling within the range of values obtained for diverse mammalian cell types and sensors e.g. 10:1 to 830:1.23,69–72
CONCLUSIONS
As described earlier, many elegant prior sensor designs require site-specific splicing of an analyte-response element within a partner GFP domain (e.g. Figure 1B) and may entail multiple iterations to obtain a satisfactory response. In addition, the identification of analyte-binding domains that can support sensor development remains a challenge. As an alternate strategy, our proof of principle sensors employ a simple fusion of two components end-to-end. While there is much room for performance enhancements, both the NAD+/NADH and thioredoxin probes functioned intracellularly as initially constructed.
A large number of flavin-dependent oxidoreductases can be potentially monitored by a rational selection of the desired reductive or oxidative half-reaction. These facile catalysts would be expected to rapidly respond to specific metabolites at cellularly-relevant concentrations as observed here. An obvious issue for the general application of flavoenzyme-based sensors is the rather limited number of commonly-studied flavoproteins that are highly fluorescent in their oxidized states. While the fluorescence of protein-bound flavins is frequently strongly quenched by neighboring tyrosine and/or tryptophan side chains, several reports show that straightforward mutagenesis can restore fluorescence without ablation of enzymatic activity.73–76 In addition, the dramatic growth in available genome sequences affords ever increasing opportunities for the identification of new flavoenzyme probe candidates.
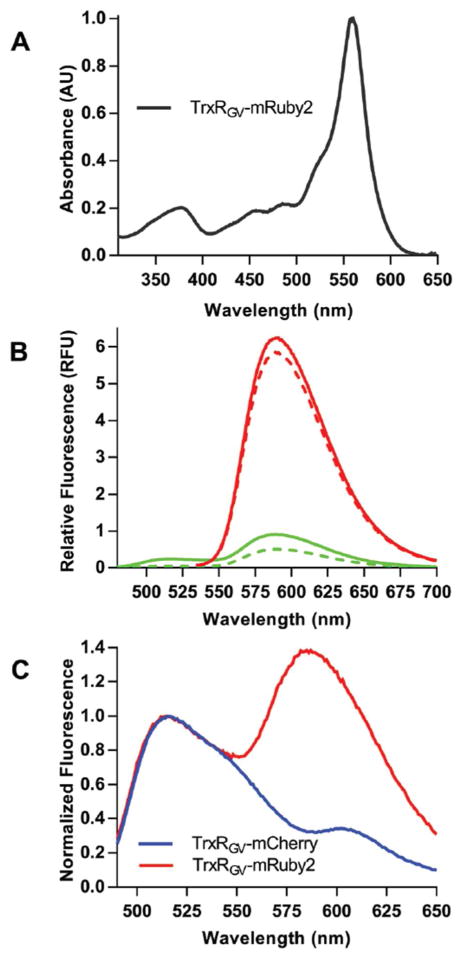
We note that further developments with these new flavin probes should include the option of utilizing the FRET signal to a suitable GFP acceptor. We initially chose mCherry because the mature protein is monomeric and can be readily expressed in a variety of cell types.77–79 Further, mCherry shows high photo-stability and has served as a FRET acceptor in a range of applications.80–82 However, while we were able to use the mCherry-flavoprotein contructs easily in the ratiometric mode (Figure 2B), the FRET component of the signal was too small to be practical. Preliminary experiments show that mRuby283 appears a superior choice over mCherry for the generation of FRET-based flavin-GFP probes. Figure 12 documents the UV-Vis and fluorescence properties of a TrxRGV-mRuby2 fusion prepared as before (see Methods). Compared to the mCherry probe, TrxRGV-mRuby2 demonstrates a much stronger FRET interaction (exciting at 456 nm and emitting at 600 nm as evident by the oxidized minus reduced spectra shown in panel C). Finally, in addition to these simple modular designs, a closer and optimized alignment of the fluorophores might be realized by introducing the GFP at a loop within the native flavoprotein structure. We envisage that these red-shifted FRET-enabled probes will extend the utility of this new class of genetically encoded sensors.
Figure 12.
Characterization of the TrxRGV-mRuby2 sensor. Panel A shows the UV-VIS absorbance spectra of the construct normalized to 559 nm. Panel B depicts the emission spectra excited at 456 nm (green) or 520 nm (red) for the oxidized and THP-reduced sensor (solid and dashed lines, respectively). Panel C shows difference spectra between oxidized and THP-reduced probes (TrxRGV -mRuby2 and TrxRGV -mCherry) excited at 456 nm and normalized using the flavin emission at 520 nm.
Supplementary Material
Acknowledgments
We thank Drs. Sharon Rozovsky and John Koh for helpful discussions. We acknowledge NIH GM26643 for support of the Thorpe laboratory. The confocal microscope used in this work was acquired with a shared instrumentation grant (S10 OD016361) and access was supported by NIH-NIGMS (P20 GM103446), NSF (IIA-1301765) and the State of Delaware.
Footnotes
Notes
The authors declare no competing financial interest.
Supporting Information is available free of charge on the ACS Publications website:
DNA and protein sequences of the probe constructs used in this work; Supporting Figure S1–S3
References
- 1.Miyawaki A, Llopis J, Heim R, McCaffery JM, Adams JA, Ikura M, Tsien RY. Fluorescent indicators for Ca2+ based on green fluorescent proteins and calmodulin. Nature. 1997;388:882–887. doi: 10.1038/42264. [DOI] [PubMed] [Google Scholar]
- 2.Qiao W, Mooney M, Bird AJ, Winge DR, Eide DJ. Zinc binding to a regulatory zinc-sensing domain monitored in vivo by using FRET. Proc Natl Acad Sci U S A. 2006;103:8674–8679. doi: 10.1073/pnas.0600928103. [DOI] [PMC free article] [PubMed] [Google Scholar]
- 3.Wegner SV, Arslan H, Sunbul M, Yin J, He C. Dynamic copper(I) imaging in mammalian cells with a genetically encoded fluorescent copper(I) sensor. J Am Chem Soc. 2010;132:2567–2569. doi: 10.1021/ja9097324. [DOI] [PubMed] [Google Scholar]
- 4.Lindenburg LH, Vinkenborg JL, Oortwijn J, Aper SJ, Merkx M. MagFRET: the first genetically encoded fluorescent Mg2+ sensor. PLoS One. 2013;8:e82009. doi: 10.1371/journal.pone.0082009. [DOI] [PMC free article] [PubMed] [Google Scholar]
- 5.Imamura H, Nhat KP, Togawa H, Saito K, Iino R, Kato-Yamada Y, Nagai T, Noji H. Visualization of ATP levels inside single living cells with fluorescence resonance energy transfer-based genetically encoded indicators. Proc Natl Acad Sci U S A. 2009;106:15651–15656. doi: 10.1073/pnas.0904764106. [DOI] [PMC free article] [PubMed] [Google Scholar]
- 6.Ye K, Schultz JS. Genetic engineering of an allosterically based glucose indicator protein for continuous glucose monitoring by fluorescence resonance energy transfer. Anal Chem. 2003;75:3451–3459. doi: 10.1021/ac034022q. [DOI] [PubMed] [Google Scholar]
- 7.Gruenwald K, Holland JT, Stromberg V, Ahmad A, Watcharakichkorn D, Okumoto S. Visualization of glutamine transporter activities in living cells using genetically encoded glutamine sensors. PLoS One. 2012;7:e38591. doi: 10.1371/journal.pone.0038591. [DOI] [PMC free article] [PubMed] [Google Scholar]
- 8.Tanimura A, Nezu A, Morita T, Turner RJ, Tojyo Y. Fluorescent biosensor for quantitative real-time measurements of inositol 1,4,5-trisphosphate in single living cells. J Biol Chem. 2004;279:38095–38098. doi: 10.1074/jbc.C400312200. [DOI] [PubMed] [Google Scholar]
- 9.Baird GS, Zacharias DA, Tsien RY. Circular permutation and receptor insertion within green fluorescent proteins. Proc Natl Acad Sci U S A. 1999;96:11241–11246. doi: 10.1073/pnas.96.20.11241. [DOI] [PMC free article] [PubMed] [Google Scholar]
- 10.Honda Y, Kirimura K. Generation of circularly permuted fluorescent-protein-based indicators for in vitro and in vivo detection of citrate. PLoS One. 2013;8:e64597. doi: 10.1371/journal.pone.0064597. [DOI] [PMC free article] [PubMed] [Google Scholar]
- 11.Zhao Y, Jin J, Hu Q, Zhou HM, Yi J, Yu Z, Xu L, Wang X, Yang Y, Loscalzo J. Genetically encoded fluorescent sensors for intracellular NADH detection. Cell Metab. 2011;14:555–566. doi: 10.1016/j.cmet.2011.09.004. [DOI] [PMC free article] [PubMed] [Google Scholar]
- 12.Belousov VV, Fradkov AF, Lukyanov KA, Staroverov DB, Shakhbazov KS, Terskikh AV, Lukyanov S. Genetically encoded fluorescent indicator for intracellular hydrogen peroxide. Nat Methods. 2006;3:281–286. doi: 10.1038/nmeth866. [DOI] [PubMed] [Google Scholar]
- 13.Tarrago L, Peterfi Z, Lee BC, Michel T, Gladyshev VN. Monitoring methionine sulfoxide with stereospecific mechanism-based fluorescent sensors. Nat Chem Biol. 2015;11:332–338. doi: 10.1038/nchembio.1787. [DOI] [PMC free article] [PubMed] [Google Scholar]
- 14.Ostergaard H, Henriksen A, Hansen FG, Winther JR. Shedding light on disulfide bond formation: engineering a redox switch in green fluorescent protein. Embo J. 2001;20:5853–5862. doi: 10.1093/emboj/20.21.5853. [DOI] [PMC free article] [PubMed] [Google Scholar]
- 15.Bjornberg O, Ostergaard H, Winther JR. Mechanistic insight provided by glutaredoxin within a fusion to redox-sensitive yellow fluorescent protein. Biochemistry. 2006;45:2362–2371. doi: 10.1021/bi0522495. [DOI] [PubMed] [Google Scholar]
- 16.Hanson GT, Aggeler R, Oglesbee D, Cannon M, Capaldi RA, Tsien RY, Remington SJ. Investigating mitochondrial redox potential with redox-sensitive green fluorescent protein indicators. J Biol Chem. 2004;279:13044–13053. doi: 10.1074/jbc.M312846200. [DOI] [PubMed] [Google Scholar]
- 17.Bhaskar A, Chawla M, Mehta M, Parikh P, Chandra P, Bhave D, Kumar D, Carroll KS, Singh A. Reengineering redox sensitive GFP to measure mycothiol redox potential of Mycobacterium tuberculosis during infection. PLoS Pathog. 2014;10:e1003902. doi: 10.1371/journal.ppat.1003902. [DOI] [PMC free article] [PubMed] [Google Scholar]
- 18.Gutscher M, Sobotta MC, Wabnitz GH, Ballikaya S, Meyer AJ, Samstag Y, Dick TP. Proximity-based protein thiol oxidation by H2O2-scavenging peroxidases. J Biol Chem. 2009;284:31532–31540. doi: 10.1074/jbc.M109.059246. [DOI] [PMC free article] [PubMed] [Google Scholar]
- 19.Gutscher M, Pauleau AL, Marty L, Brach T, Wabnitz GH, Samstag Y, Meyer AJ, Dick TP. Real-time imaging of the intracellular glutathione redox potential. Nat Methods. 2008;5:553–559. doi: 10.1038/nmeth.1212. [DOI] [PubMed] [Google Scholar]
- 20.Ghisla S, Massey V, Lhoste JM, Mayhew SG. Fluorescence and optical characteristics of reduced flavines and flavoproteins. Biochemistry. 1974;13:589–597. doi: 10.1021/bi00700a029. [DOI] [PubMed] [Google Scholar]
- 21.Hemmerich P, Nagelschneider G, Veeger C. Chemistry and molecular biology of flavins and flavoproteins. FEBS Lett. 1970;8:69–83. doi: 10.1016/0014-5793(70)80229-0. [DOI] [PubMed] [Google Scholar]
- 22.Visser AJ, Ghisla S, Massey V, Muller F, Veeger C. Fluorescence properties of reduced flavins and flavoproteins. Eur J Biochem. 1979;101:13–21. doi: 10.1111/j.1432-1033.1979.tb04210.x. [DOI] [PubMed] [Google Scholar]
- 23.Hung YP, Albeck JG, Tantama M, Yellen G. Imaging cytosolic NADH-NAD(+) redox state with a genetically encoded fluorescent biosensor. Cell Metab. 2011;14:545–554. doi: 10.1016/j.cmet.2011.08.012. [DOI] [PMC free article] [PubMed] [Google Scholar]
- 24.Mukhtarov M, Liguori L, Waseem T, Rocca F, Buldakova S, Arosio D, Bregestovski P. Calibration and functional analysis of three genetically encoded Cl(−)/pH sensors. Front Mol Neurosci. 2013;6:9. doi: 10.3389/fnmol.2013.00009. [DOI] [PMC free article] [PubMed] [Google Scholar]
- 25.Kumagai A, Ando R, Miyatake H, Greimel P, Kobayashi T, Hirabayashi Y, Shimogori T, Miyawaki A. A bilirubin-inducible fluorescent protein from eel muscle. Cell. 2013;153:1602–1611. doi: 10.1016/j.cell.2013.05.038. [DOI] [PubMed] [Google Scholar]
- 26.Codding JA, Israel BA, Thorpe C. Protein Substrate Discrimination in the Quiescin Sulfhydryl Oxidase (QSOX) Family. Biochemistry. 2012;51:4226–4235. doi: 10.1021/bi300394w. [DOI] [PMC free article] [PubMed] [Google Scholar]
- 27.Datsenko KA, Wanner BL. One-step inactivation of chromosomal genes in Escherichia coli K-12 using PCR products. Proc Natl Acad Sci U S A. 2000;97:6640–6645. doi: 10.1073/pnas.120163297. [DOI] [PMC free article] [PubMed] [Google Scholar]
- 28.Krause G, Holmgren A. Substitution of the conserved tryptophan 31 in Escherichia coli thioredoxin by site-directed mutagenesis and structure-function analysis. J Biol Chem. 1991;266:4056–4066. [PubMed] [Google Scholar]
- 29.Collet JF, Messens J. Structure, function, and mechanism of thioredoxin proteins. Antioxid Redox Signal. 2010;13:1205–1216. doi: 10.1089/ars.2010.3114. [DOI] [PubMed] [Google Scholar]
- 30.Krause G, Lundstrom J, Barea JL, Pueyo de la Cuesta C, Holmgren A. Mimicking the active site of protein disulfide-isomerase by substitution of proline 34 in Escherichia coli thioredoxin. J Biol Chem. 1991;266:9494–9500. [PubMed] [Google Scholar]
- 31.Burton K, Wilson TH. The Free-Energy Changes for the Reduction of Diphosphopyridine Nucleotide and the Dehydrogenation of L-Malate and L-Glycerol 1-Phosphate. Biochem J. 1953;54:86–94. doi: 10.1042/bj0540086. [DOI] [PMC free article] [PubMed] [Google Scholar]
- 32.Williams C., Jr . Lipoamide dehydrogenase, glutathione reductase, thioredoxin reductase, and mercuric ion reductase---A family of flavoenzyme transhydrogenases. In: Muller F, editor. Chemistry and Biochemistry of Flavoenzymes. CRC Press; Boco Raton: 1992. pp. 121–211. [Google Scholar]
- 33.Williams CH, Arscott LD, Muller S, Lennon BW, Ludwig ML, Wang PF, Veine DM, Becker K, Schirmer RH. Thioredoxin reductase two modes of catalysis have evolved. Eur J Biochem. 2000;267:6110–6117. doi: 10.1046/j.1432-1327.2000.01702.x. [DOI] [PubMed] [Google Scholar]
- 34.Argyrou A, Blanchard JS. Flavoprotein disulfide reductases: advances in chemistry and function. Prog Nucleic Acid Res Mol Biol. 2004;78:89–142. doi: 10.1016/S0079-6603(04)78003-4. [DOI] [PubMed] [Google Scholar]
- 35.Miller SM. Flavoprotein disulfide reductases and structurally related flavoprotein thiol/disulfide-linked oxidoreductases. In: Hille R, Miller SM, Palfey BA, editors. Handbook of Flavoproteins. De Gruyter; Berlin: 2013. pp. 165–201. [Google Scholar]
- 36.Toledano MB, Kumar C, Le Moan N, Spector D, Tacnet F. The system biology of thiol redox system in Escherichia coli and yeast: differential functions in oxidative stress, iron metabolism and DNA synthesis. FEBS Lett. 2007;581:3598–3607. doi: 10.1016/j.febslet.2007.07.002. [DOI] [PubMed] [Google Scholar]
- 37.Miranda-Vizuete A, Damdimopoulos AE, Gustafsson J, Spyrou G. Cloning, expression, and characterization of a novel Escherichia coli thioredoxin. J Biol Chem. 1997;272:30841–30847. doi: 10.1074/jbc.272.49.30841. [DOI] [PubMed] [Google Scholar]
- 38.Lillig CH, Prior A, Schwenn JD, Aslund F, Ritz D, Vlamis-Gardikas A, Holmgren A. New thioredoxins and glutaredoxins as electron donors of 3′-phosphoadenylylsulfate reductase. J Biol Chem. 1999;274:7695–7698. doi: 10.1074/jbc.274.12.7695. [DOI] [PubMed] [Google Scholar]
- 39.Collet JF, D’Souza JC, Jakob U, Bardwell JC. Thioredoxin 2, an oxidative stress-induced protein, contains a high affinity zinc binding site. J Biol Chem. 2003;278:45325–45332. doi: 10.1074/jbc.M307818200. [DOI] [PubMed] [Google Scholar]
- 40.Waksman G, Krishna TSR, Williams CH, Kuriyan JJ. Crystal structure of Escherichia coli thioredoxin reductase refined at 2 A resolution. Implications for a large conformational change during catalysis. J Mol Biol. 1994;236:800–816. [PubMed] [Google Scholar]
- 41.Lennon BW, Williams CH, Jr, Ludwig ML. Crystal structure of reduced thioredoxin reductase from Escherichia coli: structural flexibility in the isoalloxazine ring of the flavin adenine dinucleotide cofactor. Protein Sci. 1999;8:2366–2379. doi: 10.1110/ps.8.11.2366. [DOI] [PMC free article] [PubMed] [Google Scholar]
- 42.Lennon BW, Williams CH, Jr, Ludwig ML. Twists in catalysis: alternating conformations of Escherichia coli thioredoxin reductase. Science. 2000;289:1190–1194. doi: 10.1126/science.289.5482.1190. [DOI] [PubMed] [Google Scholar]
- 43.Williams CH., Jr Mechanism and structure of thioredoxin reductase from Escherichia coli. FASEB J. 1995;9:1267–1276. doi: 10.1096/fasebj.9.13.7557016. [DOI] [PubMed] [Google Scholar]
- 44.El Hajjaji H, Dumoulin M, Matagne A, Colau D, Roos G, Messens J, Collet JF. The zinc center influences the redox and thermodynamic properties of Escherichia coli thioredoxin 2. J Mol Biol. 2009;386:60–71. doi: 10.1016/j.jmb.2008.11.046. [DOI] [PubMed] [Google Scholar]
- 45.Rescigno M, Perham RN. Structure of the NADPH-Binding Motif of Glutathione Reductase: Efficiency Determined by Evolution. Biochemistry. 1994;33:5721–5727. doi: 10.1021/bi00185a008. [DOI] [PubMed] [Google Scholar]
- 46.O’Donnell ME, Williams CH., Jr Proton stoichiometry in the reduction of the FAD and disulfide of Escherichia coli thioredoxin reductase. Evidence for a base at the active site. J Biol Chem. 1983;258:13795–13805. [PubMed] [Google Scholar]
- 47.Thelander L. Thioredoxin reductase. Characterization of a homogenous preparation from Escherichia coli B. J Biol Chem. 1967;242:852–859. [PubMed] [Google Scholar]
- 48.Missiakas D, Georgopoulos C, Raina S. The Escherichia coli dsbC (xprA) gene encodes a periplasmic protein involved in disulfide bond formation. EMBO J. 1994;13:2013–2020. doi: 10.1002/j.1460-2075.1994.tb06471.x. [DOI] [PMC free article] [PubMed] [Google Scholar]
- 49.Cabibbo A, Pagani M, Fabbri M, Rocchi M, Farmery MR, Bulleid NJ, Sitia R. ERO1-L, a human protein that favors disulfide bond formation in the endoplasmic reticulum. J Biol Chem. 2000;275:4827–4833. doi: 10.1074/jbc.275.7.4827. [DOI] [PubMed] [Google Scholar]
- 50.Wittrup KD. Disulfide bond formation and eukaryotic secretory productivity. Curr Opin Biotechnol. 1995;6:203–208. doi: 10.1016/0958-1669(95)80033-6. [DOI] [PubMed] [Google Scholar]
- 51.Holmgren A. Thioredoxin catalyzes the reduction of insulin disulfides by dithiothreitol and dihydrolipoamide. J Biol Chem. 1979;254:9627–9632. [PubMed] [Google Scholar]
- 52.Kosower NS, Kosower EM. Diamide: an oxidant probe for thiols. Methods Enzymol. 1995;251:123–133. doi: 10.1016/0076-6879(95)51116-4. [DOI] [PubMed] [Google Scholar]
- 53.Gitler C, Zarmi B, Kalef E. General method to identify and enrich vicinal thiol proteins present in intact cells in the oxidized, disulfide state. Anal Biochem. 1997;252:48–55. doi: 10.1006/abio.1997.2294. [DOI] [PubMed] [Google Scholar]
- 54.Hansen RE, Roth D, Winther JR. Quantifying the global cellular thiol-disulfide status. Proc Natl Acad Sci U S A. 2009;106:422–427. doi: 10.1073/pnas.0812149106. [DOI] [PMC free article] [PubMed] [Google Scholar]
- 55.Potamitou A, Holmgren A, Vlamis-Gardikas A. Protein levels of Escherichia coli thioredoxins and glutaredoxins and their relation to null mutants, growth phase, and function. J Biol Chem. 2002;277:18561–18567. doi: 10.1074/jbc.M201225200. [DOI] [PubMed] [Google Scholar]
- 56.Holmgren A, Fagerstedt M. The in vivo distribution of oxidized and reduced thioredoxin in Escherichia coli. J Biol Chem. 1982;257:6926–6930. [PubMed] [Google Scholar]
- 57.Hirt RP, Muller S, Embley TM, Coombs GH. The diversity and evolution of thioredoxin reductase: new perspectives. Trends Parasitol. 2002;18:302–308. doi: 10.1016/s1471-4922(02)02293-6. [DOI] [PubMed] [Google Scholar]
- 58.Koharyova M, Kollarova M. Thioredoxin system - a novel therapeutic target. Gen Physiol Biophys. 2015;34:221–233. doi: 10.4149/gpb_2015006. [DOI] [PubMed] [Google Scholar]
- 59.Reed LJ. A trail of research from lipoic acid to alpha-keto acid dehydrogenase complexes. J Biol Chem. 2001;276:38329–38336. doi: 10.1074/jbc.R100026200. [DOI] [PubMed] [Google Scholar]
- 60.Patel MS, Roche TE. Molecular biology and biochemistry of pyruvate dehydrogenase complexes. FASEB J. 1990;4:3224–3233. doi: 10.1096/fasebj.4.14.2227213. [DOI] [PubMed] [Google Scholar]
- 61.Reed LJ. Multienzyme Complexes. Accounts Chem Res. 1974;7:40–46. [Google Scholar]
- 62.Olson MS. Regulation of the mitochondrial multienzyme complexes in complex metabolic systems. Ann N Y Acad Sci. 1989;573:218–229. doi: 10.1111/j.1749-6632.1989.tb14999.x. [DOI] [PubMed] [Google Scholar]
- 63.Maas E, Bisswanger H. Localization of the alpha-oxoacid dehydrogenase multienzyme complexes within the mitochondrion. FEBS Lett. 1990;277:189–190. doi: 10.1016/0014-5793(90)80840-f. [DOI] [PubMed] [Google Scholar]
- 64.Bocanegra JA, Scrutton NS, Perham RN. Creation of an NADP-dependent pyruvate dehydrogenase multienzyme complex by protein engineering. Biochemistry. 1993;32:2737–2740. doi: 10.1021/bi00062a001. [DOI] [PubMed] [Google Scholar]
- 65.Blacker TS, Duchen MR. Investigating mitochondrial redox state using NADH and NADPH autofluorescence. Free Radical Bio Med. 2016;100:53–65. doi: 10.1016/j.freeradbiomed.2016.08.010. [DOI] [PMC free article] [PubMed] [Google Scholar]
- 66.Matthews RG, Williams CH., Jr Measurement of the oxidation-reduction potentials for two-electron and four-electron reduction of lipoamide dehydrogenase from pig heart. J Biol Chem. 1976;251:3956–3964. [PubMed] [Google Scholar]
- 67.Kim DH, Hwang I. Direct targeting of proteins from the cytosol to organelles: the ER versus endosymbiotic organelles. Traffic. 2013;14:613–621. doi: 10.1111/tra.12043. [DOI] [PubMed] [Google Scholar]
- 68.Zhai Y, Bai S, Liu J, Yang L, Han L, Huang X, He J. Identification of an unusual type II thioesterase in the dithiolopyrrolone antibiotics biosynthetic pathway. Biochem Biophys Res Commun. 2016;473:329–335. doi: 10.1016/j.bbrc.2016.03.105. [DOI] [PubMed] [Google Scholar]
- 69.Williamson DH, Lund P, Krebs HA. The redox state of free nicotinamide-adenine dinucleotide in the cytoplasm and mitochondria of rat liver. Biochem J. 1967;103:514–527. doi: 10.1042/bj1030514. [DOI] [PMC free article] [PubMed] [Google Scholar]
- 70.Zhang Q, Piston DW, Goodman RH. Regulation of corepressor function by nuclear NADH. Science. 2002;295:1895–1897. doi: 10.1126/science.1069300. [DOI] [PubMed] [Google Scholar]
- 71.Sun F, Dai C, Xie J, Hu X. Biochemical issues in estimation of cytosolic free NAD/NADH ratio. PLoS One. 2012;7:e34525. doi: 10.1371/journal.pone.0034525. [DOI] [PMC free article] [PubMed] [Google Scholar]
- 72.Zhao Y, Wang A, Zou Y, Su N, Loscalzo J, Yang Y. In vivo monitoring of cellular energy metabolism using SoNar, a highly responsive sensor for NAD(+)/NADH redox state. Nat Protoc. 2016;11:1345–1359. doi: 10.1038/nprot.2016.074. [DOI] [PubMed] [Google Scholar]
- 73.Berry A, Scrutton NS, Perham RN. Switching kinetic mechanism and putative proton donor by directed mutagenesis of glutathione reductase. Biochemistry. 1989;28:1264–1269. doi: 10.1021/bi00429a047. [DOI] [PubMed] [Google Scholar]
- 74.Maeda-Yorita K, Russell GC, Guest JR, Massey V, Williams CH., Jr Properties of lipoamide dehydrogenase altered by site-directed mutagenesis at a key residue (I184Y) in the pyridine nucleotide binding domain. Biochemistry. 1991;30:11788–11795. doi: 10.1021/bi00115a008. [DOI] [PubMed] [Google Scholar]
- 75.Visser AJWG, van den Berg PAW, Visser NV, van Hoek A, van den Burg HA, Parsonage D, Claiborne A. Time-resolved fluorescence of flavin adenine dinucleotide in wild-type and mutant NADH peroxidase. Elucidation of quenching sites and discovery of a new fluorescence depolarization mechanism. J Phys Chem B. 1998;102:10431–10439. [Google Scholar]
- 76.Mataga N, Chosrowjan H, Shibata Y, Tanaka F. Ultrafast fluorescence quenching dynamics of flavin chromophores in protein nanospace. J Phys Chem B. 1998;102:7081–7084. [Google Scholar]
- 77.Shaner NC, Lin MZ, McKeown MR, Steinbach PA, Hazelwood KL, Davidson MW, Tsien RY. Improving the photostability of bright monomeric orange and red fluorescent proteins. Nat Methods. 2008;5:545–551. doi: 10.1038/nmeth.1209. [DOI] [PMC free article] [PubMed] [Google Scholar]
- 78.Fink D, Wohrer S, Pfeffer M, Tombe T, Ong CJ, Sorensen PH. Ubiquitous expression of the monomeric red fluorescent protein mCherry in transgenic mice. Genesis. 2010;48:723–729. doi: 10.1002/dvg.20677. [DOI] [PubMed] [Google Scholar]
- 79.Ransom EM, Ellermeier CD, Weiss DS. Use of mCherry Red fluorescent protein for studies of protein localization and gene expression in Clostridium difficile. Appl Environ Microbiol. 2015;81:1652–1660. doi: 10.1128/AEM.03446-14. [DOI] [PMC free article] [PubMed] [Google Scholar]
- 80.Albertazzi L, Arosio D, Marchetti L, Ricci F, Beltram F. Quantitative FRET analysis with the EGFP-mCherry fluorescent protein pair. Photochem Photobiol. 2009;85:287–297. doi: 10.1111/j.1751-1097.2008.00435.x. [DOI] [PubMed] [Google Scholar]
- 81.Grunberg R, Burnier JV, Ferrar T, Beltran-Sastre V, Stricher F, van der Sloot AM, Garcia-Olivas R, Mallabiabarrena A, Sanjuan X, Zimmermann T, Serrano L. Engineering of weak helper interactions for high-efficiency FRET probes. Nat Methods. 2013;10:1021–1027. doi: 10.1038/nmeth.2625. [DOI] [PubMed] [Google Scholar]
- 82.Lindenburg LH, Hessels AM, Ebberink EH, Arts R, Merkx M. Robust red FRET sensors using self-associating fluorescent domains. ACS Chem Biol. 2013;8:2133–2139. doi: 10.1021/cb400427b. [DOI] [PMC free article] [PubMed] [Google Scholar]
- 83.Lam AJ, St-Pierre F, Gong Y, Marshall JD, Cranfill PJ, Baird MA, McKeown MR, Wiedenmann J, Davidson MW, Schnitzer MJ, Tsien RY, Lin MZ. Improving FRET dynamic range with bright green and red fluorescent proteins. Nat Methods. 2012;9:1005–1012. doi: 10.1038/nmeth.2171. [DOI] [PMC free article] [PubMed] [Google Scholar]
Associated Data
This section collects any data citations, data availability statements, or supplementary materials included in this article.


