

Abstract
Background
Mixed evidence suggests second-generation antidepressants may increase risk of cardiovascular and cerebrovascular events.
Objective
Assess whether antidepressant use is associated with acute coronary heart disease, stroke, cardiovascular disease death, and all-cause mortality.
Methods
Secondary analyses of the Reasons for Geographic and Racial Differences in Stroke (REGARDS) longitudinal cohort study were conducted. Use of selective serotonin reuptake inhibitors, serotonin and norepinephrine reuptake inhibitors, bupropion, nefazodone, and trazodone was measured during the baseline (2003-2007) in-home visit. Outcomes of coronary heart disease, stroke, cardiovascular disease death, and all-cause mortality were assessed every 6 months and adjudicated by medical record review. Cox proportional hazards time-to-event analysis followed patients until their first event on or before December 31, 2011, iteratively adjusting for covariates.
Results
Among 29,616 participants, 3,458 (11.7%) used an antidepressant of interest. Intermediate models adjusting for everything but physical and mental health found an increased risk of acute coronary heart disease (Hazard Ratio=1.21; 95% CI 1.04-1.41), stroke (Hazard Ratio=1.28; 95% CI 1.02-1.60), cardiovascular disease death (Hazard Ratio =1.29; 95% CI 1.09-1.53), and all-cause mortality (Hazard Ratio=1.27; 95% CI 1.15-1.41) for antidepressant users. Risk estimates trended in this direction for all outcomes in the fully adjusted model, but only remained statistically associated with increased risk of all-cause mortality (Hazard Ratio=1.12; 95% CI 1.01-1.24). This risk was attenuated in sensitivity analyses censoring follow-up time at 2-years (Hazard Ratio=1.37; 95% CI 1.11-1.68).
Conclusions
In fully adjusted models antidepressant use was associated with a small increase in all-cause mortality.
Keywords: antidepressant, mortality, stroke, coronary heart disease, REGARDS
INTRODUCTION
The association between antidepressant use and risk of cardiovascular and cerebrovascular disease remains controversial. Antidepressant use has been linked to thicker arteries, which could contribute to the risk of heart disease and stroke.1 One study reported that the carotid intima-media thickness was five percent greater for twins taking vs not taking antidepressants.1 This was true both for selective serotonin reuptake inhibitors (SSRIs) and other antidepressants (which included serotonin and norepinephrine reuptake inhibitors (SNRIs), tricyclic antidepressants (TCAs), monoamine oxidase inhibitors (MAO-Is), and other miscellaneous antidepressants). For cerebrovascular disease, one prior study found that patients with major depression taking SSRIs as monotherapy over a 19 year period had a higher risk of stroke (adjusted risk ratio = 1.18) if they had taken a drug with high as opposed to low affinity for the serotonin transporter.2 Another large study of post-menopausal women found that those taking tricyclic antidepressants and SSRIs were 45 percent more likely to suffer a fatal stroke,3 and the overall death rate was 32 percent higher for those on the drugs. Despite these studies, the risk of cardiovascular and cerebrovascular events with antidepressant use is not a large consideration in clinical practice.4
Data from the Reasons for Geographic and Racial Differences in Stroke (REGARDS) study provide a unique resource for evaluating cardiovascular and cerebrovascular risk with antidepressants. REGARDS is a longitudinal cohort study of 30,239 whites and African-Americans designed to examine factors associated with excess stroke related mortality in the Southeastern United States and among African-Americans. The REGARDS-Myocardial Infarction (MI) ancillary study provides data on additional coronary heart disease outcomes. The goals of our analyses were to review baseline antidepressant use among REGARDS participants and to assess associations between antidepressant use and coronary heart disease (CHD), stroke, cardiovascular disease (CVD death), and all-cause mortality.
METHODS
Study participants
The REGARDS study is a national, population-based, biracial, longitudinal cohort study designed to examine underlying causes for racial and regional differences in stroke and CHD.5 Between January 2003 and October 2007, 30,239 individuals were enrolled, including 42% African Americans, 58% whites, 45% men, and 55% women. The sample includes 21% of participants from the Stroke Buckle (coastal plain region of North Carolina, South Carolina, and Georgia), 35% from the remaining areas of the Stroke Belt states (remainder of North Carolina, South Carolina, and Georgia, plus Alabama, Mississippi, Tennessee, Arkansas, and Louisiana), and 44% from the other 40 contiguous states (referred to as non-Belt). The study protocol was reviewed and approved by the institutional review boards at the participating institutions, and all participants provided informed consent.
Data collection
Baseline data were collected through a telephone interview, self-administered questionnaires, and an in-home examination. Telephone interviews collected data on sociodemographics, health behaviors, health status, and self-report of prior diagnoses of co-morbid conditions. Following the telephone interview, trained technicians conducted an in-home visit that included review of medication bottles, two blood pressure measurements, the collection of blood and urine samples, and an electrocardiogram (ECG).5
Participants or their proxies were contacted by telephone every 6 months following baseline to assess for stroke, CHD, and all-cause mortality. Medical records were retrieved and expert-adjudicated for suspected stroke and CHD-related hospitalizations and deaths.
Antidepressant exposure
Medication use was determined by the in-home medication bottle review. We included only the newer, most commonly used second-generation antidepressants, classified as SSRIs (citalopram, escitalopram, fluoxetine, fluvoxamine, paroxetine, and sertraline), serotonin and norepinephrine reuptake inhibitors (venlafaxine and duloxetine), and miscellaneous agents (bupropion, nefazodone, and trazodone).
Study outcomes
Death certificates, medical records, and autopsy reports were obtained to adjudicate cause of death, and cardiovascular outcomes were adjudicated using methods previously described.6 Prospectively assessed outcomes included CHD, stroke, CVD death, and all-cause mortality.
CHD
The occurrence of CHD events was defined as nonfatal MI or acute CHD death. Medical records were reviewed by trained clinician adjudicators to determine the study endpoints, following published guidelines.7,8 Specifically, medical records were examined for the following: presence of signs or symptoms suggestive of ischemia; a rising and/or falling pattern in cardiac troponin or creatine kinase-MB over 6 or more hours with a peak value greater than or equal to twice the upper limit of normal (diagnostic cardiac enzymes); and ECG changes consistent with ischemia or MI, guided by the Minnesota Code and classified as evolving diagnostic, positive, nonspecific or not consistent with ischemia.9,10 Additionally, following published guidelines, interviews with family members who were present around the time of death, baseline history, medical records in the last year of life, death certificates, the National Death Index, and autopsy reports were collected and reviewed to determine if the death was a CHD death.7,8
Stroke
Medical records, neuroimaging, and other diagnostic reports were obtained when participants self-reported a possible stroke, stroke symptoms, or when a participant died with a potential cause of stroke. Final adjudication was based on the World Health Organization’s definition of stroke and/or imaging results consistent with a stroke.11,12
CVD Death
The CVD death endpoint included death from stroke, CHD, heart failure, or other cardiovascular disease.
All-cause mortality
Participant deaths were detected by report of next-of-kin, online sources (e.g. the Social Security Death Index), and the National Death Index.
Additional covariates
Covariates were conceptualized to represent demographic and socioeconomic characteristics, health behaviors, medical conditions, preventive medication use, and markers of physical and mental health. Demographic and socioeconomic factors included age, sex, race, region, education, annual household income, and access to care and/or continuity of care which was measured by participant self-report of a usual source of care. Measures of health behaviors included cigarette smoking status (never, past, or current), alcohol use (defined as heavy: ≥ 7 drinks/week for women, ≥14 per week for men; moderate:1–7 for women, 1–14 for men; and none), report of engaging in no physical activity in the past week that worked up a sweat, and adherence to medications (with good adherence defined as “no” response to all 4 questions of the Morisky scale).13 Medical conditions included hypertension (defined as systolic blood pressure ≥ 140 mmHg or diastolic blood pressure ≥ 90 mmHg as assessed by the average of two measurements taken by a trained technician using a standard protocol and regularly tested aneroid sphygmomanometer, measured in the fasting state after the participant was seated for 5 minutes with both feet on the floor), diabetes (defined as taking insulin or oral hypoglycemic agents, or based on the baseline blood collection, a fasting blood glucose ≥ 126 mg/dL or a non-fasting blood glucose ≥ 200 mg/dL), and atrial fibrillation (defined as self-reported history or evidence on an electrocardiogram (ECG) performed during the in-home assessment). Preventive medication use included self-reported use of antihypertensive medications, statins, or aspirin. Physiological risk factors were captured by measures of total cholesterol, high-density lipoprotein (HDL) cholesterol, systolic blood pressure, body mass index, high-sensitivity C-reactive protein, urinary albumin to creatinine ratio, and QT interval corrected for heart rate. Finally, markers of physical and mental health were measured by the physical and mental component scores of the Short Form-12 (SF-12) functional status scale, presence of depressive symptoms (defined as score of ≥4 on the 4-item version of the Centers for Epidemiologic Study Depressive Scale [CES-D]), and moderate to high stress (defined as score of 3 or higher on Cohen’s perceived stress scale [PSS]).14 The use of benzodiazepines was controlled for since these drugs could be markers of mental health. Use of tricyclic antidepressants, which have previously been shown to be associated with the outcomes of interest,15 were considered only in sensitivity analyses that excluded participants on these drugs.
Participants with a history of CHD, stroke, abdominal aortic aneurysm, or peripheral arterial disease were considered to have a history of CVD. History of CHD at baseline was defined by a self-reported history or ECG evidence of myocardial infarction, or a self-reported history of a coronary revascularization procedure. History of stroke was defined on the basis of participant self-report.
Statistical analysis
Descriptive statistics for the antidepressant use categories were obtained by using unadjusted χ2 tests for the categorical characteristics and Student t-test for continuous characteristics. For each outcome, time-to-event analysis was performed; participants were followed until their first event. Incident events through December 31, 2011 were used for this analysis.
Sequentially adjusted Cox proportional hazards models were fit to examine hazard ratios (HRs) for antidepressant users compared with non-users for the four endpoints of CHD, stroke, CVD death, and all-cause mortality. Proportionality assumptions were tested via the interaction of antidepressant use with the natural log of follow up time. Initial unadjusted Cox proportional hazards models included only the antidepressant exposure. Model 1 adjusted for demographic and socioeconomic characteristics. Model 2 adjusted for model 1 covariates plus health behaviors, medical conditions (except hypertension), preventive medication use, and physiological risk factors. Baseline atrial fibrillation was adjusted for with all outcome measures except for CHD. Model 3 adjusted for all of the model 2 covariates plus markers of physical and mental health. The SF-12 mental health component score was not included in this model because of colinearity with the CES-D. Benzodiazepine use was included in model 3, and sensitivity analyses considered each model after excluding baseline TCA users. Multivariable multiple imputation by chained equations was used to replace missing data in covariates in 10 datasets with the sample bootstrapping.16
We conducted several stratified analyses. First, we stratified analyses by history of baseline CVD. Next, because of the cross-sectional antidepressant measurement, we explored the impact of censoring follow-up intervals at 0-2 years, 0-4 years, and 0-end of follow-up. Finally, Kaplan Meier survival curves and log-rank tests explored the association of different medication classes with the study endpoints. Antidepressant classes were defined as SSRIs, SNRIs, miscellaneous antidepressants, and multiple drug users (e.g., SSRI + SNRI, SSRI + miscellaneous antidepressant).
RESULTS
Of the 30,239 REGARDS participants enrolled between January 2003 and October 2007, 545 were missing follow-up and excluded from the initial cohort (n=29,694). An additional 70 participants were missing an in-home medication review, and 8 participants had a documented stroke after their interview and prior to the in-home visit, leaving an analysis cohort of 29,616 participants. Of these participants, 3,458 (11.7%) were using an eligible antidepressant at the time of the baseline visit. Characteristics of the antidepressant users and non-users are shown in Table 1. Of the antidepressant users, 2,253 used SSRI monotherapy, 476 used SNRI monotherapy, 412 used one of the miscellaneous antidepressants, and 317 used multiple eligible drugs (e.g., 58% of the 317 used an SSRI plus a miscellaneous drug).
Table 1.
Baseline characteristics of the study population by use of antidepressant medication (n=29,616)
| Characteristic | Antidepressant use | P-value | |
|---|---|---|---|
| No (n=26158) | Yes (n=3458) | ||
| DEMOGRAPHICS | |||
|
| |||
| Age, mean (sd), years | 65.2 +/− 9.4 | 62.6 +/− 8.9 | <.0001 |
| Men, n (%) | 12301 (47.0) | 1004 (29.0) | <.0001 |
| Black, n (%) | 11347 (43.4) | 830 (24.0) | <.0001 |
| Region of residence, n (%) | <.0001 | ||
| Stroke Belt | 8973 (34.3) | 1277 (36.9) | |
| Stroke Buckle | 5335 (20.4) | 868 (25.1) | |
| Non-Belt | 11850 (45.3) | 1313 (38.0) | |
| Less than high school education, n (%) | 3304 (12.6) | 394 (11.4) | 0.0457 |
| Household income <$35,000, n (%) | 10963 (47.8) | 1525 (50.1) | 0.0211 |
| Has regular source of medical care, n (%) | 19201 (79.1) | 2621 (83.0) | <.0001 |
|
| |||
| HEALTH BEHAVIORS | |||
|
| |||
| Smoking status, n (%) | <.0001 | ||
| Current | 3599 (13.8) | 670 (19.4) | |
| Never | 11968 (45.9) | 1369 (39.7) | |
| Past | 10488 (40.3) | 1408 (40.8) | |
| Alcohol use, n (%) | 0.0002 | ||
| None | 1024 (4.0) | 149 (4.4) | |
| Moderate | 8640 (33.7) | 1024 (30.2) | |
| Heavy | 15982 (62.3) | 2219 (65.4) | |
| No exercise, n (%) | 8555 (33.2) | 1481 (43.5) | <.0001 |
| Adherent to medications (Morisky Score=0), n (%) | 16789 (71.2) | 2142 (63.6) | <.0001 |
|
| |||
| MEDICAL CONDITIONS | |||
|
| |||
| Diabetes, n (%) | 5425 (21.6) | 858 (25.6) | <.0001 |
| Atrial fibrillation, n (%) | 2163 (8.5) | 383 (11.4) | <.0001 |
| Hypertension, n (%) | 15431 (59.1) | 2087 (60.5) | 0.1129 |
|
| |||
| PREVENTIVE MEDICATION USE | |||
|
| |||
| Antihypertensive medication use, n (%) | 13340 (51.6) | 1937 (56.6) | <.0001 |
| Statin use, n (%) | 7994 (30.6) | 1362 (39.4) | <.0001 |
| Aspirin use, n (%) | 11328 (43.3) | 1527 (44.2) | 0.3407 |
|
| |||
| PHYSIOLOGICAL RISK FACTORS | |||
|
| |||
| Total cholesterol, mean (SD), mg/dL | 191.8 +/− 39.9 | 193.8 +/− 41.7 | 0.0054 |
| HDL-cholesterol, mean (SD), mg/dL | 51.8 +/− 16.2 | 52.1 +/− 15.9 | 0.2338 |
| Systolic Blood pressure mean (SD), mmHg | 127.9 +/− 16.7 | 125.1 +/− 15.9 | <.0001 |
| BMI, mean (sd) | 29.2 +/− 6.1 | 30.3 +/− 6.7 | <.0001 |
| C-reactive protein, median (25th-75th percentile), mg/L | 2.1[0.9-4.9] | 2.9[1.2-6.5] | <.0001 |
| Urinary Albumin to Creatinine Ratio, median (25th-75th percentile), mg/L | 7.4[4.6-16.3] | 7.5[4.8-15.5] | 0.4860 |
| Corrected QT interval, mean (SD), msec | 406.9 +/− 23.5 | 411.5 +/− 23.6 | <.0001 |
|
| |||
| MARKERS OF PHYSICAL AND MENTAL HEALTH | |||
|
| |||
| Physical component score of SF-12, mean (SD) | 47.0 +/− 10.2 | 41.7 +/− 12.3 | <.0001 |
| Mental component score of SF-12, mean (SD) | 54.7 +−/ 7.8 | 49.4 +/− 10.9 | <.0001 |
| Depressive symptoms (CESD≥4), n (%) | 2444 (9.4) | 801 (23.2) | <.0001 |
| Moderate to high perceived stress (PSS score≥3), n (%) | 12965 (49.6) | 2335 (67.5) | <.0001 |
|
| |||
| BASELINE CARDIOVASCULAR DISEASE | |||
|
| |||
| History of stroke, n (%) | 1564 (6.0) | 321 (9.3) | <.0001 |
| History of coronary heart disease, n (%) | 4517 (17.3) | 709 (20.5) | <.0001 |
| History of cardiovascular disease (Stroke/PAD/AA), n (%) | 2229 (8.5) | 428 (12.4) | <.0001 |
|
| |||
| OTHER MEDICATION USE | |||
|
| |||
| Tricyclic Antidepressants, n (%) | 640(2.5) | 178(5.2) | <.0001 |
| Benzodiazepines, n (%) | 998(3.8) | 592(17.1) | <.0001 |
Noteworthy differences were observed between the antidepressant users and non-users. For example, compared with non-users, antidepressant users were younger (mean age 62.6 vs. 65.2 years), more likely female (47% vs. 29%), more likely White (43% vs. 24%), and more likely to have a regular source of care (83% vs. 79%). We also observed differences across groups in blood pressure, antihypertensive and statin use, smoking and alcohol status, exercise, BMI, and other physical and mental health indicators. The antidepressant use group tended to have higher perceived stress (67.5% vs. 49.6% had PSS score ≥ 3), more commonly used a benzodiazepine (17.1% vs. 3.8%), and had lower medication adherence (63.6% vs. 71.2%) than the antidepressant non-users.
Among all participants, 759 stroke events, 1,618 CHD events, 1,373 CVD deaths, and 3,883 deaths of any cause were observed. An increased risk of CHD among antidepressant users can be observed in the cumulative incidence plots illustrated in Figure 1 (Panel A log-rank p=0.01). For the other outcomes, an increased risk was not observed for antidepressant users in the unadjusted cumulative incidence plots (log-rank p>0.05 for Figure 1-Panels B-D). In the all-cause mortality analysis (Figure 1-Panel D), we noted an intersection of the cumulative incidence curves for those that had follow-up time greater than 7 years, and this was detected as a violation in proportionality assumption testing (p=0.04 for the interaction of antidepressant use with the natural log of follow up time). Importantly, however, the intersection of the cumulative incidence curves occurs long after our cross-sectional antidepressant exposure measure, and should be interpreted cautiously.
Figure 1. Cumulative incidence of outcomes for antidepressant users and non-users.
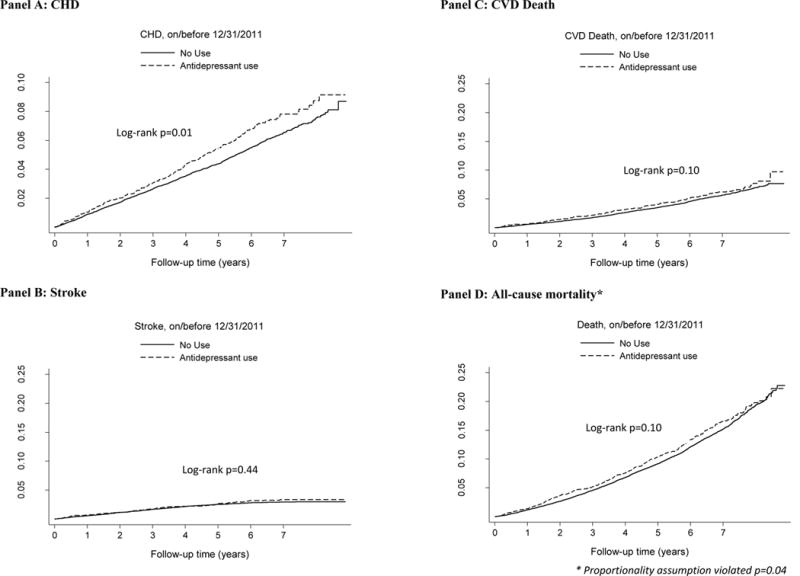
Outcomes include coronary heart disease (Panel A), stroke (Panel B), cardiovascular disease death (Panel C), and all-cause mortality. Analyses are based on 29,616 participants, of which 3,458 participants used an antidepressant and 26,158 did not use an antidepressant.
* The proportionality assumption was violated in the all-cause mortality analysis (p=0.04)
Consistent with the cumulative incidence plots, the unadjusted hazard ratio (Table 2) suggested an increased risk of CHD for antidepressant users compared with non-users. Stratified analysis indicated that this increase in risk was only significant among those that had baseline CVD. In our iterative model building we observed interesting changes in the antidepressant HRs. For example, when we added demographic and socioeconomic factors to the model (Table 2-Model 1), the antidepressant HRs were significant for all of the outcomes. When we added health behaviors, medical conditions, preventive medication use, and physiological risk factors to the models (Table 2-Model 2), the HRs remained statistically significant but decreased in relative magnitude. With the exception of the all-cause mortality model, stratified analyses suggested that antidepressant-associated increase in risk was magnified among those participants with baseline CVD. In the fully adjusted models when markers of physical and mental health were added (Table 2-Model 3), all HRs were still greater than 1.0 but antidepressant use only was statistically significantly associated with increased risk of all-cause mortality (HR=1.12; 95% CI 1.01-1.24; 95% CI). Stratified analyses found an increased risk of stroke in antidepressant users that had baseline CVD (HR=1.37; 95% CI 1.00-1.88).
Table 2.
Association of antidepressant use with outcomes
| N | Events | Unadjusted HR (95% CI) |
Model 1 HR (95% CI) |
Model 2 HR (95% CI) |
Model 3 HR (95% CI) |
|
|---|---|---|---|---|---|---|
| STROKE | ||||||
|
| ||||||
| All | 29616 | 759 | 1.09(0.88–1.35) | 1.44(1.15–1.80) | 1.28(1.02–1.60) | 1.23(0.98–1.55) |
| with baseline CVD | 6845 | 330 | 1.23(0.93–1.66) | 1.44(1.07–1.95) | 1.43(1.05–1.94) | 1.37(1.00–1.88) |
| no baseline CVD | 22771 | 429 | 0.84(0.61–1.17) | 1.17(0.84–1.63) | 1.10(0.78–1.54) | 1.07(0.76–1.51) |
|
| ||||||
| CHD | ||||||
|
| ||||||
| All | 29616 | 1618 | 1.20(1.04–1.39) | 1.58(1.34–1.81) | 1.21(1.04–1.41) | 1.13(0.97–1.32) |
| with baseline CVD | 6845 | 835 | 1.22(1.02–1.47) | 1.38(1.14–1.67) | 1.21(1.00–1.47) | 1.15(0.95–1.41) |
| no baseline CVD | 22771 | 783 | 0.97(0.77–1.22) | 1.34(1.05–1.69) | 1.21(0.95–1.54) | 1.11(0.87–1.42) |
|
| ||||||
| CVD DEATH | ||||||
|
| ||||||
| All | 29616 | 1373 | 1.13 (0.96–1.32) | 1.73(1.46–2.03) | 1.29(1.09–1.53) | 1.16(0.97–1.37) |
| with baseline CVD | 6845 | 757 | 1.15(0.94–1.41) | 1.49(1.21–1.83) | 1.25(1.02–1.54) | 1.12(0.90–1.39) |
| no baseline CVD | 22771 | 616 | 0.86(0.66–1.13) | 1.48(1.12–1.95) | 1.31(0.99–1.75) | 1.19(0.89–1.58) |
|
| ||||||
| All Cause Mortality | ||||||
|
| ||||||
| All | 29616 | 3883 | 1.08(0.98–1.19) | 1.58(1.43–1.74) | 1.27(1.15–1.41) | 1.12(1.01–1.24) |
| with baseline CVD | 6845 | 1734 | 1.13(0.99–1.29) | 1.44(1.26–1.65) | 1.24(1.08–1.43) | 1.11(0.96–1.28) |
| no baseline CVD | 22771 | 2149 | 0.91(0.79–1.05) | 1.43(1.24–1.66) | 1.28(1.10–1.48) | 1.11(0.95–1.29) |
Reference group includes participants not taking antidepressants at baseline. Hazard ratios are for antidepressant use. All outcomes assessed on or before 12/31/2011 for antidepressant use overall and stratified by baseline history of cardiovascular events.
Model 1 adjusts for demographic and socioeconomic characteristics: age sex, race, region, education, income, and having a usual source of care.
Model 2 adjusts for model 1 covariates plus health behaviors of smoking, alcohol use, physical activity, and medication adherence, medical conditions of diabetes and baseline atrial fibrillation (for all endpoints but not CHD), preventive medication use of statins, aspirin, and anti-hypertensive medication, and physiological risk factors of total cholesterol, HDL, systolic blood pressure, body mass index, corrected QT, log of ACR, log of CRP, and baseline CVD including history of coronary heart disease, stroke, aortic aneurism or periphery artery disease (baseline CVD only in overall models).
Model 3 adjusts for model 2 covariates plus markers of physical and mental health including the SF-12 physical health component, moderate to high stress (PSS=>3), depressive symptoms (CES-D =>4), and benzodiazepine use.
Missing data in covariates are imputed using chain equations in 10 datasets with the sample bootstrapping.
Bold p< 0.05
In sensitivity analyses, models including vs. excluding TCA users were similar (data not shown). Additionally, with follow-up time censored at 2-years (Table 3), we found an increased risk of all-cause mortality with antidepressants (HR=1.37; 95% CI 1.11-1.68). This increased risk was isolated to those that had baseline CVD (HR=1.41, 95% CI 1.08-1.83). When censoring follow-up time at 4 years we did not observe any antidepressant-related increase in risk of cardiovascular outcomes.
Table 3.
Sensitivity analyses of pre-specified follow-up intervals
| Censor at 2 Years HR (95% CI) |
Censor at 4 Years HR (95% CI) |
All Years (to 12/31/11) HR (95% CI) |
|
|---|---|---|---|
| STROKE | |||
|
| |||
| All | 1.15(0.81–1.64) | 1.15(0.88–1.50) | 1.23(0.98–1.55) |
| with baseline CVD | 1.32(0.84–2.07) | 1.29(0.91–1.82) | 1.37(1.00–1.88) |
| no baseline CVD | 0.93(0.52–1.69) | 0.98(0.65–1.47) | 1.07(0.76–1.51) |
|
| |||
| CHD | |||
|
| |||
| All | 1.08(0.83–1.42) | 1.15(0.95–1.40) | 1.13(0.97–1.32) |
| with baseline CVD | 1.01(0.72–1.43) | 1.14(0.89–1.46) | 1.15(0.95–1.41) |
| no baseline CVD | 1.18(0.76–1.84) | 1.16(0.85–1.58) | 1.11(0.87–1.42) |
|
| |||
| CVD DEATH | |||
|
| |||
| All | 1.16(0.84–1.62) | 1.24(0.99–1.55) | 1.16(0.97–1.37) |
| with baseline CVD | 1.22(0.83–1.81) | 1.25(0.95–1.64) | 1.12(0.90–1.39) |
| no baseline CVD | 0.98(0.51–1.89) | 1.16(0.77–1.73) | 1.19(0.89–1.58) |
|
| |||
| ACM | |||
|
| |||
| All | 1.37(1.11–1.68) | 1.13(0.98–1.30) | 1.12(1.01–1.24) |
| with baseline CVD | 1.41(1.08–1.83) | 1.19(0.99–1.44) | 1.11(0.96–1.28) |
| no baseline CVD | 1.24(0.87–1.75) | 1.02(0.81–1.27) | 1.11(0.95–1.29) |
Reference group includes participants not taking antidepressants at baseline. Hazard ratios are for antidepressant use. All outcomes assessed on or before 12/31/2011 for antidepressant use overall and stratified by baseline history of cardiovascular events.
Models adjust for the following: demographic and socioeconomic characteristics of age, sex, race, region, education, income, and having a usual source of care; health behaviors of smoking, alcohol use, physical activity, and medication adherence; medical conditions of diabetes and baseline atrial fibrillation (for all endpoints but not CHD); preventive medication use of statins, aspirin, and anti-hypertensive medication; physiological risk factors of total cholesterol, HDL, systolic blood pressure, body mass index, corrected QT, log of ACR, log of CRP; markers of physical and mental health including the SF-12 physical health component, moderate to high stress (PSS=>3), depressive symptoms (CES-D =>4), and benzodiazepine use; and baseline CVD including history of coronary heart disease, stroke, aortic aneurism or periphery artery disease (baseline CVD only in overall models).
Missing data in covariates are imputed using chain equations in 10 datasets with the sample bootstrapping.
Bold p< 0.05
Sample sizes in REGARDS were insufficient to adequately evaluate cardiovascular risk among individual antidepressant agents or drug groups with similar mechanisms, but we still explored patterns of cardiovascular outcomes among classes of agents. Visual inspection of these patterns suggests that participants taking multiple antidepressants or SSRIs may have a slightly higher rate of cardiovascular events (data not shown).
DISCUSSION
The REGARDS study is a particularly valuable observational study because of its longitudinal follow-up, rigorous measurement of cardiovascular outcomes, and diverse participant population.5 Our analyses assessed how baseline antidepressant exposure might be related to cardiovascular events. Fully adjusted models found a small but potentially meaningful increased risk of all-cause mortality for those taking antidepressants.
Through iterative model building we also observed that potential antidepressant-related risk of cardio- and cerebrovascular events appears to be partially explained by other risk factors, and almost completely explained when also considering markers of physical and mental health. This suggests that antidepressant use may, to some degree, be an indicator of other underlying physical or behavioral constructs that influence the risk of cardiovascular events, rather than a direct cause. This is consistent with past research that suggests that depression itself is actually associated with increased cardiovascular events and death17-19 and that careful management of depression can decrease mortality and improve cardiovascular outcomes.20,21
Over the past 15 years the second-generation antidepressants considered in our analyses have been the most commonly used antidepressant agents. The U.S. Food and Drug Administration (FDA) labeling for most of these products includes at least some mention of the possibility for cardiovascular-related adverse events, such as QTc prolongation, sudden death, and myocardial infarction. Our study provides additional evidence to support a marginally significant increase in risk of all-cause mortality with second-generation antidepressants. Additionally, while our fully adjusted models were not statistically significant for the outcomes of CHD, stroke, and acute CVD death, it should be noted that the HR point estimates for these models continued to remain elevated and were numerically greater than the point estimates for all-cause mortality. We believe this is a function of the fact that there were fewer of these events compared to the all-cause mortality model, and therefore the 95% confidence intervals were wider. The clinical interpretation of this finding is subject to further debate.
For our primary analysis we combined antidepressant users into one group and compared users with non-users. However, prior research has suggested that all antidepressants may not have the same risk profile. For example, one study reported an adjusted risk ratio of 1.18 for strokes when comparing high affinity SSRIs with low affinity SSRIs.2 We attempted to analyze specific drug types but found limited sample size and these analyses also violated the proportionality assumption (data not shown). However, we observed some trends that might be indicative of differences across drugs and this warrants further investigation, particularly for the SSRIs and multiple medication users. Our study also did not consider the possible role of drug-drug interactions which could be a clinically meaningful consideration for some antidepressants.22
The REGARDS study provides rich assessment of cardiovascular events and covariates, but our analyses may still be limited by unmeasured confounding. The most important limitation of our study is the cross-sectional baseline measure of antidepressant use. While the REGARDS study methods used a rigorous assessment of pill bottles by trained personnel,5 medication doses were not recorded and post-baseline assessments of antidepressant use were not conducted. Without antidepressant doses we could not consider whether a dose-response relationship exists. Because we did not have a longitudinal measure of antidepressant use, our exposure measurement is subject to misclassification bias, and this bias is likely to increase over time since antidepressants can be used episodically. For depression, for example, acute and continuation treatment may be less than 1 year in duration, as opposed to maintenance treatment which is more consistent with treating a chronic illness.
In trying to evaluate the potential impact of this misclassification bias, we considered how long participants using an antidepressant at baseline might remain on that antidepressant. A Dutch study previously reported that almost 30% of antidepressant users took the drugs for more than 1 year.23 A more recent U.S. analysis found that, as of 2010, 66% of antidepressant users continued antidepressant use for more than 2 years.24 Based on these estimates, we anticipate that at least half of REGARDS participants who used antidepressants at baseline might still be on the antidepressant after 2 years of follow-up.
Another exposure measurement consideration relates to whether antidepressant-related cardiovascular events might be expected early on in treatment or whether risk increases with longer duration of treatment. A British study suggests that risk of antidepressant-related all-cause mortality, MI, and stroke may be highest in the first 28 days of treatment, and risk appears to decline over time.25 This argues that regardless of exposure misclassification, we likely could have observed relevant events early on during participant follow-up if the events were attributable to antidepressant use.
Our study adds to the existing literature and supports some degree of association between antidepressant use and mortality, even after considering depressive symptoms.1-3 Clinicians and patients should be aware of a small but potentially clinically relevant increase in the risk of cardiovascular events and all-cause mortality.
Figure 2.
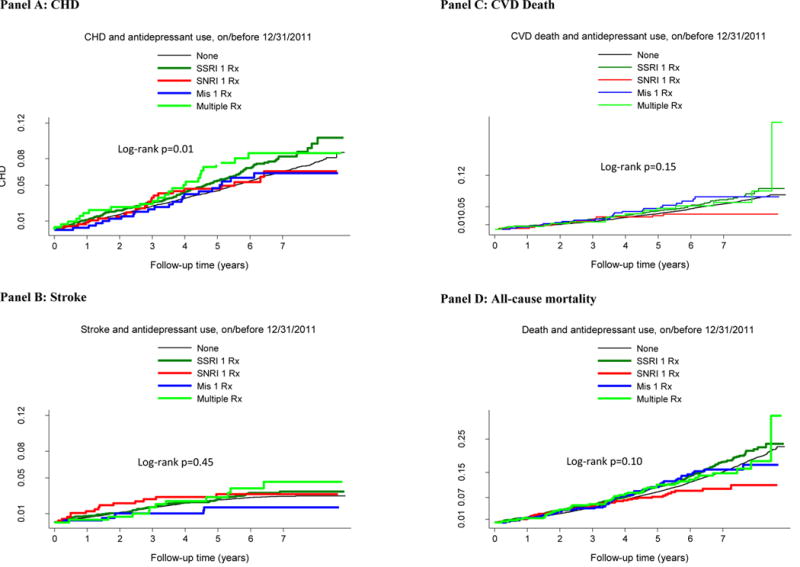
Cumulative incidence of outcomes by antidepressant type
Acknowledgments
Disclosures: In the past 3 years, Richard Hansen has received consulting funds from Novartis and Daiichi Sankyo and has provided expert testimony for Allergan and Boehringer Ingelheim. Stephen Glasser has received research support from Amgen. This research project is supported by grants R01 HL080477 and K24 HL 111154 from the National Heart, Lung, and Blood Institute (NHLBI), and by a cooperative agreement U01 NS041588 from the National Institute of Neurological Disorders and Stroke (NINDS), National Institutes of Health, Department of Health and Human Service. The content is solely the responsibility of the authors and does not necessarily represent the official views of the NHLBI, NINDS, or the National Institutes of Health. Representatives of the funding agency have been involved in the review of the manuscript but not directly involved in the collection, management, analysis or interpretation of the data. The authors thank the other investigators, the staff, and the participants of the REGARDS study for their valuable contributions. A full list of participating REGARDS investigators and institutions can be found at http://www.regardsstudy.org
Footnotes
This work was presented as a poster presentation at the 31st International Conference on Pharmacoepidemiology and Therapeutic Management (ICPE), Boston, MA August 23-26, 2015.
Contributor Information
Richard A. Hansen, Gilliland Professor and Head, Department of Health Outcomes Research and Policy, Harrison School of Pharmacy, Auburn University, Auburn, AL.
Yulia Khodneva, Research Associate, Division of Preventive Medicine, Department of Medicine, University of Alabama Birmingham, Birmingham, AL.
Stephen P. Glasser, Professor, Division of Preventive Medicine, Department of Medicine, University of Alabama Birmingham, Birmingham, AL.
Jingjing Qian, Assistant Professor, Department of Health Outcomes Research and Policy, Harrison School of Pharmacy, Auburn University, Auburn, AL.
Nicole Redmond, Assistant Professor, Division of Preventive Medicine, Department of Medicine, University of Alabama Birmingham, Birmingham, AL.
Monika M. Safford, Endowed Professor of Diabetes Prevention and Outcomes Research, Division of Preventive Medicine, Department of Medicine, University of Alabama Birmingham, Birmingham, AL.
References
- 1.Shah AJ, Veledar E, Shallenberger L, et al. Association of antidepressant medications with carotid intima media thickness in middle aged veteran twins. J Am Coll Cardiol. 2011;57(14):E1588–E1588. [Google Scholar]
- 2.Castro VM, Gallagher PJ, Clements CC, et al. Incident user cohort study of risk for gastrointestinal bleed and stroke in individuals with major depressive disorder treated with antidepressants. BMJ Open. 2012;2(2):e000544. doi: 10.1136/bmjopen-2011-000544. [DOI] [PMC free article] [PubMed] [Google Scholar]
- 3.Smoller JW, Allison M, Cochrane BB, et al. Antidepressant use and risk of incident cardiovascular morbidity and mortality among postmenopausal women in the Women’s Health Initiative study. Arch Intern Med. 2009 Dec 14;169(22):2128–2139. doi: 10.1001/archinternmed.2009.436. [DOI] [PMC free article] [PubMed] [Google Scholar]
- 4.Gartlehner G, Hansen RA, Morgan LC, et al. Comparative benefits and harms of second-generation antidepressants for treating major depressive disorder: an updated meta-analysis. Ann Intern Med. 2011 Dec 6;155(11):772–785. doi: 10.7326/0003-4819-155-11-201112060-00009. [DOI] [PubMed] [Google Scholar]
- 5.Howard VJ, Cushman M, Pulley L, et al. The reasons for geographic and racial differences in stroke study: objectives and design. Neuroepidemiology. 2005;25(3):135–143. doi: 10.1159/000086678. [DOI] [PubMed] [Google Scholar]
- 6.Safford MM, Brown TM, Muntner PM, et al. Association of race and sex with risk of incident acute coronary heart disease events. JAMA. 2012 Nov 7;308(17):1768–1774. doi: 10.1001/jama.2012.14306. [DOI] [PMC free article] [PubMed] [Google Scholar]
- 7.Thygesen K, Alpert JS, White HD, et al. Universal definition of myocardial infarction. Circulation. 2007 Nov 27;116(22):2634–2653. doi: 10.1161/CIRCULATIONAHA.107.187397. [DOI] [PubMed] [Google Scholar]
- 8.Luepker RV, Apple FS, Christenson RH, et al. Case definitions for acute coronary heart disease in epidemiology and clinical research studies: a statement from the AHA Council on Epidemiology and Prevention; AHA Statistics Committee; World Heart Federation Council on Epidemiology and Prevention; the European Society of Cardiology Working Group on Epidemiology and Prevention; Centers for Disease Control and Prevention; and the National Heart, Lung, and Blood Institute. Circulation. 2003 Nov 18;108(20):2543–2549. doi: 10.1161/01.CIR.0000100560.46946.EA. [DOI] [PubMed] [Google Scholar]
- 9.Prineas R, Crow R. The Minnesota code manual of electrocardiographic findings: standards and procedures for measurement and classification. Boston, MA: Wright-OSG; 1982. [Google Scholar]
- 10.Prineas R, Crow R. Minnesota code manual of electrocardiographic findings. 2nd. London: Springer-Verlag; 2010. [Google Scholar]
- 11.Howard VJ, Kleindorfer DO, Judd SE, et al. Disparities in stroke incidence contributing to disparities in stroke mortality. Ann Neurol. 2011 Apr;69(4):619–627. doi: 10.1002/ana.22385. [DOI] [PMC free article] [PubMed] [Google Scholar]
- 12.Howard G, Cushman M, Kissela BM, et al. Traditional risk factors as the underlying cause of racial disparities in stroke: lessons from the half-full (empty?) glass. Stroke. 2011 Dec;42(12):3369–3375. doi: 10.1161/STROKEAHA.111.625277. [DOI] [PMC free article] [PubMed] [Google Scholar]
- 13.Morisky DE, Green LW, Levine DM. Concurrent and predictive validity of a self-reported measure of medication adherence. Med Care. 1986 Jan;24(1):67–74. doi: 10.1097/00005650-198601000-00007. [DOI] [PubMed] [Google Scholar]
- 14.Redmond N, Richman J, Gamboa CM, et al. Perceived stress is associated with incident coronary heart disease and all-cause mortality in low- but not high-income participants in the Reasons for Geographic And Racial Differences in Stroke study. J Am Heart Assoc. 2013 Dec;2(6):e000447. doi: 10.1161/JAHA.113.000447. [DOI] [PMC free article] [PubMed] [Google Scholar]
- 15.Robinson DS, Barker E. Tricyclic antidepressant cardiotoxicity. JAMA. 1976 Nov 1;236(18):2089–2090. [PubMed] [Google Scholar]
- 16.Rubin DB, Schenker N. Multiple imputation in health-care databases: an overview and some applications. Stat Med. 1991 Apr;10(4):585–598. doi: 10.1002/sim.4780100410. [DOI] [PubMed] [Google Scholar]
- 17.Elderon L, Whooley MA. Depression and cardiovascular disease. Prog Cardiovasc Dis. 2013 May-Jun;55(6):511–523. doi: 10.1016/j.pcad.2013.03.010. [DOI] [PubMed] [Google Scholar]
- 18.Sullivan MD, O’Connor P, Feeney P, et al. Depression predicts all-cause mortality: epidemiological evaluation from the ACCORD HRQL substudy. Diabetes Care. 2012 Aug;35(8):1708–1715. doi: 10.2337/dc11-1791. [DOI] [PMC free article] [PubMed] [Google Scholar]
- 19.Lichtman JH, Froelicher ES, Blumenthal JA, et al. Depression as a risk factor for poor prognosis among patients with acute coronary syndrome: systematic review and recommendations: a scientific statement from the American Heart Association. Circulation. 2014 Mar 25;129(12):1350–1369. doi: 10.1161/CIR.0000000000000019. [DOI] [PubMed] [Google Scholar]
- 20.Gallo JJ, Morales KH, Bogner HR, et al. Long term effect of depression care management on mortality in older adults: follow-up of cluster randomized clinical trial in primary care. 2013;346:f2570. doi: 10.1136/bmj.f2570. [DOI] [PMC free article] [PubMed] [Google Scholar]
- 21.Pizzi C, Rutjes AW, Costa GM, Fontana F, Mezzetti A, Manzoli L. Meta-analysis of selective serotonin reuptake inhibitors in patients with depression and coronary heart disease. Am J Cardiol. 2011 Apr 1;107(7):972–979. doi: 10.1016/j.amjcard.2010.11.017. [DOI] [PubMed] [Google Scholar]
- 22.English BA, Dortch M, Ereshefsky L, Jhee S. Clinically significant psychotropic drug-drug interactions in the primary care setting. Curr Psychiatry Rep. 2012 Aug;14(4):376–390. doi: 10.1007/s11920-012-0284-9. [DOI] [PMC free article] [PubMed] [Google Scholar]
- 23.Meijer WE, Heerdink ER, Leufkens HG, Herings RM, Egberts AC, Nolen WA. Incidence and determinants of long-term use of antidepressants. Eur J Clin Pharmacol. 2004 Mar;60(1):57–61. doi: 10.1007/s00228-004-0726-3. [DOI] [PubMed] [Google Scholar]
- 24.Mojtabai R, Olfson M. National trends in long-term use of antidepressant medications: results from the U.S. National Health and Nutrition Examination Survey. J Clin Psychiatry. 2014 Feb;75(2):169–177. doi: 10.4088/JCP.13m08443. [DOI] [PubMed] [Google Scholar]
- 25.Coupland C, Dhiman P, Morriss R, Arthur A, Barton G, Hippisley-Cox J. Antidepressant use and risk of adverse outcomes in older people: population based cohort study. BMJ. 2011;343:d4551. doi: 10.1136/bmj.d4551. [DOI] [PMC free article] [PubMed] [Google Scholar]