

Abstract
Objectives
Characteristics of muscle activity, represented by surface electromyography (EMG), have revealed differences between patients with low back pain (LBP) and healthy adults; how they relate to functional and clinical parameters remains unclear. The purpose of the current study was to examine the correlation between frequency characteristics of EMG (analysed using continuous wavelet transform (CWT) analysis) and patients’ self-rated score of disability.
Design and setting
This is a case-control study with 15 patients with mechanical LBP without radicular symptoms. Patients were recruited from the orthopaedic clinic at Charing Cross Hospital. Ten healthy adults were recruited from the staff working in the hospital and associated university. Patients completed the Roland-Morris Disability Questionnaire (RMDQ) and bilateral EMG activity was obtained from erector spinae at vertebral levels L4 and T12. Subjects performed three brief maximal voluntary isometric contractions (MVICs) of the back extensors and the torque was measured using a dynamometer. CWT was applied to the EMG signals of each muscle in a 200 ms window centred around the peak torque obtained during the MVICs. The ratio (low/high frequencies) of the energy, the peak power and the frequency of the peak power were calculated for each recording site, averaged and correlated with the individual’s RMDQ score.
Results
Patients had lower peak power (T12 and L4) and lower frequency of the peak power (at T12) than the healthy adults. Additionally, RMDQ positively correlated to the average ratio of energy at T12 (r=0.63; p=0.012), that is, greater self-rated disability corresponded to a dominant distribution of energy in the lower frequencies.
Conclusion
The current findings reveal alterations in EMG profile and its association with self-related back pain disability, suggesting that spectral characteristics of EMG reflect muscle function.
Keywords: trunk muscles, isometric, electromyography, wavelet transform, back pain
Strengths and limitations of this study.
This study uses a computational approach to decompose the signals of surface electromyography obtained from paraspinal muscles in patients with low back pain with a view to revealing information that may not be detected from a conventional amplitude analysis.
The methodology of combining maximal voluntary isometric contraction of paraspinal muscles and wavelet transform analysis offers the opportunity for a simple and quick assessment of function of the back muscles.
A difference in body mass between patients and controls indicates that careful interpretation of the findings are required.
Introduction
Low back pain (LBP) is a common health condition with 60%–80% of people in the UK reporting it at some point in their lives.1 2 The costs of back pain alone account for 20% of the total UK’s health expenditure,3 and LBP is also an important cause of work absence. It has wide ranging impact on both biological and psychosocial aspects such as physical impairments, mental health and loss of employment.2 4 Evidence has shown that subjects with chronic LBP have changes in trunk muscle control by the central nervous system,5 6 including reduced corticospinal excitability7 and neural drive8 in addition to anatomical changes such as in trunk muscle size and muscle fibre type which may account for observed altered activity patterns during functional tasks9 10 and reductions in muscle strength and endurance.11 12 Electromyographic (EMG) activity, including its temporal and spectral characteristics, has been commonly used to investigate muscle function. Changes in EMG signal are commonly used to reflect overall muscle activity and muscle contraction force;13 14 however, the precise nature of the relationship between EMG amplitude and force output has not been established.15 16 The frequency distribution of the EMG signals has been reported to be associated with the underlying muscle fibre type characteristics.17 18 For example, fatigability of back muscles has shown to be related to the muscle fibre type area distribution in healthy subjects.18 These observations indicate complex alterations in temporal (eg, EMG signal amplitude) and spectral (eg, median frequency) characteristics of muscle activity. Therefore, a concurrent assessment of changes across time and frequency domains may provide more information on neuromuscular alterations of back muscles in patients with LBP.
Wavelet transform is a time–frequency method of signal analysis, which has been proposed to be more suitable for analysis of surface EMG, since these are non-stationary19 spikey20 signals, than short-time Fourier transform (STFT). Wavelet transform projects a signal into time-dimensional and frequency-dimensional function from a single basic wavelet, a mother wavelet. By mapping the signal on to shifted and scaled versions of the mother wavelet, the characteristics of the surface EMG in different frequency bands and at different time points can be revealed.21 22
Studies have shown associations between wavelet transform and muscle function. In healthy adults, changes in EMG spectral power and frequency have been observed in limb and trunk muscles during fatiguing exercise.23 24 Previous work has demonstrated that energy distribution between low and high frequency bands from leg muscles was different in individuals with diabetic neuropathy and in postoperative total knee arthroplasty patients compared with controls.25–27 This may be due to changes in motor unit recruitment or muscle fibre type distribution in patients.28 29 In patients with LBP, the total power in the trunk muscles was lower and could be used to discriminate patients from controls.30 However, whether there are changes in energy distribution between low and high frequency bands from trunk muscles and whether these changes correlate with any clinical or functional scores (ie, pain, disability) remains unclear.
The purpose of the current study was to investigate whether time and frequency domain EMG characteristics, obtained using continuous wavelet transform (CWT), of erector spinae (ES) muscles in people with LBP are associated with levels of back pain disability and pain. We hypothesised that the EMG characteristics would be different between people with LBP and controls and that the energy distribution between low and high frequency bands would be associated with the level of disability and/or pain.
Materials and methods
Participants
With ethical approval (07/Q0410/5—NHS NRES Committee London—Harrow) and written informed consent, 15 patients with mechanical, non-specific (LBP group) were recruited from the orthopaedic clinic at Charing Cross Hospital and 10 healthy controls were recruited from the staff working in the hospital and associated university. Only subjects with mechanical LBP without radicular symptoms were included; those with back pain related to rheumatological disease, spondylolisthesis or spinal trauma or with constant severe pain were excluded. All of the subjects were asked to complete the Edinburgh Handedness Inventory, a 10-item questionnaire with a score between −100 (left handed) and 100 (right handed)31 and a Visual Analogue Scale for pain (VAS; 0—no pain to 10—maximum pain); patients additionally completed a 24-item Roland-Morris Disability Questionnaire (RMDQ), a disease specific functional measure;32 the scores range from 0, no disability to 24, maximum disability.
Recordings
Torque
Back extensor isometric torque was measured using a Cybex Norm Isokinetic Testing System (CSM, Stoughton, Massachusetts, USA) with an extendable input lever arm. The output from the Cybex was sampled at 500 Hz by a data acquisition system (Power 1401 plus and Spike2 v5; Cambridge Electronic Design, Cambridge, UK) connected to a personal laptop for subsequent offline analysis.
Electromyography
Bilateral EMG recordings were obtained from the ES muscles at vertebral levels T12 and L4. Pairs of Ag/AgCl electrodes (self-adhesive, 2 cm diameter; CareFusion, Chatham, UK) were positioned 3 cm either side of the spinous processes, parallel to the fibre orientation of ES muscles, with an interelectrode distance of 2 cm. A ground electrode was placed over the left anterior superior iliac spine. The EMG signals were filtered (10 Hz–1 kHz), and amplified (1000×; Iso-DAM, World Precision Instruments, UK) before being sampled at 4 kHz by the data acquisition system; both torque and EMG data were collected simultaneously.
Experimental procedure
The experimental set-up has been used previously.8 33 Briefly, subjects were positioned prone on the dynamometer bench, with the arms by the sides and the iliac crests aligned with the pivot of the dynamometer lever arm. To isolate back muscle movements as well as limit the contributions of hip extensors, subjects’ ankles and hips were strapped securely to the bench. The lever arm was positioned over the lower borders of the scapulae (see figure 1); this was confirmed by a physiotherapist (SYC) who identified the inferior angle of the scapula for each subject by palpation. Subjects had a gentle warm-up consisting of several repetitions of back extension. Following this, three brief (~3 s) maximal voluntary isometric contractions (MVICs) of the trunk extensors were performed with at least 10 s interval between each contraction; consistent verbal encouragement was given throughout. Following each contraction, subjects reported effort used on a modified Borg scale (from 0, no effort to 10, maximal effort).34
Figure 1.

Experimental set-up (top left) and peak torque and electromyography (EMG) activity recorded from left and right erector spinae (ES) at T12 (L ES and R ES) from a representative subject during one maximal voluntary isometric contraction (top right). A representative three-dimensional matrix of power, scale (frequency) and time calculated from a continuous wavelet transform analysis of the EMG data centred around the peak torque (bottom right). The bottom left figure represents the sum of the power collapsed across the time window. The area under the curve has been split according to the ratio 1.8 (see Data analysis) and the corresponding scale was used to split the curve derived from each patient dataset.
Data analysis
The peak torque achieved during the 3 MVICs was identified and the EMG signals obtained during the MIVC from each back muscle in a 200 ms window centred on the peak torque were calculated as root-mean-square amplitude (rms EMG). They were then resolved into their respective intensities in time–frequency space using a CWT, processed in MATLAB R2014a (MathWorks, Natick, Massachusetts, USA). Specifically, the Daubechies family of wavelet (in particular the db4 wavelet) was selected for CWT decomposition due to the similarity between the wavelet and the waveforms of motor unit action potentials.22 35 Performing a CWT on a time waveform results in a matrix of normalised coefficients calculated over scale and time. Scales were tested from 5 to 300 (corresponding to 595.29 Hz–9.92 Hz) with regards to the common signal bandwidth of surface EMG;22 36 37 the sum of the energy of the wavelet coefficient for the 200 ms window was obtained for each scale (figure 1). The scales were then converted into their corresponding frequencies for further analyses. Parameters including peak power and its corresponding frequency were obtained. Furthermore, since the ratio of muscle fibre type I to type II in the ES has been reported to be approximately 1.8,38 the scale splitting the energy matrix into the ratio 1.8 of lower to higher energy (low:high frequencies) for each muscle was identified from the controls. The scale was then used to split the energy matrix obtained from the LBP group into two parts representing lower to higher energy. The ratio of these two parts from the energy matrix was then calculated for each muscle for individuals in the LBP group.
Statistical analysis
Data were analysed with SPSS V.22. Demographic data and modified Borg scale scores were compared between the control group and the LBP group using independent t tests and χ2 tests for scale data and for nominal data (gender), respectively. Normal distribution was tested by the Shapiro-Wilk test for spectral parameters and rms EMG; since the variables of frequency at the peak power and the ratio were not normally distributed (p<0.05) and our sample sizes of two groups were not equal, non-parametric tests were applied. Wilcoxon signed-rank tests and Mann-Whitney U tests were used to examine within-group and between-group differences, respectively. Within-group comparisons were made between left and right sides for rms EMG at T12 and L4; between-group comparisons were made between rms EMG, peak power and its corresponding frequency and the ratio of energy. Given that this ratio was based on the presumed ratio of muscle fibre type I to type II in the ES,38 Spearman correlation coefficients were performed between the scores of questionnaires (RMDQ and VAS) and the ratio of energy in the LBP group. Statistical significance was set at p<0.05 and Bonferroni correction was applied to allow for multiple comparisons.
Results
Group characteristics
Demographic data of the groups are shown in table 1. The median (IQR) duration of back pain episode was 20 (22) months in patients with LBP. Of 15 patients with LBP, 6 had pain on the right side and 9 had bilateral pain. Patients had a lower MVIC torque (normalised to body mass) than the controls (mean±SD: LBP: 2.88±1.03 Nm/kg; control: 4.11±1.42 Nm/kg; Z=−2.16; p=0.03). Further, the VAS reported by patients was 5.2±2.84; as anticipated, controls reported no pain (ie, 0). Both patients and controls completed all aspects of the protocol; no data were excluded from analyses. During the MVICs, the modified Borg scale scores reported by the patients were not different from those reported by the controls (LBP: 8.80±1.04; control: 9.42±0.60; p=0.07).
Table 1.
Demographic data
| Characteristics | Controls (n=10) | LBP (n=15) | p Value |
| Age (years) | 44.6±7.9 | 43.5±6.3 | 0.72 |
| Gender | 5 male; 5 female | 6 male; 9 female | 0.70 |
| Body stature (m) | 1.70±0.09 | 1.70±0.07 | 0.95 |
| Body mass (kg) | 72.37±10.32 | 87.67±24.39 | 0.04 |
| Edinburgh Handedness Inventory | 64.44±54.34 | 79.00±33.21 | 0.51 |
| Roland-Morris Disability Questionnaire (0–24) | 0.0±0.0 | 10.27±6.45 | <0.001 |
| VAS (0–10) | 0.0±0.0 | 5.20±2.84 | <0.001 |
Data are presented as mean±SD.
For the Edinburgh Handedness Inventory, −100 indicates left handed whereas 100 indicates right handed; for the VAS, 0 means no pain at all and 10 means maximum pain imaginable; for the Roland-Morris Disability Questionnaire, the scores range from 0, no disability to 24, maximum disability.
LBP, low back pain; VAS, Visual Analogue Scale for pain.
Root-mean-square (rms) EMG
There was no side difference in rms EMG in the LBP group (T12: Z=−1.36; p=0.18; L4: Z=−1.07; p=0.29) or in the controls (T12: Z=−0.30; p=0.77; L4: Z=−0.15; p=0.88; table 2). The mean rms EMG, averaged from left and right ES, at T12 and L4 vertebral levels was significantly lower in the LBP group than in the controls (T12: Z=−2.69; p=0.007; L4: Z=−2.33; p=0.02; table 2).
Table 2.
Root-mean-square electromyography (millivolt) during maximal isometric back extension
| ES T12 | ES L4 | |||||
| Left | Right | Average | Left | Right | Average | |
| Control | 0.21±0.08 | 0.20±0.07 | 0.21±0.07 | 0.22±0.10 | 0.22±0.10 | 0.22±0.09 |
| LBP | 0.13±0.07 | 0.12±0.08 | 0.12±0.07* | 0.12±0.12 | 0.14±0.07 | 0.13±0.12* |
*Data are presented as mean±SD. *p<0.05 between the LBP group and the control group.
ES, erector spinae; LBP, low back pain.
Spectral parameters
The peak power (figure 2A) and its corresponding frequency (figure 2B) of the transformed EMG were different between the two groups. For the ES T12, the peak power and its corresponding frequency were lower in the LBP group (peak power: 0.84±0.22; frequency: 40.94±8.21 Hz) than in the controls (peak power: 1.17±0.25; frequency: 49.56±10.56 Hz; peak power: Z=−2.88; p=0.004; frequency: Z=−2.16; p=0.030; figure 2). For the ES L4, the peak power was lower in the LBP group (peak power: 0.75±0.18) than in the controls (peak power: 1.13±0.29; Z=−2.99; p=0.003; figure 2A), whereas its corresponding frequency (LBP group: 40.64±14.81 Hz; control group: 47.97±6.16 Hz) was not different between two groups (Z=−1.66; p=0.096; figure 2B).
Figure 2.

Group mean (±SEM) data showing (A) peak power and (B) its corresponding frequency from erector spinae (ES) muscles at vertebral levels T12 (ES T12) and L4 (ES L4) in the controls and in patients with low back pain. *p<0.05, between-group comparison. CLP, chronic lower back pain.
In the controls, the mean (±SD) scales splitting the energy matrix into the ratio to ~1.8 of low to high energy for T12 (the mean ratio was 1.72±0.05) and L4 (1.74±0.04) were 36.8±10.52 and 34.25±9.60, respectively; the corresponding frequencies were 87 Hz for T12 and 96 Hz for L4. The splitting scales used in the LBP group were therefore 37 for T12 and 34 for L4; the mean ratios (low/high) at these two scales were 3.56±2.36 for T12 (Z=−2.11; p=0.035, compared with the control group) and 4.32±3.19 for L4 (Z=−1.94; p=0.052) scales in the LBP group. Spearman correlation analysis showed a correlation between the ratios from ES T12 and the RMDQ scores (r=0.63; p=0.012; figure 3); however, the ratios from ES L4 did not significantly correlate with the RMDQ scores (r=0.47; p=0.075). The ratios did not correlate with the VAS scores (ES T12: r=0.09; p=0.76. ES L4: r=0.01; p=0.96 p>0.05).
Figure 3.
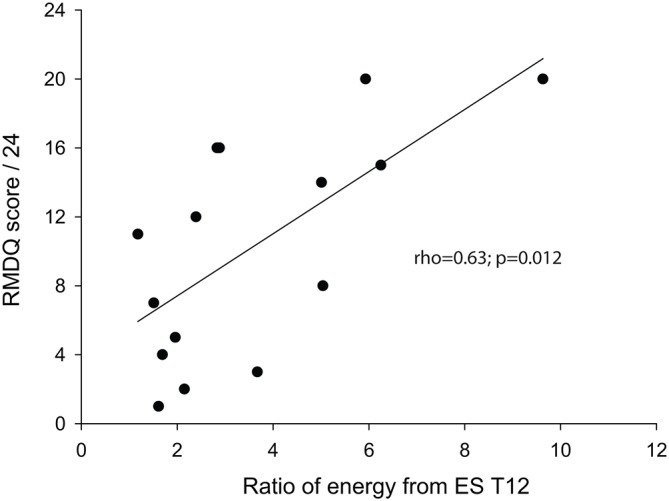
Correlation between the ratio of energy at low to high (low:high) frequencies and Roland-Morris Disability Questionnaire (RMDQ) in subjects with low back pain.
Discussion
The current study used CWT to decompose the surface EMG signals recorded from the ES during maximal isometric back extensions performed by patients with LBP and controls. In patients with LBP, there was a lower peak power in ES T12 and L4 and the overall energy distribution in ES T12 was shifted towards lower frequencies than in the controls. Moreover, the ratios of energy between low and high frequencies, calculated from ES T12, correlated with patients’ self-rated back pain disability which may highlight the potential clinical application of wavelet analysis in monitoring the progression of, or response to treatment, for back pain.
Frequency analysis has been widely applied to analyse EMG signals recorded from paraspinal muscles in patients with chronic LBP and STFT has been used in the majority of studies. Mean and median frequencies were lower in patients with chronic LBP than in controls;30 39 however, controversial results are still reported.40 41 Although there is evidence that analysis of back muscle EMG activity using STFT and wavelet transform provides similar information,24 42 43 some studies suggest that wavelet transform could detect changes in muscle fatigue earlier and be more sensitive than the STFT.44–46 A recent study used discrete wavelet transform on surface EMG of trunk muscles during the contraction in subjects with chronic LBP and in controls. Patients with chronic LBP had lower spectral power in the trunk muscles compared with the healthy subjects;30 however, their study did not include any subjective measurements (eg, pain scores, disability scores) or compare energy distribution between low and high frequency bands, which may reflect alterations in motor unit recruitment or muscle fibre type distributions. Our results show patients with LBP presented different EMG characteristics from healthy subjects, including lower peak power (both ES T12 and L4) and its corresponding frequency (ES T12), and higher ratio of energy between low and high frequencies (ES T12), in line with previous findings that patients with chronic LBP have an overall shift of energy distribution toward lower frequencies in the back muscles.47 We further demonstrate a correlation between the energy distribution calculated from the EST12 and the RMDQ, indicating an association between muscle function and self-rated disability. However, the reduced volume muscle at the lumbar level38 might explain the differences in the findings between ES T12 and L4 levels. Together with previous work showing that EMG variables recorded from ES may identify people at increased risk of developing LBP in 2 years,48 we suggest that the EMG characteristics could be useful in clinics to monitor progression of back pain as well as the effectiveness of therapeutic interventions.
Changes in spectral energy from leg and thigh muscles have been found in individuals with diabetic neuropathy and are suggested to be related to alterations in muscle recruitment strategies due to the loss of type I fibres in this population.26 Studies have shown that instantaneous spectra derived from wavelet decomposition of EMG signals are associated with activity from different muscle fibre types using a range of approaches including electrical nerve stimulation29 and voluntary contractions.49 In addition, previous findings using conventional Fourier transformation demonstrated a correlation between the change in median frequency in ES during fatiguing exercise and the relative area of the muscle occupied by type I fibres in healthy subjects.18 Anatomical evidence from biopsy studies is equivocal, with some studies demonstrating differences in muscle fibre-type proportions in paraspinal muscles between patients with LBP and healthy subjects,50 51 while others show no differences.52 53 Nevertheless, studies using twitch interpolation to assess central neural drive to muscles suggest that decreases in time-to-peak amplitude of superimposed twitches at increasing levels of voluntary contraction reflect the recruitment of different types of motor units.33 54–56 Further, given patients with chronic LBP have been shown to exhibit longer time-to-peak amplitudes of twitches during MVICs, this supports the view that these patients have alterations in muscle fibre-type composition. In the current study, the spectra obtained from the patients with LBP had a shift in the peak power towards the lower frequencies; this might reflect alterations in motor control or in muscle fibre-type proportions. Further, the correlation between the EMG spectral characteristics and back pain-related disability scores suggests that altered motor control or fibre-type proportions of paraspinal muscles may be reflected in self-rated disability scores. This highlights the importance of rehabilitation to restore motor control and muscle function in patients with LBP, which may reduce the levels of disability reported in these patients.
The approach used in the current study may provide a valuable tool for clinical assessment. Surface EMG recordings are easy to use in clinics and the task is feasible for people with chronic LBP as all of our patients were able to perform the three maximal isometric back extensions. While factors such as fear avoidance or pain inhibition likely affect the values of maximal muscle activity, our subjects were given adequate warm-up time as well as asked to repeat the contractions three times, with the highest value taken. They were also asked to report pain levels during the MVICs and to give an indication (on a modified Borg scale) of the degree of effort used to perform the MVICs. Patients reported no increase in pain, and levels of effort comparable to the controls. Wavelet transform is a robust approach for the surface EMG signal and could reveal extra features which may be useful to monitor subtle changes in muscle function during rehabilitation. A further study to test whether the wavelet approach is able to detect the therapeutic effect on muscle function is therefore warranted.
In conclusion, the patients with LBP recruited in the current study had lower maximal force of the back extensors and smaller ES muscle activity during the MVICs. The wavelet transform further revealed alterations in EMG profile and its association with the self-related back pain disability, indicating that spectral characteristics of EMG reflect muscle function.
Supplementary Material
Acknowledgments
We thank all participants of this study.
Footnotes
Contributors: S-YC and PHS conceived and designed the study. S-YC and PHS conducted the experiment. S-Y C, EK and PHS analysed the data and interpreted the data. PG provided guidance on the data analysis. All authors drafted the manuscript and read, edited and approved the final version of the manuscript. All authors had full access to all of the data in the study and can take responsibility for the integrity of the data and the accuracy of the data analysis.
Funding: This research received no specific grant from any funding agency in the public, commercial or not-for-profit sectors.
Competing interests: None declared.
Patient consent: Obtained.
Ethics approval: NHS NRES Committee London–Harrow.
Provenance and peer review: Not commissioned; externally peer reviewed.
Data sharing statement: No additional data are available.
References
- 1.Macfarlane GJ, Thomas E, Croft PR, et al. Predictors of early improvement in low back pain amongst consulters to general practice: the influence of pre-morbid and episode-related factors. Pain 1999;80:113–9. 10.1016/S0304-3959(98)00209-7 [DOI] [PubMed] [Google Scholar]
- 2.Dunn KM, Croft PR. Epidemiology and natural history of low back pain. Eura Medicophys 2004;40:9–13. [PubMed] [Google Scholar]
- 3.Maniadakis N, Gray A. The economic burden of back pain in the UK. Pain 2000;84:95–103. 10.1016/S0304-3959(99)00187-6 [DOI] [PubMed] [Google Scholar]
- 4.Chou R, Qaseem A, Snow V, et al. Diagnosis and treatment of low back pain: a joint clinical practice guideline from the American College of Physicians and the American Pain Society. Ann Intern Med 2007;147:478–91. 10.7326/0003-4819-147-7-200710020-00006 [DOI] [PubMed] [Google Scholar]
- 5.Hodges PW, Moseley GL, Gabrielsson A, et al. Experimental muscle pain changes feedforward postural responses of the trunk muscles. Exp Brain Res 2003;151:262–71. 10.1007/s00221-003-1457-x [DOI] [PubMed] [Google Scholar]
- 6.Strutton PH, Theodorou S, Catley M, et al. Corticospinal excitability in patients with chronic low back pain. J Spinal Disord Tech 2005;18:420–4. 10.1097/01.bsd.0000169063.84628.fe [DOI] [PubMed] [Google Scholar]
- 7.Tsao H, Danneels LA, Hodges PW. ISSLS prize winner: smudging the motor brain in young adults with recurrent low back pain. Spine 2011;36:1721–7. 10.1097/BRS.0b013e31821c4267 [DOI] [PubMed] [Google Scholar]
- 8.Chiou SY, Shih YF, Chou LW, et al. Impaired neural drive in patients with low back pain. Eur J Pain 2014;18:794–802. 10.1002/j.1532-2149.2013.00428.x [DOI] [PubMed] [Google Scholar]
- 9.Dubois JD, Piché M, Cantin V, et al. Effect of experimental low back pain on neuromuscular control of the trunk in healthy volunteers and patients with chronic low back pain. J Electromyogr Kinesiol 2011;21:774–81. 10.1016/j.jelekin.2011.05.004 [DOI] [PubMed] [Google Scholar]
- 10.D’hooge R, Hodges P, Tsao H, et al. Altered trunk muscle coordination during rapid trunk flexion in people in remission of recurrent low back pain. J Electromyogr Kinesiol 2013;23:173–81. 10.1016/j.jelekin.2012.09.003 [DOI] [PubMed] [Google Scholar]
- 11.Nicolaisen T, Jorgensen K, strength T. Back muscle endurance and low-back trouble. Scand J Rehabil Med 1985;17:121–7. [PubMed] [Google Scholar]
- 12.Roy SH, De Luca CJ, Casavant DA. Lumbar muscle fatigue and chronic lower back pain. Spine 1989;14:992–1001. 10.1097/00007632-198909000-00014 [DOI] [PubMed] [Google Scholar]
- 13.Pitcher MJ, Behm DG, MacKinnon SN. Reliability of electromyographic and force measures during prone isometric back extension in subjects with and without low back pain. Appl Physiol Nutr Metab 2008;33:52–60. 10.1139/H07-132 [DOI] [PubMed] [Google Scholar]
- 14.Hubley-Kozey CL, Vezina MJ. Differentiating temporal electromyographic waveforms between those with chronic low back pain and healthy controls. Clin Biomech 2002;17:621–9. 10.1016/S0268-0033(02)00103-1 [DOI] [PubMed] [Google Scholar]
- 15.Huebner A, Faenger B, Scholle HC, et al. Re-evaluation of the amplitude-force relationship of trunk muscles. J Biomech 2015;48:1198–205. 10.1016/j.jbiomech.2015.02.016 [DOI] [PubMed] [Google Scholar]
- 16.Kumar S, Narayan Y. Torque and EMG in isometric graded flexion-rotation and extension-rotation. Ergonomics 2001;44:795–813. 10.1080/00140130110045802 [DOI] [PubMed] [Google Scholar]
- 17.Gerdle B, Karlsson S, Crenshaw AG, et al. The influences of muscle fibre proportions and areas upon EMG during maximal dynamic knee extensions. Eur J Appl Physiol 2000;81:2–10. 10.1007/PL00013792 [DOI] [PubMed] [Google Scholar]
- 18.Mannion AF, Dumas GA, Stevenson JM, et al. The influence of muscle fiber size and type distribution on electromyographic measures of back muscle fatigability. Spine 1998;23:576–84. 10.1097/00007632-199803010-00010 [DOI] [PubMed] [Google Scholar]
- 19.Karlsson S, Yu J, Akay M. Time-frequency analysis of myoelectric signals during dynamic contractions: a comparative study. IEEE Trans Biomed Eng 2000;47:228–38. 10.1109/10.821766 [DOI] [PubMed] [Google Scholar]
- 20.Karlsson S, Yu J, Akay M. Enhancement of spectral analysis of myoelectric signals during static contractions using wavelet methods. IEEE Trans Biomed Eng 1999;46:670–84. 10.1109/10.764944 [DOI] [PubMed] [Google Scholar]
- 21.von Tscharner V, Tscharner von V. Intensity analysis in time-frequency space of surface myoelectric signals by wavelets of specified resolution. J Electromyogr Kinesiol 2000;10:433–45. 10.1016/S1050-6411(00)00030-4 [DOI] [PubMed] [Google Scholar]
- 22.Croce R, Miller J, Chamberlin K, et al. Wavelet analysis of quadriceps power spectra and amplitude under varying levels of contraction intensity and velocity. Muscle Nerve 2014;50:844–53. 10.1002/mus.24230 [DOI] [PubMed] [Google Scholar]
- 23.Chowdhury SK, Nimbarte AD, Jaridi M, et al. Discrete wavelet transform analysis of surface electromyography for the fatigue assessment of neck and shoulder muscles. J Electromyogr Kinesiol 2013;23:995–1003. 10.1016/j.jelekin.2013.05.001 [DOI] [PubMed] [Google Scholar]
- 24.Coorevits P, Danneels L, Cambier D, et al. Test-retest reliability of wavelet - and Fourier based EMG (instantaneous) median frequencies in the evaluation of back and hip muscle fatigue during isometric back extensions. J Electromyogr Kinesiol 2008;18:798–806. 10.1016/j.jelekin.2007.01.007 [DOI] [PubMed] [Google Scholar]
- 25.Weiderpass HA, Pachi CG, Yamamoto JF, et al. Time-frequency analysis methods for detecting effects of diabetic neuropathy. Int J Numer Method Biomed Eng 2013;29:1000–10. 10.1002/cnm.2545 [DOI] [PubMed] [Google Scholar]
- 26.Sacco IC, Hamamoto AN, Onodera AN, et al. Motor strategy patterns study of diabetic neuropathic individuals while walking. A wavelet approach. J Biomech 2014;47:2475–82. 10.1016/j.jbiomech.2014.04.007 [DOI] [PubMed] [Google Scholar]
- 27.Kuntze G, von Tscharner V, Hutchison C, et al. Alterations in lower limb multimuscle activation patterns during stair climbing in female total knee arthroplasty patients. J Neurophysiol 2015;114:2718–25. 10.1152/jn.00370.2015 [DOI] [PMC free article] [PubMed] [Google Scholar]
- 28.Solomonow M, Baten C, Smit J, et al. Electromyogram power spectra frequencies associated with motor unit recruitment strategies. J Appl Physiol 1990;68:1177–85. [DOI] [PubMed] [Google Scholar]
- 29.Wakeling JM, Syme DA. Wave properties of action potentials from fast and slow motor units of rats. Muscle Nerve 2002;26:659–68. 10.1002/mus.10263 [DOI] [PubMed] [Google Scholar]
- 30.Kumar S, Prasad N. Torso muscle EMG profile differences between patients of back pain and control. Clin Biomech 2010;25:103–9. 10.1016/j.clinbiomech.2009.10.013 [DOI] [PubMed] [Google Scholar]
- 31.Oldfield RC. The assessment and analysis of handedness: the Edinburgh inventory. Neuropsychologia 1971;9:97–113. 10.1016/0028-3932(71)90067-4 [DOI] [PubMed] [Google Scholar]
- 32.Roland M, Fairbank J. The Roland-Morris Disability Questionnaire and the Oswestry Disability Questionnaire. Spine 2000;25:3115–24. 10.1097/00007632-200012150-00006 [DOI] [PubMed] [Google Scholar]
- 33.Chiou SY, Jeevathol A, Odedra A, et al. Voluntary activation of trunk extensors appears normal in young adults who have recovered from low back pain. Eur J Pain 2015;19:1506–15. 10.1002/ejp.684 [DOI] [PubMed] [Google Scholar]
- 34.Borg GA. Psychophysical bases of perceived exertion. Med Sci Sports Exerc 1982;14:377–81. 10.1249/00005768-198205000-00012 [DOI] [PubMed] [Google Scholar]
- 35.Beck TW, Housh TJ, Johnson GO, et al. Comparison of the fast Fourier transform and continuous wavelet transform for examining mechanomyographic frequency versus eccentric torque relationships. J Neurosci Methods 2006;150:59–66. 10.1016/j.jneumeth.2005.06.003 [DOI] [PubMed] [Google Scholar]
- 36.van Boxtel A. Optimal signal bandwidth for the recording of surface EMG activity of facial, jaw, oral, and neck muscles. Psychophysiology 2001;38:22–34. 10.1111/1469-8986.3810022 [DOI] [PubMed] [Google Scholar]
- 37.Rosenburg R, Seidel H. Electromyography of lumbar erector spinae muscles--influence of posture, interelectrode distance, strength, and fatigue. Eur J Appl Physiol Occup Physiol 1989;59:104–14. 10.1007/BF02396587 [DOI] [PubMed] [Google Scholar]
- 38.Mannion AF, Dumas GA, Cooper RG, et al. Muscle fibre size and type distribution in thoracic and lumbar regions of erector spinae in healthy subjects without low back pain: normal values and sex differences. J Anat 1997;190:505–13. 10.1046/j.1469-7580.1997.19040505.x [DOI] [PMC free article] [PubMed] [Google Scholar]
- 39.Linsiński P. Surface EMG in chronic low back pain. Eur Spine J 2000;9:559–62. [DOI] [PMC free article] [PubMed] [Google Scholar]
- 40.Kramer M, Ebert V, Kinzl L, et al. Surface electromyography of the paravertebral muscles in patients with chronic low back pain. Arch Phys Med Rehabil 2005;86:31–6. 10.1016/j.apmr.2004.01.016 [DOI] [PubMed] [Google Scholar]
- 41.Humphrey AR, Nargol AV, Jones AP, et al. The value of electromyography of the lumbar paraspinal muscles in discriminating between chronic-low-back-pain sufferers and normal subjects. Eur Spine J 2005;14:175–84. 10.1007/s00586-004-0792-3 [DOI] [PMC free article] [PubMed] [Google Scholar]
- 42.da Silva RA, Larivière C, Arsenault AB, et al. The comparison of wavelet- and Fourier-based electromyographic indices of back muscle fatigue during dynamic contractions: validity and reliability results. Electromyogr Clin Neurophysiol 2008;48:147–62. [PubMed] [Google Scholar]
- 43.Coorevits P, Danneels L, Cambier D, et al. Correlations between short-time Fourier- and continuous wavelet transforms in the analysis of localized back and hip muscle fatigue during isometric contractions. J Electromyogr Kinesiol 2008;18:637–44. 10.1016/j.jelekin.2007.01.006 [DOI] [PubMed] [Google Scholar]
- 44.Chowdhury SK, Nimbarte AD. Comparison of Fourier and wavelet analysis for fatigue assessment during repetitive dynamic exertion. J Electromyogr Kinesiol 2015;25:205–13. 10.1016/j.jelekin.2014.11.005 [DOI] [PubMed] [Google Scholar]
- 45.Pope MH, Aleksiev A, Panagiotacopulos ND, et al. Evaluation of low back muscle surface EMG signals using wavelets. Clin Biomech 2000;15:567–73. 10.1016/S0268-0033(00)00024-3 [DOI] [PubMed] [Google Scholar]
- 46.Peñailillo L, Silvestre R, Nosaka K. Changes in surface EMG assessed by discrete wavelet transform during maximal isometric voluntary contractions following supramaximal cycling. Eur J Appl Physiol 2013;113:895–904. 10.1007/s00421-012-2499-1 [DOI] [PubMed] [Google Scholar]
- 47.Sparto PJ, Parnianpour M, Barria EA, et al. Wavelet analysis of electromyography for back muscle fatigue detection during isokinetic constant-torque exertions. Spine 1999;24:1791–8. 10.1097/00007632-199909010-00008 [DOI] [PubMed] [Google Scholar]
- 48.Heydari A, Nargol AV, Jones AP, et al. EMG analysis of lumbar paraspinal muscles as a predictor of the risk of low-back pain. Eur Spine J 2010;19:1145–52. 10.1007/s00586-010-1277-1 [DOI] [PMC free article] [PubMed] [Google Scholar]
- 49.Wakeling JM, Rozitis AI. Spectral properties of myoelectric signals from different motor units in the leg extensor muscles. J Exp Biol 2004;207:2519–28. 10.1242/jeb.01042 [DOI] [PubMed] [Google Scholar]
- 50.Bajek S, Bobinac D, Bajek G, et al. Muscle fiber type distribution in multifidus muscle in cases of lumbar disc herniation. Acta Med Okayama 2000;54:235–41. [DOI] [PubMed] [Google Scholar]
- 51.Mannion AF, Weber BR, Dvorak J, et al. Fibre type characteristics of the lumbar paraspinal muscles in normal healthy subjects and in patients with low back pain. J Orthop Res 1997;15:881–7. 10.1002/jor.1100150614 [DOI] [PubMed] [Google Scholar]
- 52.Mattila M, Hurme M, Alaranta H, et al. The multifidus muscle in patients with lumbar disc herniation. a histochemical and morphometric analysis of intraoperative biopsies. Spine 1986;11:732–8. [DOI] [PubMed] [Google Scholar]
- 53.Crossman K, Mahon M, Watson PJ, et al. Chronic low back pain-associated paraspinal muscle dysfunction is not the result of a constitutionally determined ’adverse' fiber-type composition. Spine 2004;29:628–34. 10.1097/01.BRS.0000115133.97216.EC [DOI] [PubMed] [Google Scholar]
- 54.Milner-Brown HS, Stein RB, Yemm R. The orderly recruitment of human motor units during voluntary isometric contractions. J Physiol 1973;230:359–70. 10.1113/jphysiol.1973.sp010192 [DOI] [PMC free article] [PubMed] [Google Scholar]
- 55.Henneman E, Somjen G, Carpenter DO. Excitability and inhibitability of motoneurons of different sizes. J Neurophysiol 1965;28:599–620. [DOI] [PubMed] [Google Scholar]
- 56.Bottle E, Strutton PH. Relationship between back muscle endurance and voluntary activation. J Electromyogr Kinesiol 2012;22:383–90. 10.1016/j.jelekin.2012.02.006 [DOI] [PubMed] [Google Scholar]
Associated Data
This section collects any data citations, data availability statements, or supplementary materials included in this article.