Protein corona–mediated cell labeling represents a new and readily clinically translatable method for labeling “off-the-shelf” cell products with ferumoxytol and will be applied for stem cell tracking in patients.
Abstract
Purpose
To evaluate if the formation of a protein corona around ferumoxytol nanoparticles can facilitate stem cell labeling for in vivo tracking with magnetic resonance (MR) imaging.
Materials and Methods
Ferumoxytol was incubated in media containing human serum (group 1), fetal bovine serum (group 2), StemPro medium (group 3), protamine (group 4), and protamine plus heparin (group 5). Formation of a protein corona was characterized by means of dynamic light scattering, ζ potential, and liquid chromatography–mass spectrometry. Iron uptake was evaluated with 3,3ʹ-diaminobenzidine–Prussian blue staining, lysosomal staining, and inductively coupled plasma spectrometry. To evaluate the effect of a protein corona on stem cell labeling, human mesenchymal stem cells (hMSCs) were labeled with the above formulations, implanted into pig knee specimens, and investigated with T2-weighted fast spin-echo and multiecho spin-echo sequences on a 3.0-T MR imaging unit. Data in different groups were compared by using a Kruskal-Wallis test.
Results
Compared with bare nanoparticles, all experimental groups showed significantly increased negative ζ values (from −37 to less than −10; P = .008). Nanoparticles in groups 1–3 showed an increased size because of the formation of a protein corona. hMSCs labeled with group 1–5 media showed significantly shortened T2 relaxation times compared with unlabeled control cells (P = .0012). hMSCs labeled with group 3 and 5 media had the highest iron uptake after cells labeled with group 1 medium. After implantation into pig knees, hMSCs labeled with group 1 medium showed significantly shorter T2 relaxation times than hMSCs labeled with group 2–5 media (P = .0022).
Conclusion
The protein corona around ferumoxytol nanoparticles can facilitate stem cell labeling for clinical cell tracking with MR imaging.
© RSNA, 2017
Introduction
Imaging techniques are important for monitoring novel cell therapies for tissue regeneration. Therapeutic cells migrate, proliferate, differentiate, and respond to their environment (1). Iron oxide nanoparticles can be used to track transplanted cells in vivo with magnetic resonance (MR) imaging (2). Persistence or disappearance of the iron oxide label at the transplant site, as visualized at MR imaging, can provide information about successful or unsuccessful engraftment outcomes (3,4).
Previous studies found that relatively large superparamagnetic iron oxide nanoparticles (SPIOs) with diameters of more than 50 nm are phagocytosed by stem cells (5). This leads to more efficient cellular uptake compared with ultrasmall SPIOs (USPIOs) with diameters of less than 50 nm, which are mainly subject to endocytotic cellular uptake (6–8). Therefore, initial approaches for MR imaging–based cell tracking have been almost exclusively performed with SPIOs (6,9,10). Unfortunately, SPIOs have been taken off the market in the United States and Europe and have been replaced by USPIOs as second-generation nanoparticles, which offer a wider spectrum of clinical applications. Ferumoxytol (Feraheme) is a Food and Drug Administration–approved iron supplement (11) that is composed of USPIOs and can be applied “off-label” for cell tracking in patients. Because ferumoxytol uptake by stem cells is relatively inefficient (12), previous cell-labeling protocols utilized transfection agents such as protamine sulfate, with or without the addition of heparin, to shuttle ferumoxytol into the cell (12,13). However, transfection agent–mediated cell labeling has three disadvantages: First, it requires incubation of positively charged transfection agents with negatively charged nanoparticles. This causes precipitation of some nanoparticles because of loss of surface charges and related safety concerns for clinical applications (14). Second, transfection agent–mediated cell labeling can lead to surface adsorption of nanoparticles instead of internalization, which can impair in vivo cell-cell interactions (14,15). Third, because most transfection agents are not approved for clinical use, adding non–clinically approved transfection agents to clinical protocols can hinder clinical translation (16,17). Simple incubation protocols would be preferable, as these would be easier to apply and would not require Investigational New Drug approval for the transfection agent. It has been recently described that proteins in human serum (HS) or serum-containing media form a corona around nanoparticles (18). The protein corona increases the nanoparticles’ surface charge and hydrodynamic size (19,20), which can increase their cellular uptake through endocytosis or phagocytosis (21–23). The purpose of our study was to evaluate if the formation of a protein corona around ferumoxytol nanoparticles can facilitate stem cell labeling for in vivo tracking with MR imaging.
Materials and Methods
Hard Corona Formation
Ferumoxytol (Feraheme) is composed of USPIOs with an iron oxide core and a carboxymethyldextran coat. The agent has a mean hydrodynamic diameter of 30 nm and an r2 relaxivity of 83 L mmol-1 sec-1 at 20 MHz (24). We incubated 100 μL of ferumoxytol (concentration, 1 mg iron per milliliter) with labeling media at 37°C for 1 hour as follows: Group 1 consisted of 900 μL of Dulbecco’s modified Eagle’s medium (DMEM) supplemented with 10% HS; group 2, 900 μL of DMEM with 10% fetal bovine serum (FBS); group 3, 900 μL of StemPro serum-free medium (StemPro is a xenogeny-free, serum-free, and Current Good Manufacturing Practice–compliant medium that contains well-characterized proteins specifically formulated for expansion of human mesenchymal stem cells [hMSCs] for clinical use); group 4, 10 μg/mL protamine sulfate in 1 mL medium; and group 5, 60 μg/mL protamine sulfate and 2 IU/mL heparin in 1 mL medium. Groups 4–5 were used as the standard of reference for clinically translatable transfection agent–mediated cell labeling methods. Excess and unbound proteins were removed by centrifugation and washing with phosphate-buffered saline (PBS). The pellet was resuspended in 500 μL of PBS and was used for further experiments. Bare nanoparticles served as a control group (group 6).
Protein Corona Characterization
Dynamic light scattering (DLS) and ζ potential of samples from groups 1–6 were measured with Malvern PCS-4700 and Malvern Zetasizer 3000HSa instruments. The protein corona composition in groups 1–3 was analyzed with liquid chromatography (LC)–mass spectrometry (MS). Protease Max (Promega, Madison, Wis), an acid labile surfactant, was added to the nanoparticles, followed by vortexing and sonication. Next, the samples were reduced, alkylated, and digested overnight. The digestion was quenched by addition of formic acid, followed by peptide concentration and purification. The peptide pools were dried, reconstituted, and injected into an in-house–packed C18 reversed phase analytical column. The mass spectrometer was an Orbitrap Fusion set to acquire data in a dependent fashion. Fragmentation was performed on the most intense multiply charged precursor ions. All LC-MS data were analyzed for peptide composition by using Preview and Byonic v2.0 software (ProteinMetrics, San Carlos, Calif). Data were validated by using standard reverse-decoy techniques. Peptide spectral matches and other supporting data were transferred for further analysis with custom tools developed in MATLAB (MathWorks, Natick, Mass) to provide visualization and statistical characterization.
A semiquantitative assessment of the protein amount was performed through application of a spectral counting (SpC) method. The normalized percentages of spectral counts (NpSpCs) of each protein, identified in the LC-MS spectra, were calculated by applying the following equation (25):
where NpSpCk is the normalized percentage of spectral count (ie, raw counts of ions) for protein k, SpC is the spectral count identified, and Mw is the molecular weight (in kilodaltons) of the protein k.
Stem Cell Labeling
Triplicate samples of 1 × 10⁶ human mesenchymal stromal cells (Lonza, Basel, Switzerland) were labeled with group 1–3 compositions of ferumoxytol (concentration, 100 μg/mL) for 5 days and with group 4–5 compositions for 4 hours in serum-free media and 20 hours in 10% FBS-containing media (12). Following the labeling procedures, the cells were washed in DMEM, counted, and referred for inductively coupled plasma (ICP) optical emission spectrometry (OES), microscopy, and imaging studies. The cellular iron uptake was measured by using ICP OES and was then divided by the cell concentration to provide the iron content per cell.
In addition, cell samples from each group were stained with the “Accustain” Prussian blue kit (Sigma-Aldrich, St Louis, Mo) with post–3,3ʹ-diaminobenzidine (DAB) enhancement and LysoTracker Red DND 99 (1 nM; Invitrogen, Molecular Probes, Eugene, Ore).
To further localize ferumoxytol nanoparticles in hMSCs, 1 × 10⁶ cells per group were carefully washed three times with PBS, fixed in formalin, embedded in gelatin, cut into 1 mm3 blocks, fixed in 1% osmium tetroxide in 0.1 M sodium cacodylate (EMS, Hatfield, Pa), stained with 2% uranyl acetate, dehydrated, embedded in Embed-812 resin (EMS), cut into 100-nm-thick slices, and placed on 300 mesh formvar-coated nickel grids (Ted Pella, Redding, Calif). Electron microscopy was performed with an aberration-corrected Titan (FEI, Hillsboro, Ore) operated at 300 kV and equipped with a OneView camera (Gatan, Pleasanton, Calif) and a Quantum 966 electron energy loss (EEL) spectrometer (Gatan). EEL spectra were obtained to confirm the presence of iron nanoparticle with a dispersion of 0.25 eV per channel in microprobe mode. Spectra were background subtracted in Gatan Digital Micrograph software and were smoothed by means of a five-point average in OriginPro 9.1 prior to plotting.
MR Imaging
Triplicate samples of 2 × 10⁶ hMSCs from each group were mixed with 50 μL ficol and were placed into 3-mm NMR tubes. Additional samples of 2 × 10⁶ hMSCs seeded in agarose scaffold were implanted into 5-mm cartilage defects in the femoral condyle of five pig knee joint specimens. All samples and specimens underwent MR imaging with a clinical 3.0-T MR imaging unit (Signa HD 16.0; GE Medical Systems, Milwaukee, Wis), using a Mayo Clinic BC-10 MR imaging coil, a T2 fat-saturated fast spin-echo sequence (repetition time msec/echo time msec, 3500/30; bandwidth, 31.25 Hz; field of view, 10 × 10 cm; matrix, 192 × 192; number of excitations, two; section thickness, 1.6 mm; and echo train length, six), and a multiecho spin-echo sequence (3500/15, 30, 45, 60; bandwidth, 31.25; field of view, 10 × 10 cm; matrix, 192 × 192; number of excitations, one; section thickness, 1.6 mm; and echo train length, one). T2 relaxation times of all samples were calculated by using CineTool software (GE Medical Systems).
Statistical Analyses
We used a Kruskal-Wallis test to test whether group 1 was significantly better than the other groups, followed by three post-hoc exact one-sided Wilcoxon tests comparing (a) groups 1–5 versus unlabeled control particles, (b) groups 2–5 versus group 1, and (c) group 1 versus the best two groups of groups 2–5 (protamine plus heparin and StemPro). A Bonferroni-adjusted significance level of .05/4 = .0125 was used. All statistical analyses were performed by using Stata, release 14.2 (Stata, College Station, Tex).
Results
Ferumoxytol Protein Corona Characterization
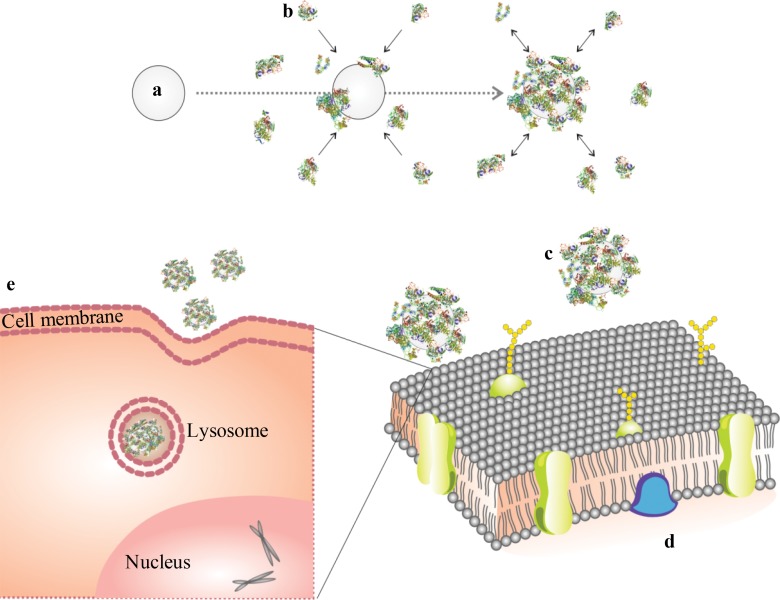
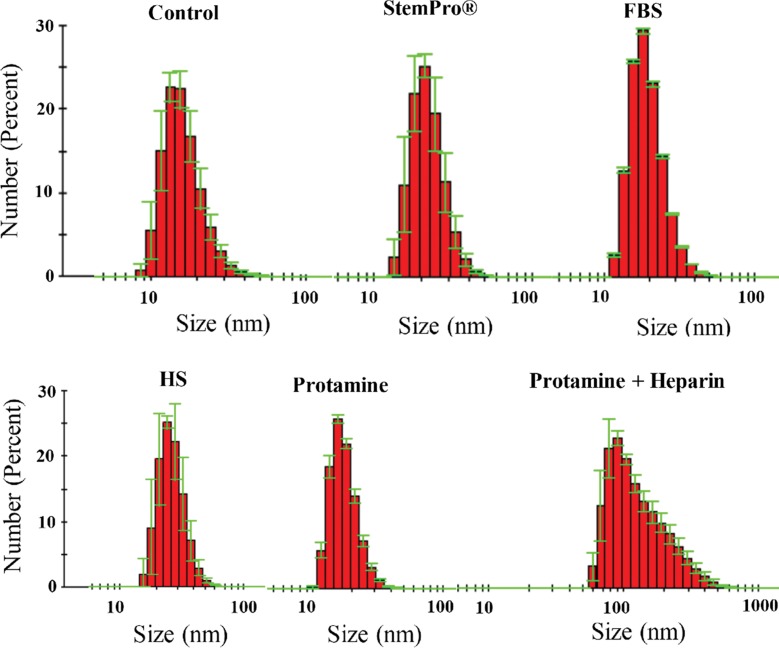
Ferumoxytol nanoparticles formed a protein corona (Fig 1) in media containing HS, FBS, and Current Good Manufacturing Practice–compliant proteins (StemPro). DLS measurements showed that the corona-covered nanoparticles were more dispersed compared with bare nanoparticles in water as a control group (Fig 2a). The average size of nanoparticles in groups 1, 2, and 3 and in the control group was 35.76 nm ± 2.25, 13.98 nm ± 0.10, 22.19 nm ± 1.37, and 16.53 nm ± 0.94, respectively. The average size of nanoparticles in groups 1–3 was significantly larger than in the group with bare nanoparticles in water (P = .025). The size of the nanoparticles in group 1 was significantly different from that in groups 2 and 3 (P = .0046).
Figure 1:
Schematic design of protein corona reaction with ferumoxytol and its cellular uptake. (a) Iron oxide nanoparticle, (b) proteins in culture media, (c) nanoparticle covered with protein corona, (d) cell membrane, and (e) protein-covered nanoparticle in a lysosome/endosome in a cell.
Figure 2a:
Protein corona characterization. (a) DLS analysis of ferumoxytol covered by protein corona in different culture media. (b) ζ-Potential measurement of ferumoxytol covered by protein corona in different culture media.
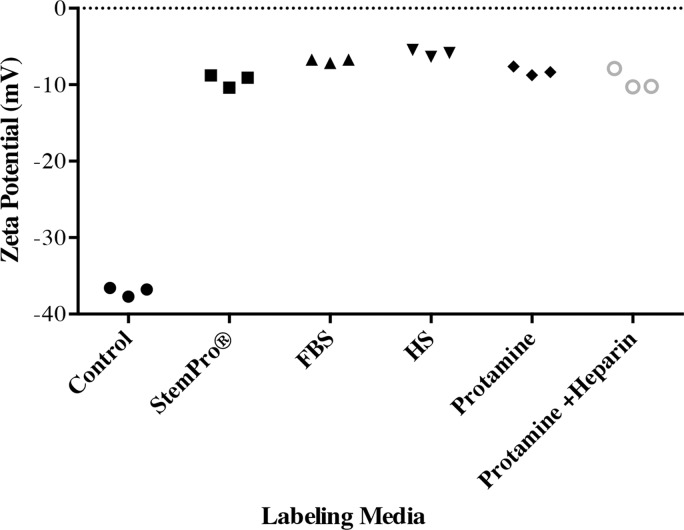
The ζ potential of nanoparticles in groups 1–5 (−5.87 mV ± 0.45, −6.87 mV ± 0.24, −9.42 mV ± 0.85, −8.24 mV ± 0.34, and −9.46 mV ± 0.79, respectively) was significantly different from the average ζ potential of bare nanoparticles in water (−37.03 mV ± 0.59; P = .0012). In addition, the ζ potential of nanoparticles in group 1 was significantly smaller than that in groups 2–5 (P = .0022; Fig 2b).
Figure 2b:
Protein corona characterization. (a) DLS analysis of ferumoxytol covered by protein corona in different culture media. (b) ζ-Potential measurement of ferumoxytol covered by protein corona in different culture media.
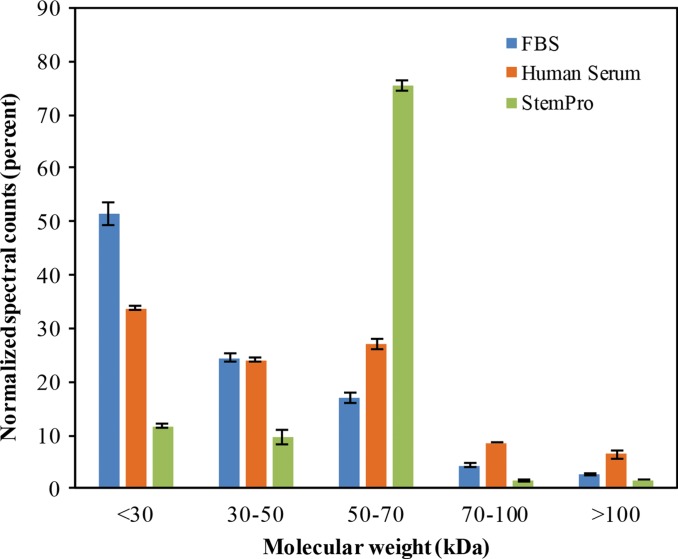
To further evaluate the composition of the protein corona around ferumoxytol nanoparticles in groups 1–3, we evaluated the type and size of corona proteins. After incubation with HS- or FBS-containing media, the corona was composed of proteins with a molecular weight of less than 30 kDa. The most frequent proteins (NpSpC > 5%) in the HS, FBS, and Current Good Manufacturing Practice–compliant protein-containing media (StemPro) included apolipoprotein A-I, hemoglobin α, and serum albumin, respectively (Tables 1–3 and Tables E1–E3 [online]).
Table 1.
Representative Hard Corona Proteins Associated with Ferumoxytol after Incubation in Media with 10% FBS, as Identified at LC-MS/MS
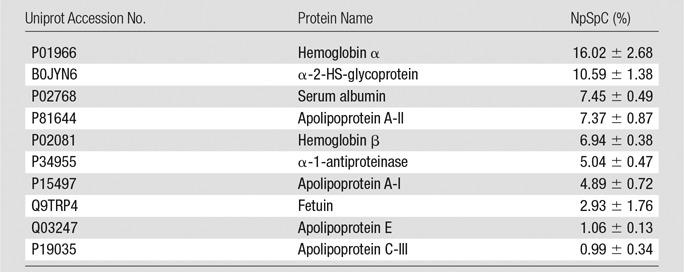
Note.—Data are means ± standard deviations of the results of three individual tests.
Table 3.
Representative Hard Corona Proteins Associated with Ferumoxytol after Incubation in StemPro Media, as Identified at LC-MS/MS
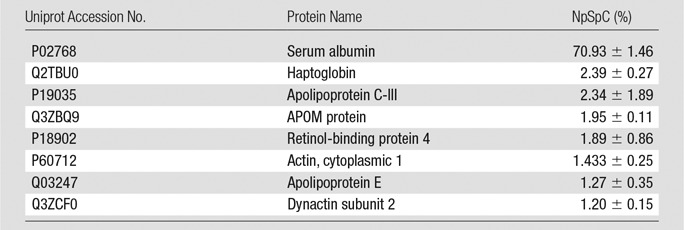
Note.—Data are means ± standard deviations of the results of three individual tests. APOM = apolipoprotein M.
Table 2.
Representative Hard Corona Proteins Associated with Ferumoxytol after Incubation in Media with 10% HS, as Identified at LC-MS/MS
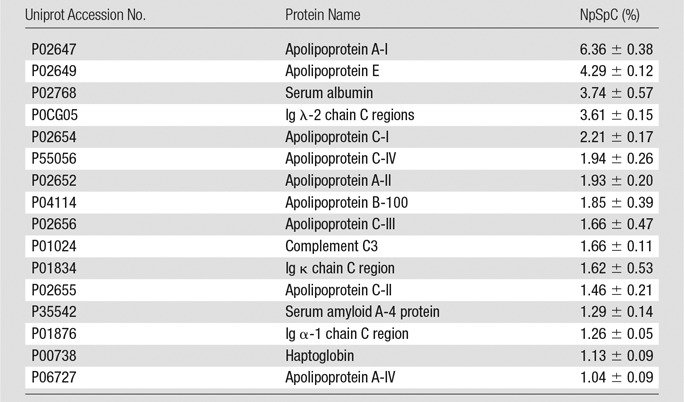
Note.—Data are means ± standard deviations of the results of three individual tests. Ig = immunoglobulin.
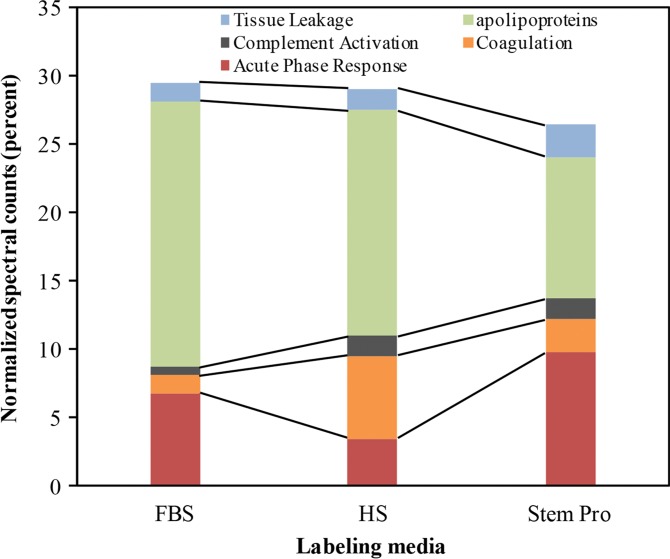
To understand the biochemical function of specific proteins in the corona, a bioanalytic approach (18) was used to classify the quantity of proteins that mediate complement activation, coagulation, acute phase response, apolipoproteins, and tissue leakage (Fig 3b). In the FBS and HS groups, 19.4% and 16.4% of all proteins in the corona were apolipoproteins. In the StemPro group, 20% of all proteins in the corona were acute phase response proteins (9.7%) and apolipoproteins (10.3%).
Figure 3b:
Graphs show classification of proteins in the hard corona of ferumoxytol nanoparticles, after incubation with protein-containing media. (a) Normalized spectral counts of proteins of different molecular weight ranges in the hard corona of ferumoxytol nanoparticles. (b) NpSpC of proteins with different physiologic functions in the hard corona of ferumoxytol nanoparticles, after incubation with HS- or FBS-containing media or StemPro media. Data are means and standard errors of the mean of three samples per group.
Figure 3a:
Graphs show classification of proteins in the hard corona of ferumoxytol nanoparticles, after incubation with protein-containing media. (a) Normalized spectral counts of proteins of different molecular weight ranges in the hard corona of ferumoxytol nanoparticles. (b) NpSpC of proteins with different physiologic functions in the hard corona of ferumoxytol nanoparticles, after incubation with HS- or FBS-containing media or StemPro media. Data are means and standard errors of the mean of three samples per group.
Cellular Iron Uptake
DAB-enhanced Prussian blue stains demonstrated marked iron uptake for hMSCs labeled with ferumoxytol in all groups (Fig E1a [online]). The quantitative iron uptake, as determined by inductively coupled plasma optical emission spectrometry, was significantly higher (P # .001) for hMSCs labeled with ferumoxytol in group 1 (4.01 pg/cell ± 0.02) than for hMSCs labeled with other methods (group 2: 1.88 pg/cell ± 0.27; group 3: 2.55 pg/cell ± 0.01), including the standard transfection protocols (group 4: 1.18 pg/cell ± 0.28; group 5: 2.98 pg/cell ± 0.01; Fig E1b [online]).
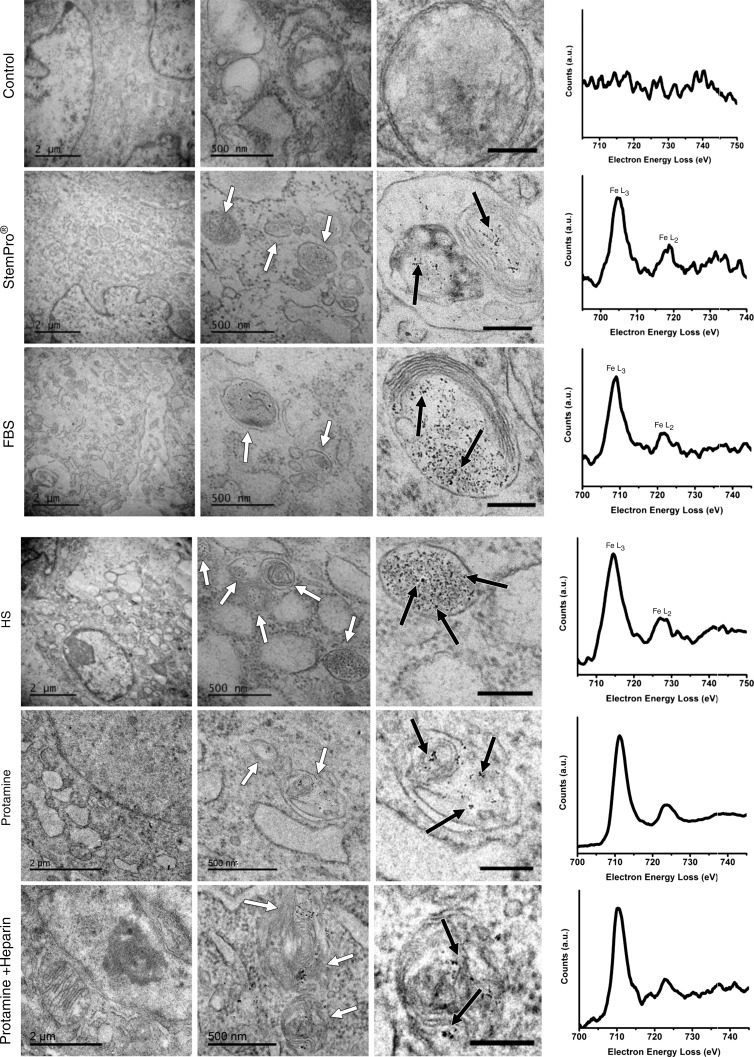
All labeling protocols led to an increased quantity of lysosomes/endosomes in labeled compared with unlabeled hMSCs, as shown with immunofluorescent stains (lysoTracker Red DND-99). This suggests a similar mode of lysosomal nanoparticle uptake for all labeling protocols (Fig E2 [online]). The presence of iron oxide nanoparticles in lysosomes/endosomes was confirmed at transmission electron microscopy and electron energy loss spectroscopy (Fig 4). No nanoparticles were observed in any other compartment of the cells. Imaging and electron energy loss spectroscopy of unlabeled control particles revealed no presence of nanoparticles in the cells.
Figure 4:
Ferumoxytol compartmentalization in hMSCs after exposure to different labeling media. Electron microscopy of similarly treated cells shows nanoparticle-containing lysosomes/endosomes (white arrows) and the iron nanoparticles (black arrows) in all samples that have been exposed to ferumoxytol (scale bars in left column, middle column, and right column are 2 μm, 500 nm, and 200 nm, respectively). Electron energy loss spectra (right) confirm the presence of iron in lysosomes/endosomes of labeled cells and the absence of iron in the unlabeled control.
MR Imaging
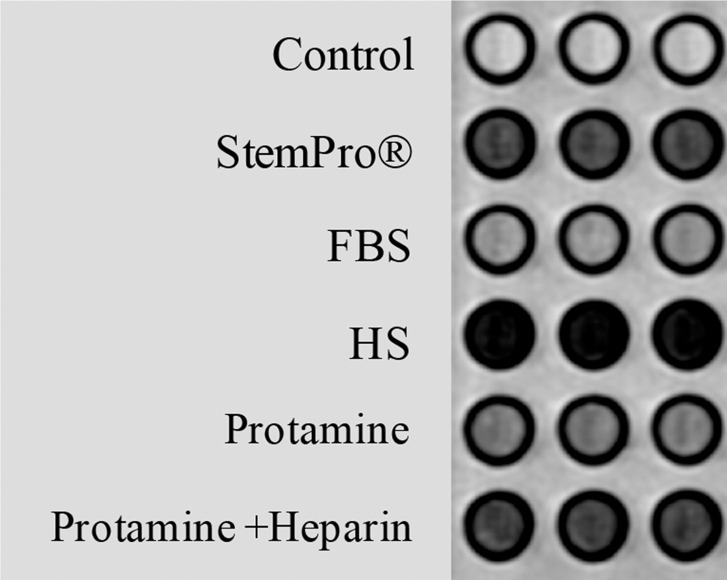
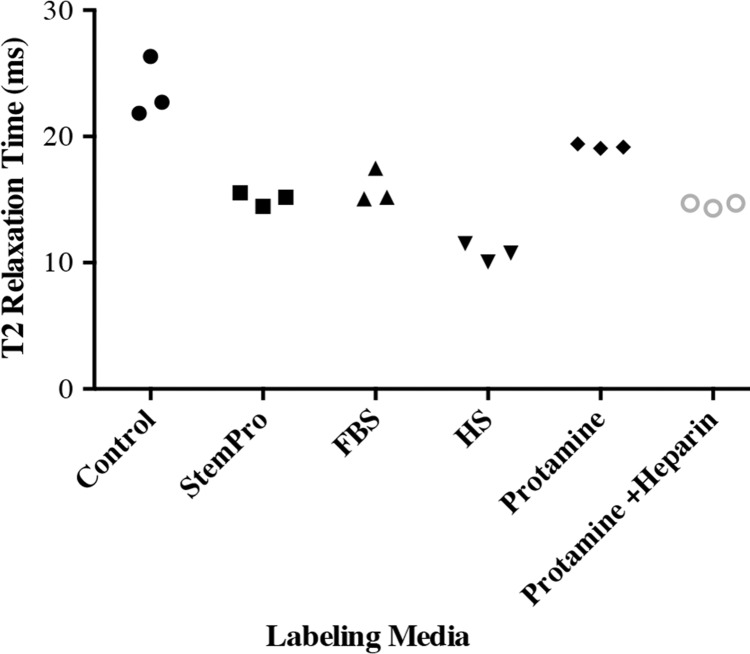
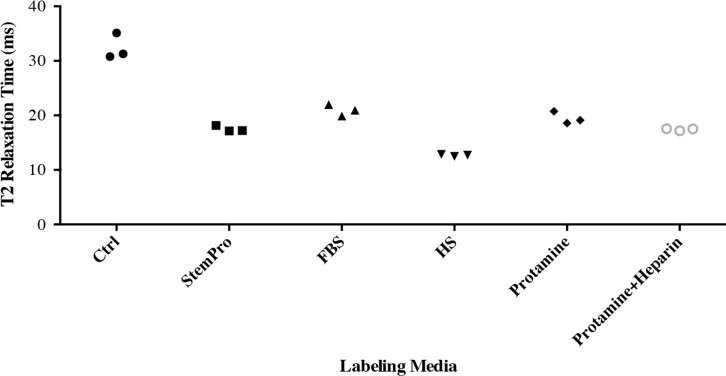
In vitro, MR images demonstrated significant MR signal effects for all labeled hMSCs when compared with unlabeled hMSCs (Fig 5). Compared with those in unlabeled control group (23.62 msec ± 2.39), mean T2 relaxation times were significantly (P = .0012) shorter for hMSCs labeled with ferumoxytol in group 1 (10.78 msec ± 0.73), group 2 (15.91 msec ± 1.36), group 3 (15.07 msec ± 0.55), group 4 (19.2 msec ± 0.17), and group 5 (14.58 msec ± 0.24). In addition, T2 relaxation times of hMSCs labeled with ferumoxytol in group 1 (10.78 msec ± 0.73) were significantly shorter than those of hMSCs labeled in groups 2–5 (P = .0022).
Figure 5a:
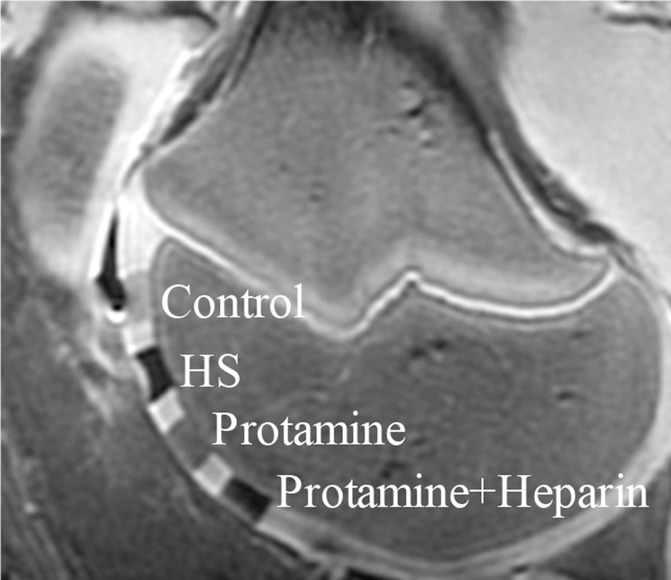
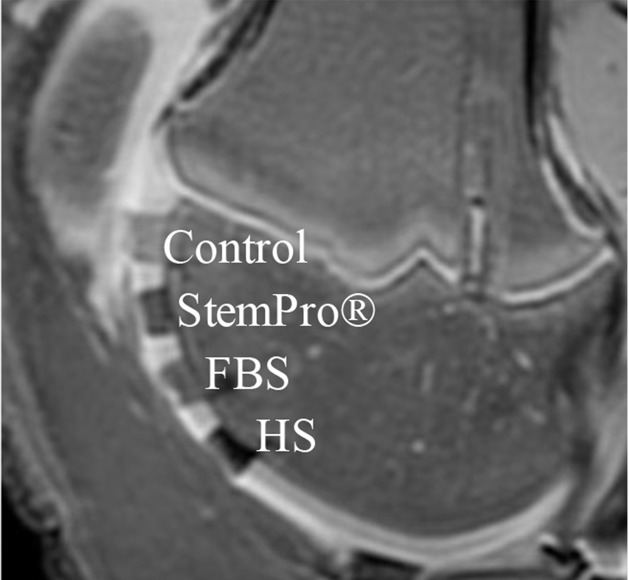
In vitro and ex vivo MR signal of labeled and unlabeled hMSCs at 3.0 T. (a) Axial T2-weighted MR image of 2 × 10⁶ hMSCs in test tubes with 50 μL Ficoll. Unlabeled control cells show positive (bright) T2 signal, while cells labeled with ferumoxytol in FBS, HS, and StemPro media show negative (dark) T2 signal. (b) Corresponding T2 relaxation times show significant T2 shortening in hMSCs labeled with ferumoxytol in HS-containing media compared with FBS and StemPro media, as well as protamine and protamine plus heparin transfection media. Data are displayed as mean data of three experiments in each group with standard errors. (c) Representative sagittal MR image of unlabeled hMSCs and hMSCs with ferumoxytol in FBS, HS, and StemPro media, seeded in an agarose scaffold and implanted in cartilage defects of a pig femur. (d) Corresponding T2 relaxation times of unlabeled (Ctrl) and labeled hMSCs implants. (e) Representative sagittal MR image of unlabeled hMSCs and hMSCs labeled with ferumoxytol in HS, protamine, and protamine plus heparin media, seeded in an agarose scaffold and implanted in cartilage defects of a pig femur.
Figure 5b:
In vitro and ex vivo MR signal of labeled and unlabeled hMSCs at 3.0 T. (a) Axial T2-weighted MR image of 2 × 10⁶ hMSCs in test tubes with 50 μL Ficoll. Unlabeled control cells show positive (bright) T2 signal, while cells labeled with ferumoxytol in FBS, HS, and StemPro media show negative (dark) T2 signal. (b) Corresponding T2 relaxation times show significant T2 shortening in hMSCs labeled with ferumoxytol in HS-containing media compared with FBS and StemPro media, as well as protamine and protamine plus heparin transfection media. Data are displayed as mean data of three experiments in each group with standard errors. (c) Representative sagittal MR image of unlabeled hMSCs and hMSCs with ferumoxytol in FBS, HS, and StemPro media, seeded in an agarose scaffold and implanted in cartilage defects of a pig femur. (d) Corresponding T2 relaxation times of unlabeled (Ctrl) and labeled hMSCs implants. (e) Representative sagittal MR image of unlabeled hMSCs and hMSCs labeled with ferumoxytol in HS, protamine, and protamine plus heparin media, seeded in an agarose scaffold and implanted in cartilage defects of a pig femur.
Figure 5d:
In vitro and ex vivo MR signal of labeled and unlabeled hMSCs at 3.0 T. (a) Axial T2-weighted MR image of 2 × 10⁶ hMSCs in test tubes with 50 μL Ficoll. Unlabeled control cells show positive (bright) T2 signal, while cells labeled with ferumoxytol in FBS, HS, and StemPro media show negative (dark) T2 signal. (b) Corresponding T2 relaxation times show significant T2 shortening in hMSCs labeled with ferumoxytol in HS-containing media compared with FBS and StemPro media, as well as protamine and protamine plus heparin transfection media. Data are displayed as mean data of three experiments in each group with standard errors. (c) Representative sagittal MR image of unlabeled hMSCs and hMSCs with ferumoxytol in FBS, HS, and StemPro media, seeded in an agarose scaffold and implanted in cartilage defects of a pig femur. (d) Corresponding T2 relaxation times of unlabeled (Ctrl) and labeled hMSCs implants. (e) Representative sagittal MR image of unlabeled hMSCs and hMSCs labeled with ferumoxytol in HS, protamine, and protamine plus heparin media, seeded in an agarose scaffold and implanted in cartilage defects of a pig femur.
Figure 5e:
In vitro and ex vivo MR signal of labeled and unlabeled hMSCs at 3.0 T. (a) Axial T2-weighted MR image of 2 × 10⁶ hMSCs in test tubes with 50 μL Ficoll. Unlabeled control cells show positive (bright) T2 signal, while cells labeled with ferumoxytol in FBS, HS, and StemPro media show negative (dark) T2 signal. (b) Corresponding T2 relaxation times show significant T2 shortening in hMSCs labeled with ferumoxytol in HS-containing media compared with FBS and StemPro media, as well as protamine and protamine plus heparin transfection media. Data are displayed as mean data of three experiments in each group with standard errors. (c) Representative sagittal MR image of unlabeled hMSCs and hMSCs with ferumoxytol in FBS, HS, and StemPro media, seeded in an agarose scaffold and implanted in cartilage defects of a pig femur. (d) Corresponding T2 relaxation times of unlabeled (Ctrl) and labeled hMSCs implants. (e) Representative sagittal MR image of unlabeled hMSCs and hMSCs labeled with ferumoxytol in HS, protamine, and protamine plus heparin media, seeded in an agarose scaffold and implanted in cartilage defects of a pig femur.
After implantation of hMSCs into pig knee joints, all labeled hMSC transplants could be clearly delineated from native cartilage and demonstrated significant T2 relaxation time shortening (Fig 5c–5e) compared with unlabeled hMSCs. Group 1 cell labeling resulted in significantly (P = .0022) shorter T2 relaxation times (12.68 msec ± 0.11) of labeled cell transplants compared with those in group 2 (20.94 msec ± 1.05), group 3 (17.50 msec ± 0.33), group 4 (19.48 msec ± 1.13), and group 5 (17.42 msec ± 0.21) (Fig 5c–5e).
Figure 5c:
In vitro and ex vivo MR signal of labeled and unlabeled hMSCs at 3.0 T. (a) Axial T2-weighted MR image of 2 × 10⁶ hMSCs in test tubes with 50 μL Ficoll. Unlabeled control cells show positive (bright) T2 signal, while cells labeled with ferumoxytol in FBS, HS, and StemPro media show negative (dark) T2 signal. (b) Corresponding T2 relaxation times show significant T2 shortening in hMSCs labeled with ferumoxytol in HS-containing media compared with FBS and StemPro media, as well as protamine and protamine plus heparin transfection media. Data are displayed as mean data of three experiments in each group with standard errors. (c) Representative sagittal MR image of unlabeled hMSCs and hMSCs with ferumoxytol in FBS, HS, and StemPro media, seeded in an agarose scaffold and implanted in cartilage defects of a pig femur. (d) Corresponding T2 relaxation times of unlabeled (Ctrl) and labeled hMSCs implants. (e) Representative sagittal MR image of unlabeled hMSCs and hMSCs labeled with ferumoxytol in HS, protamine, and protamine plus heparin media, seeded in an agarose scaffold and implanted in cartilage defects of a pig femur.
Discussion
Our data showed that labeling of hMSCs with ferumoxytol could be facilitated by generating a protein corona around nanoparticles through incubation in protein-containing media. Previous studies have reported the formation of a protein corona around nanoparticles (18,26,27). However, to the best of our knowledge, the effect of the protein corona on the labeling efficacy of stem cells has not yet been investigated.
Ferumoxytol (Feraheme) is an USPIO and a U.S. Food and Drug Administration–approved iron supplement (11) that exerts strong signal effects on MR images (13,28) and can thus be applied “off-label” for cell labeling and cell tracking purposes in patients. However, owing to their small size, ferumoxytol nanoparticles have a reported low cellular uptake and require transfection agent–assisted protocols for cell labeling (12,13). Our data showed that the formation of a protein corona could facilitate ferumoxytol uptake by human stem cells. Previous investigators reported the formation of a protein corona around nanoparticles after interaction with protein-containing fluids (18,29,30). The protein corona increased the nanoparticles’ surface charge and hydrodynamic size (19,20), which led to increased cellular uptake through endocytosis or phagocytosis (21–23). Accordingly, the larger size and reduced ζ potential of our protein-coated ferumoxytol nanoparticles compared with bare nanoparticles in PBS might explain the observed increased lysosomal uptake of ferumoxytol into hMSCs. Furthermore, the protein corona layer could reduce the repulsive interactions between the cell membrane and nanoparticles (as the cell membrane has a net-negative charge). Our data showed that the formation of a protein corona increased the ζ potential of ferumoxytol nanoparticles from −37.03 mV ± 0.59 to −5.87 mV ± 0.45. Our team previously found that ferumoxides and ferucarbotran can label stem cells by simple incubation through endocytosis or phagocytosis (3,6). Both of these agents are larger than ferumoxytol, and, in addition, ferucarbotran has a negative ζ potential. Thus, although cationic transfection agents can improve cellular uptake, efficient labeling has been previously achieved with negatively charged nanoparticles.
In addition to the effects of size and surface charge, we found that the amount and type of proteins in the labeling media could alter the composition of the corona and stem cell labeling efficacy. An observed higher uptake of ferumoxytol by hMSCs in HS-containing media compared with that in FBS-containing or StemPro media could be due to the higher surface charge of HS (−5.87 mV ± 0.45) compared with both FBS (−6.87 mV ± 0.24) and StemPro (−9.42 mV ± 0.85). A higher surface charge causes lower repulsive electrostatic interactions between cell membranes and nanoparticles (31), thereby improving lysosomal uptake (31).
A recent report suggested that C3 apolipoproteins in the protein corona significantly decrease and hydrogen 1 (1H) apolipoproteins in the protein corona significantly increase the cellular uptake of nanoparticles (21). We found the opposite: hMSCs incubated with HS-containing media demonstrated increased C3 apolipoproteins, decreased 1H apolipoproteins, and increased nanoparticle uptake compared with hMSCs incubated with StemPro. The observed discrepancy could be due to the cell vision effect—that is, a cellular response to nanoparticles related to detoxification strategies in response to nanoparticles (32)—as different cell types have different cell receptors on their surfaces and use different pathways to respond to nanoparticles (33). Another reason could be overriding effects of other proteins and protein conformation in the corona composition, as different nanoparticles were used in these studies.
Other investigators (34) have previously reported a significantly reduced uptake of corona-coated nanoparticles into cells compared with incubation with bare nanoparticles. The observed discrepancy could be due to different exposure environments, which affect the nanoparticle uptake amount and intracellular location.
For cell transfection, nanoparticles are incubated with transfection agents in serum-free media to avoid interference of proteins with the formation of nanoparticle–transfection agent complexes (12,13). Labeling of stem cells with nanoparticles in serum-free media beyond 4 hours is not possible because serum-deprived cells develop apoptosis (35). By using classic transfection protocols, the association of the nanoparticles with transfection agents in a first step prevents a corona formation in the second step, when serum is added. To our surprise, a simplification of the labeling protocol toward a one-step incubation of stem cells in protein-containing media without a transfection agent led to increased labeling efficiencies, which will facilitate clinical translations. Ferumoxytol could be added to any standard medium for expansion of allogeneic cell products, without any need to modify the cell culture process or wash the cells.
Because our ultimate goal is clinical translation, we focused on clinically applicable nanoparticles, which are negatively charged. Positively charged nanoparticles can produce more distinct disruption of the plasma membrane, greater mitochondrial and lysosomal impairment, and, importantly, are not clinically available to date (36). The main reason is that positively charged nanoparticles are covered by opsonin-based proteins in the blood, which are rapidly removed by the immune system (37).
Our team previously reported another clinically applicable approach for in vivo labeling of autologous bone marrow cells (28). After intravenous injection, ferumoxytol is taken up by hMSCs in the bone marrow. hMSCs harvested from a bone marrow aspirate can be tracked after transplantation into the same patient. By comparison, the approach described here can be applied to allogeneic cells, “off the shelf” hMSC products, and therapeutic cells that are expanded in cell culture for a long time.
Our results showed better hMSC labeling efficiencies after incubation of hMSCs in HS-containing labeling medium than after incubation in StemPro medium. For future clinical applications, we suggest using autologous (patient-derived) serum instead of commercially available HS to increase the patient’s safety. This labeling approach could be readily used to monitor ongoing phase II and III studies of novel cell therapeutic agents.
In conclusion, we developed a new, transfection agent–free stem cell labeling approach that takes advantage of the formation of a protein corona around ferumoxytol nanoparticles in protein-containing media. Protein corona–mediated cell labeling represents a new and readily clinically translatable method for labeling “off the shelf” cell products with ferumoxytol and will be applied for stem cell tracking in patients.
Advances in Knowledge
■ We developed a new, transfection agent–free labeling approach, which takes advantage of the formation of a protein corona layer around ferumoxytol nanoparticles in protein-containing media.
■ Human serum protein corona-mediated cell labeling enabled significantly higher ferumoxytol uptake by human mesenchymal stem cells than did transfection agent–mediated labeling techniques (P < .05).
SUPPLEMENTAL TABLES
SUPPLEMENTAL FIGURES
Acknowledgments
Acknowledgment
The data presented in the article were partly acquired on instruments in the Stanford School of Medicine Falk cardiovascular research center imaging facility. Part of this work was performed at the Stanford Nano Shared Facilities.
Received January 17, 2017; revision requested March 7; revision received July 6; accepted August 3; final version accepted August 23.
From the 2016 RSNA Annual Meeting.
This work was supported by National Institutes of Health grants 2R01AR054458 and R21AR066302 from the National Institute of Arthritis and Musculoskeletal and Skin Diseases. S.J.M. was supported by a Center for Cancer Nanotechnology Excellence and Translational Diagnostics grant funded by the National Cancer Institute–National Institutes of Health to Stanford University (U54CA199075).
H.N. and S.M.T. contributed equally to this work.
Disclosures of Conflicts of Interest: H.N. disclosed no relevant relationships. S.M.T. disclosed no relevant relationships. S.J.M. disclosed no relevant relationships. K.L. disclosed no relevant relationships. S.Z. disclosed no relevant relationships. P.Y. disclosed no relevant relationships. M.M. disclosed no relevant relationships. H.E.D. disclosed no relevant relationships.
Abbreviations:
- DAB
- 3,3ʹ;-diaminobenzidine
- DLS
- dynamic light scattering
- DMEM
- Dulbecco’s modified Eagle’s medium
- FBS
- fetal bovine serum
- hMSC
- human mesenchymal stem cell
- HS
- human serum
- LC
- liquid chromatography
- MS
- mass spectrometry
- NpSpC
- normalized percentage of spectral counts
- PBS
- phosphate-buffered saline
- SPIO
- superparamagnetic iron oxide nanoparticle
- USPIO
- ultrasmall SPIO
Contributor Information
Kai Li, Email: H.E.Daldrup-Link@stanford.edu.
Heike E. Daldrup-Link, Email: H.E.Daldrup-Link@stanford.edu.
References
- 1.Bartel RL. Stem cells and cell therapy: autologous cell manufacturing A2-Atala, Anthony. In: Allickson JG, ed. Translational regenerative medicine. Boston, Mass: Academic Press, 2015; 107–112. [Google Scholar]
- 2.Long CM, Bulte JW. In vivo tracking of cellular therapeutics using magnetic resonance imaging. Expert Opin Biol Ther 2009;9(3):293–306. [DOI] [PMC free article] [PubMed] [Google Scholar]
- 3.Henning TD, Wendland MF, Golovko D, et al. Relaxation effects of ferucarbotran-labeled mesenchymal stem cells at 1.5T and 3T: discrimination of viable from lysed cells. Magn Reson Med 2009;62(2):325–332. [DOI] [PMC free article] [PubMed] [Google Scholar]
- 4.Daldrup-Link HE, Nejadnik H. MR imaging of stem cell transplants in arthritic joints. J Stem Cell Res Ther 2014;4(2):165. [DOI] [PMC free article] [PubMed] [Google Scholar]
- 5.Nejadnik H, Henning TD, Castaneda RT, et al. Somatic differentiation and MR imaging of magnetically labeled human embryonic stem cells. Cell Transplant 2012;21(12):2555–2567. [DOI] [PubMed] [Google Scholar]
- 6.Henning TD, Gawande R, Tavri S, et al. Magnetic resonance imaging of ferumoxide-labeled mesenchymal stem cells in cartilage defects: in vitro and in vivo investigations. Mol Imaging 2012;11(3):197–209. [PMC free article] [PubMed] [Google Scholar]
- 7.Castaneda RT, Khurana A, Khan R, Daldrup-Link HE. Labeling stem cells with ferumoxytol, an FDA-approved iron oxide nanoparticle. J Vis Exp 2011;2011(57):e3482. [DOI] [PMC free article] [PubMed] [Google Scholar]
- 8.Daldrup-Link HE, Rudelius M, Oostendorp RA, et al. Targeting of hematopoietic progenitor cells with MR contrast agents. Radiology 2003;228(3):760–767. [DOI] [PubMed] [Google Scholar]
- 9.Daldrup-Link HE, Rudelius M, Piontek G, et al. Migration of iron oxide-labeled human hematopoietic progenitor cells in a mouse model: in vivo monitoring with 1.5-T MR imaging equipment. Radiology 2005;234(1):197–205. [DOI] [PubMed] [Google Scholar]
- 10.Sutton EJ, Henning TD, Boddington S, et al. In vivo magnetic resonance imaging and optical imaging comparison of viable and nonviable mesenchymal stem cells with a bifunctional label. Mol Imaging 2010;9(5):278–290. [PMC free article] [PubMed] [Google Scholar]
- 11.Lu M, Cohen MH, Rieves D, Pazdur R. FDA report: Ferumoxytol for intravenous iron therapy in adult patients with chronic kidney disease. Am J Hematol 2010;85(5):315–319. [DOI] [PubMed] [Google Scholar]
- 12.Thu MS, Bryant LH, Coppola T, et al. Self-assembling nanocomplexes by combining ferumoxytol, heparin and protamine for cell tracking by magnetic resonance imaging. Nat Med 2012;18(3):463–467. [DOI] [PMC free article] [PubMed] [Google Scholar]
- 13.Khurana A, Nejadnik H, Chapelin F, et al. Ferumoxytol: a new, clinically applicable label for stem-cell tracking in arthritic joints with MRI. Nanomedicine (Lond) 2013;8(12):1969–1983. [DOI] [PMC free article] [PubMed] [Google Scholar]
- 14.Montet-Abou K, Montet X, Weissleder R, Josephson L. Cell internalization of magnetic nanoparticles using transfection agents. Mol Imaging 2007;6(1):1–9. [PubMed] [Google Scholar]
- 15.Montet-Abou K, Montet X, Weissleder R, Josephson L. Transfection agent induced nanoparticle cell loading. Mol Imaging 2005;4(3):165–171. [DOI] [PubMed] [Google Scholar]
- 16.Fu Y, Kraitchman DL. Stem cell labeling for noninvasive delivery and tracking in cardiovascular regenerative therapy. Expert Rev Cardiovasc Ther 2010;8(8):1149–1160. [DOI] [PMC free article] [PubMed] [Google Scholar]
- 17.Soenen SJ, De Smedt SC, Braeckmans K. Limitations and caveats of magnetic cell labeling using transfection agent complexed iron oxide nanoparticles. Contrast Media Mol Imaging 2012;7(2):140–152. [DOI] [PubMed] [Google Scholar]
- 18.Tenzer S, Docter D, Kuharev J, et al. Rapid formation of plasma protein corona critically affects nanoparticle pathophysiology. Nat Nanotechnol 2013;8(10):772–781. [DOI] [PubMed] [Google Scholar]
- 19.Hühn D, Kantner K, Geidel C, et al. Polymer-coated nanoparticles interacting with proteins and cells: focusing on the sign of the net charge. ACS Nano 2013;7(4):3253–3263. [DOI] [PubMed] [Google Scholar]
- 20.Röcker C, Pötzl M, Zhang F, Parak WJ, Nienhaus GU. A quantitative fluorescence study of protein monolayer formation on colloidal nanoparticles. Nat Nanotechnol 2009;4(9):577–580. [DOI] [PubMed] [Google Scholar]
- 21.Ritz S, Schöttler S, Kotman N, et al. Protein corona of nanoparticles: distinct proteins regulate the cellular uptake. Biomacromolecules 2015;16(4):1311–1321. [DOI] [PubMed] [Google Scholar]
- 22.Kim JA, Salvati A, Åberg C, Dawson KA. Suppression of nanoparticle cytotoxicity approaching in vivo serum concentrations: limitations of in vitro testing for nanosafety. Nanoscale 2014;6(23):14180–14184. [DOI] [PubMed] [Google Scholar]
- 23.Fleischer CC, Payne CK. Nanoparticle-cell interactions: molecular structure of the protein corona and cellular outcomes. Acc Chem Res 2014;47(8):2651–2659. [DOI] [PMC free article] [PubMed] [Google Scholar]
- 24.Simon GH, von Vopelius-Feldt J, Fu Y, et al. Ultrasmall supraparamagnetic iron oxide-enhanced magnetic resonance imaging of antigen-induced arthritis: a comparative study between SHU 555 C, ferumoxtran-10, and ferumoxytol. Invest Radiol 2006;41(1):45–51. [DOI] [PubMed] [Google Scholar]
- 25.Monopoli MP, Walczyk D, Campbell A, et al. Physical-chemical aspects of protein corona: relevance to in vitro and in vivo biological impacts of nanoparticles. J Am Chem Soc 2011;133(8):2525–2534. [DOI] [PubMed] [Google Scholar]
- 26.Lundqvist M, Stigler J, Elia G, Lynch I, Cedervall T, Dawson KA. Nanoparticle size and surface properties determine the protein corona with possible implications for biological impacts. Proc Natl Acad Sci U S A 2008;105(38):14265–14270. [DOI] [PMC free article] [PubMed] [Google Scholar]
- 27.Kah JC, Chen J, Zubieta A, Hamad-Schifferli K. Exploiting the protein corona around gold nanorods for loading and triggered release. ACS Nano 2012;6(8):6730–6740. [DOI] [PubMed] [Google Scholar]
- 28.Khurana A, Chapelin F, Beck G, et al. Iron administration before stem cell harvest enables MR imaging tracking after transplantation. Radiology 2013;269(1):186–197. [DOI] [PMC free article] [PubMed] [Google Scholar]
- 29.Walczyk D, Bombelli FB, Monopoli MP, Lynch I, Dawson KA. What the cell “sees” in bionanoscience. J Am Chem Soc 2010;132(16):5761–5768. [DOI] [PubMed] [Google Scholar]
- 30.Cedervall T, Lynch I, Lindman S, et al. Understanding the nanoparticle-protein corona using methods to quantify exchange rates and affinities of proteins for nanoparticles. Proc Natl Acad Sci U S A 2007;104(7):2050–2055. [DOI] [PMC free article] [PubMed] [Google Scholar]
- 31.Nel AE, Mädler L, Velegol D, et al. Understanding biophysicochemical interactions at the nano-bio interface. Nat Mater 2009;8(7):543–557. [DOI] [PubMed] [Google Scholar]
- 32.Mahmoudi M, Saeedi-Eslami SN, Shokrgozar MA, et al. Cell “vision”: complementary factor of protein corona in nanotoxicology. Nanoscale 2012;4(17):5461–5468. [DOI] [PubMed] [Google Scholar]
- 33.Laurent S, Burtea C, Thirifays C, Häfeli UO, Mahmoudi M. Crucial ignored parameters on nanotoxicology: the importance of toxicity assay modifications and “cell vision”. PLoS One 2012;7(1):e29997. [DOI] [PMC free article] [PubMed] [Google Scholar]
- 34.Lesniak A, Fenaroli F, Monopoli MP, Åberg C, Dawson KA, Salvati A. Effects of the presence or absence of a protein corona on silica nanoparticle uptake and impact on cells. ACS Nano 2012;6(7):5845–5857. [DOI] [PubMed] [Google Scholar]
- 35.Zhu W, Chen J, Cong X, Hu S, Chen X. Hypoxia and serum deprivation-induced apoptosis in mesenchymal stem cells. Stem Cells 2006;24(2):416–425. [DOI] [PubMed] [Google Scholar]
- 36.Panariti A, Miserocchi G, Rivolta I. The effect of nanoparticle uptake on cellular behavior: disrupting or enabling functions? Nanotechnol Sci Appl 2012;5:87–100. [DOI] [PMC free article] [PubMed] [Google Scholar]
- 37.Aggarwal P, Hall JB, McLeland CB, Dobrovolskaia MA, McNeil SE. Nanoparticle interaction with plasma proteins as it relates to particle biodistribution, biocompatibility and therapeutic efficacy. Adv Drug Deliv Rev 2009;61(6):428–437. [DOI] [PMC free article] [PubMed] [Google Scholar]
Associated Data
This section collects any data citations, data availability statements, or supplementary materials included in this article.


