

SUMMARY
A permissive chromatin environment coupled to hypertranscription drives the rapid proliferation of embryonic stem cells (ESCs) and peri-implantation embryos. We carried out a genome-wide screen to systematically dissect the regulation of the euchromatic state of ESCs. The results revealed that cellular growth pathways, most prominently translation, perpetuate the euchromatic state and hypertranscription of ESCs. Acute inhibition of translation rapidly depletes euchromatic marks in mouse ESCs and blastocysts, concurrent with delocalization of RNA polymerase II and reduction in nascent transcription. Translation inhibition promotes rewiring of chromatin accessibility, which decreases at a subset of active developmental enhancers and increases at histone genes and transposable elements. Proteome-scale analyses revealed that several euchromatin regulators are unstable proteins and continuously depend on a high translational output. We propose that this mechanistic interdependence of euchromatin, transcription and translation sets the pace of proliferation at peri-implantation and may be employed by other stem/progenitor cells.
eTOC blurb
Miguel Ramalho-Santos and colleagues show that the transcriptionally permissive chromatin landscapes in mouse embryonic stem cells and blastocysts are acutely sensitive to variations in translational output. This positive feedback loop between permissive chromatin and translation, in turn, may set the rapid pace of growth during early embryonic development.
INTRODUCTION
Stem and progenitor cells often display a distinct chromatin landscape associated with high levels of transcriptional activity (Gaspar-Maia et al., 2011; Percharde et al., 2017a). This chromatin state has been extensively studied in embryonic stem cells (ESCs) cultured in serum, which represent the rapidly proliferating pluripotent cells of the peri-implantation embryo (Smith, 2017). ESCs and pluripotent cells of the blastocyst display a remarkably decondensed chromatin pattern with low levels of compact heterochromatin (Ahmed et al., 2010; Efroni et al., 2008) and high levels of histone marks associated with transcriptional activity, such as H3/H4 acetylation and H3K4me3 (Ang et al., 2011; Lee et al., 2004). In agreement, ESCs are in a state of hypertranscription (Percharde et al., 2017a) that includes global elevation of nascent transcriptional output (Efroni et al., 2008).
Several factors have been implicated in the regulation of the permissive chromatin state of ESCs, including the histone acetyltransferases Tip60/p400 (Fazzio et al., 2008) and Mof (X. Li et al., 2012), the trithorax group protein Ash2l (Wan et al., 2013) and the ATP-dependent chromatin remodelers Ino80 (Wang et al., 2014) and Chd1 (Gaspar-Maia et al., 2009; Guzman-Ayala et al., 2014). We have shown that Chd1 binds broadly to the transcribed portion of the genome and promotes hypertranscription by both RNA Polymerases I and II in ESCs (Gaspar-Maia et al., 2009; Guzman-Ayala et al., 2014). This Chd1-driven state of elevated transcription is essential for growth of pluripotent epiblast cells of the mouse embryo at the time of implantation (Guzman-Ayala et al., 2014) and of hematopoietic stem/progenitor cells emerging from the endothelium at mid-gestation (Koh et al., 2015). These data indicate that a permissive chromatin associated with global hypertranscription is required for developmental transitions that involve rapid proliferation of stem/progenitor cells. While ESC chromatin has been the subject of many studies, the regulation of their permissive, hypertranscribing chromatin state has not been dissected on a genome-wide scale. Moreover, a key question remains to be answered: how is hypertranscription set to the needs of rapidly proliferating pluripotent stem cells? In other words, how do pluripotent stem cells, such as ESCs, sense when not enough or too much transcription is occurring, and adjust their chromatin state accordingly?
We report here a genome-wide RNAi screen to systematically probe the permissive chromatin state of ESCs. Integrated analyses at the functional, chromatin, transcriptional and proteome level reveal that the growth capacity of ESCs, specifically the translational output, directly promotes a permissive chromatin environment, at least in part by maintaining the levels of unstable euchromatin regulators. The results reveal a dynamic positive feedback loop between permissive chromatin and translation that drives proliferation of pluripotent cells and may be tuned by signaling and availability of nutrients.
RESULTS
A genome-wide RNAi screen identifies new regulators of euchromatin in ESCs
We sought to generate a live-cell reporter for euchromatin that would allow dissection of the dynamics and regulation of the euchromatic state of ESCs. The histone mark H3K4me3 is associated with active transcription, is directly and specifically bound by the double chromodomains of Chd1 (Flanagan et al., 2005) and is present at high levels in undifferentiated ESCs (Ang et al., 2011). We therefore generated mouse ESCs expressing a fusion between the Chd1 chromodomains and EGFP (referred to as Chd1chr-EGFP). As a control, we used ESCs expressing an Hp1α-EGFP fusion protein (Bulut-Karslioglu et al., 2014), which recognizes H3K9me3, a mark of constitutive heterochromatin. As anticipated, fluorescence in Chd1chr-EGFP ESCs displays a diffuse nuclear pattern, whereas it is restricted to DAPI-dense heterochromatin in Hp1α-EGFP ESCs (Figure S1A). Moreover, Chd1chr-EGFP signal positively correlates with endogenous Chd1 expression, H3K4me3 levels and nascent transcription (Figure S1B).
To assess whether the Chd1chr-EGFP reporter responds to manipulations of the chromatin state, we first knocked down Wdr5, a core component of MLL complexes that deposit H3K4me3 (Ang et al., 2011). Wdr5 knock-down completely depletes H3K4me3 levels and leads to a specific decrease in Chd1chr-EGFP reporter intensity within 3 days, with the Hp1α-EGFP reporter remaining unaffected (Figure S1C, D). Similarly, we observed a rapid decrease in Chd1chr-EGFP intensity along with reduced H3K4me3 levels upon retinoic acid (RA)-mediated differentiation of ESCs for 2 days, prior to any detectable changes in the activity of the Hp1α-EGFP reporter (Figure S1E, F). Taken together, these results indicate that the Chd1chr-EGFP reporter responds as expected to perturbations of the euchromatic landscape of ESCs.
To uncover regulators of the euchromatic state of ESCs, we next used the Chd1chr-EGFP ESCs to perform a genome-wide RNAi screen (Figure 1A). ESCs were infected with an ultra-complex lentiviral shRNA library comprised of ~30 shRNAs per gene. Cells were cultured for 3 days in serum/leukemia inhibitory factor (LIF) medium and subsequently sorted into GFPlow and GFPhigh populations by flow cytometry. Integrated shRNAs were isolated, amplified and sequenced. Differential enrichments in shRNAs per gene recovered from the GFPlow and GFPhigh populations were used to estimate effect size, using HiTSelect (Diaz et al., 2015) (see STAR methods for details). We previously used a similar approach to systematically identify barriers to human iPS cell generation (Qin et al., 2014). Applying this method at a 5% false discovery rate (FDR) cutoff, we identified 461 genes whose knockdown is associated with lower Chd1chr-EGFP fluorescence (Figure 1B and Table S1). These genes are thus putative positive regulators of the euchromatic state of ESCs. In validation of the screen, this set of genes includes several previously described regulators of ESC chromatin, including Chd1 itself (Gaspar-Maia et al., 2009), Tip60/Kat5, p400 (Fazzio et al., 2008) and Mll4/Kmt2b (Denissov et al., 2014). Several other known euchromatin regulators, including Hira (Meshorer et al., 2006), Ino80 (Wang et al., 2014) and Hat1 (Nagarajan et al., 2013), are enriched at FDR<7.5% (Figure 1B).
Figure 1. A genome-wide RNAi screen identifies regulators of euchromatin in ESCs.

(A) RNAi screen workflow. (B) Results of the RNAi screen for the genes with shRNAs enriched in the GFPlow fraction. Each circle denotes a gene tested in the screen. Published regulators of open chromatin in ESCs are indicated by arrows. See Table S1 for the full screen results. (C) Gene ontology (GO) terms associated with significant RNAi screen hits. See Table S2 for the full list of GO terms. (D) Protein interaction network of significant RNAi screen hits, generated using STRING. (E) Secondary siRNA screen results. Genes were selected to represent each of the major pathways enriched in (C) and (D). Upper panel shows knockdown levels by qRT-PCR, normalized to scrambled siRNA control. Lower panel shows fluorescence level of the Chd1chr-EGFP reporter upon each knockdown. Readouts for both assays were measured on day 3 post-knockdown (red) or on day 2 (blue) if the knockdown was lethal by day 3. See STAR methods and Table S3 for details. Error bars show mean ± standard deviation (SD) of 4 technical replicates. Graph is representative of 2 biological replicates. Statistical test performed is two-tailed t-test. *, p<0.05; **, p<0.01; ***, p<0.001; ****, p<0.0001.
To further refine the RNAi screen hits, we selected genes with robust RNA expression levels in ESCs (>1 FPKM in serum/LIF, (Bulut-Karslioglu et al., 2016)). The resulting 303 genes were clustered according to functional annotations (Gene Ontology, GO) and protein interaction data (Figure 1C and D, Table S2). As expected, regulation of transcription and chromatin emerge as key processes modulating ESC euchromatin. Intriguingly, many factors involved in cellular growth and protein synthesis, notably RNA Polymerase (Pol) I complex components, ribosomal proteins and translation factors, are significantly enriched within screen hits. mTor, a key nutrient sensor and positive regulator of translation (Laplante and Sabatini, 2012), is the top hit in the screen (Table S1). Validation of the RNAi screen was carried out by independent single gene knockdowns, using siRNAs that differ in sequence from the shRNAs used in the original screen. Importantly, knockdown of individual genes involved in translation and growth leads to significant decreases in Chd1chr-EGFP reporter intensity within 2–3 days, and in some cases the effect is stronger than loss of individual chromatin regulators (Figure 1E). These results suggest that translation and growth positively regulate euchromatin in ESCs.
Translation, mTor and Myc activities promote euchromatin in ESCs
We sought to expand upon the RNAi screen results using small molecule inhibitors of several growth-associated processes (Figure 2A). We found that inhibition of protein synthesis, mTor activity or Myc/Max complex activity leads to a rapid decrease in Chd1chr-EGFP fluorescence within 3 hours, while fluorescence of the Hp1α-EGFP reporter and an EGFP-only control remain unaltered during this acute time frame (Figure 2B and S2A). Activity of the Chd1chr-EGFP reporter closely follows the extent of translation inhibition as a result of each inhibitor treatment (Figure 2C and S2B). Chd1chr-EGFP fluorescence partially recovers by 24h of continuous inhibition, possibly due to a cellular adaptation to a lower growth state (Figure S2C). In contrast, inhibition of RNA Pol I or Pol II activity has no discernible effect on Chd1chr-EGFP fluorescence until 24h of treatment (Figure S2D). Chd1chr-EGFP signal recovers after release from translation inhibition, with no impact on cell survival (Figure 2D and S2E). Co-treatment with the proteasome inhibitor MG132 partially rescues the decrease in Chd1chr-EGFP intensity induced by CHX, indicating that the Chd1chr-EGFP fusion protein itself may undergo partial turnover within this timeframe (Figure 2E, S2F). In contrast, Chd1chr-EGFP mRNA and chromatin-bound protein levels are only mildly affected after 3h of CHX treatment (Figure S2G, H). Taken together, the results suggest that the decrease in overall Chd1chr-EGFP fluorescence upon translation inhibition may be due to a combination of delocalization of the reporter protein within and away from the chromatin compartment, as well as protein turnover. Similar responses of the Chd1chr-EGFP reporter are observed in ESCs cultured in the presence of Gsk3 and Mek/Erk inhibitors (2i) (Figure S3), a condition that mimics the ground state of pluripotency (Ying et al., 2008). Thus, the Chd1chr-EGFP construct is a sensitive reporter that integrates the high levels of euchromatin, nascent transcription and nascent translation that characterize the undifferentiated state of ESCs. Given the higher levels of nascent transcription, steady-state RNAs (Bulut-Karslioglu et al., 2016) and Chd1chr-EGFP fluorescence in serum/LIF relative to 2i/LIF (Figure S3A), we focused on the acute impact of reduced translation on the chromatin state and transcription of ESCs in serum/LIF for the remainder of this study.
Figure 2. Translation, mTor and Myc dynamically regulate euchromatin reporter activity.

(A) Schematic of small molecule-mediated inhibition. (B) Response of the Chd1chr-EGFP, Hp1α-EGFP and control EGFP ESCs to inhibition of translation, mTor, or Myc/Max at the indicated doses for 3 hours. Cells were treated with DMSO as control. Graphs show mean ± SD of median fluorescence intensity (MFI) normalized to control cells of at least 3 technical replicates and are representative of 2 biological replicates. Statistical significance was determined by a two-tailed Student’s t-test. (C) Levels of nascent protein synthesis in wild-type ESCs assessed by L-homopropargylglycine (HPG) incorporation during 3h inhibition of translation, mTor or Myc at the indicated doses. MFI was normalized to no-HPG controls and represented as a fraction of control (DMSO-treated) cells for each experiment. Each point represents a biological replicate. Error bars show mean ± SD. (D) Recovery of Chd1chr-EGFP reporter fluorescence following CHX (100 ng/ml) removal. Graph depicts mean ± SD of MFI of 4 technical replicates and is representative of 2 biological replicates. (E) Proteasome inhibition partially rescues the effect of CHX on Chd1chr-EGFP intensity. Chd1chr-EGFP reporter ESCs were treated with DMSO or CHX ± MG132 (proteasome inhibitor) for 3h at the indicated doses. Fluorescence is reported as above. Graph depicts mean ± SD of MFI of 3 biological replicates. Statistical significance was determined by Student’s unpaired t-test. *, p<0.05; **, p<0.01; ***, p<0.001; ****, p<0.0001.
Euchromatic histone marks are rapidly depleted upon inhibition of translation
We next explored the dependency of euchromatin on translation in a reporter-free system, using wild-type ESCs. Notably, inhibition of translation using CHX for 3h leads to a reduction in the levels of histone marks associated with active promoters and enhancers, such as H3K4me3 and H3/H4 acetylation, without affecting overall histone H3 levels or repressive H3K9me2 (Figure 3A and S4A). We confirmed the global reduction in acetylated H4 by immunofluorescence and intracellular flow cytometry (Figure 3B and S4B). Pluripotent cells in the ICM of the E4.5 blastocyst respond similarly to a 3h inhibition of translation, with rapid reductions in H4K16ac and H3K4me3 (Figure 3C and S4C). H3K36me2 levels rise with increasing concentrations of CHX in a manner anti-correlated with H3/H4 acetylation (Figure 3A and S4A), in agreement with the observation that H3K36me2 recruits histone deacetylases to prevent spurious transcription (B. Li et al., 2009).
Figure 3. Inhibition of translation rapidly induces depletion of euchromatin marks in ESCs and blastocysts.

(A) Levels of indicated histone modifications upon 3 hours of CHX treatment at 0.1, 1 or 10μg/ml. See Figure S4A for biological replicates and quantifications. (B) Immunofluorescent detection and quantification of H4 acetylation (H4 K5/8/12) in DMSO- or CHX-treated ESCs. (C) Immunofluorescent detection of H4K16ac in control or CHX-treated (3 hours) E4.5 blastocysts and quantification in each Oct4+ cell (right panel). A representative z-section of each embryo is shown. (D) Correlation of CHX-induced H4K16ac changes with quartile of gene expression in ESCs (Bulut-Karslioglu et al., 2016). Profiles depict ChIP-seq tag density over annotated TSSs extended 2.5 kb upstream and downstream (3 hours CHX, 1 μg/ml). (E) Representative genome browser view depicting H4K16ac in DMSO- or CHX-treated cells over the ribosomal protein gene Rpl8. (F) ChIP-qPCR documenting a dose-dependent response of H4K16ac following 3 hours of CHX. Error bars show mean ± SD of 3 technical replicates. Scale bars denote 50 μm. Statistical tests are two-tailed t-tests with Welch’s correction. **, p<0.01; ****, p<0.0001.
Serum starvation, which is known to reduce translational output and mTor activity, also leads to a decrease in H3K4me3 and H3K27ac within 3–6 hours (Figure S4D). Direct mTor inhibition in ESCs and blastocysts using INK128 also leads to dynamic changes in histone acetylation within 3 hours. H3K27ac and H3K9ac levels acutely decrease upon mTor inhibition (Figure S4E, F). Although there can be specific differences in the responses between ESCs and ICM cells as well as between distinct manipulations, the overall response indicates that the euchromatic compartment is acutely sensitive to perturbations of translational output in pluripotent cells.
The analyses above indicate that histone acetylation is particularly sensitive to CHX and mTor inhibition. To gain insight into the genome-wide impact of inhibition of translation on histone acetylation, we performed ChIP-seq for H4K16ac after 3h of CHX treatment (Figure 3D–F and S4G, H). As previously described (X. Li et al., 2012), H4K16ac is concentrated around the TSSs of active genes and correlates well with expression levels (Figure 3D). We found that genes highly transcribed in ESCs undergo the strongest reductions in H4K16ac levels, especially in the region immediately upstream of the TSS (Figure 3D). Ribosomal protein genes are particularly affected (Figure 3E and S4H). ChIP-qPCR confirmed these findings as well as the dose response of H4K16ac levels to the concentration of CHX, initially observed by western blot (Figure 3A, F). In contrast, H3K4me3 is only slightly reduced at TSSs upon CHX treatment (Figure S4F). Thus, H4K16 acetylation at highly transcribed genes is acutely tuned to the levels of translational output in ESCs.
Translational output positively feeds back into nascent transcription
The results above led us to ask whether acute inhibition of translation impacts nascent transcription. Remarkably, 3h inhibition of translation results in a ~60% decrease in global nascent transcription, assessed by measuring incorporation of the ribonucleotide analog 5-ethynyl uridine (EU) (Figure 4A). Nascent transcription of both Pol II-transcribed mRNA and Pol I-transcribed rRNA transcripts is ~90% decreased upon treatment with CHX for 3h (Figure 4B). Steady-state levels of the same mRNA and rRNA transcripts remain relatively stable within this time frame (Figure 4C). Thus, inhibition of translation, a manipulation often used to study protein stability and turnover, has an unexpected and rapid impact on nascent transcription in ESCs.
Figure 4. Nascent transcription is acutely sensitive to inhibition of translation in pluripotent cells.

(A) Levels of global nascent RNA synthesis assessed by EU incorporation in DMSO- or CHX-treated (3 hours) ESCs. MFI was normalized to no-EU controls for each experiment. Each point represents a biological replicate. (B) Nascent RNA capture followed by qRT-PCR in DMSO- or CHX-treated cells. Error bars show mean ± SD of 3 biological replicates. (C) Steady-state mRNA levels of genes shown in (B) in DMSO- and CHX-treated cells. No statistically significant differences were detected by Student’s t-tests with the Holm multiple comparisons correction. (D) Enrichment of total or elongating (S2p, lower panel) RNA Pol II at TSSs and gene bodies (GB) of selected genes in DMSO- or CHX-treated cells. Graph depicts mean ± SD of 3 technical replicates and is representative of 2 biological replicates. (E) Levels of nascent RNA synthesis assessed by EU incorporation in DMSO- or CHX-treated (3 hours) E4.5 blastocysts. A representative z-section of each embryo is shown. Scale bar denotes 50 μm. Right panel shows quantification of the EU signal in the ICM (indicated by white dotted lines). (F) Levels of elongating Pol II S2p in DMSO- or CHX-treated (3 hours) E4.5 blastocysts. Bottom panel shows quantification of the Pol II S2p signal in each Oct4+ cell. Statistical tests are two-tailed t-tests with Welch’s correction when applicable. *, p<0.05; **, p<0.01; ***, p<0.001; ****, p<0.0001.
A reduction in nascent transcription could be due to increased pausing of RNA Pol II at the TSS or decreased occupancy at the TSS or along the gene body. ChIP-qPCR for total or elongating (S2p) RNA Pol II revealed that inhibition of translation leads to an overall decrease in polymerase occupancy at the TSS and gene body of highly expressed genes but not to increased promoter pausing (Figure 4D). We conclude that the decrease in nascent transcription is due to diminished recruitment or retention of RNA Pol II, which may be due to turnover of RNA Pol II subunits or of some of its recruiters/activators (see below). Similar to ESCs, pluripotent cells of the blastocyst display significant decreases in nascent transcription (Figure 4E) and elongating RNA Pol II levels (Figure 4F) upon 3h inhibition of translation. Taken together, our data document that acute inhibition of translation not only alters the euchromatin landscape but also leads to a strong repression of nascent transcription in pluripotent cells.
The permissive chromatin state of undifferentiated ESCs is particularly sensitive to acute inhibition of translation
The remarkably strong reduction in nascent transcription in ESCs upon inhibition of translation led us to further probe the status of pluripotency and differentiation markers. Oct4 and Nanog protein levels are reduced upon 3h CHX treatment (Figure S5A, B), in agreement with the reported instability of these proteins (Buckley et al., 2012). However, a time-course analysis revealed that Oct4 and Nanog protein levels recover rapidly, within 1 hour after CHX withdrawal, in a pattern that closely resembles H4K16ac levels (Figure S5A, B) and Chd1chr-EGFP intensity (Figure 2D, S5B). Importantly, the steady-state mRNA levels of pluripotency factors and lineage commitment markers are not significantly changed upon 3h CHX (Figure S5C). Acute CHX treatment does not alter the ability of ESCs to differentiate into Embryoid Bodies (EBs), as EBs derived from DMSO- or CHX-treated cells show similar down-regulation of pluripotency markers and up-regulation of lineage markers (Figure S5D). Moreover, we have previously documented that long-term inhibition of mTor in ESCs and blastocysts is compatible with pluripotency (Bulut-Karslioglu et al., 2016). Taken together, these results suggest that acute inhibition of translation has a profound impact on euchromatin and nascent transcription in ESCs but does not impair their developmental potential.
We next compared ESCs with non-pluripotent cells to assess the relative sensitivity of euchromatin and nascent transcription to translation inhibition across different cell types. We analyzed the levels of histone marks and nascent transcription as before in the following cell types: i) ESCs removed from LIF and treated with RA to induce differentiation for 3 days, ii) primary mouse embryonic fibroblasts (MEFs) derived from E12.5 embryos, and iii) multipotent neural stem/progenitor cells (NSPCs) isolated from the E12.5 mouse cortex (Hudlebusch et al., 2011). While ESCs rapidly deplete euchromatin marks and sharply reduce nascent transcription within 3 hours of CHX treatment (Figure 3A, 4A, S4A, S5E), these other cell types are overall less sensitive, with the exception of consistent reductions in H3K27ac (Figure S5E–G). Relative to ESCs, these other cell types have lower levels of basal nascent transcription, which displays a muted response to translation inhibition (Figure S5E–G). These results are in agreement with our observation that ESCs cultured in serum/LIF are hypertranscribing relative to a panel of multiple cell lines and tissues tested (Percharde et al., 2017b). We conclude that, while the response observed is not strictly specific to ESCs, their permissive, hypertranscribing chromatin state is particularly sensitive to acute inhibition of translation.
Several key euchromatin regulators are unstable proteins
The sensitivity of euchromatin to reductions in translational output in pluripotent cells, and the partial rescue of Chd1chr-EGFP reporter levels observed upon proteasome inhibition (Figure 2G), led us to hypothesize that key euchromatin regulators may be unstable proteins that require continuous synthesis. To test this, we quantitatively assessed proteome-wide changes in ESCs after inhibition of translation using stable isotope labeling with amino acids in cell culture followed by mass spectrometry (SILAC-MS). We used a full block of translation (35 μg/mL of CHX) for either 1h or 3h to define the set of unstable proteins in ESCs (Figure 5A). We identified 4,078 unique proteins that were consistently depleted or enriched in the proteome at both time points of CHX treatment (Figure 5B and Table S4). Cell cycle factors are over-represented in the depleted proteins, a finding that is expected given that cell cycle progression is predominantly regulated by short-lived proteins (Table S5). Indeed, 3h inhibition of translation in ESCs moderately reduces the proportion of cells in S phase, with a concomitant increase in G0/G1 (Figure S6A, B). Fractionation of live cells in different stages of the cell cycle using a FUCCI reporter system (Nora et al., 2017) revealed that the impact of inhibition of translation on chromatin and transcription is observed throughout the cycle, although it is particularly evident in S/G2/M (Figure S6C–E). Regulators of chromatin, transcription and stem cell maintenance are also over-represented in the set of proteins rapidly depleted upon inhibition of translation (Figure 5B and Table S5). Overall, these results are in agreement with protein turnover data from S. cerevisiae and mouse fibroblasts, where cell cycle and transcription factors were found to be preferentially unstable (Belle et al., 2006; Schwanhäusser et al., 2011). Interestingly, a block in translation leads to a relative enrichment in the proteome of proteins associated with translation and mRNA/rRNA processing (Figure 5B). The translation machinery is generally stable, and is potentially least affected by changes in protein synthesis rate (Schwanhäusser et al., 2011).
Figure 5. Key euchromatin regulators are unstable proteins that are rapidly depleted at the chromatin upon translation inhibition in ESCs.

(A) Schematic of SILAC-MS workflow. (B) Scatter plot for proteins detected by SILAC-MS following 1 or 3 hours of CHX treatment. CHX-enriched or -depleted proteins are shown in red or blue, respectively. Right panels show associated GO terms. (C) Venn diagram for the intersection of RNAi screen hits with unstable proteins as determined by SILAC-MS (blue set in B). 60 such genes were identified. (D) GO terms associated with the 60 overlapping genes in (C). (E) Western blots showing the abundance of indicated proteins in cellular fractions in DMSO- or CHX-treated (3 hours) cells. Left panel shows RNAi screen hits that are among the 60 proteins at the intersection shown in (C).
We next intersected the set of unstable proteins (Figure 5B, blue) with the RNAi screen hits (Figure 1B). This analysis yielded 60 proteins that are unstable euchromatin regulators (Figure 5C, D, Table S6). They include several known regulators of euchromatin and transcriptional activation in stem and progenitor cells, including Chd1 itself (Gaspar-Maia et al., 2009; Guzman-Ayala et al., 2014; Koh et al., 2015), the Tip60-p400 acetyltransferase complex (Fazzio et al., 2008), and the Brd1 component of the MOZ/MORF acetyltransferase complex (Mishima et al., 2011). We validated a representative subset of unstable proteins by western blotting after treatment with 3h CHX (Figure 5E). Interestingly, RNA Pol II is also selectively depleted from the chromatin fraction upon CHX treatment, in line with ChIP experiments (Figure 4D). In contrast, control proteins such as H3, Gapdh and β-actin, as well as the heterochromatin regulators Hp1α, Ezh2 and G9a, remain largely unchanged upon 3h CHX treatment. Thus, several key euchromatin regulators of ESCs are preferentially unstable proteins in situ, providing a mechanism for the acute dependence of permissive chromatin and hypertranscription on translation.
A reduction in translational output rapidly deactivates developmental enhancers and primes transposable elements
Our studies to this point documented that a reduction in transcriptional output rapidly decreases the levels of activating histone marks and RNA Pol II at the promoters of highly expressed genes (Figures 3D–F, 4D), with a concomitant reduction in their nascent transcription (Figure 4B). However, the set of acutely unstable proteins in ESCs identified by SILAC-MS includes many sequence-specific transcription factors and chromatin regulators that are known to bind enhancers as well as promoters (e.g., Klf5, Gbx2, Zic1, Tip60/p400, Chd1, RNA Pol II, several Mediator subunits; see Figure 5 and Table S4). These results suggested that enhancer elements might also be sensitive to rapid shifts in translational output. We therefore carried out Assay for Transposase Accessible Chromatin with high throughput sequencing (ATAC-seq) to determine whether and how the landscape of chromatin accessibility in ESCs responds to acute (3h) inhibition of translation (Figure S7A). We identified 454 regions that reproducibly lose accessibility and 734 regions that gain accessibility upon CHX treatment (Tables S7 and 8). Interestingly, most of these regions of differential accessibility are located 50–500 kb away from TSSs (Figure S7B).
Regions that become less accessible upon CHX treatment (CHX-lost) are associated with genes annotated with developmental functions (Figure 6A and Table S7). To probe the chromatin environment of CHX-lost regions, we analyzed published datasets (see STAR Methods). This analysis revealed that CHX-lost regions are active enhancers in wild-type ESCs (Calo and Wysocka, 2013), given their enrichment for DNase-hypersensitivity, H3K4me1, H3K27ac and p300 (Figure 6B). Thus, a subset of active enhancers associated with developmental functions in ESCs loses accessibility upon acute reduction in translational output. CHX-lost regions are highly enriched for DNA binding motifs of the transcription factors Klf4/5 and Zic1/3 (Figure 6B). Among those, Klf5 and Zic1 were detected at the protein level by SILAC-MS and are depleted upon 1h and 3h CHX treatment (Table S4). Klf4 has previously been shown to be an unstable protein (Chen et al., 2005). Therefore, reduced accessibility at active developmental enhancers upon inhibition of translation may be due to turnover of both euchromatin regulators and specific transcription factors with functions during development.
Figure 6. Inhibition of translation in ESCs induces reprogramming of chromatin accessibility at developmental enhancers, histone genes and transposable elements.

(A) Functional terms associated with regions with loss of chromatin accessibility, determined by ATAC-seq, upon CHX treatment for 3 hours. See Table S7 for the full list of terms. (B, C) Heatmaps for enrichment of indicated histone modifications, variants and DNase-accessible sites on CHX-lost (B) or CHX-gained (C) ATAC-seq peaks. See Key Resources Table for details on public datasets. Right panels show enriched DNA motifs. (E) Heatmaps showing levels of mappability of CHX-lost or CHX-gained ATAC-seq peaks. The CHX-gained heatmap is divided into three clusters to denote regions of distinct mappability. (F) Enrichment of repetitive elements over CHX-gained ATAC-seq peaks.
Regions that become more accessible upon CHX treatment (CHX-gained) are generally not associated with any gene or functional signature, with the exception of histone clusters (Figure S7C and Table S7). There is no significant accumulation of activating histone modifications on the majority of CHX-gained peaks. Rather, CHX-gained regions are embedded in domains of high levels of H3K9me3 (Figure 6C). We speculated that these regions might overlap genomic repeats. Indeed, CHX-gained peaks reside immediately upstream of long (~5kb) unmappable regions (Figure 6D). Moreover, ~50% and ~30% of CHX-gained peaks overlap with transposable elements (TEs) of the LINE1 and LTR families, respectively, and active subfamilies such as L1Md_T/F/A and IAP are particularly enriched (Figure 6E). Despite increased chromatin accessibility, the nascent expression of histone clusters and TEs is still suppressed upon CHX treatment, albeit to a lesser extent than mRNAs from non-repetitive genes (Figure S7D, E). The gains in chromatin accessibility upon acute inhibition of translation may be due to the fact that these regions are enriched for AA/AT dinucleotides, which tend to repel nucleosomes (Valouev et al., 2011), and are marked by H3.3 and (acetylated) H2A.Z, histone variants associated with nucleosome instability (Jin et al., 2009) (Figure 6C). Taken together, our results reveal that the open chromatin landscape of ESCs is rapidly reprogrammed upon partial inhibition of translation, with decreased accessibility at active enhancers associated with development and increased accessibility at histone genes and transposable elements.
DISCUSSION
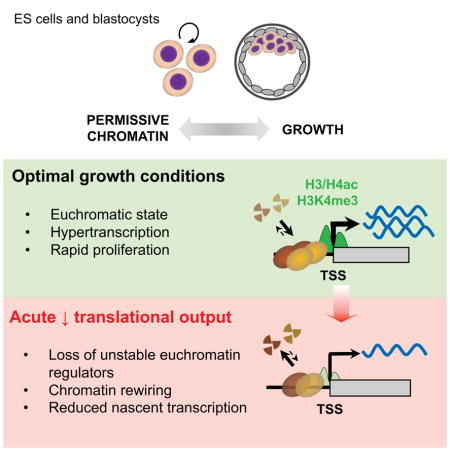
We report here that the transcriptionally permissive chromatin state of ESCs is acutely tuned to the levels of translational output. Our findings point to a positive feedback loop between chromatin and translation, whereby the permissive, hypertranscribing chromatin state in ESCs not only promotes an elevated translational output but also depends directly on such elevated translation (Figure 7A). We propose that this feedback loop, in turn, sets the rapid pace of proliferation in ESCs and of embryonic growth at peri-implantation.
Figure 7. Proposed model for the dynamic feedback between translation, chromatin and transcription in ESCs.

(A) The permissive chromatin state of ESCs promotes growth by sustaining hypertranscription and ribogenesis, whereas growth promotes the permissive chromatin state by sustaining high levels of translational output. Signaling and nutrient sensors such as mTor act as rheostats of this positive feedback loop. (B) The permissive chromatin state of ESCs responds rapidly to changes in translational output, in part due to the instability of euchromatin regulators. See Discussion for details.
Our results document a remarkably fast response of euchromatin and transcription to perturbations of translation output in ESCs, whereas heterochromatin and its regulators appear to be more stable overall (Figure 7B). Histone acetylation may be a key integrator of the status of translation and nutrient availability in this context, given the instability of components of histone acetyltransferase complexes such as Tip60, p400 or Brd1 (Figure 5E) and the fact that histone acetylation is directly dependent on the glycolytic state of undifferentiated ESCs (Moussaieff et al., 2015). Moreover, histone acetylation controls the highly dynamic nature of euchromatin, but not heterochromatin, in ESCs (Melcer et al., 2012). The intricate relationship between different histone modifications associated with transcription, notably histone acetylation and H3K4me3 (Crump et al., 2011), likely contributes to propagate the impact of altered translational output across various layers of regulation of chromatin activity.
Considering the profound changes in levels of activating histone marks and nascent transcription after 3 hours of inhibition of translation, it is interesting that the overall landscape of chromatin accessibility at promoters and gene bodies is largely unaffected. These results suggest that, on a short time scale, nucleosome occupancy in these regions is relatively resistant to changes in chemical modifications of histones and RNA Pol II activity. At distal regions, acute inhibition of translation in ESCs induces loss of chromatin accessibility at a subset of developmental enhancers and gain at repeats. The net effect may be to limit spurious differentiation and prime a return to the high level of expression of histone genes and repeat elements that is typical of proliferating ESCs (Efroni et al., 2008), once translational output is re-established. In addition, it is possible that reduced translational output primes the chromatin of conserved LINE1 and LTR elements for retrotransposition, potentially as a stress response. It will be interesting to determine to what extent ESCs that recover from inhibition of translation are distinct from normally growing ESCs, including with regards to chromatin accessibility and TE activity.
While our findings document that protein instability is a key tuner of the euchromatic state of hypertranscription in ESCs, other layers of regulation such as RNA stability, signaling or metabolism are expected to play important roles. It is also important to note that reductions in translational output can have effects not limited to chromatin and transcription, notably on the cell cycle. Within 3 hours of inhibition of translation, the proportion of ESCs in S phase is reduced, with an accumulation of cells in G0/G1 (Figure S6A, B). Nevertheless, for the levels of CHX used here the proportion of ESCs in S phase remains high (40–60%) and, importantly, nascent transcription and euchromatin marks are reduced upon inhibition of translation in both populations of G0/G1 and S/G2/M cells (Figure S6D, E). Interestingly, histone acetylation is required for efficient activation of replication origins during S phase (Unnikrishnan et al., 2010), and loss of histone acetylation drives yeast in nutrient-limiting conditions to enter quiescence (McKnight et al., 2015). In addition, the major H4K16 acetyltransferase MOF directly binds to and maintains the expression of genes required for cell cycle progression in proliferating mouse embryonic fibroblasts (Sheikh et al., 2016). Such links between euchromatic histone marks, transcription, translation, glycolysis and cell cycle may serve to coordinate overall biosynthesis with rapid proliferation in ESCs in vitro and epiblast cells in vivo.
The highly dynamic levels of euchromatin regulators may be due both to the reported inefficiency of translation in ESCs (Sampath et al., 2008) and to control by the ubiquitination and sumoylation pathways (Buckley et al., 2012; Vilchez et al., 2012). Several proteins with roles in these pathways are hits in the RNAi screen (Table S1). For example, Usp9x is a deubiquitinase required for early development (Pantaleon et al., 2001) and self-renewal of NSPCs (Jolly et al., 2009). Topors is an E3 SUMO/Ubiquitin ligase that targets chromatin modifiers (Pungaliya et al., 2007) and is itself unstable in ESCs (Figure 5E). These and other proteins may help coordinate an euchromatic/transcriptional response to perturbations in translational output via modification of chromatin factors. It will be of interest to dissect the role of the instability of specific euchromatin regulators such as Tip60/p400 or Chd1, as well as the function of ubiquitination/sumoylation factors such as Usp9x or Topors, in maintaining the permissive chromatin state of ESCs.
The positive feedback loop between permissive chromatin and translational output identified here may drive rapid proliferation of undifferentiated pluripotent cells, but it cannot be perpetuated indefinitely. In this regard, it is noteworthy that mTor is the top hit in the RNAi screen (Table S1). mTor may directly regulate permissive chromatin and hypertranscription, given its role in promoting histone hyperacetylation at the nucleolus and high levels of ribosomal RNA transcription (Tsang et al., 2003). Moreover, it was the identification of mTor as a key regulator of permissive chromatin in this study that led us to the finding that inhibition of mTor induces a reversible state of hypotranscription and developmental pausing in blastocysts and ESCs (Bulut-Karslioglu et al., 2016). The centrality of mTor in growth signaling, nutrient sensing, ribogenesis and translational regulation (Laplante and Sabatini, 2012) make it an ideal rheostat for the positive feedback between euchromatin and translation during development.
Beyond ESCs and early embryos, hypertranscription is employed by germline and somatic stem/progenitor cells during phases of growth and regeneration (Percharde et al., 2017b; 2017a). Recent studies have shown that rapidly expanding lineage-committed progenitors often have elevated levels of transcriptional and translational outputs relative to their parental stem cells (Blanco et al., 2016; Signer et al., 2014; Zhang et al., 2014). In contrast, a global reduction in translational output is characteristic of dormant states, such as developmental pausing (Bulut-Karslioglu et al., 2016; Scognamiglio et al., 2016) or hibernation (Frerichs et al., 1998) and can be induced by environmental stresses including nutrient deprivation, hypoxia, viral infection or exposure to toxins (Laplante and Sabatini, 2012; Olsnes, 1972). We speculate that the acute dependence of euchromatin and transcription on translational output may be a recurrent feature in stem/progenitor cells that is modulated by environmental perturbations.
STAR METHODS
CONTACT FOR REAGENT AND SOURCE SHARING
Further information and requests for resources and reagents should be directed to and will be fulfilled by the Lead Contact, Miguel Ramalho-Santos (mrsantos@ucsf.edu, mrsantos@lunenfeld.ca).
EXPERIMENTAL MODEL AND SUBJECT DETAILS
Mice
Swiss Webster females (6- to 12-week-old) and males (6 week- to 6 month-old) were used. Animals were maintained on 12 h light/dark cycle and provided with food and water ad libitum in individually ventilated units (Techniplast at TCP, Lab Products at UCSF) in the specific-pathogen free facilities at UCSF. All procedures involving animals were performed in compliance with the protocol approved by the IACUC at UCSF, as part of an AAALAC-accredited care and use program (protocol AN091331-03).
Mouse embryonic stem cells
Wild-type E14 male ESCs (source: Bill Skarnes, Sanger Institute) were used for all reporter-free experiments. ES-FBS cells were cultured in DMEM GlutaMAX with Na Pyruvate, 15% FBS, 0.1 mM Non-essential amino acids, 50 U/ml Penicillin/Streptomycin, 0.1 mM EmbryoMax 2-Mercaptoethanol and 2000 U/ml ESGRO supplement. For the experiments in 2i medium, E14 ESCs initially grown in serum were passaged at least 4 times in 2i medium before use. 2i medium was composed of DMEM/F-12, Neurobasal medium, 1x N2/B27 supplements, 1 μM PD0325901, 3 μM CHIR99021, 50 μM Ascorbic acid and 2000 U/ml ESGRO supplement. Cells were cultured in 0.5% FBS for serum starvation experiments. Cells were not authenticated and tested negative for mycoplasma contamination.
Chd1chr-EGFP reporter cell line
A single PCR fragment containing the double chromodomains of Chd1 (amino acids 262 to 460) was isolated and cloned in frame into the pCAGGS-EGFP-IRES-Puro plasmid. Stable Chd1chr-EGFP expressing ESC lines were generated by transfecting 4 μg PvuI-linearized vector into 106 wild-type E14 ESCs, followed by Puromycin selection.
Mouse embryonic fibroblasts
Primary MEFs were derived from CD1 E12.5 mouse embryos and used at passage 3–6. MEFs were cultured in DMEM GlutaMAX with Na Pyruvate, 10% FBS, 0.1 mM Non-essential amino acids, 50 U/ml Penicillin/Streptomycin.
Neural stem/progenitor cells (NSPCs)
Early-passage NSPCs (p5–p10), originally derived from mouse E12.5 cortex (Hudlebusch et al., 2011), were cultured on poly-D-lysine and laminin coated plates in medium containing: 50% DMEM/F12, 50% Neurobasal, 1x N2 and B27 supplements, 0.1 mM Non-essential amino acids, 50 U/ml Penicillin/Streptomycin, 0.11 mg/ml Na Pyruvate, 5 mM HEPES, 1x GlutaMAX, 0.1 mg/ml Fraction V BSA, 2 μM EmbryoMax 2-Mercaptoethanol, 20 ng/ml bFGF, 10 ng/ml EGF and 2 μg/ml Heparin sodium salt.
METHOD DETAILS
Embryo culture
Wild-type mice were mated, blastocysts were collected at E3.5 after detection of the copulatory plug by flushing uteri of pregnant females using M2 medium (Zenith Biotech) supplemented with 2% BSA (Sigma). Subsequent embryo culture was performed in 3.5-cm plates under light mineral oil (Zenith Biotech) in 5% O2, 5% CO2 at 37°C in KSOM AA Evolve medium (Zenith Biotech) with 2% BSA until E4.5.
Wdr5 knock-down
Wdr5 shRNAs were designed based on the siRNA sequences from Ang et al (Ang et al., 2011). Control shRNA includes non-targeting sequence (Qin et al., 2014). shRNAs were cloned into the pSicoR-mCherry plasmid and constructs was packaged into lentivirus. Chd1chr-EGFP and Hp1α-EGFP ESCs were transduced with the lentiviral vectors. mCherry-positive cells with integrated shRNAs were sorted and knock-down was confirmed by qRT-PCR 72h post-transduction. EGFP fluorescence levels were analyzed on day 3 on an Avalon S3 Cell Sorter (Propel Labs).
Retinoic-acid mediated differentiation
Chd1chr-EGFP and Hp1α-EGFP ESCs were used. LIF was withdrawn from ES-FBS medium and retinoic acid was added at a final concentration of 5 μM. EGFP fluorescence levels were analyzed on day 3 on an Avalon S3 Cell Sorter (Propel Labs). For nascent transcription and chromatin analyses, LIF was withdrawn from ES-FBS medium for 1 day and 5 μM retinoic acid was added for 2 days before 3h DMSO or CHX treatment.
Western blot analysis
For histone analysis, histones were acid extracted and TCA-precipitated as follows: 7×10⁶ cells were washed in ice-cold PBS with 5 mM Na Butyrate. Cells were lysed in Triton Extraction Buffer (PBS, 0.5% Triton X-100, 1x Protease Inhibitor Cocktail, 1 mM PMSF, 5 mM NaVO4 and 5 mM NaF) for 10 minutes and centrifuged. The pellet was resuspended in 0.2N HCl and histones were extracted overnight. Extracted histones were precipitated with TCA, washed with ice-cold acetone and resuspended in water. For analysis of cellular fractions, cytoplasmic, nucleoplasmic and chromatin fractions were isolated as previously described (Méndez and Stillman, 2000). Cells were initially resuspended in Buffer A (10 mM HEPES pH7.9, 10 mM KCl, 1.5 mM MgCl2, 0.34 M sucrose, 10% glycerol, 1 mM DTT, 0.1% Triton X-100, 1x Halt protease inhibitor cocktail (Thermo Fisher Scientific), 1 mM PMSF, 5 mM NaF and 1 mM NaVO4). Cells were incubated for 5 minutes on ice, then spun down at 1,300 g for 5 minutes at 4°C. Cytoplasmic fraction (supernatant) was transferred to new tubes. Pellets (nuclei) were resuspended in buffer B (3 mM EDTA, 0.2 mM EGTA, 1 mM DTT, 1x Halt protease inhibitor cocktail, 1 mM PMSF, 5 mM NaF and 1 mM NaVO4). Nuclei were incubated for 5 minutes on ice, then spun down at 1,700 g for 5 minutes at 4°C. Nucleoplasmic fraction (supernatant) was transferred to new tubes. Pellets (insoluble chromatin) were resuspended in 1x Laemmli Buffer with 5% β-mercaptoethanol and sonicated using the Bioruptor for 5 minutes with settings high, 30 seconds on, 30 seconds off. Extracts were loaded into 4–15% Mini-Protean TGX SDS Page gels (Bio-Rad). Proteins were transferred to PVDF membranes. Membranes were blocked in 5% milk/PBS-T buffer for 30 min and incubated either overnight at 4°C or for 1 hour at room temperature with the following antibodies: H4K16ac (RRID:AB_310525), H3K4me3 (RRID:AB_1163444), H3K9me2 (RRID:AB_449854), Hp1α (RRID:AB_11213599), Gapdh (RRID:AB_2107445), H3K27ac, (RRID:AB_2716381) H3K9ac (RRID:AB_2716379), H3 (RRID:AB_302613), H4 (RRID:AB_305837), H3K36me2 (RRID:AB_1280939), β-actin (RRID:AB_2305186), RNA Pol II (RRID:AB_306327), RNA Pol II S2P (RRID:AB_304749), G9a (RRID:AB_2532211), Ezh2 (RRID:AB_10694683), Topors (RRID:AB_10852342), Chd1 (RRID:AB_11179073), Btf3 (RRID:AB_2067525), Brd1 (RRID:AB_2618449), Tip60 (RRID:AB_1950610), EGFP (RRID:AB_221569) and anti-rabbit/mouse/goat secondary antibodies (RRID:AB_2307391; RRID:AB_2338504; RRID:AB_656964). Membranes were incubated with ECL or ECL Plus reagents and exposed to X-ray films (Thermo Fisher Scientific). Quantification of WB bands were carried out using the Gimp image analysis software.
For analysis of FUCCI ESCs, cells were plated overnight before 3h treatment with CHX at 1 μg/ml or DMSO. Cells were collected by trypsinization and sorted on a FACS AriaII (BD Biosciences) into mCherry+ (G0/G1) and BFP+ (S/G2/M) cell fractions. 4×10⁵ cells of each fraction were sorted for histone extraction and western blotting as above.
Genome-wide shRNA screen
The ultracomplex EXPANDed shRNA library targeting the mouse genome was designed similarly to human shRNA libraries described before (Bassik et al., 2009). In brief, the library contains approximately 30 independent shRNAs per gene for all mouse protein-coding genes, for a total of ~600,000 shRNAs, hence the term “ultracomplex.” The full list of shRNA sequences present in the library is available upon request. Pooled sequences coding for the shRNAs were cloned downstream of a U6 promoter in a modified pSicoR lentiviral vector containing a EF1a-Puro-T2A-mCherry cassette. All vectors were pooled to generate one lentiviral library representing the 600,000 shRNAs. The entire pooled library was then used to generate lentiviruses at the UCSF ViraCore. 6.6×10⁷ Chd1chr-EGFP ESCs were infected at an MOI (multiplicity of infection) ≤ 1 with the shRNA library, such that each shRNA is targeted to 100 cells (100x coverage). Cells were plated on thirteen 15 cm cell culture plates at a density of 5×10⁶ per 15 cm plate. Culture medium was changed daily; cells were harvested for analysis on day 3. mCherry-positive cells were sorted into GFPlow and GFPhigh populations on an Avalon S3 Cell Sorter (Propel Labs). Integrated shRNAs were isolated by PCR using oligos which contained sequencing adapters and barcodes. Screen results were analyzed as described before (Diaz et al., 2015).
Single-gene knock down experiments
siRNAs were ordered as pools of 4 sequences from GE Dharmacon’s Cherry-Pick libraries. Chd1chr-EGFP ESCs were transfected with the siRNAs in 96-well plates. qRT-PCR and flow cytometry analyses were performed on day 2 or 3 as indicated. Fluorescence was analyzed on a BD Dual Fortessa.
Inhibitor treatments
Cells were incubated for indicated durations and concentrations with the following inhibitors: INK128 (Medchem), 10058-F4 (Sigma), Cycloheximide (Amresco), α-amanitin (Sigma), CX-5461 (Selleckchem), MG-132 (Selleckchem), Homoharringtonine (Sigma), and AZD8055 (Selleckchem). Control cells were treated with DMSO. Inhibitors were withdrawn and cells were washed just prior to downstream analyses. For all CHX release experiments, cells were treated with DMSO or CHX for indicated durations. Cells were washed with PBS before addition of fresh medium and harvesting at indicated time points. For all embryo experiments, inhibitors were added to E4.5 blastocysts for the last 3 hours of culture.
Global nascent transcription and translation analysis
For measurements of global transcriptional and translational output, wild-type E14 cells, RA-differentiated ESCs, MEFs, or NSPCs were plated and cultured overnight in their respective medium. E3.5 blastocysts were cultured ex vivo to E4.5 as described above. 5-ethynyl uridine (EU) was added at a final concentration of 1 mM or L-homopropargylglycine (HPG) at a final concentration of 25 μM, both for the last 45 minutes of 3h treatments. During nascent translation experiments, normal media were replaced with media containing Met-/Cys-free DMEM 45 minutes prior to the addition of HPG. Cells were trypsinized and processed according to the instructions of the Click-iT RNA (or HPG) Alexa Fluor 488 or 594 HCS Assay kits. For each experiment, cells without EU or HPG added were processed in parallel and subjected to the Click reaction as a control. Data were collected on a BD Dual Fortessa flow cytometer, analyzed using FlowJo v10, and plotted using Prism 7. Datasets show similar variance. All fluorescence values are reported as median fluorescence intensity (MFI). All graphs shown represent fold-change MFI of sample relative to no-EU or no-HPG controls.
Nascent RNA capture followed by qRT-PCR
To measure nascent transcriptional changes at specific loci, ESCs were analyzed using the Click-iT Nascent RNA Capture Kit. 4×10⁵ cells were plated and cultured overnight. The next day, EU was added at a final concentration of 200 μM and cells were incubated for 30 minutes during DMSO or CHX treatment. Cells were washed, harvested by trypsinization and counted (Bio-Rad Automated Cell Counter TC20, Bio-Rad). Total RNA was isolated from the same number of DMSO- or CHX-treated cells using the Qiagen RNeasy Micro Kit (Qiagen) and processed according to the manufacturer’s instructions. RNA was quantified using a Qubit 2.0 Fluorometer. qPCR was performed with KAPA SYBR FAST qPCR Master Mix (Kapa Biosystems) and amplified on a 7900HT Real-time PCR machine (Applied Biosystems).
For analysis of FUCCI ESCs, cells were plated overnight before 3h treatment with CHX at 1 μg/ml or DMSO. EU was added at a final concentration of 200 μM for the last 30 minutes of drug treatment. Cells were collected by trypsinization and sorted on a FACS AriaII (BD Biosciences) into mCherry+ (G0/G1) and BFP+ (S/G2/M) cell fractions. 2×10⁵ cells of each fraction were sorted for RNA isolation and used for nascent RNA capture as above.
Immunofluorescent staining and imaging
Wild-type E14 ESCs were plated on gelatin in 8-chamber polystyrene vessels. Adhered cells were incubated with DMSO or CHX at the indicated concentrations for 3 hours. Cells were then fixed in 4% paraformaldehyde for 10 minutes, washed with DPBS and permeabilized with 0.2% Triton X-100 in PBS for 5 minutes. After blocking in PBS, 2.5% BSA, 5% donkey serum for 1 hour, cells were incubated overnight at 4°C with anti-H4K5/8/12ac antibody (Millipore, RRID:AB_870989). Cells were washed in PBS-Tween20, 2.5% BSA, incubated with fluorescence-conjugated secondary antibody for 2 hours at room temperature and mounted in VectaShield mounting medium with DAPI (Vector Laboratories). Imaging was performed using a Leica SP5 confocal microscope with automated tile scanning. Blastocyst staining and imaging was performed as described before (Bulut-Karslioglu et al., 2016) using blastocysts flushed at E3.5 and cultured until E4.5 (see Embryo Culture for details). CHX or DMSO was added in the last 3 hours of culture. All quantifications were performed using the Cell Profiler software (Carpenter et al., 2006).
Intracellular flow cytometry
Wild-type E14 ESCs were cultured overnight in FBS/LIF before a 3h incubation in either CHX (100 ng/ml or 1 μg/ml) or DMSO (diluted to 1:10,000). Cells were fixed in 4% PFA for 15 minutes, permeabilized in 0.2% Triton X-100 for 3 minutes on ice, and blocked in 1% BSA in PBS. Primary incubation was performed with anti-H4K16ac antibody (Millipore, RRID:AB_310525) diluted 1:1000 in blocking solution, overnight at 4°C. Cells were washed and incubated in secondary antibody (AlexaFluor 488, Life Technologies) and fluorescence intensity was measured on a BD Dual Fortessa flow cytometer. Data were analyzed using FlowJo v10. All fluorescence values are reported as median fluorescence intensity (MFI).
Cell cycle staging
Wild-type E14 ESCs were cultured overnight before a 3h incubation in DMSO or CHX (1 μg/ml and 10 μg/ml). 5-ethynyl 2′-deoxyuridine (EdU) was added to a final concentration of 10 μM during the final hour of drug treatment. Cells were trypsinized and processed according to the instructions of the Click-iT EdU Alexa Fluor 488 Flow Cytometry Assay Kit. FxCycle Violet Stain (diluted 1:1000) was used to detect DNA content, per manufacturer’s instructions. Data were collected on a BD Dual Fortessa flow cytometer, analyzed using FlowJo v10, and plotted using FlowJo v10 and Prism 7. Statistical analysis by Chi-square test was conducted in Prism 7.
H4K16ac ChIP-seq
H4K16ac ChIPs were performed according to the recommendations of the Diagenode low-cell ChIP kit. Briefly, wt E14 cells were plated and cultured overnight. Cells were treated with CHX 1 μg/ml or DMSO diluted 1:10,000 in FBS/LIF medium for 3h. 105 cells were harvested per IP. Lysis and IP were performed in the presence of 1x Halt Protease inhibitors and sodium butyrate. Chromatin was sheared to an average size of 300 bp by a Covaris sonicator with the settings Duty 2, Intensity 3, 200 cycles per burst for 8 minutes. Shearing efficiency was checked by agarose gel. Fixed, sonicated chromatin was obtained from HEK 293 cells using the same method. IPs were performed using antibodies against H4K16ac or rabbit IgG. Following overnight IP and washes, genomic DNA was treated with RNase A. Reverse cross-linking was performed in the presence of Proteinase K at 65°C overnight. Genomic DNA was cleaned up using Qiagen Minelute Columns and quantified by Qubit. Two biological replicates were collected per condition.
RNA Pol II ChIP-qPCR
ChIP was performed as described before (Brookes et al., 2012). After aspiration of culture medium, cells were washed with PBS and fixed on the culture dish using 1% formaldehyde in PBS for 10 minutes at room temperature (RT). Glycine was added to a final concentration of 125 mM to quench formaldehyde for 5 minutes at RT. Cells were washed twice with ice-cold PBS, incubated in Swelling Buffer (25 mM HEPES pH 7.9, 1.5 mM MgCl2, 10 mM KCl, 0.1% NP-40 with 1x Halt protease inhibitor cocktail (Thermo Fisher Scientific, Cat # 78425), 1 mM PMSF, 5 mM NaF and 1 mM NaVO4) for 10 minutes, scraped, passed through an 18Gx11/2″ needle (5x) and spun down at 3,000g, 4°C, 5 minutes. Nuclei were resuspended in Sonication Buffer (50 mM HEPES pH 7.9, 140 mM NaCl, 1mM EDTA, 1% Triton X-100, 0.1% Na-deoxycholate 0.1% SDS with 1x Halt protease inhibitor cocktail, 1 mM PMSF, 5 mM NaF and 1 mM NaVO4) and sonicated using a Covaris S2 sonicator with settings 5% duty cycle, intensity 4, cycles per burst 200, frequency sweeping. 20 μl chromatin was incubated sequentially with 1 μl RNaseA and 5 μl proteinase K in 100 μl total volume at 37°C for 30 min and 65°C for 1h, purified using a Qiagen PCR purification kit and DNA content was quantified using a NanoDrop. Fragment size distribution was checked on a 1% agarose gel. Chromatin was snap frozen if not immediately used for IP. Chromatin volume equivalent to 25 μg DNA was used for each IP. Chromatin was immunoprecipitated using total 2 μg RNA Pol II (Abcam, RRID:AB_306327) and RNA Pol II S2p (Abcam, RRID:AB_304749) antibodies and 30 μl Protein A Dynabeads per IP in 500 μl total volume of Sonication Buffer overnight at 4°C. Beads were washed 3x with low salt buffer (0.1 % SDS, 1% Triton, 2 mM EDTA, 150 mM NaCl, 10 mM Tris-HCl pH 8.0), 1x with high salt buffer (0.1 % SDS, 1% Triton, 2 mM EDTA, 500 mM NaCl, 10 mM Tris-HCl pH 8.0), 1x with TE buffer (10 mM Tris-HCl pH 8.0, 1 mM EDTA), then resuspended in 100 μl Elution Buffer (50 mM Tris pH 7.5, 1 mM EDTA, 1% SDS). Resuspended beads were sequentially incubated with 1 μl RNaseA 37°C for 30 min with and 5 μl proteinase K at and 65°C for 4h to overnight. Eluate was separated from beads and purified using Qiagen PCR purification columns.
SILAC-Mass Spectrometry
To differentially label wild-type E14 ESCs with light, medium and heavy amino acids, we replaced the following components in the ES-FBS culture medium (see above): DMEM formulated without lysine and arginine instead of DMEM, dialyzed serum instead of regular FBS, lysine and arginine added separately to light (regular L-lysine and L-arginine), medium (L-lysine 4,4,5,5-D4 and L-arginine 13C6) and heavy (L-lysine 13C6, 15N2 and L-arginine 13C6, 15N4) media. All SILAC reagents were purchased from Cambridge Isotope Laboratories. L-proline was included in all media (included in with other non-essential amino acids) and the absence of arginine-to-proline conversion was verified by MS. Complete labeling (>99%) was confirmed by MS before starting the experiment. To quantitatively identify changes in protein levels upon inhibition of protein synthesis, cells were treated with DMSO (light) or 35 μg/ml CHX for 1h (medium) or 3h (heavy). Cells were washed with PBS and lifted in ice-cold PBS with 1x protease inhibitor cocktail (Roche). 108 cells from each condition were pelleted and snap-frozen until MS analysis. Harvested cells were lysed in 8M urea in 80 mM NH4HCO3, sonicated on ice (3 pulses at 35% power, 20 s each) and centrifuged at 15000g for 10 min. Supernatant was collected and protein concentration estimated with BCA. Equal amounts (100 ug) of the 3 SILAC labeled samples were combined, and the proteins treated with 5 mM DTT at 56C for 10 min, and then with 10 mM iodoacetic acid at RT for 1 h, then diluted 4 times to 2 M urea and digested o/n with trypsin (2% of total protein) at 37C. Samples were acidified with 5% formic, and peptides were extracted using SepPack cartridges. 200 ug of tryptic peptides where resuspended in 20 mM ammonium formiate pH 10.3, and separated in a 1 × 100mm Gemini 3um C18 column (Phenomenex) in a MeCN gradient (2 to 30 % in 60 min) in the presence of 20 mM ammonium formiate pH 10.3. 70 fraction were collected and combined in 18 final fractions, evaporated, resuspended in 0.1 formic acid and analyzed by LCMSMS in a Q Exactive Plus mass spectrometer. Peptides were loaded in a 200 cm monolithic C18 silica column (GL Sciences, Tokyo, Japan), and separated in a gradient of acetonitrile (288min 2 to 25%, 36 min to 32%, 18 min to 40%, 18 min to 60%, 5 min to 8%) in 0.1% formic The liquid chromatography eluate was interfaced with a 7 μm ID EasySpray emitter (Thermo Scientific) to the MS. Samples were analyzed in positive ion mode, and in information-dependent acquisition mode to automatically switch between MS and MS/MS acquisition. MS spectra were acquired in profile mode in the m/z range between 350–1500 m/z at 70,000 resolution. All samples were analyzed with a TOP10 method, the 10 most intense multiple charged ions over a threshold of 17000 counts were selected to perform HCD experiments. Product ions were analyzed in centroid mode with resolution R=17500, and isolation window was set to 4 Th. A dynamic exclusion window was applied that prevented the same m/z from being selected for 10 s after its acquisition.
ATAC-seq
ATAC-seq was performed as described before (Buenrostro et al., 2015) on 50,000 cells each of DMSO- or 1 μg/ml CHX-treated E14 ESCs, in quadruplicates. A total of 11 cycles of amplification was performed. Library quality and quantity were analyzed by Bioanalyzer (Agilent) and KAPA library quantification kit for Illumina platforms (KAPA Biosciences). Samples were sequenced on a HiSeq 4000 using single-end 50 bp sequencing reads.
QUANTIFICATION AND STATISTICAL ANALYSIS
H4K16ac ChIP-Seq
HEK 293 chromatin was spiked in to a final concentration of 2.5% before library preparation. Sequencing libraries were prepared using the NEBNext ChIP-seq Library Prep for Illumina Kit (New England Biolabs) following manufacturer’s instructions. Libraries were constructed from 3 or 5 ng of DNA and quality was assessed by High Sensitivity DNA Assay on an Agilent 2100 Bioanalyzer (Agilent Technologies). Samples were sequenced on a HiSeq 4000 using single-end 50 bp reads. Sequencing reads that passed quality control were trimmed of adaptors using Trim Galore! and aligned to mm9 and hg19 using bowtie2 (Langmead and Salzberg, 2012) version 2.2.4 with no multimapping. Normalization factors for each sample, excluding inputs, were calculated from the ratio of total reads aligning to mm9 compared to total reads aligning to hg19 (Orlando et al., 2014). Reads were deduplicated using samtools (H. Li et al., 2009) and analyzed by custom R scripts, available upon request. Read coverage was assigned using the featureCounts function of the Rsubread package (version 1.24.1) (Liao et al., 2013) in R Bioconductor (Huber et al., 2015), using all coding genes of mm9 with a 2kb 5′ extension and disallowing multiple overlap. Read abundance over each gene was scaled by the respective normalization factor and then divided by the read abundance in the corresponding input. Replicate correlation was assessed by Pearson correlation between the top 1000 most-enriched genes, and replicates were pooled by summing the featureCounts of each replicate. Merged samples were used to produce all plots shown. Top-expressed genes were based on published CNN RNA-seq of E14 ESCs (Bulut-Karslioglu et al., 2016). Tag density plots were produced using deepTools on Galaxy (http://deeptools.ie-freiburg.mpg.de/) (Afgan et al., 2016; Ramirez et al., 2016). Box plots were produced using custom R scripts. Tracks were visualized using the UCSC Genome Browser.
SILAC-mass spectrometry
Peaklists were generated using PAVA in-house software (Guan et al., 2011) based on the RawExtract script from Xcalibur v2.4 (Thermo Fisher Scientific). The peak lists were searched against the human subset of the UniProt database as of June 17, 2013, (73955/36042779 entries searched) using in-house ProteinProspector with settings described below. A randomized version of all entries was concatenated to the database for estimation of false discovery rates in the searches. Peptide tolerance in searches was 20 ppm for precursor and 30 ppm for product ions, respectively. Peptides containing two miscleavages were allowed. Carboxymethylation of cysteine was allowed as constant modification; acetylation of the N terminus of the protein, pyroglutamate formation from N terminal glutamine, oxidation of methionine, and loss of the protein initial methionine, were allowed as variable modifications, as well as 2H(4) labelling in lysine and 13C(6) labelling in arginine, and 15N(2) 13C(6) labelling in lysine and 15N(4) 13C(6) labelling in arginine, limiting the allowed combination of labels: if K and R occur in the same peptide, Protein Prospector only allows pairing of K0 with R0, K4 with R6 and K8 to R10. In all cases, the number of modification was limited to two per peptide. A minimal ProteinProspector protein score of 20, a peptide score of 15, a maximum expectation value of 0.05 and a minimal discriminant score threshold of 0.0 were used for initial identification criteria. FDR was limited to 1%. Quantification: SILAC quantification measurements were extracted from the raw data by Search Compare in Protein Prospector. Search Compare averaged together MS scans from −10 s to +30 s from the time at which the MS/MS spectrum was acquired in order to produce measurements averaged over the elution of the peptide. SILAC ratios were calculated, and base 2 logarithms of these values were used for further analysis. If quantitative data are available from isotopic envelopes identified as different charge states of the same peptide, the median of the log2 of the calculated SILAC ratios was used for that peptide. For proteins, the median of all the log2 ratios for peptides unique to that protein was calculated, and the distribution of log2 ratios normalized by its median value.
ATAC-seq
Raw reads were trimmed of adaptors and aligned to the mouse genome build mm10 using Bowtie2 version 2.2.4. Reads were deduplicated, sorted, and converted to bigWig format using samtools. BigWig files from individual replicates were used to assess correlation strength between replicates (Figure S6) using deepTools/multibigwigsummary and plotCorrelation tools. Peak calling was performed on each biological replicate pair using Macs14. Peaks from different biological replicates were then intersected. Peaks which were detected in at least 3 out of 4 replicates were selected for further analysis. As such, 734 peaks were found to be gained and 454 peaks were found to be depleted upon CHX treatment. Gene ontology analysis of these peaks was performed using GREAT software (McLean et al., 2010). The region-gene association was confined to 5 kb upstream and 1 kb downstream of each gene. To compare enrichment of histone marks, variants and DNase-seq signal over our ATAC-seq peaks, we used the datasets indicated in the Key Resources Table. All heatmaps were generated using the deepTools package (Ramirez et al., 2016) on the Galaxy platform (Afgan et al., 2016). Motif analysis was done using Homer version 4.7 (Heinz et al., 2010). Analysis of repeats was done using repeat annotations from UCSC, custom R scripts and Galaxy Bedtools.
Other
All other replications and statistical analyses are explained in Figure Legends.
DATA AND SOFTWARE AVAILABILITY
Sequencing data have been deposited in Gene Expression Omnibus (GEO) under accession number GSE98358.
KEY RESOURCES TABLE
The table highlights the genetically modified organisms and strains, cell lines, reagents, software, and source data essential to reproduce results presented in the manuscript. Depending on the nature of the study, this may include standard laboratory materials (i.e., food chow for metabolism studies), but the Table is not meant to be comprehensive list of all materials and resources used (e.g., essential chemicals such as SDS, sucrose, or standard culture media don’t need to be listed in the Table). Items in the Table must also be reported in the Method Details section within the context of their use. The number of primers and RNA sequences that may be listed in the Table is restricted to no more than ten each. If there are more than ten primers or RNA sequences to report, please provide this information as a supplementary document and reference this file (e.g., See Table S1 for XX) in the Key Resources Table.
Please note that ALL references cited in the Key Resources Table must be included in the References list. Please report the information as follows:
REAGENT or RESOURCE: Provide full descriptive name of the item so that it can be identified and linked with its description in the manuscript (e.g., provide version number for software, host source for antibody, strain name). In the Experimental Models section, please include all models used in the paper and describe each line/strain as: model organism: name used for strain/line in paper: genotype. (i.e., Mouse: OXTRfl/fl: B6.129(SJL)-Oxtrtm1.1Wsy/J). In the Biological Samples section, please list all samples obtained from commercial sources or biological repositories. Please note that software mentioned in the Methods Details or Data and Software Availability section needs to be also included in the table. See the sample Table at the end of this document for examples of how to report reagents.
SOURCE: Report the company, manufacturer, or individual that provided the item or where the item can obtained (e.g., stock center or repository). For materials distributed by Addgene, please cite the article describing the plasmid and include “Addgene” as part of the identifier. If an item is from another lab, please include the name of the principal investigator and a citation if it has been previously published. If the material is being reported for the first time in the current paper, please indicate as “this paper.” For software, please provide the company name if it is commercially available or cite the paper in which it has been initially described.
-
IDENTIFIER: Include catalog numbers (entered in the column as “Cat#” followed by the number, e.g., Cat#3879S). Where available, please include unique entities such as RRIDs, Model Organism Database numbers, accession numbers, and PDB or CAS IDs. For antibodies, if applicable and available, please also include the lot number or clone identity. For software or data resources, please include the URL where the resource can be downloaded. Please ensure accuracy of the identifiers, as they are essential for generation of hyperlinks to external sources when available. Please see the Elsevier list of Data Repositories with automated bidirectional linking for details. When listing more than one identifier for the same item, use semicolons to separate them (e.g. Cat#3879S; RRID: AB_2255011). If an identifier is not available, please enter “N/A” in the column.
A NOTE ABOUT RRIDs: We highly recommend using RRIDs as the identifier (in particular for antibodies and organisms, but also for software tools and databases). For more details on how to obtain or generate an RRID for existing or newly generated resources, please visit the RII or search for RRIDs.
Please use the empty table that follows to organize the information in the sections defined by the subheading, skipping sections not relevant to your study. Please do not add subheadings. To add a row, place the cursor at the end of the row above where you would like to add the row, just outside the right border of the table. Then press the ENTER key to add the row. Please delete empty rows. Each entry must be on a separate row; do not list multiple items in a single table cell. Please see the sample table at the end of this document for examples of how reagents should be cited.
KEY RESOURCES TABLE.
| REAGENT or RESOURCE | SOURCE | IDENTIFIER |
|---|---|---|
| Antibodies | ||
| Anti-H4K16ac, rabbit polyclonal | Millipore | Cat# 07-329, RRID:AB_310525 |
| Anti-H3K4me3, rabbit monoclonal | Millipore | Cat# 04-745, RRID:AB_1163444 |
| Anti-H3K27ac, rabbit monoclonal | RevMab | Cat# 31-1056, RRID:AB_2716381 |
| Anti-H3K9ac, rabbit monoclonal | RevMab | Cat# 31-1054, RRID:AB_2716379 |
| Anti-H3K9me2, mouse monoclonal | Abcam | Cat# ab1220, RRID:AB_449854 |
| Anti-H3K36me2, rabbit polyclonal | Abcam | Cat# ab9049, RRID:AB_1280939 |
| Anti-H3, rabbit polyclonal | Abcam | Cat# ab1791, RRID:AB_302613 |
| Anti-H4, rabbit polyclonal | Abcam | Cat# ab7311, RRID:AB_305837 |
| Anti-H4K5/8/12ac, rabbit monoclonal | Millipore | Cat# 04-557, RRID:AB_870989 |
| Anti-Oct4, rabbit polyclonal (Western Blot) | Santa Cruz Biotechnology | Cat# sc-9081, RRID:AB_2167703 |
| Anti-Oct4, mouse monoclonal (IF) | Santa Cruz Biotechnology | Cat# sc-5279, RRID:AB_628051 |
| Anti-Nanog, rabbit monoclonal | Cell Signaling Technology | Cat# 4903, RRID:AB_10559205 |
| Anti-RNA Polymerase II, mouse monoclonal | Abcam | Cat# ab817, RRID:AB_306327 |
| Anti-RNA Polymerase II phospho-S2 (Pol II S2p), rabbit polyclonal | Abcam | Cat# ab5095, RRID:AB_304749 |
| Anti-EGFP, rabbit polyclonal | Thermo Fisher Scientific | Cat# A-11122, RRID:AB_221569 |
| Anti-Topors | Santa Cruz Biotechnology | Cat# sc-292009, RRID:AB_10852342 |
| Anti-Chd1, rabbit monoclonal | Cell Signaling Technology | Cat# 4351S, RRID:AB_11179073 |
| Anti-Tip60, rabbit | GeneTex | Cat# GTX112197, RRID:AB_1950610 |
| Anti-Brd1, mouse monoclonal | Developmental Studies Hybridoma Bank | Cat# PCRP-BRD1-2H2, RRID:AB_2618449 |
| Anti-Btf3, goat polyclonal | R and D Systems | Cat# AF5747, RRID:AB_2067525 |
| Anti-Gapdh, mouse monoclonal | Millipore | Cat# MAB374, RRID:AB_2107445 |
| Anti-beta-actin, rabbit polyclonal | Abcam | Cat# ab8227, RRID:AB_2305186 |
| Anti-Hp1alpha, mouse monoclonal | Millipore | Cat# 05-689, RRID:AB_11213599 |
| Anti-Ezh2, rabbit monoclonal | Cell Signaling Technology | Cat# #5246, RRID:AB_10694683 |
| Anti-G9a, mouse monoclonal | Thermo Fisher Scientific | Cat# 435200, RRID:AB_2532211 |
| Anti-IgG, rabbit | Abcam | Cat# ab46540, RRID:AB_2614925 |
| Anti-rabbit IgG HRP | Jackson ImmunoResearch Labs | Cat# 111-035-144, RRID:AB_2307391 |
| Anti-mouse IgG HRP | Jackson ImmunoResearch Labs | Cat# 115-035-062, RRID:AB_2338504 |
| Anti-goat IgG HRP | Santa Cruz Biotechnology | Cat# sc-2768, RRID:AB_656964 |
| Bacterial and Virus Strains | ||
| Biological Samples | ||
| Chemicals, Peptides, and Recombinant Proteins | ||
| Cycloheximide, translation inhibitor | Amresco | Cat# 94271 |
| INK128, mTor inhibitor | Medchem | Cat# HY13328 |
| 10058-F4, Myc inhibitor | Sigma | Cat# F3680 |
| Homoherringtonine, translation inhibitor | Sigma | Cat# SML1091 |
| AZD8055, mTor inhibitor | Selleckchem | Cat# S1555 |
| a-amanitin, Pol II inhibitor | Sigma | Cat# A2263 |
| CX-5461, Pol I inhibitor | Selleckchem | Cat# S2684 |
| MG132, proteasome inhibitor | Selleckchem | Cat# S2619 |
| LIF | Millipore | Cat# ESG1107 |
| PD0325901 | Stemgent | Cat# 04-0006 |
| CHIR99021 | Selleckchem | Cat# S2924 |
| 2-phospho ascorbic acid | Sigma | Cat#A8960 |
| Retinoic acid | Sigma | Cat#R2625 |
| B27 supplement 50x | Life Technologies | Cat# 17504044 |
| N2 supplement 100x | Life Technologies | Cat# 17502048 |
| Fetal bovine serum | Atlanta Biologicals | Cat# S 11150 |
| GlutaMAX | Gibco | Cat# 3505-061 |
| DMEM with high glucose, GlutaMAX, Na pyruvate | Gibco | Cat# 10569044 |
| Neurobasal | Gibco | Cat# 21103-049 |
| DMEM/F-12 | Gibco | Cat# 10565-018 |
| EmbryoMax 2-Mercaptoethanol 100X | Millipore | Cat# ES-007-E |
| Penicillin-Streptomycin (10,000 U/ml) | UCSF Cell Culture Facility | Cat# 15140122 |
| Non-essential amino acids solution (100X) | UCSF Cell Culture Facility | Cat# 11140050 |
| Gelatin solution, type B, 2% | Sigma | Cat# G1393 |
| EGF | PeproTech | Cat# AF-100-15 |
| BFGF | PeproTech | Cat# 100-18B |
| Heparin sodium salt | Sigma | Cat# H3149 |
| Fraction V BSA, 7.5% solution | Gibco | Cat# 15260-037 |
| Poly-D-Lysine | Millipore | Cat# A-003-E |
| Laminin | Sigma | Cat# L2020 |
| KSOMaa Evolve | Zenith Biotech | Cat# ZEKS-050 |
| M2 | Zenith Biotech | Cat# ZFM2-100 |
| DMSO | Sigma | Cat# D2650 |
| DMEM high glucose, - Met/Cys | Gibco | Cat# 21013-024 |
| DMEM minus L-Lysine, L-Arginine | Cambridge Isotope Laboratories | Cat# DMEM-500 |
| Dialyzed fetal bovine serum | Cambridge Isotope Laboratories | Cat# FBS-50 |
| L-Lysine:2HCL unlabeled | Cambridge Isotope Laboratories | Cat# ULM-8766 |
| L-Arginine:HCL unlabeled | Cambridge Isotope Laboratories | Cat# ULM-8347 |
| L-Lysine:2HCL (4,4,5,5-D4, 96–98%) | Cambridge Isotope Laboratories | Cat# DLM-2640-PK |
| L-Arginine:HCL (13C6, 99%) | Cambridge Isotope Laboratories | Cat# CLM-2265-H |
| L-Lysine:2HCL (13C6, 99%; 15N2, 99%) | Cambridge Isotope Laboratories | Cat# CNLM-291-H |
| Critical Commercial Assays | ||
| Protein A Dynabeads | Invitrogen | Cat# 10002 |
| Diagenode Low Cell ChIP kit | Diagenode | Cat# C01010070 |
| NEBNext ChIP-seq Library Prep for Illumina kit | NEB | Cat# E6200 |
| NEBNext Multiplex Oligos for Illumina (Index Primers set 1) | NEB | Cat# E7335S |
| Agilent High Sensitivity DNA kit | Agilent | Cat# 5067-4626 |
| RNeasy Mini/Micro kits | Qiagen | Cat# 74104/4 |
| Click-iT Nascent RNA Capture kit | Life Technologies | Cat# C10365 |
| Click-iT RNA Alexa Fluor 488 or 594 HCS Assay kits | Life Technologies | Cat# C10327/8 |
| Click-iT HPG Alexa Fluor 488 Protein Synthesis Assay kit | Life Technologies | Cat# C10428 |
| Click-iT EdU Alexa Fluor 488 Flow Cytometry Assay Kit | Life Technologies | Cat# C10420 |
| Nextera DNA Library Prep kit | Illumina | Cat# FC-121-1030 |
| KAPA Library Quantification kit | KAPA Biosystems | Cat# 07960204001 |
| DharmaFECT 1 Transfection Reagent | Dharmacon | Cat# T-2001-03 |
| Custom siRNA library, Cherry-pick Library 0.1 nmol | Dharmacon | Cat# G-CUSTOM-177075 |
| Deposited Data | ||
| Raw and processed sequencing data | NCBI Gene Expression Omnibus | GEO: GSE98358 |
| Experimental Models: Cell Lines | ||
| E14TG2a ES cells | Bill Skarnes, Sanger Institute | (Hooper et al., 1987) |
| Mouse embryonic fibroblasts | This study | |
| Neural stem/progenitor cells | Daniel Lim, UCSF | (Hudlebusch et al., 2011) |
| FUCCI cells | Benoit Bruneau, UCSF | (Nora et al., 2017) |
| Experimental Models: Organisms/Strains | ||
| Swiss Webster | Charles River | Strain # 024 |
| Oligonucleotides | ||
| Recombinant DNA | ||
| pCAGGS-Chd1chr-EGFP-IRES-Puro | This study | N/A |
| pCAGGS-Hp1α-EGFP-IRES-Puro | (Bulut-Karslioglu et al., 2014) | N/A |
| Software and Algorithms | ||
| FlowJo, v10 | FlowJo LLC | https://www.flowjo.com/ |
| Prism, 7.0a | GraphPad | https://www.graphpad.com/scientific-software/prism/ |
| Cell Profiler | (Carpenter et al., 2006) | http://cellprofiler.org/ |
| GNU Image Manipulation Program (GIMP) 2.8.22 | GPLv3 | https://www.gimp.org/ |
| GREAT | (McLean et al., 2010) | http://great.stanford.edu/public/html/ |
| Bowtie2, v2.2.4 | (Langmead and Salzberg, 2012) | http://bowtie-bio.sourceforge.net/bowtie2/index.shtml |
| Samtools | (Li et al., 2009) | http://www.htslib.org/ |
| R | R core team | http://www.R-project.org/ |
| Rsubread package, version 1.24.1 | (Liao et al., 2013) | https://bioconductor.org/packages/release/bioc/html/Rsubread.html |
| R Bioconductor | (Huber et al., 2015) | https://www.bioconductor.org/ |
| Macs14, version 1.4.2 20120305 | (Zhang et al., 2008) | http://liulab.dfci.harvard.edu/MACS/index.html |
| DeepTools | (Ramirez et al., 2016) | https://deeptools.readthedocs.io/en/latest/# |
| Galaxy | (Afgan et al., 2016) | https://usegalaxy.org/ |
| Homer, version 4.7 | (Heinz et al., 2010) | http://homer.ucsd.edu/homer/motif/ |
| PAVA in-house software | (Guan et al., 2011) | N/A |
| ProteinProspector, version 5.10.10 | UCSF Mass Spectrometry Facility | http://prospector.ucsf.edu |
| Other: Datasets reanalyzed | ||
| H3K4me1 ChIP-seq | GSM1003750 | (ENCODE Project Consortium, 2012) |
| H3K4me3 ChIP-seq | GSM1003756 | (ENCODE Project Consortium, 2012) |
| H3K27ac ChIP-seq | GSM1000126 | (ENCODE Project Consortium, 2012) |
| H3K27me3 ChIP-seq | GSM1000089 | (ENCODE Project Consortium, 2012) |
| H3K9me3 ChIP-seq | GSM1003751 | (ENCODE Project Consortium, 2012) |
| DNaseI-seq | GSM1014154 | (ENCODE Project Consortium, 2012) |
| p300 ChIP-seq | GSM918750 | (ENCODE Project Consortium, 2012) |
| H2A.Z ChIP-seq | GSM958501 | (Ku et al., 2012) |
| Acetylated H2A.Z ChIP-seq | GSM958502 | (Ku et al., 2012) |
| H3.3 ChIP-seq | GSM423355 | (Goldberg et al., 2010) |
| Mappability track | UCSC Table Browser | (Karolchik et al., 2004) |
Supplementary Material
RNAi screen hits
Gene ontology analysis of RNAi screen results
Oligonucleotide sequences
List of SILAC-MS-identified proteins
Gene ontology analysis of proteins depleted or enriched upon CHX treatment identified by SILAC-MS
List of 60 unstable euchromatin regulators
Coordinates of ATAC-seq peaks and gene ontology analyses
Highlights.
Genome-wide RNAi screen identifies protein synthesis as key to ESC euchromatin
Acute translation inhibition reduces H3/H4-acetylation, H3K4me3 and transcription
ATAC-seq reveals that reducing translation rewires open chromatin within 3 hours
SILAC-MS identifies unstable euchromatin regulators requiring high translation rate
Acknowledgments
We thank Hiten Madhani and members of the Santos Lab for critical reading of the manuscript. We thank Thomas Jenuwein for the Hp1α-EGFP vector; Amanda Nolte for virus production; UCSF Institute of Human Genetics for assistance with sequencing and sonication; Shreya Chand for assistance with mass spectrometry; Ava Carter for advice on ATAC-seq libraries; Elphège Nora for sharing FUCCI cells; and Daniel Lim, Elizabeth Hwang, Rebecca Andersen, and Malin Åkerblom for sharing NSPCs. Samples were sequenced at UCSF Institute of Human Genetics Core Facility and Center for Advanced Technology, which is supported by the NIH (5P30CA082103). Flow cytometry data were generated in the UCSF Parnassus Flow Cytometry Core, which is supported by a Diabetes Research Center (DRC) grant and the NIH (P30 DK063720). SILAC-MS was performed at the UCSF Mass Spectrometry Facility, which is supported by the Biomedical Technology Research Centers program of the NIH National Institute of General Medical Sciences (NIH NIGMS 8P41GM103481 and NIH 1S10OD016229) and by Dr. Mariam and Sheldon G. Adelson Medical Research Foundation. This research was supported by NIH grant U01MH105028 and the UCSF Program for Breakthrough Biomedical Research (PBBR) to M.T.M., a Shurl and Kay Curci Foundation Research Grant and a gift from the Dabbiere family to A.D., NIH grant 1F30HD093116 to T.A.M. and NIH grants R01GM113014 and R01OD012204 to M.R.-S.
Footnotes
AUTHOR CONTRIBUTIONS
A.B.-K. and M.R.-S. conceived of the project. A.B.-K. designed and performed the RNAi screen. A.D. analyzed the RNAi screen output. A.B.-K. and T.A.M. designed, performed and analyzed all other experiments except mass spectrometry. J.A.O.-P. performed mass spectrometry on SILAC samples. M.P. helped with bioinformatics analyses. S.C. and G.K. designed and cloned the shRNA library under the supervision of M.T.M. A.L.B. supervised the SILAC-MS experiment. M.R.-S. supervised the project. A.B.-K., T.A.M. and M.R.-S. wrote the manuscript with feedback from all authors.
DECLARATION OF INTERESTS
The authors declare no competing interests.
Publisher's Disclaimer: This is a PDF file of an unedited manuscript that has been accepted for publication. As a service to our customers we are providing this early version of the manuscript. The manuscript will undergo copyediting, typesetting, and review of the resulting proof before it is published in its final citable form. Please note that during the production process errors may be discovered which could affect the content, and all legal disclaimers that apply to the journal pertain.
References
- Afgan E, Baker D, van den Beek M, Blankenberg D, Bouvier D, Čech M, Chilton J, Clements D, Coraor N, Eberhard C, Grüning B, Guerler A, Hillman-Jackson J, Kuster Von G, Rasche E, Soranzo N, Turaga N, Taylor J, Nekrutenko A, Goecks J. The Galaxy platform for accessible, reproducible and collaborative biomedical analyses: 2016 update. Nucleic Acids Res. 2016;44:W3–W10. doi: 10.1093/nar/gkw343. [DOI] [PMC free article] [PubMed] [Google Scholar]
- Ahmed K, Dehghani H, Rugg-Gunn P, Fussner E, Rossant J, Bazett-Jones DP. Global chromatin architecture reflects pluripotency and lineage commitment in the early mouse embryo. PLoS ONE. 2010;5:e10531. doi: 10.1371/journal.pone.0010531. [DOI] [PMC free article] [PubMed] [Google Scholar]
- Ang YS, Tsai SY, Lee DF, Monk J, Su J, Ratnakumar K, Ding J, Ge Y, Darr H, Chang B, Wang J, Rendl M, Bernstein E, Schaniel C, Lemischka IR. Wdr5 mediates self-renewal and reprogramming via the embryonic stem cell core transcriptional network. Cell. 2011;145:183–197. doi: 10.1016/j.cell.2011.03.003. [DOI] [PMC free article] [PubMed] [Google Scholar]
- Bassik MC, Lebbink RJ, Churchman LS, Ingolia NT, Patena W, LeProust EM, Schuldiner M, Weissman JS, McManus MT. Rapid creation and quantitative monitoring of high coverage shRNA libraries. Nature Methods. 2009;6:443–445. doi: 10.1038/nmeth.1330. [DOI] [PMC free article] [PubMed] [Google Scholar]
- Belle A, Tanay A, Bitincka L, Shamir R, O’Shea EK. Quantification of protein half-lives in the budding yeast proteome. Proc Natl Acad Sci USA. 2006;103:13004–13009. doi: 10.1073/pnas.0605420103. [DOI] [PMC free article] [PubMed] [Google Scholar]
- Blanco S, Bandiera R, Popis M, Hussain S, Lombard P, Aleksic J, Sajini A, Tanna H, Cortés-Garrido R, Gkatza N, Dietmann S, Frye M. Stem cell function and stress response are controlled by protein synthesis. Nature. 2016;534:335–340. doi: 10.1038/nature18282. [DOI] [PMC free article] [PubMed] [Google Scholar]
- Brookes E, de Santiago I, Hebenstreit D, Morris KJ, Carroll T, Xie SQ, Stock JK, Heidemann M, Eick D, Nozaki N, Kimura H, Ragoussis J, Teichmann SA, Pombo A. Polycomb associates genome-wide with a specific RNA polymerase II variant, and regulates metabolic genes in ESCs. Cell Stem Cell. 2012;10:157–170. doi: 10.1016/j.stem.2011.12.017. [DOI] [PMC free article] [PubMed] [Google Scholar]
- Buckley SM, Aranda-Orgilles B, Strikoudis A, Apostolou E, Loizou E, Moran-Crusio K, Farnsworth CL, Koller AA, Dasgupta R, Silva JC, Stadtfeld M, Hochedlinger K, Chen EI, Aifantis I. Regulation of pluripotency and cellular reprogramming by the ubiquitin-proteasome system. Cell Stem Cell. 2012;11:783–798. doi: 10.1016/j.stem.2012.09.011. [DOI] [PMC free article] [PubMed] [Google Scholar]
- Buenrostro JD, Wu B, Chang HY, Greenleaf WJ. ATAC-seq: A Method for Assaying Chromatin Accessibility Genome-Wide. Curr Protoc Mol Biol. 2015;109:21.29.1–21.29.9. doi: 10.1002/0471142727.mb2129s109. [DOI] [PMC free article] [PubMed] [Google Scholar]
- Bulut-Karslioglu A, Biechele S, Jin H, Macrae TA, Hejna M, Gertsenstein M, Song JS, Ramalho-Santos M. Inhibition of mTOR induces a paused pluripotent state. Nature. 2016;540:119–123. doi: 10.1038/nature20578. [DOI] [PMC free article] [PubMed] [Google Scholar]
- Bulut-Karslioglu A, De La Rosa-Velázquez IA, Ramirez F, Barenboim M, Onishi-Seebacher M, Arand J, Galán C, Winter GE, Engist B, Gerle B, O’Sullivan RJ, Martens JHA, Walter J, Manke T, Lachner M, Jenuwein T. Suv39h-Dependent H3K9me3 Marks Intact Retrotransposons and Silences LINE Elements in Mouse Embryonic Stem Cells. Molecular Cell. 2014;55:277–290. doi: 10.1016/j.molcel.2014.05.029. [DOI] [PubMed] [Google Scholar]
- Calo E, Wysocka J. Modification of enhancer chromatin: what, how, and why? Molecular Cell. 2013;49:825–837. doi: 10.1016/j.molcel.2013.01.038. [DOI] [PMC free article] [PubMed] [Google Scholar]
- Carpenter AE, Jones TR, Lamprecht MR, Clarke C, Kang IH, Friman O, Guertin DA, Chang JH, Lindquist RA, Moffat J, Golland P, Sabatini DM. CellProfiler: image analysis software for identifying and quantifying cell phenotypes. Genome Biol. 2006;7:R100. doi: 10.1186/gb-2006-7-10-r100. [DOI] [PMC free article] [PubMed] [Google Scholar]
- Chen ZY, Wang X, Zhou Y, Offner G, Tseng C-C. Destabilization of Krüppel-like factor 4 protein in response to serum stimulation involves the ubiquitin-proteasome pathway. Cancer Res. 2005;65:10394–10400. doi: 10.1158/0008-5472.CAN-05-2059. [DOI] [PubMed] [Google Scholar]
- Crump NT, Hazzalin CA, Bowers EM, Alani RM, Cole PA, Mahadevan LC. Dynamic acetylation of all lysine-4 trimethylated histone H3 is evolutionarily conserved and mediated by p300/CBP. Proc Natl Acad Sci USA. 2011;108:7814–7819. doi: 10.1073/pnas.1100099108. [DOI] [PMC free article] [PubMed] [Google Scholar]
- Denissov S, Hofemeister H, Marks H, Kranz A, Ciotta G, Singh S, Anastassiadis K, Stunnenberg HG, Stewart AF. Mll2 is required for H3K4 trimethylation on bivalent promoters in embryonic stem cells, whereas Mll1 is redundant. Development. 2014;141:526–537. doi: 10.1242/dev.102681. [DOI] [PubMed] [Google Scholar]
- Diaz AA, Qin H, Ramalho-Santos M, Song JS. HiTSelect: a comprehensive tool for high-complexity-pooled screen analysis. Nucleic Acids Res. 2015;43:e16–e16. doi: 10.1093/nar/gku1197. [DOI] [PMC free article] [PubMed] [Google Scholar]
- Efroni S, Duttagupta R, Cheng J, Dehghani H, Hoeppner DJ, Dash C, Bazett-Jones DP, Le Grice S, McKay RDG, Buetow KH, Gingeras TR, Misteli T, Meshorer E. Global Transcription in Pluripotent Embryonic Stem Cells. Cell Stem Cell. 2008;2:437–447. doi: 10.1016/j.stem.2008.03.021. [DOI] [PMC free article] [PubMed] [Google Scholar]
- ENCODE Project Consortium. An integrated encyclopedia of DNA elements in the human genome. Nature. 2012;489:57–74. doi: 10.1038/nature11247. [DOI] [PMC free article] [PubMed] [Google Scholar]
- Fazzio TG, Huff JT, Panning B. An RNAi screen of chromatin proteins identifies Tip60-p400 as a regulator of embryonic stem cell identity. Cell. 2008;134:162–174. doi: 10.1016/j.cell.2008.05.031. [DOI] [PMC free article] [PubMed] [Google Scholar]
- Flanagan JF, Mi LZ, Chruszcz M, Cymborowski M, Clines KL, Kim Y, Minor W, Rastinejad F, Khorasanizadeh S. Double chromodomains cooperate to recognize the methylated histone H3 tail. Nature. 2005;438:1181–1185. doi: 10.1038/nature04290. [DOI] [PubMed] [Google Scholar]
- Frerichs KU, Smith CB, Brenner M, DeGracia DJ, Krause GS, Marrone L, Dever TE, Hallenbeck JM. Suppression of protein synthesis in brain during hibernation involves inhibition of protein initiation and elongation. Proc Natl Acad Sci USA. 1998;95:14511–14516. doi: 10.1073/pnas.95.24.14511. [DOI] [PMC free article] [PubMed] [Google Scholar]
- Gaspar-Maia A, Alajem A, Meshorer E, Ramalho-Santos M. Open chromatin in pluripotency and reprogramming. Nat Rev Mol Cell Biol. 2011;12:36–47. doi: 10.1038/nrm3036. [DOI] [PMC free article] [PubMed] [Google Scholar]
- Gaspar-Maia A, Alajem A, Polesso F, Sridharan R, Mason MJ, Heidersbach A, Ramalho-Santos J, McManus MT, Plath K, Meshorer E, Ramalho-Santos M. Chd1 regulates open chromatin and pluripotency of embryonic stem cells. Nature. 2009;460:863–868. doi: 10.1038/nature08212. [DOI] [PMC free article] [PubMed] [Google Scholar]
- Goldberg AD, Banaszynski LA, Noh KM, Lewis PW, Elsaesser SJ, Stadler S, Dewell S, Law M, Guo X, Li X, Wen D, Chapgier A, DeKelver RC, Miller JC, Lee YL, Boydston EA, Holmes MC, Gregory PD, Greally JM, Rafii S, Yang C, Scambler PJ, Garrick D, Gibbons RJ, Higgs DR, Cristea IM, Urnov FD, Zheng D, Allis CD. Distinct factors control histone variant H3.3 localization at specific genomic regions. Cell. 2010;140:678–691. doi: 10.1016/j.cell.2010.01.003. [DOI] [PMC free article] [PubMed] [Google Scholar]
- Guan S, Price JC, Prusiner SB, Ghaemmaghami S, Burlingame AL. A data processing pipeline for mammalian proteome dynamics studies using stable isotope metabolic labeling. Mol Cell Proteomics. 2011;10:M111010728. doi: 10.1074/mcp.M111.010728. [DOI] [PMC free article] [PubMed] [Google Scholar]
- Guzman-Ayala M, Sachs M, Koh FM, Onodera C, Bulut-Karslioglu A, Lin CJ, Wong P, Nitta R, Song JS, Ramalho-Santos M. Chd1 is essential for the high transcriptional output and rapid growth of the mouse epiblast. Development. 2014;142:118–127. doi: 10.1242/dev.114843. [DOI] [PMC free article] [PubMed] [Google Scholar]
- Heinz S, Benner C, Spann N, Bertolino E, Lin YC, Laslo P, Cheng JX, Murre C, Singh H, Glass CK. Simple combinations of lineage-determining transcription factors prime cis-regulatory elements required for macrophage and B cell identities. Molecular Cell. 2010;38:576–589. doi: 10.1016/j.molcel.2010.05.004. [DOI] [PMC free article] [PubMed] [Google Scholar]
- Hooper M, Hardy K, Handyside A, Hunter S, Monk M. HPRT-deficient (Lesch-Nyhan) mouse embryos derived from germline colonization by cultured cells. Nature. 1987;326:292–295. doi: 10.1038/326292a0. [DOI] [PubMed] [Google Scholar]
- Huber W, Carey VJ, Gentleman R, Anders S, Carlson M, Carvalho BS, Bravo HC, Davis S, Gatto L, Girke T, Gottardo R, Hahne F, Hansen KD, Irizarry RA, Lawrence M, Love MI, MacDonald J, Obenchain V, Oleś AK, Pagès H, Reyes A, Shannon P, Smyth GK, Tenenbaum D, Waldron L, Morgan M. Orchestrating high-throughput genomic analysis with Bioconductor. Nature Methods. 2015;12:115–121. doi: 10.1038/nmeth.3252. [DOI] [PMC free article] [PubMed] [Google Scholar]
- Hudlebusch HR, Skotte J, Santoni-Rugiu E, Zimling ZG, Lees MJ, Simon R, Sauter G, Rota R, De Ioris MA, Quarto M, Johansen JV, Jørgensen M, Rechnitzer C, Maroun LL, Schrøder H, Petersen BL, Helin K. MMSET is highly expressed and associated with aggressiveness in neuroblastoma. Cancer Res. 2011;71:4226–4235. doi: 10.1158/0008-5472.CAN-10-3810. [DOI] [PubMed] [Google Scholar]
- Jin C, Zang C, Wei G, Cui K, Peng W, Zhao K, Felsenfeld G. H3.3/H2A.Z double variant-containing nucleosomes mark “nucleosome-free regions” of active promoters and other regulatory regions. Nat Genet. 2009;41:941–945. doi: 10.1038/ng.409. [DOI] [PMC free article] [PubMed] [Google Scholar]
- Jolly LA, Taylor V, Wood SA. USP9X enhances the polarity and self-renewal of embryonic stem cell-derived neural progenitors. Mol Biol Cell. 2009;20:2015–2029. doi: 10.1091/mbc.E08-06-0596. [DOI] [PMC free article] [PubMed] [Google Scholar]
- Karolchik D, Hinrichs AS, Furey TS, Roskin KM, Sugnet CW, Haussler D, Kent WJ. The UCSC Table Browser data retrieval tool. Nucleic Acids Res. 2004;32:D493–6. doi: 10.1093/nar/gkh103. [DOI] [PMC free article] [PubMed] [Google Scholar]
- Koh FM, Lizama CO, Wong P, Hawkins JS, Zovein AC, Ramalho-Santos M. Emergence of hematopoietic stem and progenitor cells involves a Chd1-dependent increase in total nascent transcription. Proc Natl Acad Sci USA. 2015;112:E1734–43. doi: 10.1073/pnas.1424850112. [DOI] [PMC free article] [PubMed] [Google Scholar]
- Ku M, Jaffe JD, Koche RP, Rheinbay E, Endoh M, Koseki H, Carr SA, Bernstein BE. H2A.Z landscapes and dual modifications in pluripotent and multipotent stem cells underlie complex genome regulatory functions. Genome Biol. 2012;13:R85. doi: 10.1186/gb-2012-13-10-r85. [DOI] [PMC free article] [PubMed] [Google Scholar]
- Langmead B, Salzberg SL. Fast gapped-read alignment with Bowtie 2. Nature Methods. 2012;9:357–359. doi: 10.1038/nmeth.1923. [DOI] [PMC free article] [PubMed] [Google Scholar]
- Laplante M, Sabatini DM. mTOR signaling in growth control and disease. Cell. 2012;149:274–293. doi: 10.1016/j.cell.2012.03.017. [DOI] [PMC free article] [PubMed] [Google Scholar]
- Lee JH, Hart SRL, Skalnik DG. Histone deacetylase activity is required for embryonic stem cell differentiation. Genesis. 2004;38:32–38. doi: 10.1002/gene.10250. [DOI] [PubMed] [Google Scholar]
- Li B, Jackson J, Simon MD, Fleharty B, Gogol M, Seidel C, Workman JL, Shilatifard A. Histone H3 lysine 36 dimethylation (H3K36me2) is sufficient to recruit the Rpd3s histone deacetylase complex and to repress spurious transcription. J Biol Chem. 2009;284:7970–7976. doi: 10.1074/jbc.M808220200. [DOI] [PMC free article] [PubMed] [Google Scholar]
- Li H, Handsaker B, Wysoker A, Fennell T, Ruan J, Homer N, Marth G, Abecasis G, Durbin R 1000 Genome Project Data Processing Subgroup. The Sequence Alignment/Map format and SAMtools. Bioinformatics. 2009;25:2078–2079. doi: 10.1093/bioinformatics/btp352. [DOI] [PMC free article] [PubMed] [Google Scholar]
- Li X, Li L, Pandey R, Byun JS, Gardner K, Qin Z, Dou Y. The histone acetyltransferase MOF is a key regulator of the embryonic stem cell core transcriptional network. Cell Stem Cell. 2012;11:163–178. doi: 10.1016/j.stem.2012.04.023. [DOI] [PMC free article] [PubMed] [Google Scholar]
- Liao Y, Smyth GK, Shi W. The Subread aligner: fast, accurate and scalable read mapping by seed-and-vote. Nucleic Acids Res. 2013;41:e108–e108. doi: 10.1093/nar/gkt214. [DOI] [PMC free article] [PubMed] [Google Scholar]
- McKnight JN, Boerma JW, Breeden LL, Tsukiyama T. Global Promoter Targeting of a Conserved Lysine Deacetylase for Transcriptional Shutoff during Quiescence Entry. Molecular Cell. 2015;59:732–743. doi: 10.1016/j.molcel.2015.07.014. [DOI] [PMC free article] [PubMed] [Google Scholar]
- McLean CY, Bristor D, Hiller M, Clarke SL, Schaar BT, Lowe CB, Wenger AM, Bejerano G. GREAT improves functional interpretation of cis-regulatory regions. Nat Biotechnol. 2010;28:495–501. doi: 10.1038/nbt.1630. [DOI] [PMC free article] [PubMed] [Google Scholar]
- Melcer S, Hezroni H, Rand E, Nissim-Rafinia M, Skoultchi A, Stewart CL, Bustin M, Meshorer E. Histone modifications and lamin A regulate chromatin protein dynamics in early embryonic stem cell differentiation. Nat Comms. 2012;3:910. doi: 10.1038/ncomms1915. [DOI] [PMC free article] [PubMed] [Google Scholar]
- Meshorer E, Yellajoshula D, George E, Scambler PJ, Brown DT, Misteli T. Hyperdynamic plasticity of chromatin proteins in pluripotent embryonic stem cells. Developmental Cell. 2006;10:105–116. doi: 10.1016/j.devcel.2005.10.017. [DOI] [PMC free article] [PubMed] [Google Scholar]
- Méndez J, Stillman B. Chromatin association of human origin recognition complex, cdc6, and minichromosome maintenance proteins during the cell cycle: assembly of prereplication complexes in late mitosis. Mol Cell Biol. 2000;20:8602–8612. doi: 10.1128/mcb.20.22.8602-8612.2000. [DOI] [PMC free article] [PubMed] [Google Scholar]
- Mishima Y, Miyagi S, Saraya A, Negishi M, Endoh M, Endo TA, Toyoda T, Shinga J, Katsumoto T, Chiba T, Yamaguchi N, Kitabayashi I, Koseki H, Iwama A. The Hbo1-Brd1/Brpf2 complex is responsible for global acetylation of H3K14 and required for fetal liver erythropoiesis. Blood. 2011;118:2443–2453. doi: 10.1182/blood-2011-01-331892. [DOI] [PubMed] [Google Scholar]
- Moussaieff A, Rouleau M, Kitsberg D, Cohen M, Levy G, Barasch D, Nemirovski A, Shen-Orr S, Laevsky I, Amit M, Bomze D, Elena-Herrmann B, Scherf T, Nissim-Rafinia M, Kempa S, Itskovitz-Eldor J, Meshorer E, Aberdam D, Nahmias Y. Glycolysis-mediated changes in acetyl-CoA and histone acetylation control the early differentiation of embryonic stem cells. Cell Metabolism. 2015;21:392–402. doi: 10.1016/j.cmet.2015.02.002. [DOI] [PubMed] [Google Scholar]
- Nagarajan P, Ge Z, Sirbu B, Doughty C, Agudelo Garcia PA, Schlederer M, Annunziato AT, Cortez D, Kenner L, Parthun MR. Histone acetyl transferase 1 is essential for mammalian development, genome stability, and the processing of newly synthesized histones H3 and H4. PLoS Genet. 2013;9:e1003518. doi: 10.1371/journal.pgen.1003518. [DOI] [PMC free article] [PubMed] [Google Scholar]
- Nora EP, Goloborodko A, Valton AL, Gibcus JH, Uebersohn A, Abdennur N, Dekker J, Mirny LA, Bruneau BG. Targeted Degradation of CTCF Decouples Local Insulation of Chromosome Domains from Genomic Compartmentalization. Cell. 2017;169:930–944. e22. doi: 10.1016/j.cell.2017.05.004. [DOI] [PMC free article] [PubMed] [Google Scholar]
- Olsnes S. Toxic proteins inhibiting protein synthesis. Naturwissenschaften. 1972;59:497–502. doi: 10.1007/BF00609814. [DOI] [PubMed] [Google Scholar]
- Orlando DA, Chen MW, Brown VE, Solanki S, Choi YJ, Olson ER, Fritz CC, Bradner JE, Guenther MG. Quantitative ChIP-Seq normalization reveals global modulation of the epigenome. Cell Rep. 2014;9:1163–1170. doi: 10.1016/j.celrep.2014.10.018. [DOI] [PubMed] [Google Scholar]
- Pantaleon M, Kanai-Azuma M, Mattick JS, Kaibuchi K, Kaye PL, Wood SA. FAM deubiquitylating enzyme is essential for preimplantation mouse embryo development. Mech Dev. 2001;109:151–160. doi: 10.1016/s0925-4773(01)00551-2. [DOI] [PubMed] [Google Scholar]
- Percharde M, Bulut-Karslioglu A, Ramalho-Santos M. Hypertranscription in Development, Stem Cells, and Regeneration. Developmental Cell. 2017a;40:9–21. doi: 10.1016/j.devcel.2016.11.010. [DOI] [PMC free article] [PubMed] [Google Scholar]
- Percharde M, Wong P, Ramalho-Santos M. Global Hypertranscription in the Mouse Embryonic Germline. Cell Rep. 2017b;19:1987–1996. doi: 10.1016/j.celrep.2017.05.036. [DOI] [PMC free article] [PubMed] [Google Scholar]
- Pungaliya P, Kulkarni D, Park H-J, Marshall H, Zheng H, Lackland H, Saleem A, Rubin EH. TOPORS functions as a SUMO-1 E3 ligase for chromatin-modifying proteins. J Proteome Res. 2007;6:3918–3923. doi: 10.1021/pr0703674. [DOI] [PubMed] [Google Scholar]
- Qin H, Diaz A, Blouin L, Lebbink RJ, Patena W, Tanbun P, LeProust EM, McManus MT, Song JS, Ramalho-Santos M. Systematic identification of barriers to human iPSC generation. Cell. 2014;158:449–461. doi: 10.1016/j.cell.2014.05.040. [DOI] [PMC free article] [PubMed] [Google Scholar]
- Ramirez F, Ryan DP, Grüning B, Bhardwaj V, Kilpert F, Richter AS, Heyne S, Dündar F, Manke T. deepTools2: a next generation web server for deep-sequencing data analysis. Nucleic Acids Res. 2016;44:W160–5. doi: 10.1093/nar/gkw257. [DOI] [PMC free article] [PubMed] [Google Scholar]
- Sampath P, Pritchard DK, Pabon L, Reinecke H, Schwartz SM, Morris DR, Murry CE. A Hierarchical Network Controls Protein Translation during Murine Embryonic Stem Cell Self-Renewal and Differentiation. Cell Stem Cell. 2008;2:448–460. doi: 10.1016/j.stem.2008.03.013. [DOI] [PubMed] [Google Scholar]
- Schwanhäusser B, Busse D, Li N, Dittmar G, Schuchhardt J, Wolf J, Chen W, Selbach M. Global quantification of mammalian gene expression control. Nature. 2011;473:337–342. doi: 10.1038/nature10098. [DOI] [PubMed] [Google Scholar]
- Scognamiglio R, Cabezas-Wallscheid N, Thier MC, Altamura S, Reyes A, Prendergast ÁM, Baumgärtner D, Carnevalli LS, Atzberger A, Haas S, von Paleske L, Boroviak T, Wörsdörfer P, Essers MAG, Kloz U, Eisenman RN, Edenhofer F, Bertone P, Huber W, van der Hoeven F, Smith A, Trumpp A. Myc Depletion Induces a Pluripotent Dormant State Mimicking Diapause. Cell. 2016;164:668–680. doi: 10.1016/j.cell.2015.12.033. [DOI] [PMC free article] [PubMed] [Google Scholar]
- Sheikh BN, Bechtel-Walz W, Lucci J, Karpiuk O, Hild I, Hartleben B, Vornweg J, Helmstädter M, Sahyoun AH, Bhardwaj V, Stehle T, Diehl S, Kretz O, Voss AK, Thomas T, Manke T, Huber TB, Akhtar A. MOF maintains transcriptional programs regulating cellular stress response. Oncogene. 2016;35:2698–2710. doi: 10.1038/onc.2015.335. [DOI] [PMC free article] [PubMed] [Google Scholar]
- Signer RAJ, Magee JA, Salic A, Morrison SJ. Haematopoietic stem cells require a highly regulated protein synthesis rate. Nature. 2014;509:49–54. doi: 10.1038/nature13035. [DOI] [PMC free article] [PubMed] [Google Scholar]
- Smith A. Formative pluripotency: the executive phase in a developmental continuum. Development. 2017;144:365–373. doi: 10.1242/dev.142679. [DOI] [PMC free article] [PubMed] [Google Scholar]
- Tsang CK, Bertram PG, Ai W, Drenan R, Zheng XFS. Chromatin-mediated regulation of nucleolar structure and RNA Pol I localization by TOR. EMBO J. 2003;22:6045–6056. doi: 10.1093/emboj/cdg578. [DOI] [PMC free article] [PubMed] [Google Scholar]
- Unnikrishnan A, Gafken PR, Tsukiyama T. Dynamic changes in histone acetylation regulate origins of DNA replication. Nat Struct Mol Biol. 2010;17:430–437. doi: 10.1038/nsmb.1780. [DOI] [PMC free article] [PubMed] [Google Scholar]
- Valouev A, Johnson SM, Boyd SD, Smith CL, Fire AZ, Sidow A. Determinants of nucleosome organization in primary human cells. Nature. 2011;474:516–520. doi: 10.1038/nature10002. [DOI] [PMC free article] [PubMed] [Google Scholar]
- Vilchez D, Boyer L, Morantte I, Lutz M, Merkwirth C, Joyce D, Spencer B, Page L, Masliah E, Berggren WT, Gage FH, Dillin A. Increased proteasome activity in human embryonic stem cells is regulated by PSMD11. Nature. 2012;489:304–308. doi: 10.1038/nature11468. [DOI] [PMC free article] [PubMed] [Google Scholar]
- Wan M, Liang J, Xiong Y, Shi F, Zhang Y, Lu W, He Q, Yang D, Chen R, Liu D, Barton M, Songyang Z. The trithorax group protein Ash2l is essential for pluripotency and maintaining open chromatin in embryonic stem cells. J Biol Chem. 2013;288:5039–5048. doi: 10.1074/jbc.M112.424515. [DOI] [PMC free article] [PubMed] [Google Scholar]
- Wang L, Du Y, Ward JM, Shimbo T, Lackford B, Zheng X, Miao YL, Zhou B, Han L, Fargo DC, Jothi R, Williams CJ, Wade PA, Hu G. INO80 facilitates pluripotency gene activation in embryonic stem cell self-renewal, reprogramming, and blastocyst development. Cell Stem Cell. 2014;14:575–591. doi: 10.1016/j.stem.2014.02.013. [DOI] [PMC free article] [PubMed] [Google Scholar]
- Ying QL, Wray J, Nichols J, Batlle-Morera L, Doble B, Woodgett J, Cohen P, Smith A. The ground state of embryonic stem cell self-renewal. Nature. 2008;453:519–523. doi: 10.1038/nature06968. [DOI] [PMC free article] [PubMed] [Google Scholar]
- Zhang Q, Shalaby NA, Buszczak M. Changes in rRNA transcription influence proliferation and cell fate within a stem cell lineage. Science. 2014;343:298–301. doi: 10.1126/science.1246384. [DOI] [PMC free article] [PubMed] [Google Scholar]
- Zhang Y, Liu T, Meyer CA, Eeckhoute J, Johnson DS, Bernstein BE, Nusbaum C, Myers RM, Brown M, Li W, Liu XS. Model-based analysis of ChIP-Seq (MACS) Genome Biol. 2008;9:R137. doi: 10.1186/gb-2008-9-9-r137. [DOI] [PMC free article] [PubMed] [Google Scholar]
Associated Data
This section collects any data citations, data availability statements, or supplementary materials included in this article.
Supplementary Materials
RNAi screen hits
Gene ontology analysis of RNAi screen results
Oligonucleotide sequences
List of SILAC-MS-identified proteins
Gene ontology analysis of proteins depleted or enriched upon CHX treatment identified by SILAC-MS
List of 60 unstable euchromatin regulators
Coordinates of ATAC-seq peaks and gene ontology analyses