

SUMMARY
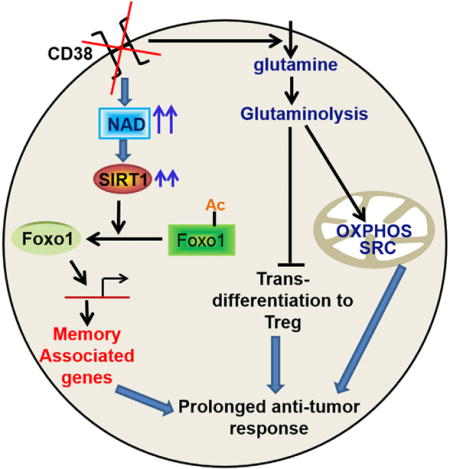
Heightened effector function and prolonged persistence, the key attributes of Th1 and Th17 cells, respectively, are key features of potent anti-tumor T cells. Here, we established ex vivo culture conditions to generate hybrid Th1/17 cells, which persisted long-term in vivo while maintaining their effector function. Using transcriptomics and metabolic profiling approaches, we showed that the enhanced anti-tumor property of Th1/17 cells was dependent on the increased NAD+-dependent activity of the histone deacetylase Sirt1. Pharmacological or genetic inhibition of Sirt1 activity impaired the anti-tumor potential of Th1/17 cells. Importantly, T cells with reduced surface expression of the NADase CD38 exhibited intrinsically higher NAD+, enhanced oxidative phosphorylation, higher glutaminolysis, and altered mitochondrial dynamics that vastly improved tumor control. Lastly, blocking CD38 expression improved tumor control even when using Th0 anti-tumor T cells. Thus, strategies targeting the CD38-NAD+ axis could increase the efficacy of anti-tumor adoptive T cell therapy.
Graphical abstract
INTRODUCTION
Adoptive T cell therapy (ACT) is a powerful strategy for controlling cancer (Rosenberg and Restifo, 2015). Yet, elimination of an established tumor is hampered either due to loss of T cell effector function or its survival (Crompton et al., 2014). Therefore, strategies to increase persistence and sustain effector function of the anti-tumor T cells are of immense importance. Several strategies including duration of expansion, using different cytokines (IL2, IL15, IL21) (Redeker and Arens, 2016), and employing different helper T (Th) or cytotoxic T (Tc) subsets programed ex vivo (Th1 or Tc1, Th9 or Tc9, Th17 or Tc17) (Emtage et al., 2003; Lu et al., 2012; Muranski et al., 2008) have been tested to improve the efficacy of ACT. While each one of these strategies results in a unique effector signature and shows an incremental improvement in tumor control (Lu et al., 2012; Muranski et al., 2008; Tsung et al., 1997), efforts to incorporate optimal anti-tumor attributes of these strategies into one effector population has yet to be achieved.
Recently, Th17 cells gained increased attention in cancer immunotherapy because their “stem cell-like” characteristics enable them to persist longer in the host (Kryczek et al., 2011; Muranski et al., 2011). Paradoxically, the anti-tumor potential of Th17 cells depend on the ability to secrete IFNg, the signature cytokine of Th1 cells (Muranski et al., 2008). Thus, the culture conditions that would merge “effector cytokine function” of Th1 cells along with the “stem cell-like phenotype” of the Th17 cells would be highly advantageous for ACT.
Metabolic reprogramming that accompanies activation of T cell is an important determinant of T cells’ fate (Buck et al., 2015). While effector T cell exhibit increased aerobic glycolysis (Caro-Maldonado et al., 2012), memory T cells utilize oxidative phosphorylation (OXPHOS) (van der Windt and Pearce, 2012). Furthermore, molecules such as AMPK (Rolf et al., 2013), HIF1a (Doedens et al., 2013), and Foxo1 (Hess Michelini et al., 2013; Rao et al., 2012) dictate the balance between effector and memory T cells. The dependence of memory T cells on fatty acid oxidation and lysosomal lipolysis (Chang and Pearce, 2016) has also been shown. In addition to mitochondrial biogenesis, the quality of the mitochondria as observed by the cristae organization could also influence T cell fitness and ability to control tumors (Buck et al., 2016). However, it remains to be determined if there exists a central switch that regulates these intertwined processes.
In order to obtain robust tumor control, we hypothesized that T cells programmed to display a combination of effector (as in Th1) and stemness (as in Th17) phenotypes would enhance the efficacy of ACT. Our data demonstrate that hybrid Th1/17 cells persisted long-term in vivo while maintaining their effector function, and their anti-tumor potential was dependent on enhanced levels of nicotinamide adenine dinucleotide (NAD+), a key substrate of deacetylase Sirt1. Importantly, CD38, a NAD+ hydrolase that inversely correlates to NAD+ levels (Chini, 2009), is co-expressed with exhaustion marker PD1, and CD38 inhibition led to metabolic reprograming of T cells with superior tumor control.
RESULTS
Combined Culture Conditions of Th1 and Th17 Cells Generate Hybrid Th1/17 Cells
To merge the best functional traits of Th1 to Th17 cells, we modified the culture condition of Th17IL1β+TGFβ cells (generated in presence of IL1β plus low dose of TGFβ), since they exhibited superior anti-tumor response as compared to conventional Th17 cells (generated in the presence of TGFβ) due to reduced ectonucleotidase expression (Chatterjee et al., 2014). We observed that combining the culture conditions of Th17IL1β+TGFβ (IL6, IL1β, IL23, TGFβlo) and Th1 cells (with IL12) resulted in hybrid Th1/17 cells, which not only co-express elevated levels of IFNγ and IL17 (Figures 1A, S1A, and S1B) but also exhibit phenotypic signature akin to the pathogenic Th17 cells (Lee et al., 2012). The hybrid Th1/17 cells displayed intermediate levels of both Th1 and Th17 signature transcription factors (T-bet, RORγ, IRF-4) (Figure 1B), chemokine receptors (CXCR3, CCR6) (Figure 1C), effectors (GzmB, Tbx21, GM-CSF), and stemness-associated genes (IL22, IL23R, TCF7, BCL6, β-catenin) (Figure 1D), along with TCR restimulation induced cell death (Figure 1E). Taken together, this data confirm that the unique ex vivo programming condition can generate hybrid Th1/17 cells with the best characteristics of Th1 and Th17 cells.
Figure 1. Hybrid Th1/17 Cells Possess Traits of Both Th1 and Th17 Cells.
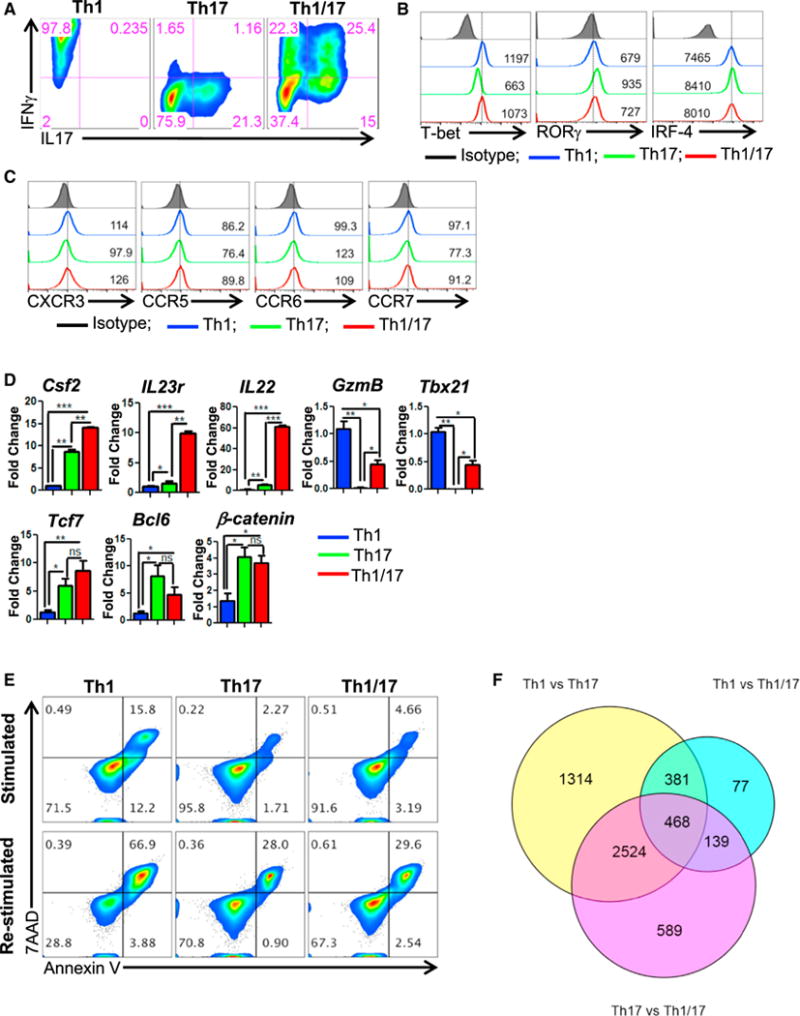
(A–D) The in vitro differentiated Th1, Th17, and hybrid Th1/17 cells were characterized for (A–C) flow cytometry analysis of (A) intracellular cytokine secretion, (B) Th subset signature transcription factors, (C) Th subset signature chemokine receptor, and (D) qPCR-based mRNA levels for key effector (upper panel) and stemness associated genes (lower panel).
(E) Activation induced cell death of different Th subsets after overnight restimulation with anti-CD3 and anti-CD28 antibody.
(F) Venn diagram representing the transcripts (obtained after Illumina bead-array) from Th1, Th17, and Th1/17 comparison. *p < 0.05, **p < 0.01, and ***p < 0.005. Also see Figure S1.
Next, a comparative Illumina microarray analysis showed that 589 genes were exclusively expressed in hybrid Th1/17 cells (Figure 1F), with Th1/17 cells exhibiting dominant Th1 or Th17 genes. For instance, analysis of IL12 signaling-related molecules shows that hybrid Th1/17 programming results in upregulation of STAT4 and higher levels of the IL12 receptor component, IL12Rb2, which is normally reduced in Th17 cells (Figure S1C). Given the role of IL18 in immunosuppression (Terme et al., 2011), Hlx in maintaining a heritable Th1 gene expression (Mullen et al., 2002), and CCL3-CXCR3 circuit in trafficking of T cells to sites of inflammation (Lord et al., 2005), we proposed that this unique molecular signature would be advantageous in exhibiting reduced susceptibility of hybrid Th1/17 cells to immunosuppression and increased anti-tumor activity. Further, a unique metabolic and T cell signaling pathway gene expression was also observed in hybrid Th1/17 cells (Figure S1D).
Hybrid Th1/17 Cells Exhibit Enhanced Anti-Tumor Potential
A comparative determination of the anti-tumor property between Th1, Th17 or Th1/17 cells differentiated ex vivo using melanoma epitope tyrosinase reactive CD4+ T cells obtained from h3T TCR transgenic mice (Mehrotra et al., 2012), showed that adoptive transfer of hybrid Th1/17 cells exhibit superior tumor control as compared to Th1, Th17 (Figure 2A) or even Th17IL1β+TGFβ cells (Figure S2A). Administering anti-IFNγ or anti-IL17 antibody to the recipient mice along with ACT showed that IL17 neutralization had minimal effect on B16 tumor progression, at least during the initial three weeks, whereas blocking of IFNγ completely diminished the anti-tumor potential of Th1/17 cells (Figure 2B). This indicates that IFNγ is indispensable for the anti-tumor response of Th1/17 cells. Further, hybrid Th1/17 cells generated using a different tumor epitope, tyrosinase-related protein-1 (TRP-1) TCR, were also better than Th1 or Th17 cell in treating metastatic lung tumors (Figure 2C). Importantly, tumor-free mice when re-challenged with the same tumor did not show any tumor growth until 150 days, the latest time point observed, and instead developed vitiligo, (Figure 2C, right lower panel), while maintaining IFNg signature (Figure 2D). This indicates the sustained lytic activity of the adoptively transferred T cells against TRP-1 antigen which is also expressed by the melanocytes. Moreover, the anti-tumor property of hybrid Th1/17 was independent upon endogenous immune cells, as it also controlled tumor effectively in Rag1−/− recipients (Figures S2B and S2C). The direct tumoricidal activity of the Th1/17 cells is explained by their ability to enhance MHC Class II expression on B16 melanoma cells, after melanoma epitope TRP-1 specific T cells differentiated to either Th1 or Th17 or Th1/17 were co-cultured in vitro with B16 tumor overnight (Figure S2D). A complete necropsy revealed that histologically there were no obvious pathological manifestation in the experimental animals, and any changes observed reflected physiological responses to the experiment (data not shown). The organ weight to body weight ratios was also compared and no significant differences were noticed between groups.
Figure 2. Hybrid Th1/17 Cells Exhibit Superior Anti-Tumor Response.
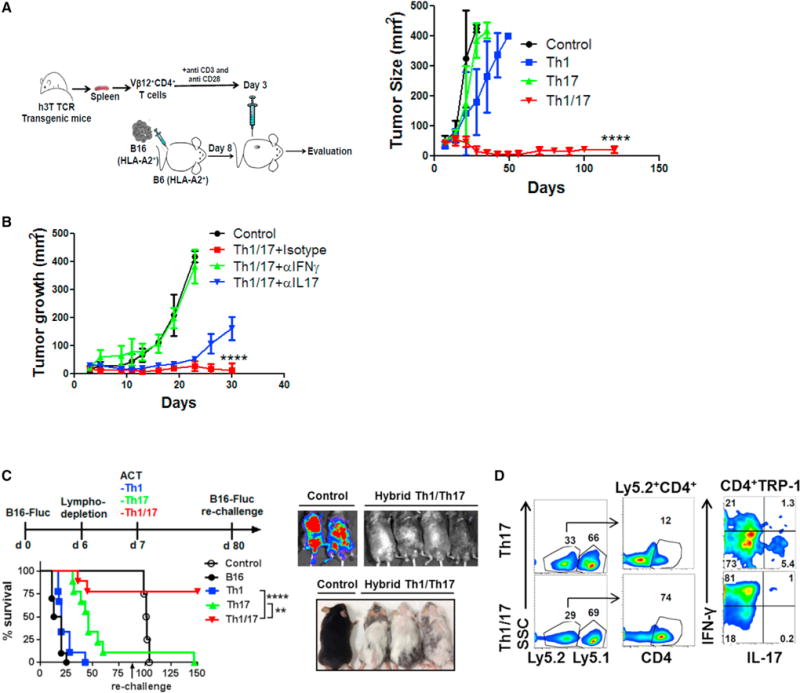
(A) Schematic presentation of the experimental strategy (left panel) and the differences observed in tumor growth (right panel) when subcutaneously established B16-A2 tumor in HLA-A+ mice (n = 8 mice/group) were treated by adoptively transferring tyrosinase reactive TIL1383I TCR transgenic T cells differentiated to Th1, Th17, and hybrid Th1/17 cells. Data demonstrate mean tumor size at each time point in one of the three experiments with similar results.
(B) C57BL/6 mice with 10 day subcutaneously established B16-F10 melanoma tumor were either kept untreated or treated by transferring 0.5 × 10⁶ TRP-1 Th1/17 cells. The treated group was subdivided to administer 100 μg neutralizing antibody against IFNγ, IL17, or isotype control Ab intraperitoneally every alternate day. Tumor growth curve for various groups with n = 4 is shown.
(C) C57BL/6 Ly5.1+ recipients were injected (i.v.) with 0.5 × 10⁶ luciferase-transduced B16-F10 (B16-Fluc) and following lympho-depletion (sub-lethally irradiation with 500 cGy) on day 6. Groups of mice were adoptively transferred with either 0.25 × 10⁶ TRP-1 Th1, Th17, or Th1/17 cells on day 7. Survival and tumor growth (left panel) were followed with bioluminescent imaging. On day 80, recipient mice were re-challenged by injecting 0.5 × 10⁶ B16-Fluc tumors. Survival and tumor growth were followed until day 150 by bioluminescent imaging (upper right). Lower right panel shows that mice receiving hybrid Th1/17 developed a strong vitiligo on the skin.
(D) Representative flow panel showed tumor-infiltrating lymphocytes (TILs) recovered from lung on day 150 from Ly5.1+ recipient mice and re-stimulated with PMA and Ionomycin for 4 hr in vitro to measure IFNγ and IL17 secretion. ****p < 0.0001. Also see Figures S2 and S3.
Given long-term tumor control observed with murine hybrid Th1/17 cells, similar strategies to generate hybrid Tc1/17 using class I restricted epitope reactive T cells also exhibited vastly improved tumor control as compared to Tc1 and Tc17 cells alone in both murine melanoma (using gp100 reactive T cells), and a spontaneous prostate tumor model (using Sv40 reactive T cells) (Figures S3A–S3H). Next, we determined if our ex vivo programming strategy has potential to generate tumor-reactive human T cells for ACT. Using purified CD4+ T cells from normal healthy donors we were able to generate human Th1/17 hybrid cells, as indicated by the IFNγ and IL17 cytokine profile (Figure S3I). Further, our data in Figure S3J shows that ex vivo programming of tumor infiltrating lymphocytes (TILs) obtained from a metastatic melanoma patient resulted in increased “stemness” features associated with our programming protocol.
Metabolically Unique Th1/17 Cells Depend upon Glutaminolysis
Metabolic commitment plays an important role in function and survival of T cells in a tumor microenvironment (Scharping et al., 2016; Sukumar et al., 2013). We observed that uptake of 2NBDG, a fluorescent glucose analog which indicates glycolytic commitment, was highest in Th1 cells followed by intermediate level in Th1/17 and lowest in Th17 cells (Th1 > Th1/17 > Th17) (Figure 3A). Similarly, extracellular acidification rate (ECAR) was also intermediate in Th1/17 cells relative to Th1 and Th17 cells (Figure 3B). This corresponds to the intermediate level of free GAPDH (Figure 3C), which inversely regulate IFNg by binding to the AU-rich elements within its 3′ UTR mRNA (Chang et al., 2013). Hybrid Th1/17 also exhibited intermediate expression of various glycolytic enzymes as determined by quantitative PCR (q-PCR) (Figure 3D). Th17 and Th1/17 cells showed lower expression of lactate dehydrogenase A (LDHA, converts pyruvate to lactate) and MCT4 (transports lactate out of the cell) as compared to Th1 cells, suggesting that pyruvate generated in glycolysis can be more efficiently integrated into the TCA cycle to fuel mitochondrial metabolism (Figure 3D). Additionally, mitochondrial oxygen consumption rate (OCR), an indicator of OXPHOS, was also intermediate in hybrid Th1/17 cells (Figures 3E and 3F). Notably, the Th17 and Th1/17 cells possessed a higher OCR/ECAR ratio as compared to Th1 cells (Figure 3G), indicating that Th17 and Th1/17 cells preferentially use OXPHOS, whereas Th1 cells mostly use glycolysis to fulfil their bioenergetic demands.
Figure 3. Hybrid Th1/17 Cells Are Metabolically Distinct from Th1 and Th17 Cells and Depend upon Glutaminolysis.
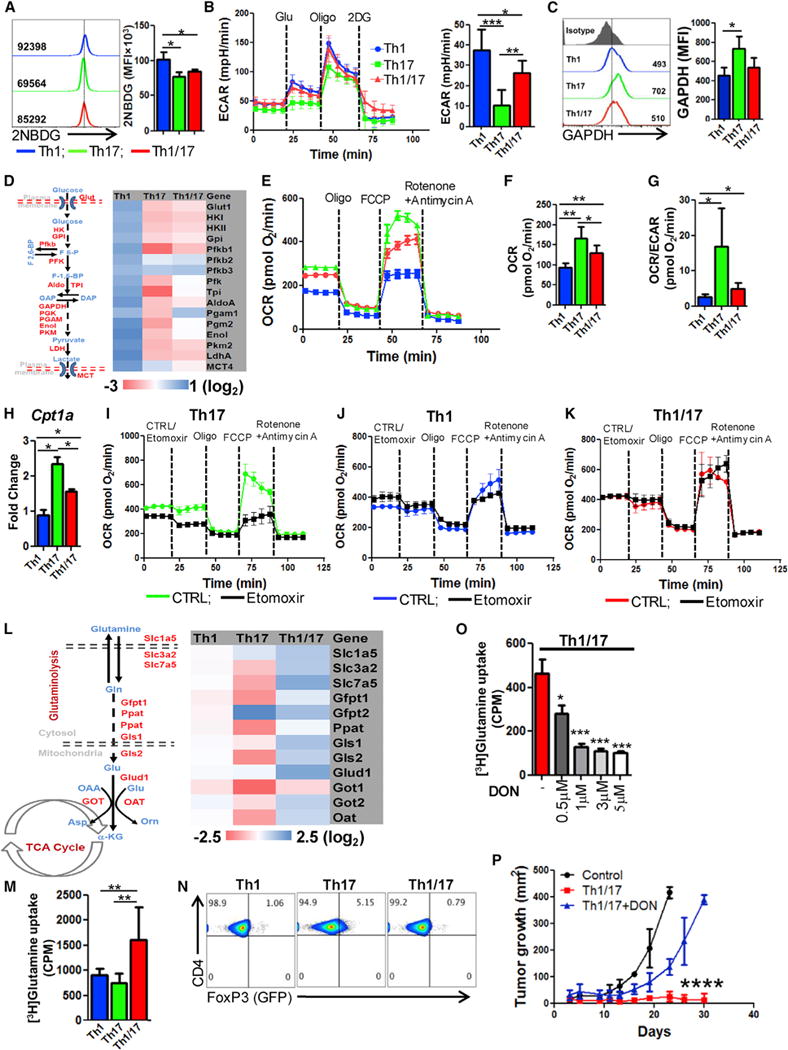
(A) The ex vivo programmed Th1, Th17, and Th1/17 cells were used to determine glucose uptake using 2NBDG. Adjacent bar diagram represents the cumulative data of mean fluorescence intensity (MFI) from three independent experiments.
(B) ECAR time course in response to glucose, oligomycin, and 2DG (left panel). Adjacent bar shows ECAR levels after glucose addition.
(C) Intracellular expression of GAPDH by FACS. Adjacent bar represents cumulative data from three experiments.
(D) Glycolysis associated genes using qPCR.
(E–G) Oxygen consumption rate (OCR) under basal condition and in response to indicated mitochondrial inhibitors. Graphs representing time course (E), basal OCR (F), and OCR/ECAR ratio (G).
(H) Expression of CTP1a using qPCR.
(I–K) OCR in presence or absence of etomoxir (200 μM) followed by the addition of various mitochondrial inhibitors as indicated in Th17 (I), Th1 (J), and Th1/17 (K).
(L) Expression of various glutaminolysis associated genes using qPCR.
(M) Uptake of radiolabelled glutamine that was measured in count per minute (CPM). Data are mean of four replicate samples from the three repeat experiments.
(N) FoxP3 expression in FoxP3-GFP knockin CD4+ T cells differentiated to Th1, Th17, and Th1/17 phenotype.
(O) Uptake of radiolabelled glutamine in Th1/17 cells cultured in presence of different conc. of DON. Representative data from one of three independent experiments are shown.
(P) TRP-1 Th1/17 cells differentiated in the presence of either vehicle control (DMSO) or DON (3 μM) were adoptively transferred (0.5 × 10⁶) in 9 days s.c. established B16-F10 melanoma tumor-bearing mice, and tumor growth was measured. Results for tumor area are the mean of measurements ± SD, from at least four mice per group. *p < 0.05, **p < 0.01, and ***p < 0.005. Also see Figure S4.
Since fatty acid oxidation (FAO) has been shown to modulate OXPHOS by providing acetyl-CoA, a substrate for TCA cycle, we evaluated the influence of FAO in affecting OXPHOS of different T cell subsets. Consistent with lower OXPHOS, mRNA level of CPT1a, a rate-limiting enzyme that regulates the entry of fatty acid from cytosol to mitochondria (Jogl et al., 2004), was significantly reduced in Th1 and Th1/17 cells as compared to Th17 cells (Figure 3H). Moreover, inhibition of CPT1a using etomoxir significantly depleted OCR and SRC values in Th17 cells (Figure 3I), whereas OXPHOS in Th1 and Th1/17 cells were mostly unaffected (Figures 3J and 3K), suggesting less dependence of Th1/17 cells on FAO as compared to Th17 cells in maintenance of high OXPHOS.
Because activation of T cells is also accompanied by the upregulation of glutamine catabolism that provides intermediates such as α-ketoglutarate which can be metabolised through TCA cycle to fuel OXPHOS (Newsholme et al., 1985), we next sought to determine the impact of glutaminolysis in the metabolic commitment of different T cell subsets. The genes associated with glutamine uptake (e.g., glutamine transporters Slc1a5, Slc3a2, and Slc7a5), and its catabolism were considerably higher in hybrid Th1/17 cells as compared to Th1 and Th17 cells (Figure 3L). Upon evaluating key glycolytic and glutamine pathway proteins analyzed using flow cytometry (Figures S4A–S4C), we observed lowest levels of free glycolytic enzymes indicating active glycolysis in Th1 cells (Figure S4A), while the Th1/17 cells exhibited the highest levels of glutamine transporters (Figure S4B) and lower level of free enzyme in glutamine pathway (Figure S4C). Immunoblot analysis also showed increased protein level of glutamine transporters and catabolic enzymes in Th1/17 cells (Figure S4D), indicating its increased dependence on glutamine metabolism. This suggests that higher glutaminolysis in Th1/17 cells could play a major role in maintaining high OXPHOS commitment. Importantly, increased incorporation of radio labeled glutamine in Th1/17 cells relative to Th1 and Th17 cells also confirmed glutaminolysis dependence of hybrid cells (Figure 3M).
The functional consequence of differential gluatamine metabolism in Th subsets was supported by the observation that Th17 cells with low glutaminolysis express a sizable population positive for FoxP3, whereas its expression is significantly reduced in Th1/17 with high glutaminolysis (Figure 3N). This is in accordance with the study that inefficient or reduced glutaminolysis promotes expression of FoxP3 in T cells (Klysz et al., 2015). Thus, increased glutaminolysis in hybrid Th1/17 cells likely contributes to reduced trans-differentiation to FoxP3+ phenotype and an effective tumor control.
To comprehensively determine the dependence of Th1/17 cells on glutaminolysis for its effector function and antitumor potential, we inhibited glutaminolysis in Th1/17 cells using 6-Diazo-5-oxo-L-norleucine (DON), a glutaminase inhibitor. Similar to 2DG which has been shown to affect IFNγ production by T cells (Chang et al., 2013), our data suggest that blocking of glutaminolysis also reduces the differentiation of Th1/17 cells as evident by reduction in IFNγ+IL-17+ secreting fraction (Figures S4E and S4F). Most importantly, effector molecules (Figure S4G) and the viability of Th1/17 cells was also reduced by 2-fold in Th1/17 cells as compared to Th1 or Th17 cell cultured in presence of DON (Figure S4H). Further, DON pre-treatment of Th1/17 cells not only reduced the uptake of radio labeled glutamine in a dose dependent manner (Figure 3O) but also showed significant attenuation of the anti-tumor response upon ACT (Figure 3P), likely due to reduced in vivo viability in absence of active glutaminolysis.
Increased Levels of Metabolite Nicotinamide Adenine Dinucleotide in Th1/17 Cells
A comprehensive evaluation of principle metabolites (using services from Metabolon) shows that hybrid Th1/17 cells possess a metabolite signature that is also intermediate between the Th1 and Th17 cells (Figure 4A). Figure 4B shows the panel of metabolites that were significantly different between the Th1, Th17, and Th1/17 cell groups. Consistent with our gene expression and metabolic flux data, metabolomic analysis also revealed that Th17 cells had higher level of acyl carnitine and propionylcarnitine required for FAO relative to Th1/17 cells (Figure 4B). Late TCA cycle intermediates like fumarate and malate were also higher in Th1/17 cells, which may indicate the preferential FAO in Th17 cells while increased pyruvate and glutamine oxidation in Th1/17 cells (Figure S4I).
Figure 4. Metabolite NAD+ Regulates Hybrid Th1/17 Cell Function.
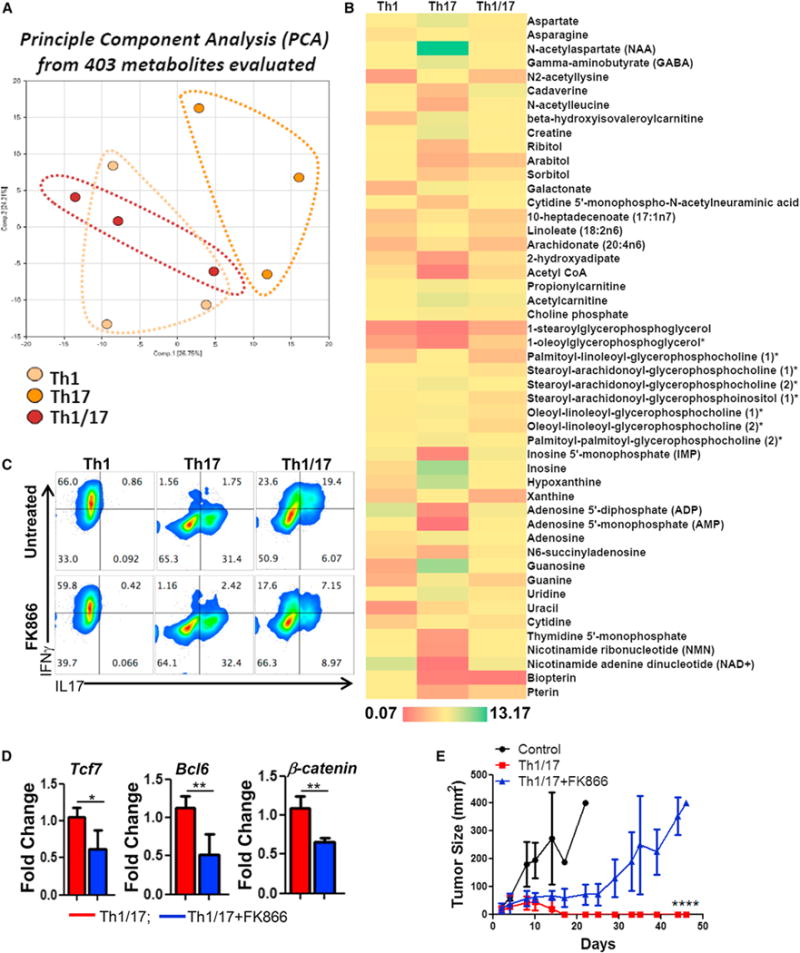
Purified CD4+ T cells differentiated to Th1, Th17, and Th1/17 were used for quantifying intracellular metabolite levels using mass spectrometry. The principle component analysis (PCA) is shown in (A), and (B) shows relative levels of metabolite. Th1, Th17, and Th1/17 cells differentiated in presence of either vehicle control (DMSO) or FK866 (10 nM) were used for determining (C) intracellular cytokine secretion by FACS, (D) expression of stemness-associated genes, and (E) ability to control growth of tumor s.c. established B16-F10-HLA-A2+ murine melanoma cells upon adoptive transfer. Tumor growth was measured using digital calipers every fourth day. Data demonstrate mean tumor size at each time point in one of the two experiments, with similar results. *p < 0.05, **p < 0.01, ***p < 0.005, and ****p < 0.0001. Also see Figure S4.
Interestingly, we found that there was a striking 34-fold increase in NAD+ levels in Th1/17 cells as compared to Th17 cells (Figure S4J). This was dependent on glutaminolysis since DON treatment significantly reduced NAD+ levels, whereas 2DG treatment increased the NAD+ level in Th1/17 cells (Figure S4K). Owing to the well-characterized role of NAD+ in regulating T cell proliferation, cytokine production and survival (Bruzzone et al., 2009; Tullius et al., 2014), we determined the impact of modulating NAD+ on Th1/17 cell function. We observed that depletion of NAD+ using FK866 (Figure S4L), an inhibitor of nicotinamide phosphoribosyltransferase (Nampt) that is required for the biosynthesis of NAD+ (Bruzzone et al., 2009) resulted in a 2-fold decrease in the frequency of IL17+IFNγ+ population in Th1/17 cells (Figure 4C) and reduced expression of stemness-associated molecules such as Tcf7, Bcl6, and β-catenin (Figure 4D). We also observed that FK866-treated Th1/17 cells failed to exhibit potent tumor control upon adoptive transfer as compared to untreated Th1/17 cells (Figure 4E), indicating that elevated levels of NAD+ in Th1/17 cells is required for the maintenance of their anti-tumor activity and viability in vivo.
NAD+-Sirt1 Axis Is Required to Exert Anti-Tumor Response by Th1/17 Cells
Sirt1, an NAD+ dependent protein deacetylase, acts as an epigenetic modulator of key transcription factors regulating immune cell function (Zhang and Kraus, 2010). We observed that Sirt1 deacetylase activity was 2-fold higher in Th1/17 cells (Figure 5A), and a decreased frequency of IL17+ population in both Th17 and Th1/17 cells was noticed when using Sirt1-KO T cells (Figures 5B and 5C), or programming WT T cells in the presence of Sirt1 pharmacological inhibitor Ex527 (Figure S5A). No significant difference in IFNγ secreting fraction was observed with Ex527 or FK866 with Th1 subsets (Figures S5A and S5B).
Figure 5. NAD-SIRT1 Axis Is Central to Th1/17 Anti-Tumor Response.
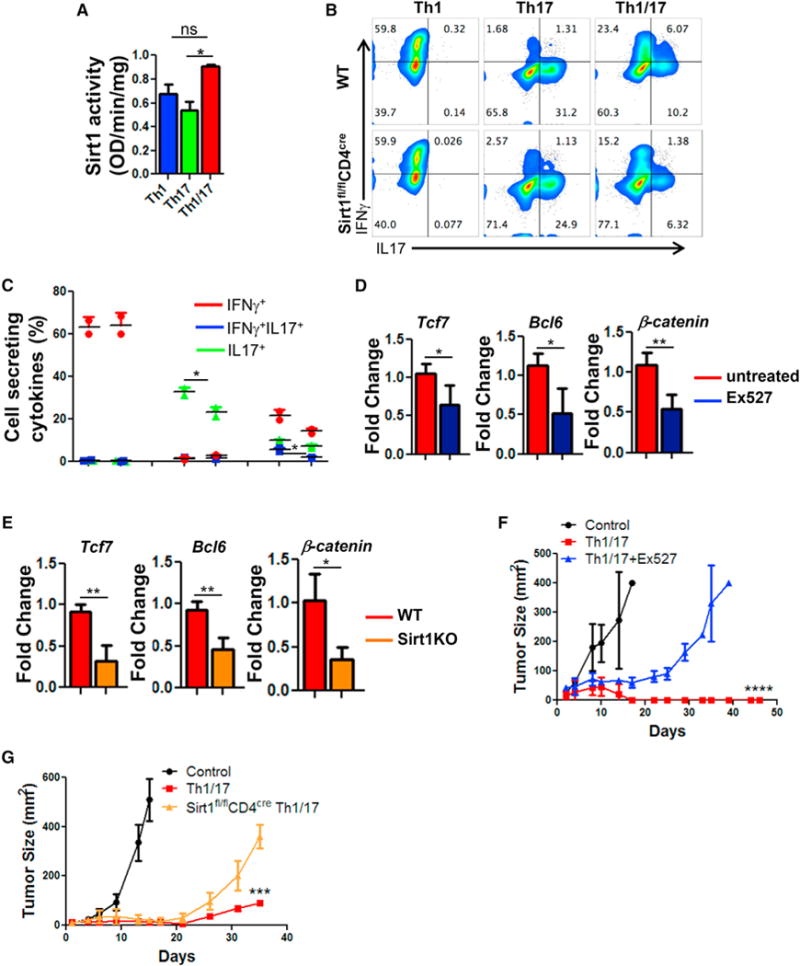
Purified CD4+ T cells differentiated to Th1, Th17, and Th1/17 were used for determining (A) Sirt1 activity using equal amount of nuclear protein (10 μg). Data are presented as activity/mg of protein. (B and C) Flow cytometry analysis (B) and frequency (C) of intracellular cytokines secretion after WT and Sirt1KO T cells were differentiated to Th1/17 cells. Th1/17 cells obtained from WT, Sirt1KO, or WT differentiated in presence of Ex527 were used for (D and E) determining expression of stemness associated genes, (F) B16-F10-HLA-A2+ murine melanoma-established s.c. for 9 days were treated by adoptively transferring 0.5 × 10⁶ TIL1383I TCR transduced T cells differentiated to Th1/17 with or without Ex527, and (G) B16-F10 murine melanoma established s.c. in C57BL/6 mice (n = 5/group) for 9 days were treated by adoptively transferring 0.5 × 10⁶ TRP-1 TCR transduced Th1/17 cells generated either from WT or Sirt-1fl/flCD4Cre mice. Tumor growth was measured using digital calipers every fourth day. Data in figure demonstrate mean tumor size at each time point. *p < 0.05, **p < 0.01, ***p < 0.005, and ****p < 0.0001. Also see Figure S5.
Expression of the stemness-associated genes was also markedly reduced in Th1/17 cells when using Sirt1 pharmacological inhibitor (Figure 5D) or Sirt1KO (Figure 5E), suggesting that NAD+-mediated Sirt1 activity is crucial for Th1/17 cells to exert their functionality and stemness phenotype. Since Sirt1 acts as a key metabolic sensor and regulates both glucose and lipid metabolism in various tissues (Li, 2013), we next sought to determine whether high Sirt1 activity in Th1/17 cell endows them with the unique metabolic phenotype (i.e., Glutaminolysishi Glycolysismedium). However, qPCR analysis did not show a marked difference in the expression of key enzymes associated with different metabolic pathways in Th1/17 cells derived from WT versus Sirt1KO (Figures S5C and S5D). This suggests that high Sirt1 activity in Th1/17 cells does not dictate their metabolic fate but rather acts downstream of NAD+ to regulate the functionality and stemness phenotype of the cell. Further, melanoma epitope tyrosinase reactive hybrid Th1/17 cells (h3T CD4+ T cells) differentiated ex vivo in the presence of Ex527 exhibited reduced ability to control tumor growth as compared to the vehicle treated cells (Figure 5F). Similarly, Sirt-1fl/flCD4Cre mouse splenic T cells retrovirally transduced with TRP-1 TCR and programmed to hybrid Th1/17 phenotype exhibited reduced tumor control when adoptively transferred to the murine melanoma B16-F10 bearing mice (Figure 5G). Thus, Sirt1 deacetylase activity is essential for the anti-tumor activity of hybrid Th1/17 cells.
NAD+-Mediated Sirt1 Deacetylase Regulates Foxo1 Activity, a Key Determinant of Anti-Tumor Response of Th1/17 Cells
Because the deacetylase activity of Sirt1 modulates the acetylation/deacetylation status of various transcription factors involved in the regulation of key cellular responses (Zhang and Kraus, 2010), we compared the degree of acetylation in hybrid Th1/17 cells. Using the global acetylation antibody that tracks the acetylation sites on the lysine residues, we observed that Th1/17 cells indeed have reduced acetylation, which was reversed to a certain extent when NAD+ levels were lowered due to Nampt inhibitor FK866 treatment (Figures 6A and S6A). However, it was unclear if the anti-tumor property exhibited by Th1/17 cells was a synergistic effect of acetylation/deacetylation induced functional modulation of multiple proteins.
Figure 6. High Foxo1 Activity in Th1/17 Cell Contributes to Enhanced Tumor Control.
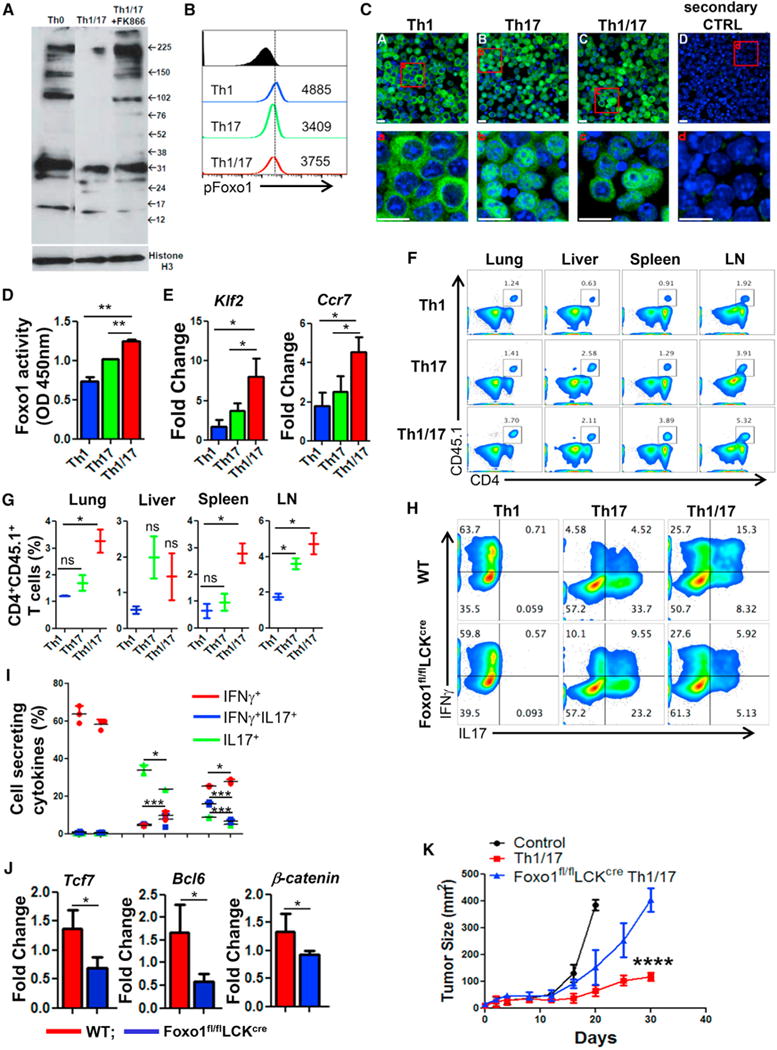
(A) Determination of global acetylation of nuclear protein in Th0, Th1/17, and Th1/17+FK866 cells using western blot. Membrane was blotted for Histone H3 (bottom panel) for loading correction.
(B) Flow cytometry analysis of phosphorylated Foxo1 (S256) in Th1, Th17, and Th1/17 cells. Data are representative of three independent experiments.
(C) Confocal images of the indicated cell stained with Foxo1 (in green). Nuclei were stained with DAPI (in blue). Lower panels show the magnified images of the cells in the red box drawn in the upper panels. Scale bar, 10 μm.
(D) ELISA-based determination of Foxo1 activity in Th1, Th17, and Th1/17 cells. Data are means ± SD of two samples from one representative experiment out of three.
(E) qPCR analysis of the expression of Klf2 and Ccr7 in differentiated Th1, Th17, and Th1/17 cells.
(F and G) Flow cytometric analysis (F) and frequency (G) of donor cells (Ly5.1+) retrieved from the lung, liver, spleen, and lymph nodes 24 hr after adoptive transfer of Th1, Th17, and Th1/17 cells into wild-type mice (Ly5.2+).
(H–J) WT or Foxo1fl/flLckcre CD4+T cells differentiated to Th1, Th17, and Th1/17 cells were used to determine (H) intracellular cytokine secretion, (I) frequency of cells secreting cytokines, and (J) stemness-associated genes using qPCR.
(K) C57BL/6 mice (n = 4 mice/group) with subcutaneously established B16-F10 melanoma for 9 days were either kept untreated or adoptively transferred with 0.5 × 10⁶ TRP-1 TCR transduced Th1/17 cells from either WT or Foxo1fl/flLckcre mice. The tumor growth curve from various groups of recipient mice is shown. Data are representative of three independent experiment in (H)–(J) and from two independent experiments, with similar result in (I). *p < 0.05, **p < 0.01, ***p < 0.005, and ****p < 0.0001. Also see Figure S6.
Given that Foxo1 has been implicated in the generation of T cell memory response, migration (Rao et al., 2012) and is regulated both by phosphorylation and acetylation levels (Daitoku et al., 2011), we focused on evaluating this protein between the Th subsets. The Th1/17 cells exhibited intermediate level of Foxo1 phosphorylation (Figure 6B). Since phosphorylation levels of Foxo1 facilitate its export from the nucleus to the cytoplasm, leading to its degradation and loss of transcriptional activity, these data suggest that Th1 cells have minimal nuclear retention of Foxo1, which could be the reason for their reduced memory or persistence as compared to Th17 and Th1/17 cells. The confocal imaging studies correlated with the phosphorylation data and showed that degree of Foxo1 retention in the nucleus is higher in Th17 cells followed by Th1/17 and Th1 cells (Figure 6C). Analysis of Foxo1 acetylation, which correlates to attenuation of its transcriptional activity (Daitoku et al., 2004), showed reduced acetylation levels in Th1 and Th1/17 cells (Figure S6B). Given that Th1 cells exhibit increased phosphorylation and reduced retention in the nucleus, it is likely that the cumulative activity of Foxo1 is higher in Th1/17 cells as compared to Th1 cells (despite having high NAD+). A quantitative determination of the transcriptional activity of Foxo1 in Th subsets showed that Foxo1 activity was indeed highest in Th1/17 cells as compared to the Th1 and Th17 cells (Figure 6D). Further, the elevated Foxo1 activity translated into higher expression of key Foxo1 targets as Klf2 and Ccr7 in Th1/17 cells as compared to Th17 and Th1 cells (Figure 6E). This difference also led to functionally increased homing of Th1/17 cells to the lung, liver, spleen, and lymph nodes after 24 hr of adoptive transfer into CD45.2+ congenically different recipient (Figures 6F and 6G).
In further studies, pharmacological inhibition of NAD+ and Sirt1 in Th1/17 cells not only resulted in increased acetylation in Th1/17 cells (Figure S6C) but also resulted in decreased expression of the Foxo1 targets Klf2 and Ccr7 (Figure S6D). This indicates that NAD+ mediated Sirt1 activity regulates acetylation levels of Foxo1, which in turn affects its transcriptional activity and modulates the functional outcome of a T cell immune response. Differentiation of hybrid Th1/17 cells was also compromised when using splenic T cells from Foxo1fl/flLckcre mouse, as evident by decreased fraction of IL17+IFNγ+ (Figures 6H and 6I) and reduced expression of “stemness” genes (Figure 6J). Importantly, Foxo1fl/flLckcre derived T cells transduced with TRP-1 TCR and ex vivo programmed to Th1/17 phenotype also showed reduced ability to control tumor growth upon adoptive transfer (Figure 6K). These data suggest that NAD+-Sirt1 based modulation of Foxo1 activity plays a key role in hybrid Th1/17 cell migration, effector function, stemness, and anti-tumor responses.
Next, we sought to determine whether maintenance of transcriptionally active nuclear Foxo1 is a key regulator of anti-tumor property in general, and could ameliorate the anti-tumor response of Th1 cells (that exhibit high NAD+ and Sirt1 but low nuclear Foxo1). Phosphorylation of AKT (S473) inversely correlates with the nuclear Foxo1 level, as its kinase activity phosphorylates Foxo1 and facilitates nuclear export (Rao et al., 2012). To interrogate whether reduced nuclear Foxo1 in Th1 cells is due to increased activity of AKT, we determined both pAKT (S473) level and their kinase activity in Th subsets. We observed that pAKT (S473) level and their kinase activity are markedly elevated in Th1 cells as compared to Th17 and Th1/17 cells (Figures S6E and S6F). Next, we inhibited the activity of AKT in Th1 cells in order to block the phosphorylation of Foxo1. Inhibition of AKT in Th1 cells significantly reduced the phosphorylation of Foxo1 (Figure S6G), and concomitantly increased its nuclear retention (Figure S6H). Importantly, using Th17 and Th1/17 cells programmed in presence of AKT activator SC-79 showed reduced nuclear Foxo1 levels (Figure S6H). The reduction of AKT in Th1 cells also led to upregulation of genes associated with memory response (Figure S6I). Furthermore, Th1 cells cultured in the presence of AKTi also exhibited improved tumor control when compared with vehicle control treated Th1 cells (Figure S6J). Thus, although Th1 have levels of NAD+ comparable to Th1/17 cells, their inferior anti-tumor phenotype can be improved by inhibiting the AKT-Foxo1 circuit.
Inverse Correlation between CD38 and NAD+ Controls Long-Term Anti-Tumor Response by T Cells
Recent studies have implicated that in addition to being a part of non-canonical adenosinergic pathway (Morandi et al., 2015), the cell surface molecule CD38 is also a NADase and its expression inversely correlates with NAD+ levels (Chini, 2009). While the expression of CD38 was found to be upregulated on Th17 cells, hybrid Th1/17 cells exhibited reduced expression of CD38 and other ectonucleotidases (CD39, CD73) (Figure 7A). Further, TCR activated CD38KO T cells showed intrinsically higher NAD+ and Sirt1 activity (Figures 7B and 7C) that also correlated with significantly higher OCR and spare respiratory capacity as compared to WT T cells (Figure 7D). The preferential dependence of CD38KO T cells on OXPHOS was evident by their higher OCR/ECAR ratio as compared to WT T cells (Figure 7E).
Figure 7. Inverse Correlation between CD38 and NAD+ Regulates Anti-Tumor Property of T Cells.
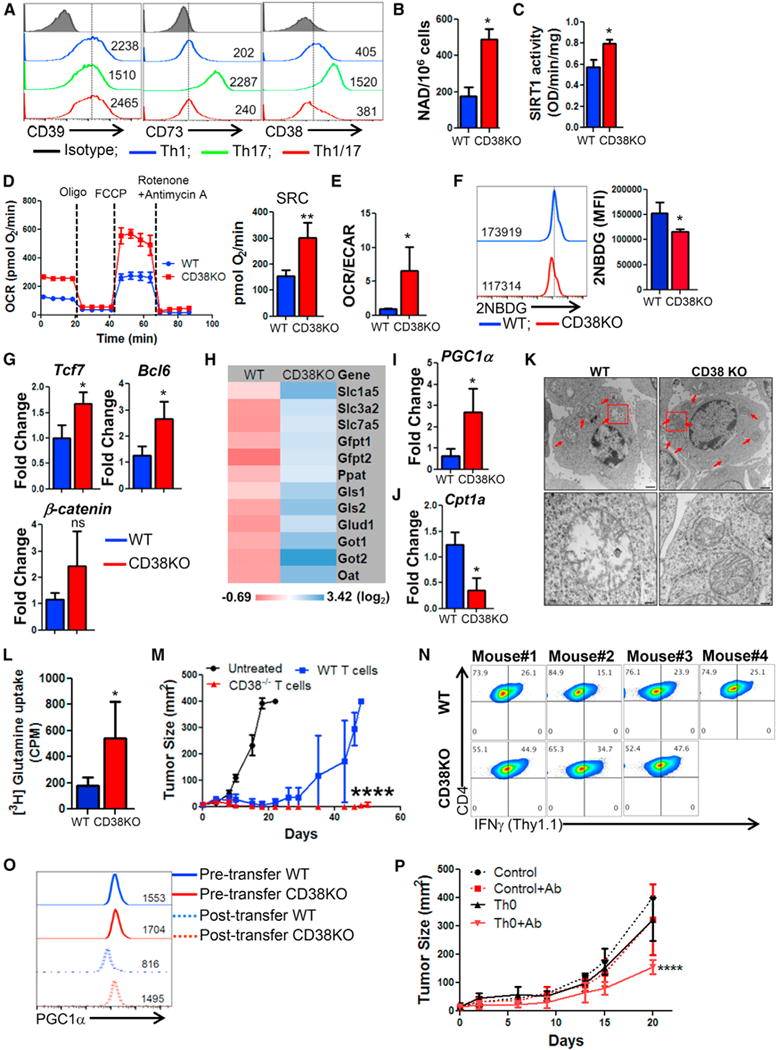
(A) Purified CD4+ T cells differentiated to Th1, Th17, and Th1/17 were used for determining the relative expression of cell surface molecules involved in canonical and non-canonical adenosinergic pathways. Splenic CD4+ T cells from C57BL/6 WT and CD38KO mice after 3 days of TCR activation were used to determine (B) intracellular NAD+ levels and (C) nuclear Sirt1 activity. TCR activated WT and CD38KO CD4+ T cells were used for determining (D) time course of OCR (left panel) and SRC (right panel), and (E) basal OCR/ECAR ratio. (F) Glucose uptake by using fluorescent-labeled glucose analog 2-NBDG. Adjacent bar diagram represents the cumulative data of mean fluorescence intensity (MFI) from three independent experiments. (G–J) qPCR analysis of the expression of (G) various stemness-associated genes, (H) glutaminolysis-associated genes, (I) PGC1α expression, and (J) Cpt1a expression. (K) Transmission electron microscopy of activated WT and CD38KO CD4+ T cells. Lower panels show the magnified images of the cells in the red box drawn in the upper panels. Scale bar, 1 μM (upper panel) and 200 nM (lower panel). (L) Uptake of radiolabelled glutamine measured in count per minute (CPM) is presented from one of two independent experiments. (M) Anti-tumor ability upon adoptive transfer of 0.5 × 10⁶ tyrosinase reactive TIL1383I TCR transduced CD4+ T cells from either C57BL/6 IFNγThy1.1 or CD38KO-IFNγThy1.1 mice to HLA-A+ mice (N = 8/group) with s.c. established B16-F10-HLA-A2+ murine melanoma cells. Data from one of the two experiments with similar results is shown. (N) Tumor infiltrating lymphocytes from the treated mice (as in M) were retrieved, and expression of Thy1.1 (≈IFN-γ) was evaluated in CD4+ Vb12+ cells using flow cytometry. (O) Flow cytometry analysis for intranuclear expression of PGC1α was performed using the WT or CD38KO CD4+ T cell retrieved 24 hr after injection to the ascites of EL-4 ascites tumor-bearing mice (n = 2). PGC1α expression pre- and post-injection is shown. (P) C57BL/6 mice (n = 4–5 mice/group) with 9 days subcutaneously established B16-F10 melanoma tumor were either kept untreated or adoptively transferred with 1 × 10⁶ TRP-1 CD4+ T cells (Th0). Group of mice that received T cells were either kept untreated or injected with anti-CD38 Ab (50 μg/mouse; i.p.) three times in a week up to day 20. Shown is the tumor growth curve of various groups of recipient mice. *p < 0.05, **p < 0.01, ***p < 0.005, and ****p < 0.0001. Also see Figure S7.
A comparative analysis of key metabolic regulators identified reduced glucose uptake (measured using 2-NBDG) (Figure 7F), CD71 (Figure S7A), pS6 (Figure S7B), T-bet (Figure S7C), and increased expression of Eomes (Figure S7D) in CD38KO T cells as compared to WT T cells. Further, CD38KO T cells also exhibited increased expression of the antioxidant genes (thioredoxin1, thioredoxin2, SOD1, SOD2 and Nrf2) (Figure S7E) and genes associated with stem-cell like phenotypes (e.g., Tcf7, Bcl6, and β-catenin) (Figure 7G). As observed for hybrid Th1/17 cells, the CD38KO T cells also showed similar metabolic gene signature with enhanced expression of glutaminolysis pathway genes (Figure 7H) and mitochondrial biogenesis regulator PGC1a (Figures 7I and S7F), whereas the expression of FAO regulator Cpt1a was significantly reduced (Figure 7J). Increased expression of PGC1α also correlated with a higher mitochondrial number in CD38KO T cells relative to WT T cells as determined by electron microscopy (Figure 7K). Dependence on the glutaminolysis pathway also correlated with increased uptake of radio-labelled glutamine by CD38KO T cells as compared to the WT T cells (Figure 7L). Further, subcutaneously established murine melanoma B16-F10 treated by adoptively transferring TRP-1 TCR transduced Th0 cells (i.e., activated for 3 days in presence of IL2) obtained from either WT (i.e., IFNγThy1.1 knockin reporter) or CD38KO/IFNγThy1.1 mice showed that even in absence of ex vivo programming, CD38-KO derived Th0 cells could efficiently control tumor growth (Figure 7M).
We also observed that there was almost a 50% reduction in the cytokine secretion from WT T cells infiltrating tumors as compared to the CD38KO T cells (Figure 7N). Thus, maintaining increased NAD+ by limiting the induced expression of CD38 on T cells renders them with a phenotype to persist longer and maintain anti-tumor function. Importantly, the expression of exhaustion molecule PD1 was not much different between the tumor infiltrating WT or CD38KO T cells (Figure S7G). This implies that CD38 expression plays a key role in metabolically modulating even PD1-expressing exhausted T cells.
Given a recent report that blockade of PD1 is not sufficient to reverse mitochondrial insufficiency observed in tumor infiltrating lymphocytes (TILs) (Scharping et al., 2016), we postulated that it is the expression of CD38 on the PD1 expressing T cells which regulates its metabolism. This idea was confirmed when the CD38-KO T cells did not lose functionality and maintained higher levels of PGC1a as compared to WT T cells after overnight exposure to EL4 tumor ascitis (Figure 7O). Thus, it is likely that CD38 mediated NAD+ level is key for maintaining PGC1α expression in the TILs. Further analysis of Th1 cells differentiated using CD38KO splenic T cells showed reduced pFoxo1 (Figure S7H), increased expression of stemness associated genes (Figure S7I), and improved tumor control (Figure S7J) compared to WT Th1 cells. However, when CD38KO T cells were used to program hybrid Th1/17 cells we observed no difference in cytokine secretion profile (Figure S7K), stemness genes expression (Figure S7L), or in vivo tumor control (Figure S7M). This suggests that increasing NAD+ could be key for improving the functionality of any Th subset, and ex vivo programming to hybrid phenotype leads to high NAD+ that equates with intrinsic NAD+ levels achieved by CD38 downregulation.
Since adoptively transferred T cells could acquire TGFβ mediated CD38 expression in a tumor microenvironment (Figure S7N), which may lead to reduced NAD+ levels, we posited that combining anti-CD38 antibody along with adoptive transferred T cells would enhance anti-tumor response. After co-culturing murine anti-CD38 antibody and purified T cells with TGFβ1 (to mimic tumor suppressive microenvironment and induce CD38), our initial in vitro data show that T cells activated in the presence of anti-CD38 antibody exhibit reduced CD38 expression (Figure S7O), increased cytokine secretion (Figure S7P), and higher Sirt1 activity (Figure S7Q). Importantly, the mice treated with combination of anti-CD38 antibody (Fab fragment) and T cells exhibited durable tumor control and longer survival as compared to those that were either treated with anti-CD38 antibody alone or the T cells alone (Figure 7P). Thus, strategies that lower CD38 expression enhance T cell mediated tumor control.
DISCUSSION
Adoptive T cell therapy (ACT), which involves the transfer of tumor epitope reactive autologous T cells to tumor-bearing hosts after ex vivo programming is a promising approach for treating patients with advanced malignancies (Rosenberg and Restifo, 2015). While cytolytic CD8+ T (Tc) cells have been extensively investigated and used for ACT, accumulating evidence indicates that CD4+ T helper (Th) cells are also effective in tumor immuno-therapy (Muranski et al., 2008). We hypothesized that “a superior Th subset in anti-tumor therapy would be hybrid Th1/17 cells with ‘anti-tumor effector’ function of Th1 cells and ‘stemness characteristics’ of Th17 cells” (Kryczek et al., 2011; Muranski et al., 2011; Wei et al., 2012). Our data show that a hybrid Th1/17 subset has a significantly improved anti-tumor activity compared to Th1 or Th17 cells. Importantly, hybrid Tc1/17 cells also exhibited potent anti-tumor phenotype. The long persisting hybrid T cells exclusively secreted IFNγ, and showed loss of anti-tumor phenotype upon blocking IFNγ. We believe that the strategy to generate both Th1/17 and Tc1/17 cells using similar programming conditions is of translational value, since it will overcome the current limitation where Th17 cells are better at anti-tumor activity than Th1 cells (Muranski et al., 2008), and Tc1 are better than Tc17 cells (Yu et al., 2013).
In this study we have combined Th1 programming conditions that utilize IL12, with low dose TGFβ in Th17IL1β cells in order to obtain Th1/17 (or Tc1/17) phenotype. Remarkably, the effector functions attributed to IL12 programmed Th1 were evident in these hybrid Th1/17 (or Tc1/17) cells that showed long-term tumor control. It is likely that the inclusion of IL12 in culture conditions augmented the levels of NAD+ in the hybrid Th1/17 cells, since Th1 cells also showed an increase in NAD+ levels. Paradoxically, the Th1 cells exhibit reduced anti-tumor effects (Muranski et al., 2008). While IL12 also favors the generation of fully activated effector CD8+ T cells, it has been shown to hinder the formation of CD8+ T cell memory precursors and differentiation of long-term CD8 T cell memory (Pearce and Shen, 2007).
Additionally, the contrast between the Th1 cells and the hybrid Th1/17 cells may also be in differential Foxo1 phosphorylation that decides its nuclear versus cytoplasmic localization and promotes the memory T cell phenotype (Rao et al., 2012). Since Foxo1 activity is dependent upon its deacetylation, it is possible that high NAD+ dependent Sirt1 histone deacetylase levels in hybrid Th1/17 cells could have resulted in increased expression of its downstream targets (as CCR7, KLF2), which also translated to increased migration of these cells. Similarly, the ability of Foxo1 to regulate mitochondrial biogenesis PGC1α has also been reported previously (Daitoku et al., 2003). Given the role of Sirt1 in increasing lifespans (Rodgers et al., 2005), it is likely responsible for enhanced persistence and anti-tumor function of Th1/17 cells. Importantly, reducing the phosphorylation of Foxo1 by inhibiting AKT in Th1 cells increased Foxo1 dependent transcription of memory-associated genes which in turn improved the anti-tumor response of Th1 subsets. Thus, our data indicate that NAD-Sirt1-Foxo1 axis regulates T cell immune response.
Another important aspect of the hybrid Th1/17 and CD38KO T cells is their dependence on glutaminolysis. Given the parallel role of glutamine and glucose, and that glutamine also plays an essential role in cellular proliferation in maintenance of ATP and intracellular glutathione even in hypoxic condition (Le et al., 2012), our data show that in comparison to the Th1 and Th17 cells, hybrid Th1/17 cells exhibit higher expression of antioxidant genes and also higher intracellular glutathione—indicative of increased glutamine uptake (Yu et al., 1999). Similarly, CD38KO T cells also displayed increased antioxidant capacity and glutamine uptake. It is likely that dependence on glutamine metabolism may help Th1/17 or CD38KO T cells to persist and maintain effector function. Our data also suggest that while secretion of IFN-γ is highly sensitive to glycolysis inhibition (as both Th1 and Th1/17 cells significantly lose their ability to secrete IFN-γ in presence of 2DG), secretion of IL-17 increased by 2-fold in both Th17 and Th1/17 cells in presence of 2DG, in accordance with the published report by Gerriets et al. (Gerriets et al., 2015), where they showed an upregulation of RORγ expression in Th17 cells cultured in presence of 2DG.
Paradoxically, it has also been reported that 2DG treatment significantly reduced EAE pathogenesis in mouse model caused by Th17 cells (Shi et al., 2011). Therefore, these observations led us to conclude that inhibition of glycolysis by 2DG doesn’t essentially inhibit the signature cytokine of Th17 cells but might interfere with their pathogenic signature and ability to cause EAE. However, we observed that inhibition of glutaminolysis using its inhibitor DON resulted in decreased IL17 secretion (in both Th17 and Th1/17 subsets), loss of stemness-related genes and compromised anti-tumor effector response in hybrid Th1/17 cells.
Importantly, the maintenance of high NAD+ level in Th1/17 cells also seems to be dependent on glutaminolysis since DON treatment significantly reduced NAD+ level, whereas 2DG treatment increased the NAD+ level in Th1/17 cells. The increased accumulation of NAD+ observed in Th1/17 cells after 2DG treatment could be due to the reduced usage of cellular NAD+ pool, since it also serves as a co-factor for glycolytic enzyme GAPDH in catalyzing the conversion of glyceraldehyde-3-phosphate to 3-phosphoglycerate (Meyerhof, 1951). It is likely that enhanced T cell memory response and anti-tumor function observed after glycolysis inhibition (using 2DG) (Sukumar et al., 2013) may have been due to increased NAD+. Thus, glutaminolysis appears to be a key metabolic pathway in Th1/17 cells (and CD38KO) that correlates to its enhanced anti-tumor response.
Further, the intrinsic levels of NAD+ inversely correlate to the TGFβ-induced CD38 expression, which in turn may be how the CD38-NAD+ regulates the T cell function in a tumor microenvironment. Since both CD38 and PD1 are tightly co-expressed, we propose that CD38 is central in regulating “metabolic exhaustion” by moderating NAD+ levels in the PD1+ exhausted T cell. A recent study has also shown that it is the expression of CD38, rather than the expression of NAD+ synthesizing enzymes Nampt or NAPRT1, which regulates NAD availability in aging cells (Camacho-Pereira et al., 2016). A similar scenario could be envisioned for our observation with the anti-tumor T cells where maintenance of PGC1α regulated mitochondrial biogenesis (in absence of CD38) preserved T cell functionality despite expression of PD1. It should be noted that we also found that regulatory T cells (Treg’s) and myeloid derived suppressor cells (MDSCs) obtained from CD38KO mice are functionally less suppressive (Figures S7R and S7S), whereas activated CD38KO NK cells secreted more effector cytokine IFNγ as compared to WT NK cells (Figure S7T). Thus, better tumor response due to inhibition of CD38 expression by concomitantly increasing intracellular NAD+ in T cells (or other immune cells) could be important to achieve superior tumor control and allow the widespread application of ACT.
STAR★METHODS
Detailed methods are provided in the online version of this paper and include the following:
CONTACT FOR REAGENT AND RESOURCE SHARING
Further information and requests for resources and reagents should be directed to and will be fulfilled by the Lead Contact, Shikhar Mehrotra (mehrotr@musc.edu).
EXPERIMENTAL MODEL AND SUBJECT DETAILS
Mice
C57BL/6, B6-HLA-A2+, B6-Rag−/−, CD38KO, Sirt1fl/fl, CD4cre, B6 (CD45.1), IFNγ−/−, TRP-1, Pmel, TRAMP mice were obtained from Jackson Laboratory (Bar Harbor, ME). IFNγThy1.1 knock-in, Foxo1fl/flLckcre and T Ag TCR-I mice were kind gift from Casey T. Weaver, UAB, Melanie Gubbels Bupp, Randolph-Macon College, VA and Jennifer Wu, MUSC respectively. CD38KO-IFNγThy1.1 knock-in mice, HLA-A2+-Rag−/− mice and Pmel-IFNγ−/− mice were developed in the lab. Melanoma epitope tyrosinase reactive HLA-A2 restricted TCR transgenic mouse (referred as h3T in the text) was developed in the lab and reported earlier (Mehrotra et al., 2012). Animals were maintained in pathogen-free facilities and experimental procedures were approved by Institutional Animal Care and Use Committees of Medical University of South Carolina, Charleston. Mice were bred and housed under standard housing conditions (group housing up to 5 mice per cage) except B6-Rag−/− and HLA-A2+-Rag−/− mice which require high barrier facility (also group housing up to 5 mice per cage). For tumor experiments, equal number of age and gender matched (both male and female) mice were randomly assigned for the experiments when they were between 8–10 weeks old. No influence of sex on the result of the studies was observed.
Cell Lines
B16-F10 (RRID: CVCL_0159) was obtained from American Type Culture Collection (ATCC), suggested to be of male origin.
T Cell Differentiation
Naive CD4+ T cells were purified from the total splenocytes of 6–9 weeks old WT (C57BL/6) and KO (Foxo1fl/flLckcre, Sirt1fl/flCD4cre, CD38KO) mice using CD4+ T cell isolation kit (Miltenyi Biotec) according to manufacturer’s protocol. Total splenocytes from 6–9 weeks old TCR transgenic mouse TRP-1 (bears class-II restricted CD4+ T cells) or Pmel (bears class-I restricted CD8+ T cells) or TCR-I (bears class-I restricted CD8+ T cells) were also used. Within experiments mice were age and sex matched. Purified naive CD4+ T cells or total splenocytes were differentiated to Th1 or Tc1 (10 ng/ml IL12, 50 U/ml IL2 and 10 mg/ml anti-IL4), Th17 or Tc17 (3 ng/ml TGFβ, 25 ng/ml IL6, 10 mg/ml anti-IL4 and 10 mg/ml anti-IFNγ), Th1/17 or Tc1/17 (20 ng/ml IL1β, 25 ng/ml IL6, 10 ng/ml IL12, 20 ng/ml IL23, 400 pg/ml TGFβ, 10 mg/ml anti-IL4, 5 mg/ml anti-IFNγ), iTreg (5 ng/ml TGFβ, 100 IU/ml IL2, 10 mg/ml anti-IL4 and 10 mg/ml anti-IFNγ or Th0 (50 IU/ml IL2) in presence of plate bound anti-CD3 (5 μg/ml) and anti-CD28 (5 μg/ml). For TRP-1, gp100 or Sv40 specific generation of different Th or Tc subsets, total splenocytes from either TRP-1, Pmel or TCR-I TCR transgenic mice were stimulated with 1 μg/ml respective peptides in presence of above-mentioned polarizing conditions. T cells were differentiated for three days in IMDM media supplemented with 10% FCS, 4mM L-glutamine, 100 U/ml penicillin, 100 μg/ml streptomycin, 55 μM beta-mercaptoethanol under 7% CO2, atmospheric oxygen at 37°C in a humidified incubator. For evaluation of intracellular cytokines by flow cytometry, T cells were re-stimulated with PMA (500ng/ml) and Ionomycin (500ng/ml) for 4 hr in presence of Glogi inhibitors. In some experiments, in vitro differentiated T cells were either treated with the vehicle control or inhibitor of AKT, AKTi (1 μM; added into the differentiation media from day 0) or activator of AKT, SC-79 (0.5 μg/ml; added into the differentiation media for last 24hr) or FK866 (10nM; added into the differentiation media from day 0) or Ex527 (10 μM; added into the differentiation media from day 0) or 2DG (1mM; added into the differentiation media from day 0) or DON (3 μM; added into the differentiation media from day 0).
METHOD DETAILS
Retroviral Transduction
One day before transfection, 5 × 10⁶ Platinum-E ecotropic packaging cells (Cell Biolabs) were seeded in 10 mL antibiotic-free medium in 100 mm dishes (Corning). Packaging cells were transfected with 18 μg retroviral plasmid DNA encoding either the TIL 1383I TCR or the MSGV-1 TRP-1 TCR and the helper plasmid pCL-Eco using 36 mL Lipofectamine 2000 in OptiMEM (Invitrogen). After 24hr, medium was replaced and the cells were incubated for additional 24hr, after which the retrovirus-containing supernatant was collected and filtered. The viral supernatant was spun at 2,000g for 2 hr at 32°C onto non-tissue-culture-treated 24-well plates (USA Scientific) coated overnight with Retronectin (Takara Bio). Freshly isolated mouse CD4+ T cells were activated with CD3/CD28-coated beads (Dynabeads, Life Technologies) at a 1:1 bead:cell ratio along with either T cell differentiation media (as described above) or IL2 containing media (100 U/ml) the same day as packaging cell transfection. Beads were removed 48 hr post-activation, just prior to transduction, and re-suspended to a concentration of 2 × 10⁶ cells ml−1 in fresh medium. After removing the virus from the Retronectin-coated plate following the first spin, 1 mL of the activated T cells were then plated in the same wells and 1 mL of fresh virus was added on top of the cells. The plate was spun for an additional 2 hr at 1100g, 32°C. Post-spin, 1 mL of media was removed and replaced with fresh media containing 200 IU IL-2 ml−1 before the cells were incubated overnight. The following day the cells were collected, washed and plated at 0.8–1 × 10⁶ cells ml−1.
Adoptive T Cell Protocol
B16-F10 or B16-F10-A2+ mouse melanoma tumor cells (2.5 × 10⁶) were injected subcutaneously (s.c.) into left flank of 8–10 weeks old C57BL/6 or HLA-A2+ (or HLA-A2+-RAG−/−) mice respectively. After 9 days of tumor establishment, recipient mice were injected (i.p) with cyclophosphamide (4 mg/mice) before adoptively transferring (i.v) either h3T (CD4+Vβ12+) or TRP-1 (CD4+Vβ14+) Th1, Th17, Th1/17 cells on day 10. Similarly, Pmel (CD8+Vb13+) and TCR-I (CD8+Sv40 antigen specific) Tc1, Tc17 and Tc1/17 cells were adoptively transferred (i.v) into either 9 days established B16-F10 tumor bearing mice or TRAMP (spontaneously develop prostate tumor) respectively. For in vivo neutralization of IFNγ and IL17, neutralizing antibody to IFNγ and IL17 or matched isotype antibody was injected (100 μg/mouse; i.p.) in tumor bearing mice following adoptive transfer of T cells. In some experiments, tumor bearing mice received anti-CD38 antibody (50 μg/mouse; i.p.) after adoptive TRP-1 Th0 cells transfer. Recipient mice were given IL2 (50,000 U/mouse; i.p) for 3 consecutive days after ACT.
Flow Cytometry
Staining for cell surface markers was performed by incubating cells with antibody at 1:200 dilutions in FACS buffer (0.1% BSA in PBS) for 30 min at 4°C. For intracellular cytokine staining of IFN0γ and IL17a, surface markers were stained before fixation/permeabilization (BD Cytofix/Cytoperm Kit, BD Biosciences, San Jose, CA). For staining of transcription factors (T-bet, RORγ, IRF-4) and PGC1a cells were stained with surface markers and fixed/permeabilized with FoxP3 staining buffer set (eBioscience, San Diego, CA). For pFoxo1 staining, cells were fixed/permeabilized using BD perm III buffer set (BD Bioscience, San Jose, CA) before staining with cell surface markers and pFoxo1 primary antibody (Cell Signaling Technologies, Danvers, MA) followed by fluorochrome conjugated secondary antibody (Jackson ImmunoResearch Laboratories, West Grove, PA). Samples were acquired on LSRFortessa and analyzed with FlowJo software (Tree Star, OR).
Real-time Quantitative-PCR
Total RNA was extracted from pellets of the indicated T cell subsets (2 × 10⁶ cells) using Trizol reagent (Life technologies, Grand Island, NY). cDNA was generated from 1 μg total RNA using iScript cDNA Synthesis Kit (BioRad, Hercules, CA). SYBR Green incorporation quantitative real-time PCR was performed using a SYBR Green mix (Biorad, Hercules, CA) in the CFX96 Detection System (BioRad, Hercules, CA). Expression of different genes was quantified relative to Actb.
Transmission Electron Microscopy (TEM)
The cells were pelletized and fixed in 2% Phosphate Buffered Glutaraldehyde for 1 hr. The pellets were rinsed in 0.1M Phosphate Buffered Rinse and then post fixed in 2% Aqueous Osmium Tetroxide for 1 hr. After rinsing in distilled water the pellets were dehydrated through a series of graded Ethyl Alcohol; 50% ETOH for 15 min, 70% ETOH for 15 min, 95% ETOH for 15 min and finally twice with 100% ETOH for 15 min each. The dehydrant was removed using the intermediate fluid, Propylene Oxide, 1 changes of 10 min each. The pellets were infiltrated with a 1:1 solution of propylene oxide and Embed 812 (Electron Microscopy Sciences, Ft. Washington, PA) for 1 hr. The infiltration was continued using a 1:2 solution of propylene oxide and Embed 812, overnight. The pellets were embedded in Embed812 the following day and polymerized in a 60°C oven for 48 hr. Preliminary 1/2 micron sections were cut and stained with Toluidine Blue and examined using a light microscope. Then with the cell types identified the 70nm thin sections are cut and stained with uranyl acetate and led citrate, allowed to dry. The sections are view on the JEOL 1010 and images are taken with a Hamamatsu electron microscope camera.
Immunoblotting and Immunoprecipitation of Foxo1
For evaluation of global protein acetylation, cells were lysed using NE-PER Nuclear and Cytoplasmic Extraction Reagents (Thermo Fisher Scientific, Waltham, MA) and nuclear fraction was isolated according to the manufacturer’s protocol. Equal amounts of nuclear protein (20 μg) were separated by 4%–12% SDS-PAGE and then transferred to nitrocellulose membranes. The membranes were probed with anti-Acetyl-Lysine antibody (Cell Signaling Technologies, Danvers, MA) followed by incubation with secondary antibody (HRP-conjugated goat anti-rabbit IgG at 1:3000 dilutions) for overnight at 4°C. Pre-stained molecular weight and magic markers were run in parallel to identify the molecular weight of proteins. For chemiluminescent detection, the membranes were treated with enhanced chemiluminescent reagent, and the signal was monitored using a Biorad Versadoc imaging system (Biorad, Hercules, CA). Same membrane was stripped with stripping buffer (Bioland Scientific, Paramount, CA) according to manufacturer’s protocol and re-probed with antibody specific to histone H3 (Cell Signaling Technologies, Danvers, MA) as reference control.
For evaluation of the protein level of glutamine transporters and glutaminolytic enzymes, cell pellets were washed in PBS and lysed in 80 μl RIPA buffer containing protease inhibitor cocktail. After 30 min incubation on ice cell lysates were centrifuged at 12000 g for 15 min at 4°C. Protein concentration in lysates was determined by Bradford method. For immunoblot analyses, 40 μg of protein lysates per sample were denatured in 2 X SDS–PAGE sample buffer and subjected to SDS–PAGE on 10% Tris–glycine gel. The separated proteins were transferred onto PVDF membrane followed by blocking with 5% BSA (w/v) in TBS (10 mM Tris, 100 mM NaCl, 0.1% Tween 20) for 1 hr at room temperature. Membrane was probed with either anti-Slc1a5 antibody (Thermo Fisher Scientific, Waltham, MA) or x-CT (Abcam, Cambridge, MA) or Glud1 (Cell Signaling Technology, Danvers, MA) or Gls (Novus Biologicals, Littleton, CO) overnight at 4°C followed by 1 hr incubation with HRP-conjugated secondary antibody and using a chemiluminescence kit (SuperSignal West Dura Extended Duration Substrate, Thermo Fisher Scientific, Waltham, MA).
For immunoprecipitation of Foxo1, T cells were first washed with phosphate buffer saline (PBS) and lysed in 500 μL of RIPA buffer containing a protease inhibitor cocktail for 30 min on ice. Cell lysates were centrifuged at 6000 g for 10 min. Foxo1 was isolated by immunoprecipitation using the immunoprecipitation kit (Cat # K286, BioVision, Milpitas, CA). Briefly, 500 μL of supernatant (200 μg protein) was incubated with anti-Foxo1 monoclonal antibodies (1:100 dilution) for 16 hr at 4°C followed by incubation with Protein A/G-Sepharose for 1 hr at 4°C. The immunoprecipitate was washed multiple times with wash buffer and extracted with Tris-Glycine HCl SDS (2×) buffer and heated at 95°C as per the manufacturer’s direction. The proteins were resolved on 10% SDS-PAGE and then transferred to nitrocellulose membranes. The membranes were probed with anti-Acetyl-Lysine antibodies followed by incubation with secondary antibodies (HRP-conjugated goat anti-rabbit IgG at 1:3000 dilution) for 1 hr at 20°C. Pre-stained molecular weight and magic markers were run in parallel to identify the molecular weight of proteins of interest. For chemiluminescent detection, the membranes were treated with enhanced chemiluminescent reagent, and the signal was monitored using a Biorad Versadoc imaging system (Biorad, Hercules, CA).
Metabolism Assays
Glucose uptake by ex vivo differentiated T cells were determined by incubating cells with 100 μM 2NBDG (Cayman chemical, Ann Arbor, MI) for 30 min before measuring fluorescence by flow cytometry.
Oxygen consumption rate (OCR) and Extracellular acidification rate (ECAR) was determined using Seahorse Xfe96 analyzer (Agilent Technologies, Santa Clara, CA). Briefly, T cells (0.5×10⁶/well) were plated on Cell-Tak coated Seahorse culture plate for 30 min. OCR, a measure of OXPHOS, was analyzed under basal condition or in response to 200 μM Etomoxir (Sigma-Aldrich, St. Louis, MO) followed by 1.0 μM oligomycin (Sigma-Aldrich, St. Louis, MO), 1.0 μM fluoro-carbonyl cyanide phenylhydrazone (FCCP) (Sigma-Aldrich, St. Louis, MO) and 2 μM rotenone (Sigma-Aldrich, St. Louis, MO) plus 100 nM antimycin A (Sigma-Aldrich, St. Louis, MO). ECAR, a measure of glycolysis was measured under basal conditions and in response to glucose (5.5 mM), Oligomycin (1.0 μM), 2-deoxyglucose (2-DG) (100 mM) (Sigma-Aldrich, St. Louis, MO).
Metabolomics
Intracellular level of different metabolites was determined by performing metabolomics analysis using UPHPLC/MS/MS and GC/MS platform (Metabolon Inc. Durham, NC). Data were then grouped by unsupervised clustering using MetaboAnalyst software. Samples were loaded in an equivalent manner across the platform and normalized to Bradford values prior to statistical analysis.
Glutamine Uptake Assay
Ex vivo programmed Th cell subsets (1 × 10⁶ cells) were starved in glutamine free RPMI-1640 media (Thermo Fisher Scientific, Cat# 21870-076) for 15 min before incubated with L-2,3,4-[3H] glutamine (0.5 mCi, PerkinElmer) for 10 min at room temperature. Cells were lysed in 500 μL of lysis buffer (Sigma-Aldrich, St. Louis, MO) and radioactivity was measured by liquid scintillation.
NAD+, Sirt1 Activity and Foxo1 Activity Assay
Intracellular NAD+ level in T cells were measured spectrophotometrically following the manufacturer’s protocol (Cayman chemical, Ann Arbor, MI). Using equal amounts of nuclear protein extracted by NE-PER Nuclear and Cytoplasmic Extraction Reagents (Thermo Fisher Scientific, Waltham, MA), Sirt1 activity (Universal Sirt1 Activity Assay Kit, Abcam, Cambridge, MA) and Foxo1 activity (FKHR transcription Factor Assay Kit, Active Motif, Carlsbad, CA) were determined as per manufacturer’s protocol.
Isolation of Tumor Infiltrating T Cells
To obtain tumor infiltrating T cells (TILs) from subcutaneously established solid B16-F10 melanoma bearing mice, tumors were excised, chopped finely using tweezers and scissors and then digested with 2 mg/ml collagenase type IV (Stemcell technologies, Vancouver, BC) for 45 min. Following digestion, tumors were filtered through 70μM cells strainers (BD Biosciences, San Jose, CA) and layered over ficoll-paque (GE Healthcare). After centrifugation at 1200 rpm for 30 min, mononuclear cell layer containing TILs was isolated. For isolation of T cells from EL-4 tumor site, tumor was established as ascites in the peritoneal cavity for 12 days in mice and abelle fluid was withdrawn to obtain TILs. To isolate TILs from prostate tumor sites, the resected prostate tumors were quickly minced with scalpels into small fragments (1–2 mm2) in cold RPMI media with 10% FBS, after trimming away the seminal vesicles, fat and connective tissue. The fragments were then placed on a 70 μm strainer and homogenized using plunger end of a syringe (one fragment at a time to ensure complete homogenization). This process rapidly produces a single cell suspension without the requirement of enzymatic digestion. The cell suspension was washed in culture medium twice by centrifugation at 1500 rpm for 10 min at 4°C. After the second wash, the cells were re-suspended in 6 mL PBS and layered carefully over 3ml Ficoll-paque (GE healthcare) followed by centrifugation at 1500 rpm for 30 min at room temperature. The enriched TILs obtained at the interface as a thin buffy layer, were washed with PBS twice and finally re-suspended in FACS staining buffer for further staining procedures.
Activation Induced T Cell Death
Differentiated Th1, Th17 and Th1/17 cells were re-stimulated overnight with plate bound anti-CD3 (2 μg/ml) plus anti-CD28 (1 μg/ml). Apoptosis was measured by Annexin V (BD Biosciences, San Jose, CA) versus 7AAD staining according to the manufacturer’s protocol, followed by analysis by flow cytometry. Data were analyzed with FlowJo software (Tree Star, OR).
DNA Microarray Experiments
Biotinylated cRNA was prepared using the Illumina RNA Amplification Kit, Catalog #1L1791 (Ambion, Inc., Austin, TX) according to the manufacturer’s specifications starting with ~250 ng total RNA. For microarray analysis, the MouseWG-6 v2.0 Expression BeadChip Kit was used (Illumina, San Diego). Hybridization of abelled cRNA to the BeadChip, washing and scanning were performed according to the Illumina BeadStation 500× manual. Essentially the amplified, biotin-labeled mouse cRNA samples were re-suspended in a solution of Hyb E1 buffer (Illumina) and 25% (v/v) formamide at a final concentration of 25ng/μL. 1.5 μg of each cRNA were hybridized. Hybridization was allowed to proceed at 55°C, for 18 hr after which the bead array matrix was washed for 10 min with 1X High temperature buffer (Illumina), followed by a subsequent 10 min wash in Wash E1BC buffer. The arrays were then washed with 100% ethanol for 10 min to strip off any remaining adhesive on the chip. A 2 min E1BC wash was performed to remove residual ethanol. The arrays were blocked for 5 min with 1% (w/v) casein-PBS (Pierce). The array signal was developed via 10 min incubation with Streptavidin-Cy3 at a final concentration of 1μg/mL solution of (GE Healthcare) in 1% casein-PBS blocking solution. The Expression BeadChip was washed a final time in Wash E1BC buffer for 5 min and subsequently dried via centrifugation for 4 min at a setting of 275 rcf.
The arrays were scanned on the Illumina BeadArray Reader, a confocal-type imaging system with 532 (cye3) nm laser illuminations. Image analysis and data extraction was carried out as in accordance with Illumina specifications. Preliminary data analysis and QC was carried out using the GenomeStudio software (Illumina). All array data has been deposited in the EBI ArrayExpress Database. The ArrayExpress accession E-MTAB-5237.
Analysis of microarray data
-
2)
Normalization of microarray data
Expression level data from the Illumina Bead Studio software were normalized using quantile normalization as implemented in the PIMENTo package (Sásik et al., 2004). Probes whose expression level exceeds a threshold value in at least one sample are called detected. The threshold value is found by inspection from the distribution plots of (log) expression levels.
-
2)
Sorting the probes according to significance
Detected probes are sorted according to their q-value, which is the smallest false discovery rate (FDR) at which the gene is called significant. FDR is the expected fraction of false positive tests among significant tests (Benjamini and Hochberg, 1995). We evaluate FDR using Significance Analysis of Microarrays (SAM) and its implementation in the official statistical package samr (Tusher et al., 2001).
-
3)
Statistical analysis of pathways and gene ontology terms.
Each gene ontology term or a pathway is treated simply as a set of genes. The probe list, sorted by q-value in ascending order, is translated into Entrez gene ID’s and parsed so that whenever several different probes represent the same gene, only the highest-ranking probe is kept for further analysis.
The sorted list of genes is subjected to analysis using the ToppGene Suite (https://toppgene.cchmc.org/), a one-stop portal for (i) gene list functional enrichment, (ii) candidate gene prioritization using either functional annotations or network analysis and (iii) identification and prioritization of novel disease candidate genes in the interactome. Functional annotation-based disease candidate gene prioritization uses a fuzzy-based similarity measure to compute the similarity between any two genes based on semantic annotations. The similarity scores from individual features are combined into an overall score using statistical meta-analysis. A P-value of each annotation of a test gene is derived by random sampling of the whole genome (Chen et al., 2009). Area-proportional Venn diagrams were created using Venny.
Heatmaps of expression levels were created using the heatmap.2 hierarchical clustering software. The colors qualitatively correspond to fold changes with respect to a reference which is calculated as the mid-point between compared groups.
QUANTIFICATION AND STATISTICAL ANALYSIS
Statistical Analysis
All data reported are the arithmetic mean from 3 or 5 independent experiments performed in triplicate ± SD unless stated otherwise. The unpaired Student t test was used to evaluate the significance of differences observed between groups, accepting p < 0.05 as a threshold of significance. Data analyses were performed using the Prism software (GraphPad, San Diego, CA). Tumor size data was modeled using longitudinal linear regression with exchangeable correlation. Comparisons across groups at individual time points were made across groups using Wald tests based on linear combinations of coefficients.
DATA AND SOFTWARE AVAILABILITY
All array data has been deposited in the EBI ArrayExpress Database. The ArrayExpress accession number is E-MTAB-5237.
Supplementary Material
KEY RESOURCES TABLE.
| REAGENT or RESOURCE | SOURCE | IDENTIFIER |
|---|---|---|
| Antibodies | ||
| Anti-mouse CD3 | BioXCell | Clone: 145-2C11; Cat# BE0001-1; RRID: AB_1107634 |
| Anti-mouse CD28 | BioXCell | Clone: 37.51; Cat# BE0015-1; RRID: AB_1107624 |
| Anti-mouse IL4 | BioXCell | Clone: 11B11; Cat# BE0045; RRID: AB_1107707 |
| Anti-mouse IFNγ | BioXCell | Clone: XMG1.2; Cat# BE0055; RRID: AB_1107694 |
| CD4-PE | eBioscience | Clone: GK5.1; Cat# 12-0041-83; RRID: AB_465506 |
| T-bet-Percp/Cy5.5 | eBioscience | Clone: 4B10; Cat# 45-5825-80; RRID: AB_953657 |
| RORγ-APC | eBioscience | Clone: AFKJS-9; Cat# 17-6988-80; RRID: AB_10609207 |
| IRF-4-eFluor 660 | eBioscience | Clone: 3E4; Cat# 50-9858-80; RRID: AB_2574393 |
| CXCR3-PE | eBioscience | Clone: CXCR3-173; Cat# 12-1831-80; RRID: AB_1210734 |
| CD45.2-PE | eBioscience | Clone: 104; Cat# 12-0454-81; RRID: AB_465678 |
| CD39-PE/Cy7 | eBioscience | Clone: eBioA1 (A1); Cat# 25-0391-80; RRID: AB_1582280 |
| CD90.1-APC | eBioscience | Clone: HIS51; Cat# 17-0900-82; RRID: AB_1272252 |
| CD90.1-Pacific Blue | eBioscience | Clone: HIS51; Cat# 48-0900-80; RRID: AB_1272254 |
| EOMES-PE | eBioscience | Clone: Dan11mag; Cat# 12-4875-80; RRID: AB_1603275 |
| CD4-PE/Cy7 | Biolegend | Clone: GK5.1; Cat# 100422; RRID: AB_312707 |
| CD4-APC | Biolegend | Clone: GK5.1; Cat# 100412; RRID: AB_312697 |
| CD4-APC/Cy7 | Biolegend | Clone: GK5.1; Cat# 100414; RRID: AB_312699 |
| CD8-PE/Cy7 | Biolegend | Clone: 53-6.7; Cat# 100722; RRID: AB_312761 |
| CD8-APC | Biolegend | Clone: 53-6.7; Cat# 100712; RRID: AB_312751 |
| CD8-FITC | Biolegend | Clone: 53-6.7; Cat# 100706; RRID: AB_312745 |
| IL17-PE | Biolegend | Clone: TC11-18H10.1; Cat# 506904; RRID: AB_315464 |
| IL17-Pacific Blue | Biolegend | Clone: TC11-18H10.1; Cat# 506918; RRID: AB_893544 |
| IFNγ-PE | Biolegend | Clone: XMG1.2; Cat# 505808; RRID: AB_315402 |
| IFNγ-Alexa647 | Biolegend | Clone: XMG1.2; Cat# 505814; RRID: AB_493314 |
| T-bet-PE | Biolegend | Clone: 4B10; Cat# 644809; RRID: AB_2028583 |
| CCR5-PE | Biolegend | Clone: HM-CCR5; Cat# 107005; RRID: AB_313300 |
| CCR6-PE | Biolegend | Clone: 29-2L17; Cat# 129803; RRID: AB_1279139 |
| CCR7-PE | Biolegend | Clone: 4B12; Cat# 120105; RRID: AB_389357 |
| CD73-Pacific Blue | Biolegend | Clone: Ty/11.8; Cat# 127212; RRID: AB_11219190 |
| CD38-PE | Biolegend | Clone: 90; Cat# 102707; RRID: AB_312928 |
| CD38-APC | Biolegend | Clone: 90; Cat# 102711; RRID: AB_312932 |
| CD71-PE/Cy7 | Biolegend | Clone: RI7217; Cat# 113811; RRID: AB_2203383 |
| PD1-PE | Biolegend | Clone: RMP1-30; Cat# 109103; RRID: AB_313420 |
| PD1-PE/Cy7 | Biolegend | Clone: RMP1-30; Cat# 109109; RRID: AB_572016 |
| CD98-PE | Biolegend | Clone: RL388; Cat# 128207; RRID: AB_1186107 |
| Annexin V FITC | BD Biosciences | Clone: N/A; Cat# 51-65874X; RRID: N/A |
| CD45.1-APC | BD Biosciences | Clone: A20; Cat# 558701; RRID: AB_1645214 |
| Vβ13-FITC | BD Biosciences | Clone: MR1 2-3; Cat# 553204; RRID: AB_394706 |
| Vβ14-FITC | BD Biosciences | Clone: 14-2; Cat# 553258; RRID: AB_394738 |
| Vβ12-FITC | Thermo Fisher Scientific | Clone: S511; Cat# TCR2654; RRID: AB_417092 |
| Slc1a5 | Thermo Fisher Scientific | Clone: N/A; Cat# PA5-50527; RRID: AB_2635980 |
| Anti-Goat Alexa647 | Thermo Fisher Scientific | Clone: N/A; Cat# A21447; RRID: AB_141844 |
| pFoxo1 (S256) | Cell Signaling Technology | Clone: N/A; Cat# 9461; RRID: AB_329831 |
| Phospho-S6 Ribosomal Protein (Ser235/236)-Alexa647 | Cell Signaling Technology | Clone: D57.2.2E; Cat# 4851; RRID: AB_916160 |
| Hexokinase I (HK I) | Cell Signaling Technology | Clone: C35C4; Cat# 2024S; RRID: AB_2116996 |
| Hexokinase II (HK II) | Cell Signaling Technology | Clone: C64G5; Cat# 2867S; RRID: AB_2232946 |
| Platelet-type phosphofructokinase (PFKP) | Cell Signaling Technology | Clone: D4B2; Cat# 8164S; RRID: N/A |
| Glyceraldehyde-3-phosphate dehydrogenase (GAPDH) | Cell Signaling Technology | Clone: D16H11; Cat# 5174S; RRID: AB_10622025 |
| Lactate dehydrogenase (LDH) | Cell Signaling Technology | Clone: C4B5; Cat# 3582S; RRID: AB_2066887 |
| Pyruvate kinase M 1/2 (PKM1/2) | Cell Signaling Technology | Clone: C103A3; Cat# 3190S; RRID: AB_2163695 |
| Pyruvate Dehydrogenase | Cell Signaling Technology | Clone: C54G1; Cat# 3205S; RRID: AB_2162926 |
| Glutamate Dehydrogenase 1/2 (Glud1/12) | Cell Signaling Technology | Clone: D9F7P; Cat# 12793S; RRID: N/A |
| Foxo1 | Cell Signaling Technology | Clone: C29H4; Cat# 2880S; RRID: AB_2106495 |
| Acetylated-Lysine | Cell Signaling Technology | Clone: N/A; Cat# 9441S; RRID: N/A |
| Anti-Rabbit HRP | Cell Signaling Technology | Clone: N/A; Cat# 7074S; RRID: N/A |
| PGC1 α-Alexa647 | Novus Biologicals | Clone: N/A; Cat# NBP1-04676AF647; RRID: N/A |
| Glutaminase (Gls) | Novus Biologicals | Clone: N/A; Cat# NBP2-29940; RRID: N/A |
| Anti-Rabbit PE | Jackson ImmunoResearch Laboratories | Clone: N/A; Cat# 111-116-144; RRID: AB_2337985 |
| Anti-Rabbit Alexa647 | Jackson ImmunoResearch Laboratories | Clone: N/A; Cat# 111-607-003; RRID: AB_2338084 |
| xCT | Santa Cruz Biotechnology | Clone: Q-18; Cat# Sc79360; RRID: AB_2190856 |
| InVivoMab anti-mouse IL-17A | BioXCell | Clone: 17F3; Cat# BE0173; RRID: AB_10950102 |
| InVivoMAb anti-mouse IFNγ | BioXCell | Clone: XMG1.2; Cat# BE0055; RRID: AB_1107694 |
| Anti CD38 VHH Single Domain Antibody | Creative Biolabs | Clone: N/A; Cat# NABL-079; RRID: N/A |
| Chemicals, Peptides, and Recombinant Proteins | ||
| FK866 | Cayman Chemical | Cat# 13287 |
| Ex527 | Cayman Chemical | Cat# 10009798 |
| Etomoxir | Cayman Chemical | Cat# 11969 |
| AKTi | Cayman Chemical | Cat# 14870 |
| SC-79 | Sigma Aldrich | Cat# SML0749 |
| 6-Diazo-5-oxo-L-norleucine (DON) | Sigma Aldrich | Cat# D2141 |
| 2-Deoxy-D-glucose (2DG) | Sigma Aldrich | Cat# D6134 |
| Antimycin A | Sigma Aldrich | Cat# A8674 |
| Rotenone | Sigma Aldrich | Cat# R8875 |
| Oligomycin | Sigma Aldrich | Cat# O4876 |
| FCCP | Sigma Aldrich | Cat# C2920 |
| IMDM | GE Healthcare, HyClone | Cat# SH30228.01 |
| RPMI-1640 (Glucose free) | Thermo Fisher Scientific | Cat# 11879-020 |
| RPMI-1640 (glutamine free) | Thermo Fisher Scientific | Cat# 21870-076 |
| Penicillin-Streptomycin | Corning | Cat# 30-001-CI |
| Fetal Bovine Serum (FBS) | Atlanta Biologicals | Cat# S11150 |
| rIL12 | Biolegend | Cat# 577004 |
| rIL6 | Biolegend | Cat# 575704 |
| rIL1β | Biolegend | Cat# 575104 |
| rIL23 | Biolegend | Cat# 589002 |
| rTGFβ | Biolegend | Cat# 580702 |
| rhIL2 | NCI, Biological Resources Branch | https://ncifrederick.cancer.gov/research/brb/productDataSheets/cytokineHumanInterleukins/IL-2Bulk.aspx |
| Foxp3 / Transcription Factor Staining Buffer Set | Thermo Fisher Scientific | Cat# 00-5523 |
| Fixation/Permeabilization Solution Kit | BD Biosciences | Cat# 554714 |
| Mouse CD4+ T cell isolation kit | Miltenyi Biotec | Cat# 130-104-454 |
| hgp10025–33 peptide (KVPRNQDW) | Genscript | Cat# RP20344 |
| TRP-1106–130 peptide (SGHNCGTCR PGWRGAACNQKILTVR) | NeoMPS | Custom synthesized |
| TCR-I peptide (SAINNYAQKL) | Sydlabs | Cat# 075472 |
| RIPA Lysis Buffer | Thermo Fisher Scientific | Cat# 89900 |
| NE-PER Nuclear and Cytoplasmic Extraction Reagents | Thermo Fisher Scientific | Cat# 78833 |
| Critical Commercial Assays | ||
| CellTrace CFSE Cell Proliferation Kit | Thermo Fisher Scientific | Cat# C34554 |
| CellTrace Violet Cell Proliferation Kit | Thermo Fisher Scientific | Cat# C34557 |
| NAD/NADH Cell-Based Assay Kit | Cayman Chemical | Cat# 600480 |
| Universal SIRT Activity Assay Kit | abcam | Cat# ab156915 |
| TransAM FKHR (FOXO1) Transcription Factor ELISA Kits | Active Motif | Cat# 46396 |
| Akt kinase activity kit | Enzo Life Sciences | Cat# ADI-EKS-400A |
| Immunoprecipitation (IP) Kit | Biovision | Cat# K286-25 |
| iScript cDNA Synthesis Kit | Biorad | Cat# 1708891 |
| SsoAdvanced Universal SYBR Green Supermix | Biorad | Cat# 1725274 |
| Deposited Data | ||
| Gene microarray dataset | This paper | ArrayExpress accession # E-MTAB-5237 |
| Experimental Models: Cell Lines | ||
| B16-F10 | ATCC | CRL-6475 |
| B16-F10-A2+ | Rolf Kiessling, Karolinska Institute, Stockholm, Sweden. Mycoplasma testing was done in Mehrotra lab. | N/A |
| Experimental Models: Organisms/Strains | ||
| C57BL/6 | Jackson Laboratory | Stock# 000664 |
| C57BL/6-Tg(HLA-A2.1)1Enge/J | Jackson Laboratory | Stock# 003475 |
| B6.129S7-Rag1tm1Mom/J | Jackson Laboratory | Stock# 002216 |
| B6.129P2-Cd38tm1Lnd/J | Jackson Laboratory | Stock# 003727 |
| B6;129-Sirt1tm1Ygu/J | Jackson Laboratory | Stock# 008041 |
| Tg(Cd4-cre)1Cwi/BfluJ | Jackson Laboratory | Stock# 017336 |
| B6.SJL-Ptprca Pepcb/BoyJ | Jackson Laboratory | Stock# 002014 |
| B6.129S7-Ifngtm1Ts/J | Jackson Laboratory | Stock# 002287 |
| B6.Cg-Rag1tm1Mom Tyrp1B-w Tg(Tcra,Tcrb)9Rest/J | Jackson Laboratory | Stock# 008684 |
| B6.Cg-Thy1a/Cy Tg(TcraTcrb)8Rest/J | Jackson Laboratory | Stock# 005023 |
| C57BL/6-Tg(TRAMP)8247Ng/J | Jackson Laboratory | Stock# 003135 |
| IFNγThy1.1 knockin | Casey T. Weaver, University of Alabama at Birmingham (UAB) | (Harrington et al., 2008) |
| Foxo1fl/flLckcre | Melanie Gubbels Bupp, Randolph-Macon College, VA | (Gubbels Bupp et al., 2009) |
| TCR-I | Jennifer Wu, MUSC | (Staveley-O’Carroll et al., 2003) |
| Oligonucleotides | ||
| Primers for qPCR, see Table S4 | ||
| Recombinant DNA | ||
| MSGV1-TRP-1 vector | (Kerkar et al., 2011) | N/A |
| LV-TCR/sr39TK-GFP vector | (Koya et al., 2010) | N/A |
| Software and Algorithms | ||
| FlowJo 10.2 | TreeStar, OR | https://www.flowjo.com/solutions/flowjo/downloads/ |
| Prism 5 | GraphPad | https://www.graphpad.com/scientiflc-software/prism/ |
| Agilent Seahorse Wave 2.4 | Agilent | http://www.agilent.com/en-us/products/cell-analysis-(seahorse)/seahorse-wave-software |
| CFX Manager 3.1 | Biorad | http://www.bio-rad.com/en-us/sku/soft-cfx-31-patch-cfx-manager-software-v3-1-upgrade |
| GenomeStudio software | Illumina | https://www.illumina.com/techniques/microarrays/array-data-analysis-experimental-design/genomestudio.html |
| PIMENTo | (Sásik et al., 2004) | https://github.com/MUSC-CGM/PIMENTo |
| ToppGene Suite | (Chen et al., 2009) | https://toppgene.cchmc.org/ |
| Venny | This paper | http://bioinfogp.cnb.csic.es/tools/venny/index.html |
Highlights.
Th1/17 cells with effector and stemness features exhibit durable tumor control
High glutaminolysis of Th1/17 cell regulates its viability and anti-tumor response
NAD+-Sirt1-Foxo1 axis is central to the anti-tumor phenotype of Th1/17 cells
Targeting NADase CD38 on T cells increases NAD+ levels and controls tumor growth
Acknowledgments
The authors sincerely acknowledge help from Ms. Carla Stipe Frichtel, MBA, in preparation of this manuscript. Support from Ms. Nancy Smythe for electron microscopy images at MUSC is also acknowledged. The work was supported in part by NIH grants R21CA137725 and R01CA138930 (to S.M.) and P01CA154778 (to M.I.N.). A.D. is supported by the DoD Cancer Research Program (W81XWH-16-1-0273). Support from Hollings Cancer Center Shared Resources (partly supported by P30 CA138313) at MUSC is also acknowledged. S.M. and S.C. are inventors on a provisional patent application covering CD38-mediated metabolic axis in anti-tumor T cell immunotherapy owned by the MUSC Foundation for Research Development.
Footnotes
SUPPLEMENTAL INFORMATION
Supplemental Information includes seven figures and four tables and can be found with this article online at https://doi.org/10.1016/j.cmet.2017.10.006.
AUTHOR CONTRIBUTIONS
Conception and design: S.C., X.Z.Y., and S.M. Development of methodology: S.C., A.D., P.C., M.W.W., P.D., S.P., F.J., M.M., S.H., J.W., H.N., M.A.H., M.H., M.I.N., X.Y.Z., and S.M. Acquisition of data (provided animals, acquired and managed patients, provided facilities, etc.): K.T., I.K., G.B., L.B., K.H., C.M.P., M.G.B., C.C.B., J.W., and B.O. Analysis and interpretation of data (e.g., statistical analysis, biostatistics, computational analysis): S.C., A.D., L.B., K.H., M.M., E.G.M., G.H., and S.M. Writing, review, and/or revision of the manuscript: S.C., A.D., P.C., M.W.W., H.N., M.I.N., J.W., C.M.P., J.R., X.Z.Y., and S.M. Administrative, technical, or material support (i.e., reporting or organizing data, constructing databases): S.C., A.D., P.C., E.G.M., G.H., and S.M. Study supervision: S.M.
References
- Benjamini Y, Hochberg Y. Controlling the false discovery rate: a practical and powerful approach to multiple testing. J R Stat Soc B. 1995;57:289–300. [Google Scholar]
- Bruzzone S, Fruscione F, Morando S, Ferrando T, Poggi A, Garuti A, D’Urso A, Selmo M, Benvenuto F, Cea M, et al. Catastrophic NAD+ depletion in activated T lymphocytes through Nampt inhibition reduces demyelination and disability in EAE. PLoS One. 2009;4:e7897. doi: 10.1371/journal.pone.0007897. [DOI] [PMC free article] [PubMed] [Google Scholar]
- Buck MD, O’Sullivan D, Klein Geltink RI, Curtis JD, Chang CH, Sanin DE, Qiu J, Kretz O, Braas D, van der Windt GJ, et al. Mitochondrial dynamics controls T cell fate through metabolic programming. Cell. 2016;166:63–76. doi: 10.1016/j.cell.2016.05.035. [DOI] [PMC free article] [PubMed] [Google Scholar]
- Buck MD, O’Sullivan D, Pearce EL. T cell metabolism drives immunity. J Exp Med. 2015;212:1345–1360. doi: 10.1084/jem.20151159. [DOI] [PMC free article] [PubMed] [Google Scholar]
- Camacho-Pereira J, Tarragó MG, Chini CCS, Nin V, Escande C, Warner GM, Puranik AS, Schoon RA, Reid JM, Galina A, Chini EN. CD38 dictates age-related NAD decline and mitochondrial dysfunction through an SIRT3-dependent mechanism. Cell Metab. 2016;23:1127–1139. doi: 10.1016/j.cmet.2016.05.006. [DOI] [PMC free article] [PubMed] [Google Scholar]
- Caro-Maldonado A, Gerriets VA, Rathmell JC. Matched and mismatched metabolic fuels in lymphocyte function. Semin Immunol. 2012;24:405–413. doi: 10.1016/j.smim.2012.12.002. [DOI] [PMC free article] [PubMed] [Google Scholar]
- Chang CH, Curtis JD, Maggi LB, Jr, Faubert B, Villarino AV, O’Sullivan D, Huang SC, van der Windt GJ, Blagih J, Qiu J, et al. Posttranscriptional control of T cell effector function by aerobic glycolysis. Cell. 2013;153:1239–1251. doi: 10.1016/j.cell.2013.05.016. [DOI] [PMC free article] [PubMed] [Google Scholar]
- Chang CH, Pearce EL. Emerging concepts of T cell metabolism as a target of immunotherapy. Nat Immunol. 2016;17:364–368. doi: 10.1038/ni.3415. [DOI] [PMC free article] [PubMed] [Google Scholar]
- Chatterjee S, Thyagarajan K, Kesarwani P, Song JH, Soloshchenko M, Fu J, Bailey SR, Vasu C, Kraft AS, Paulos CM, et al. Reducing CD73 expression by IL1β-Programmed Th17 cells improves immunotherapeutic control of tumors. Cancer Res. 2014;74:6048–6059. doi: 10.1158/0008-5472.CAN-14-1450. [DOI] [PMC free article] [PubMed] [Google Scholar]
- Chen J, Bardes EE, Aronow BJ, Jegga AG. ToppGene Suite for gene list enrichment analysis and candidate gene prioritization. Nucleic Acids Res. 2009;37:W305–W311. doi: 10.1093/nar/gkp427. [DOI] [PMC free article] [PubMed] [Google Scholar]
- Chini EN. CD38 as a regulator of cellular NAD: a novel potential pharmacological target for metabolic conditions. Curr Pharm Des. 2009;15:57–63. doi: 10.2174/138161209787185788. [DOI] [PMC free article] [PubMed] [Google Scholar]
- Crompton JG, Clever D, Vizcardo R, Rao M, Restifo NP. Reprogramming antitumor immunity. Trends Immunol. 2014;35:178–185. doi: 10.1016/j.it.2014.02.003. [DOI] [PMC free article] [PubMed] [Google Scholar]
- Daitoku H, Hatta M, Matsuzaki H, Aratani S, Ohshima T, Miyagishi M, Nakajima T, Fukamizu A. Silent information regulator 2 potentiates Foxo1-mediated transcription through its deacetylase activity. Proc Natl Acad Sci USA. 2004;101:10042–10047. doi: 10.1073/pnas.0400593101. [DOI] [PMC free article] [PubMed] [Google Scholar]
- Daitoku H, Sakamaki J, Fukamizu A. Regulation of FoxO transcription factors by acetylation and protein-protein interactions. Biochim Biophys Acta. 2011;1813:1954–1960. doi: 10.1016/j.bbamcr.2011.03.001. [DOI] [PubMed] [Google Scholar]
- Daitoku H, Yamagata K, Matsuzaki H, Hatta M, Fukamizu A. Regulation of PGC-1 promoter activity by protein kinase B and the forkhead transcription factor FKHR. Diabetes. 2003;52:642–649. doi: 10.2337/diabetes.52.3.642. [DOI] [PubMed] [Google Scholar]
- Doedens AL, Phan AT, Stradner MH, Fujimoto JK, Nguyen JV, Yang E, Johnson RS, Goldrath AW. Hypoxia-inducible factors enhance the effector responses of CD8(+) T cells to persistent antigen. Nat Immunol. 2013;14:1173–1182. doi: 10.1038/ni.2714. [DOI] [PMC free article] [PubMed] [Google Scholar]
- Emtage PC, Clarke D, Gonzalo-Daganzo R, Junghans RP. Generating potent Th1/Tc1 T cell adoptive immunotherapy doses using human IL-12: Harnessing the immunomodulatory potential of IL-12 without the in vivo-associated toxicity. J Immunother. 2003;26:97–106. doi: 10.1097/00002371-200303000-00002. [DOI] [PubMed] [Google Scholar]
- Gerriets VA, Kishton RJ, Nichols AG, Macintyre AN, Inoue M, Ilkayeva O, Winter PS, Liu X, Priyadharshini B, Slawinska ME, et al. Metabolic programming and PDHK1 control CD4+ T cell subsets and inflammation. J Clin Invest. 2015;125:194–207. doi: 10.1172/JCI76012. [DOI] [PMC free article] [PubMed] [Google Scholar]
- Gubbels Bupp MR, Edwards B, Guo C, Wei D, Chen G, Wong B, Masteller E, Peng SL. T cells require Foxo1 to populate the peripheral lymphoid organs. Eur J Immunol. 2009;39:2991–2999. doi: 10.1002/eji.200939427. [DOI] [PMC free article] [PubMed] [Google Scholar]
- Harrington LE, Janowski KM, Oliver JR, Zajac AJ, Weaver CT. Memory CD4 T cells emerge from effector T-cell progenitors. Nature. 2008;452:356–360. doi: 10.1038/nature06672. [DOI] [PubMed] [Google Scholar]
- Hess Michelini R, Doedens AL, Goldrath AW, Hedrick SM. Differentiation of CD8 memory T cells depends on Foxo1. J Exp Med. 2013;210:1189–1200. doi: 10.1084/jem.20130392. [DOI] [PMC free article] [PubMed] [Google Scholar]
- Jogl G, Hsiao YS, Tong L. Structure and function of carnitine acyltransferases. Ann N Y Acad Sci. 2004;1033:17–29. doi: 10.1196/annals.1320.002. [DOI] [PubMed] [Google Scholar]
- Kerkar SP, Sanchez-Perez L, Yang S, Borman ZA, Muranski P, Ji Y, Chinnasamy D, Kaiser AD, Hinrichs CS, Klebanoff CA, et al. Genetic engineering of murine CD8+ and CD4+ T cells for preclinical adoptive immunotherapy studies. J Immunother. 2011;34:343–352. doi: 10.1097/CJI.0b013e3182187600. [DOI] [PMC free article] [PubMed] [Google Scholar]
- Klysz D, Tai X, Robert PA, Craveiro M, Cretenet G, Oburoglu L, Mongellaz C, Floess S, Fritz V, Matias MI, et al. Glutamine-dependent α-ketoglutarate production regulates the balance between T helper 1 cell and regulatory T cell generation. Sci Signal. 2015;8:ra97. doi: 10.1126/scisignal.aab2610. [DOI] [PubMed] [Google Scholar]
- Koya RC, Mok S, Comin-Anduix B, Chodon T, Radu CG, Nishimura MI, Witte ON, Ribas A. Kinetic phases of distribution and tumor targeting by T cell receptor engineered lymphocytes inducing robust antitumor responses. Proc Natl Acad Sci USA. 2010;107:14286–14291. doi: 10.1073/pnas.1008300107. [DOI] [PMC free article] [PubMed] [Google Scholar]
- Kryczek I, Zhao E, Liu Y, Wang Y, Vatan L, Szeliga W, Moyer J, Klimczak A, Lange A, Zou W. Human TH17 cells are long-lived effector memory cells. Sci Transl Med. 2011;3:104ra100. doi: 10.1126/scitranslmed.3002949. [DOI] [PMC free article] [PubMed] [Google Scholar]
- Le A, Lane AN, Hamaker M, Bose S, Gouw A, Barbi J, Tsukamoto T, Rojas CJ, Slusher BS, Zhang H, et al. Glucose-independent glutamine metabolism via TCA cycling for proliferation and survival in B cells. Cell Metab. 2012;15:110–121. doi: 10.1016/j.cmet.2011.12.009. [DOI] [PMC free article] [PubMed] [Google Scholar]
- Lee Y, Awasthi A, Yosef N, Quintana FJ, Xiao S, Peters A, Wu C, Kleinewietfeld M, Kunder S, Hafler DA, et al. Induction and molecular signature of pathogenic TH17 cells. Nat Immunol. 2012;13:991–999. doi: 10.1038/ni.2416. [DOI] [PMC free article] [PubMed] [Google Scholar]
- Li X. SIRT1 and energy metabolism. Acta Biochim Biophys Sin (Shanghai) 2013;45:51–60. doi: 10.1093/abbs/gms108. [DOI] [PMC free article] [PubMed] [Google Scholar]
- Lord GM, Rao RM, Choe H, Sullivan BM, Lichtman AH, Luscinskas FW, Glimcher LH. T-bet is required for optimal proinflammatory CD4+ T-cell trafficking. Blood. 2005;106:3432–3439. doi: 10.1182/blood-2005-04-1393. [DOI] [PMC free article] [PubMed] [Google Scholar]
- Lu Y, Hong S, Li H, Park J, Hong B, Wang L, Zheng Y, Liu Z, Xu J, He J, et al. Th9 cells promote antitumor immune responses in vivo. J Clin Invest. 2012;122:4160–4171. doi: 10.1172/JCI65459. [DOI] [PMC free article] [PubMed] [Google Scholar]
- Mehrotra S, Al-Khami AA, Klarquist J, Husain S, Naga O, Eby JM, Murali AK, Lyons GE, Li M, Spivey ND, et al. A coreceptor-independent transgenic human TCR mediates anti-tumor and anti-self immunity in mice. J Immunol. 2012;189:1627–1638. doi: 10.4049/jimmunol.1103271. [DOI] [PMC free article] [PubMed] [Google Scholar]
- Meyerhof O. Mechanisms of glycolysis and fermentation. Can J Med Sci. 1951;29:63–77. doi: 10.1139/cjms51-008. [DOI] [PubMed] [Google Scholar]
- Morandi F, Morandi B, Horenstein AL, Chillemi A, Quarona V, Zaccarello G, Carrega P, Ferlazzo G, Mingari MC, Moretta L, et al. A non-canonical adenosinergic pathway led by CD38 in human melanoma cells induces suppression of T cell proliferation. Oncotarget. 2015;6:25602–25618. doi: 10.18632/oncotarget.4693. [DOI] [PMC free article] [PubMed] [Google Scholar]
- Mullen AC, Hutchins AS, High FA, Lee HW, Sykes KJ, Chodosh LA, Reiner SL. Hlx is induced by and genetically interacts with T-bet to promote heritable T(H)1 gene induction. Nat Immunol. 2002;3:652–658. doi: 10.1038/ni807. [DOI] [PubMed] [Google Scholar]
- Muranski P, Boni A, Antony PA, Cassard L, Irvine KR, Kaiser A, Paulos CM, Palmer DC, Touloukian CE, Ptak K, et al. Tumor-specific Th17-polarized cells eradicate large established melanoma. Blood. 2008;112:362–373. doi: 10.1182/blood-2007-11-120998. [DOI] [PMC free article] [PubMed] [Google Scholar]
- Muranski P, Borman ZA, Kerkar SP, Klebanoff CA, Ji Y, Sanchez-Perez L, Sukumar M, Reger RN, Yu Z, Kern SJ, et al. Th17 cells are long lived and retain a stem cell-like molecular signature. Immunity. 2011;35:972–985. doi: 10.1016/j.immuni.2011.09.019. [DOI] [PMC free article] [PubMed] [Google Scholar]
- Newsholme EA, Crabtree B, Ardawi MS. Glutamine metabolism in lymphocytes: its biochemical, physiological and clinical importance. Q J Exp Physiol. 1985;70:473–489. doi: 10.1113/expphysiol.1985.sp002935. [DOI] [PubMed] [Google Scholar]
- Pearce EL, Shen H. Generation of CD8 T cell memory is regulated by IL-12. J Immunol. 2007;179:2074–2081. doi: 10.4049/jimmunol.179.4.2074. [DOI] [PubMed] [Google Scholar]
- Rao RR, Li Q, Gubbels Bupp MR, Shrikant PA. Transcription factor Foxo1 represses T-bet-mediated effector functions and promotes memory CD8(+) T cell differentiation. Immunity. 2012;36:374–387. doi: 10.1016/j.immuni.2012.01.015. [DOI] [PMC free article] [PubMed] [Google Scholar]
- Redeker A, Arens R. Improving Adoptive T Cell Therapy: The Particular Role of T Cell Costimulation, Cytokines, and Post-Transfer Vaccination. Front Immunol. 2016;7:345. doi: 10.3389/fimmu.2016.00345. [DOI] [PMC free article] [PubMed] [Google Scholar]
- Rodgers JT, Lerin C, Haas W, Gygi SP, Spiegelman BM, Puigserver P. Nutrient control of glucose homeostasis through a complex of PGC-1alpha and SIRT1. Nature. 2005;434:113–118. doi: 10.1038/nature03354. [DOI] [PubMed] [Google Scholar]
- Rolf J, Zarrouk M, Finlay DK, Foretz M, Viollet B, Cantrell DA. AMPKa1: a glucose sensor that controls CD8 T-cell memory. Eur J Immunol. 2013;43:889–896. doi: 10.1002/eji.201243008. [DOI] [PMC free article] [PubMed] [Google Scholar]
- Rosenberg SA, Restifo NP. Adoptive cell transfer as personalized immunotherapy for human cancer. Science. 2015;348:62–68. doi: 10.1126/science.aaa4967. [DOI] [PMC free article] [PubMed] [Google Scholar]
- Sásik R, Woelk CH, Corbeil J. Microarray truths and consequences. J Mol Endocrinol. 2004;33:1–9. doi: 10.1677/jme.0.0330001. [DOI] [PubMed] [Google Scholar]
- Scharping NE, Menk AV, Moreci RS, Whetstone RD, Dadey RE, Watkins SC, Ferris RL, Delgoffe GM. The Tumor Microenvironment Represses T Cell Mitochondrial Biogenesis to Drive Intratumoral T Cell Metabolic Insufficiency and Dysfunction. Immunity. 2016;45:374–388. doi: 10.1016/j.immuni.2016.07.009. [DOI] [PMC free article] [PubMed] [Google Scholar]
- Shi LZ, Wang R, Huang G, Vogel P, Neale G, Green DR, Chi H. HIF1alpha-dependent glycolytic pathway orchestrates a metabolic checkpoint for the differentiation of TH17 and Treg cells. J Exp Med. 2011;208:1367–1376. doi: 10.1084/jem.20110278. [DOI] [PMC free article] [PubMed] [Google Scholar]
- Staveley-O’Carroll K, Schell TD, Jimenez M, Mylin LM, Tevethia MJ, Schoenberger SP, Tevethia SS. In vivo ligation of CD40 enhances priming against the endogenous tumor antigen and promotes CD8+ T cell effector function in SV40 T antigen transgenic mice. J Immunol. 2003;171:697–707. doi: 10.4049/jimmunol.171.2.697. [DOI] [PubMed] [Google Scholar]
- Sukumar M, Liu J, Ji Y, Subramanian M, Crompton JG, Yu Z, Roychoudhuri R, Palmer DC, Muranski P, Karoly ED, et al. Inhibiting glycolytic metabolism enhances CD8+ T cell memory and antitumor function. J Clin Invest. 2013;123:4479–4488. doi: 10.1172/JCI69589. [DOI] [PMC free article] [PubMed] [Google Scholar]
- Terme M, Ullrich E, Aymeric L, Meinhardt K, Desbois M, Delahaye N, Viaud S, Ryffel B, Yagita H, Kaplanski G, et al. IL-18 induces PD-1-dependent immunosuppression in cancer. Cancer Res. 2011;71:5393–5399. doi: 10.1158/0008-5472.CAN-11-0993. [DOI] [PubMed] [Google Scholar]
- Tsung K, Meko JB, Peplinski GR, Tsung YL, Norton JA. IL-12 induces T helper 1-directed antitumor response. J Immunol. 1997;158:3359–3365. [PubMed] [Google Scholar]
- Tullius SG, Biefer HR, Li S, Trachtenberg AJ, Edtinger K, Quante M, Krenzien F, Uehara H, Yang X, Kissick HT, et al. NAD+ protects against EAE by regulating CD4+ T-cell differentiation. Nat Commun. 2014;5:5101. doi: 10.1038/ncomms6101. [DOI] [PMC free article] [PubMed] [Google Scholar]
- Tusher VG, Tibshirani R, Chu G. Significance analysis of micro-arrays applied to the ionizing radiation response. Proc Natl Acad Sci USA. 2001;98:5116–5121. doi: 10.1073/pnas.091062498. [DOI] [PMC free article] [PubMed] [Google Scholar]
- van der Windt GJ, Pearce EL. Metabolic switching and fuel choice during T-cell differentiation and memory development. Immunol Rev. 2012;249:27–42. doi: 10.1111/j.1600-065X.2012.01150.x. [DOI] [PMC free article] [PubMed] [Google Scholar]
- Wei S, Zhao E, Kryczek I, Zou W. Th17 cells have stem cell-like features and promote long-term immunity. OncoImmunology. 2012;1:516–519. doi: 10.4161/onci.19440. [DOI] [PMC free article] [PubMed] [Google Scholar]
- Yu JC, Jiang ZM, Li DM. Glutamine: a precursor of glutathione and its effect on liver. World J Gastroenterol. 1999;5:143–146. doi: 10.3748/wjg.v5.i2.143. [DOI] [PMC free article] [PubMed] [Google Scholar]
- Yu Y, Cho HI, Wang D, Kaosaard K, Anasetti C, Celis E, Yu XZ. Adoptive transfer of Tc1 or Tc17 cells elicits antitumor immunity against established melanoma through distinct mechanisms. J Immunol. 2013;190:1873–1881. doi: 10.4049/jimmunol.1201989. [DOI] [PMC free article] [PubMed] [Google Scholar]
- Zhang T, Kraus WL. SIRT1-dependent regulation of chromatin and transcription: linking NAD(+) metabolism and signaling to the control of cellular functions. Biochim Biophys Acta. 2010;1804:1666–1675. doi: 10.1016/j.bbapap.2009.10.022. [DOI] [PMC free article] [PubMed] [Google Scholar]
Associated Data
This section collects any data citations, data availability statements, or supplementary materials included in this article.