

Abstract
Background
To understand the full impact of stunting in childhood it is important to consider the long-run effects of undernutrition on the outcomes of adults who were affected in early life. Focusing on the costs of stunting provides a means of evaluating the economic case for investing in childhood nutrition.
Methods
We review the literature on the association between stunting and undernutrition in childhood and economic outcomes in adulthood. At the national level, we also evaluate the evidence linking stunting to economic growth. Throughout, we consider randomized controlled trials (RCTs), quasi-experimental approaches and observational studies.
Results
Long-run evaluations of two randomized nutrition interventions indicate substantial returns to the programmes (a 25% and 46% increase in wages for those affected as children, respectively). Cost-benefit analyses of nutrition interventions using calibrated return estimates report a median return of 17.9:1 per child. Assessing the wage premium associated with adult height, we find that a 1-cm increase in stature is associated with a 4% increase in wages for men and a 6% increase in wages for women in our preferred set of studies which attempt to address unobserved confounding and measurement error. In contrast, the evidence on the association between economic growth and stunting is mixed.
Conclusions
Countries with high rates of stunting, such as those in South Asia and sub-Saharan Africa, should scale up policies and programmes aiming to reduce child undernutrition as cost-beneficial investments that expand the economic opportunities of their children, better allowing them and their countries to reach their full potential. However, economic growth as a policy will only be effective at reducing the prevalence of stunting when increases in national income are directed at improving the diets of children, addressing gender inequalities and strengthening the status of women, improving sanitation and reducing poverty and inequities.
Keywords: Stunting, productivity, economic growth, early childhood investment
Key Messages
Undernutrition in childhood, primarily as measured by stunting or height-for-age, is consistently linked to worse economic outcomes as an adult
Although lower than results from the two existing nutrition intervention studies which track affected children across the life course, quasi-experimental estimates of the impact of height on wages are substantial, the median being 4% per CM for men and 6% for women
Cost benefit analyses of childhood nutrition interventions typically find them to be cost beneficial or highly cost beneficial
At the country-level, there is little evidence that short-run increases in GDP can achieve meaningful reductions stunting prevalence, if increases in national income are not directed at improving the diets of children, addressing gender inequalities and strengthening the status of women, improving sanitation and reducing poverty and social inequities
Few studies examine the impact of undernutrition on economic growth, but spillover effects of health on labor markets and capital accumulation may be substantial
Countries facing high stunting prevalence, such as those in South Asia and sub-Saharan Africa, should consider resources used to improve childhood nutrition as cost-beneficial investments in the wellbeing of their populations and their economies
Introduction
There is growing interest in the long-run impact of childhood conditions among both researchers and policy makers, in part because there is mounting evidence that early life environments impact on a variety of later life outcomes, including health, nutrition, cognition and mortality. In low- and middle-income countries, the role of childhood growth restriction and stunting has been attracting particular attention1 which is likely a reflection of the fact that indicators of progress to address child undernutrition were included in the Millennium Development Goals;2 their inclusion in the post-2015 Sustainable Development Goals; and the suboptimal progress in many countries at achieving improvements in child nutrition.3 For example in South Asia, rates of childhood stunting remain at 38% despite rapid economic growth in some countries such as India.4 Advocacy for inclusion of child nutrition targets in the Sustainable Development Goals appeals to an emerging understanding of the consequences of failure to address early life undernutrition and the consequent impact of restriction of growth and developmental potential on both individuals and society as a whole. Incorporating markers of child nutrition into the new round of global development goals could prove beneficial in lowering stunting prevalence, not least by presenting an opportunity to build commitments to addressing this issue as part of a global policy platform.1 However, despite the policy focus on reducing stunting, there remain areas where the evidence is sparse. In particular, whereas there is an evidence base linking stunting to short-run outcomes in childhood such as cognition and educational attainment, evidence on the long-run effects is more limited. For example, cost-benefit analyses of nutrition interventions and reviews of potential wage losses associated with early life undernutrition tend to rely on calibrated estimates of returns to schooling, and the fact that children who are stunted have lower levels of educational attainment, rather than measures of the direct association between stunting and adult outcomes.5
It is important for policy makers to have accurate information on the long-run economic benefits associated with investments in child nutrition, particularly in contexts in which government resources are scarce or there is a high opportunity cost of funds due to attractive investment options in other domains such as education and infrastructure. If high-quality evidence demonstrates economic returns to reducing child stunting, this will make it easier to compare returns on investment with these alternatives on the basis of formal cost-benefit analyses.6
The aim of this paper is to address this knowledge gap by providing a comprehensive review of the evidence on the long-run economic impact of child undernutrition, mostly as measured by the direct association between stunting and later life outcomes. There are other overview papers dealing with child undernutrition, but they either do not focus on long-run economic outcomes, or else focus on a subset of the literature. In contrast, we provide a comprehensive review of intervention studies that track cohorts of individuals who received nutritional supplements in early childhood into adulthood, but also cover prospective cohorts where we have data on the same individuals across the life course (some of whom may have been stunted, but where there was no randomized intervention), papers which adopt a quasi-experimental approach relying on natural experiments (which affected nutritional intake in childhood) and observational cross-sectional data where we are able to measure the association between adult height and adult wages. After reviewing the individual-level correlates of stunting, we also discuss cost-benefit analyses of nutritional interventions and the aggregate relationship between stunting and economic growth at the country level. This is relevant because there may be spillover effects of child undernutrition on economies and society that would not be captured by simply adding up individual-level estimates. In addition, examining whether economic growth can be expected to successfully reduce stunting prevalence can provide an indication as to which channels are best targeted to achieve childhood nutrition targets.
The goal of reviewing these estimates is to support policy makers in evaluating whether nutrition programmes are an efficient use of public funds, and where programmes for reducing child stunting rank in terms of return on investment. We conclude the paper with a discussion on the implications of our findings for countries facing high prevalence of child undernutrition.
Methods
We conducted a literature search for studies published up to July 2015 that examined whether childhood stunting or other measures of undernutrition were associated with economic outcomes in later life. We excluded studies that examined outcomes in childhood (such as education or test scores) or other non-economic outcomes in adulthood (such as health or cognition). We also restricted our attention to papers that used measures or proxies of undernutrition in childhood as exposures, rather than broad measures of early life conditions such as socioeconomic status or health. We did not include studies that only examined exposures in utero, as the literature focusing on these areas has been covered elsewhere.7–11 We conducted our literature search using the Pubmed and Econlit databases for keywords in abstracts and titles related to the following economic outcomes: wages, income, salary, pay, earnings, productivity, capital, resources, work, employment, industry, hours worked, occupation, labour, sector, job, socioeconomic, savings, economic, returns, make ends meet, welfare, poverty; and the following measures of childhood undernutrition: stunting, child development, growth retardation, growth trajectory, linear growth, linear growth retardation, growth faltering, growth failure, early life growth failure, child undernutrition, child malnutrition, child nutrition. Search terms are shown in Box 1.
BOX 1. Search criteria
Databases searched:
PubMed, Econlit.
Key terms:
(wages, income, salary, pay, earnings, productivity, capital, resources, work, employment, industry, hours worked, occupation, labor, sector, job, socioeconomic, savings, economic, returns, make ends meet, welfare, poverty)
and
(stunting, child development, growth retardation, growth trajectory, linear growth, linear growth retardation, growth faltering, growth failure, early life growth failure, child undernutrition, child malnutrition, child nutrition).
Combinations and variations of these keywords were also included in the search using the wildcard operator, and we supplemented the search using the references of the studies we located, as well as the citations of these studies obtained from Google Scholar. We identified 29 key summary papers that provided conceptual or background material related to research on the long-run economic effects of childhood stunting or undernutrition. We also identified 21 prospective studies (some of which were based on similar underlying data and some of which contained data from more than a single country) from 14 cohort studies and seven intervention studies, along with five natural experiment papers which retrospectively tied individuals to periods of adversity argued to be related to undernutrition in early life. We supplemented these prospective studies and review papers with cross-sectional research that examined the relationship between adult height and adult economic outcomes. We identified 10 quasi-experimental instrumental variables papers in this area in which we were able to extract a coefficient measuring the association between a 1-cm change in height and the percentage change in wages. A further 17 studies used linear regression to examine the wage premium related to height but did not attempt to adjust for unobserved confounding or measurement error. We identified another 30 studies that provided evidence on the relationship between adult height and other adult economic outcomes.
An important methodological issue for this literature is how child undernutrition is measured. The papers we consider can be roughly divided into three categories. In the first set, undernutrition in early life is measured contemporaneously during childhood, almost always using height-for-age, and then, in a subsequent iteration of the study, the adult outcomes of these children are observed. Low height-for-age is generally used to indicate failure to reach growth potential due to inadequate net nutrition, and is often dichotomized into an indicator for stunting (being 2 standard deviations or more below the reference height-for-age, typically the World Health Organization growth standard).12 In the second set, we observe the adult outcomes of individuals for whom we do not have a direct measure of early life undernutrition, but we know that some of these individuals were exposed to an event such as a famine during their childhood. In the third set, we observe the adult outcomes of individuals and their adult heights. In order to emphasize the importance of taking into account how childhood undernutrition was measured, in Tables 2, 3 and 4 we note the exposure used in each study in column 6. In Tables 5 and 6 we note the age at which the exposure (adult height) was measured in column 9.
Table 2.
Intervention studies on the economic consequences of childhood stunting and undernutrition
| Authors | Location | Data | Design | Year | Exposure | Result |
|---|---|---|---|---|---|---|
| Gertler et al. 2014 | Jamaica | Jamaican Study | Randomized, intention to treat | 1986–87 | Psychosocial stimulation to growth-stunted toddlers | Intervention increased earnings by 25% |
| Haas et al. 1996; Haas et al. 1995 | Guatemala | INCAP: Institute of Nutrition of Central America and Panama | Cluster, randomized, intention to treat | 1969–77 | Nutritional supplementation experiment during gestation and the preschool years | Maximum oxygen consumption (VO2max) at follow-up was significantly greater in subjects from treated villages of both sexes (+0.038) |
| Hodonnitt et al. 2005; Hodonnitt et al. 2008; Martorell et al. 2010 | Guatemala | INCAP | Cluster, randomized, intention to treat | 1969–77 | Nutritional supplementation experiment during gestation and the preschool years | 46% increase in average wages for men |
| Hoddinott et al. 2013 | Guatemala | INCAP | Cluster, randomized, instrumental variables/treatment on treated | 1969–77 | Height-for-age Z (HAZ) score at age 2 years | 1-SD increase in HAZ was associated with increased household per capita expenditure (21%) and a lower probability of living in poverty (10 percentage points) |
Table 3.
Natural experiments on the economic consequences of childhood stunting and undernutrition
| Authors | Location | Data | Design | Year | Exposure | Result |
|---|---|---|---|---|---|---|
| Chen and Zhou 2007 | China | China Health and Nutrition Survey: CHNS | Retrospective matching of cohort to event | 1959–61 | Famine exposure in early childhood | Labour supply reduced by 1.7–2.1% per 0.1% excess death rate increase; for the 1959 cohort, the annual per capita agrarian income decreased by approximately 2% |
| Jürges 2013 | Germany | Census: IPUMS | Retrospective matching of cohort to event | 1945–46 | Famine exposure in early life | Associations with income, occupational status and employment status for the cohort in utero only, not for those exposed in childhood |
| Lundborg et al. 2014 | Sweden | Military records | Prospective, sibling fixed effects | Swedish males enlisting for the military between 1984 and 1997 | Height at age 18 years | 0.42% increase in earnings per cm increase in occupational status |
| Neelsen and Stratmann 2011 | Greece | GEIS Census 10% sample | Retrospective matching of cohort to event | 1941–42 | Famine exposure in early life | International Socio-Economic Index of Occupational Status (ISEI), coefficient ranged between −0.296 and −1.111 |
| Maccini and Yang 2009 | Indonesia | Indonesia Family Life Survey: IFLS | Retrospective matching of cohort to event | 1953–74 | Rainfall exposure in early life | Women with 20% higher rainfall (relative to normal local rainfall) in their year and location of birth live in households that score 0.12 standard deviations higher on an asset index. No statistically significant relationship for men |
Table 4.
Prospective studies on the economic consequences of childhood stunting and undernutrition
| Authors | Location | Data | Design | Year | Exposure | Result |
|---|---|---|---|---|---|---|
| Galler et al. 2004 | Barbados | Prospective, matched | 1967–72 | Hospitalized for protein-energy malnutrition (PEM) during the first year of life | Hollingshead social position index (−0.62) and PCA standard of living index (+0.70) | |
| Satyanarayana et al. 1978; Satyanarayana et al. 1979 | India | Prospective | 1960–63 | Nutritional status age 5 (height for age) | Childhood malnutrition was associated with physical work capacity | |
| Carba et al. 2009 | Philippines | Cebu Longitudinal Health and Nutrition Survey | Prospective | 1983–85 | Length-for-age Z-score | 40% increase in likelihood of formal work compared with not working for men, 0.2 higher likelihood of formal vs informal work for females |
| Barker et al. 2005 | Finland | Cohort of men born in Helsinki | Prospective | Cohort born 1934–44 | Height at any age between birth and 12 years | Each 2-cm increase in length between birth and 1 year was associated with a 3.5% increase in income |
| Case et al. 2005 | England | National Child Development Study: NCDS | Prospective | Cohort born 1958 | Height at age 16 years | Increase in employment at age 33 but not at 46, increase in SES at ages 33 and 46 |
| Case and Paxson 2008 | England | NCDS | Prospective | Cohort born 1958 | Height at ages 7, 11 and 16 years | Height associated with income |
| Montgomery et al. 1996 | England | NCDS | Prospective | Cohort Born 1958 | Height at age 16 years | Odds ratio of 2.41 for being employed (bottom vs top height quintile) |
| Persico et al. 2004 | England | NCDS | Prospective | Cohort born 1958 | 0.88% increase in wages per unit, White male workers only | |
| Persico et al. 2004 | USA | National Longitudinal Survey of Youth: NLSY 1979 | Prospective | Men and women aged 14–21 in 1979 | Height aged 16–23 years | 0.72% increase in wages per unit, White male workers only |
| Sargent and Blanchflower 1994 | England | NCDS | Prospective | Cohort born 1958 | Height at ages 11, 16, 23 years | 0.2% increase in wages for men per cm increase in height after age 16, 0.1% for women |
| Victora et al. 2008 | Brazil | Pelotas birth cohort study | Prospective | Cohort born 1982 | Height-for-age score age 2 years | 8% increase in annual income for per SD increase |
| Victora et al. 2008 | Guatemala | INCAP | Prospective | 1969–77 | Height-for-age score age 2 years | Marginally significant (P < 0.1) 8% increase in annual income per SD increase |
| Victora et al. 2008 | India | Cohort born in New Deli | Prospective | 1969–72 | Height-for-age score age 2 years | 27% increase in number of household assets |
Table 5.
Quasi-experimental estimates of the association between adult height and wages
| Authors | Location | Data | Design | Year | All (Association) | Men (Association) | Women (Association) | Age exposure (height) and outcome (wages) measured | N | Notes |
|---|---|---|---|---|---|---|---|---|---|---|
| Böckerman and Vainiomäki 2013 | Finland | Older Finnish Twin Cohort Study | Twin FE IV | 1990–2004 | NS | 12% | Varied | 1284 | Average yearly earnings over the period; male estimate is similar but not statistically significant | |
| Elu and Price 2013a | China | CHNS | IV | 2006 | 10.30% | 5% | 7% | Varied | 1949 | Monthly earnings |
| Elu and Price 2013b | Tanzania | Tanzanian Household Worker Survey | IV | 2004 | 6% | −4% | Unknown | 427 | Hourly earnings, height in inches, coefficients are scaled by 0.4, not clear if age is controlled for | |
| Gao and Smyth 2010 | China | China Urban Labour Survey | IV | 2005 | 4.80% | 10.80% | Unknown | 11512 | Hourly wage; not clear if age is controlled for | |
| Heineck 2005 | Germany | German Socio-Economic Panel:GSOEP | IV | 2003 | NS | NS | Varied | 24000 | East Germany; gross monthly earnings; Hausman-Taylor IV | |
| Heineck 2005 | Germany | GSOEP | IV | 2003 | 0.50% | NS | Varied | 24000 | West Germany; gross monthly earnings | |
| Hoddinott et al. 2008 | Guatemala | INCAP | Intervention | 2002–04 | 15.80% | NS | 25–42 | 1424 | Semi-elasticity estimate is taken from Horton and Steckel (2011) | |
| Schultz 2002 | Brazil | Health and Nutrition Survey | IV | 1989 | 8–10% | 8–10% | 25–54 | 11855 | ||
| Schultz 2002 | USA | NLSY79 | IV | 1989–93 | 1–4% | 3–6% | 20–28 | 9257 | ||
| Schultz 2003 | Ivory Coast | Living Standards Measurement Surveys: LSMS | IV | 1985–89 | NS | NS | Varied | 12221 | Hourly wage | |
| Schultz 2002; Schultz 2003 | Ghana | LSMS | IV | 1985–90 | 5.60% | 7.60% | Varied | 10888 | Hourly wage | |
| Thomas and Strauss 1997 | Brazil | Estudo Nacional da Despesa Familiar: ENDEF | IV | 1974–75 | 1.43% | Mean = 36 | 10675 | Hourly wage; men in labour market only; regression included log height, semi-elasticity is for a 1-cm increase at mean height | ||
| Yimer and Fantaw 2011 | Ethiopia | Ethiopian Urban Household Survey: EUHS | IV | 2001 | 2% | Varied | 820 | Gross hourly wage; implementation of IV is not clearly defined |
NS, not statistically significant.
Table 6.
Linear regression estimates of the association between adult height and wages
| Authors | Location | Data | Design | Year | All (Association) | Men (Association) | Women (Association) | Age exposure (height) and outcome (wages) measured | N | Notes |
|---|---|---|---|---|---|---|---|---|---|---|
| Bockerman et al. 2010 | Finland | Health 2000 in Finland | OLS | 2000–01 | 0.67% | 0.40% | Mean = 44 | 2506 | Hourly earnings, which the authors calculate as annual wage divided first by 52, and then by the individual’s self-reported number of weekly working hours. | |
| Case and Paxson 2008; Case and Paxson 2010 | England | NCDS | OLS | 1991 | 0.65% | 0.43% | 33 | 5833 | Average hourly earnings; height was measured in inches, coefficient is scaled by 0.4 | |
| Case and Paxson 2008; Case and Paxson 2010 | England | NCDS | OLS | 2000 | 0.63% | 0.50% | 42 | 5833 | Average hourly earnings; height was measured in inches, coefficient is scaled by 0.4 | |
| Case and Paxson 2010 | England | British Cohort Study: BCS | OLS | 2000 | 0.30% | 0.28% | 30 | 5424 | Average hourly earnings; height was measured in inches, coefficient is scaled by 0.4 | |
| Case and Paxson 2010 | USA | Panel Study of Income Dynamics: PSID | OLS | 1988–97 | 0.38% | 0.18% | 25–55 | 31996 | Average hourly earnings; height was measured in inches, coefficient is scaled by 0.4 | |
| Case and Paxson 2010 | USA | Health and Retirement Study: HRS | OLS | 1992–2004 | 0.70% | 0.68% | 55–74 | 27606 | Average hourly earnings; height was measured in inches, coefficient is scaled by 0.4 | |
| Case et al. 2009 | England | British Household Panel Survey: BHPS | OLS | 1997–2005 | 0.40% | 0.20% | 21–60 | 42666 | Average hourly earnings; height was measured in inches, coefficient is scaled by 0.4 | |
| Haddad and Bouis 1991 | Philippines | OLS | 1984–85 | 0.7% – 0.8% | Varied | 390 | Real daily wage, rural agricultural work; Hausman-Taylor IV applied to variables other than height | |||
| Heineck 2008 | England | BHPS | OLS | 2004 | 0.60% | 1.40% | 21–50 | 4650 | Results without education | |
| Hübler 2009 | Germany | GSOEP | OLS | 1985–2004 | 0.25% | NS | 22–55 | 36754 | Association was found to be non-linear | |
| Kortt and Leight 2010 | Australia | Household, Income and Labour Dynamics in Australia: HILDA | OLS | 2006–07 | 0.22% | 0.28% | NS | 25–54 | 6822 | Hourly wages |
| Lindqvist 2012 | Sweden | Longitudinal INdividual DAta for Sweden: LINDA | OLS | 2006 | 0.33% | Varied | 13414 | Annual wages; men born between 1965 and 1974 | ||
| Lundborg et al. 2014 | Sweden | Swedish males enlisting for the military between 1984 and 1997 | Sibling FE | 2003 | 0.42% | 28–32 | 450000 | Annual earnings; height measured at 18 years; height associations are non-linear | ||
| Persico et al. 2004 | USA | NLSY79 | OLS | 1996 | 0.70% | 35 | 1577 | Annual income; height was measured in inches, coefficient is scaled by 0.4 | ||
| Persico et al. 2004 | England | NCDS | OLS | 1991 | 0.88% | 33 | 1772 | Income period varies; height was measured in inches, coefficient is scaled by 0.4 | ||
| Rietveld et al. 2015 | Germany | GSOEP | OLS | 2002–12 | 0.40% | 0.50% | 0.30% | Varied | 92248 | Hourly earnings |
| Sargent and Blanchflower 1994 | England | NCDS | OLS | 1981 | 0.20% | 0.10% | 23 | 12537 | Height at age 16; hourly earnings | |
| Smith et al. 2012 | China | China Longitudinal Study of Aging: CHARLS | OLS | 2012 | 2.60% | NS | 45+ | 1179 | ||
| Sohn 2014 | Indonesia | IFLS | OLS | 2015 | 7.50% | 13% | 20–65 | 9306 | Annual earnings | |
| Tao 2014 | Taiwan | Taiwan Integrated Postsecondary Education Database: TIPED | OLS, Heckman | 2006 | 0.14% | Varied | 2510 | Women only; adjusted for selection into the full time labour market | ||
| Vogl 2014 | Mexico | Mexican Family Life Survey: MxFLS | OLS | 2002, 2005 | 2.30% | 25–65 | 3860 | Men only; hourly earnings |
NS, not statistically significant.
Each of these approaches to measuring exposure to early life undernutrition has its own advantages and disadvantages, and we return to a discussion of the measurement issue as part of the Appendix. It is important to note, however, that the underlying assumption behind the approach of studying the link between adult height and adult outcomes is that height or length in childhood is sufficiently predictive of adult height for the latter to provide an adequate proxy for childhood undernutrition. This hypothesis has been assessed in prospective cohort studies that follow children from birth into adulthood. In the British 1958 National Child Development Study (NCDS) and the 1970 British Cohort Study (BCS), healthier, better-nourished children were substantially more likely to go on to reach their height potential.13 Moreover, a recent review of data from five birth cohorts in low- and middle-income countries found that the correlation coefficient relating length at 12 months with adult height ranged from 0.43 to 0.49.14 The literature thus supports the hypothesis that, within a given population, growth failure in childhood is predictive of reduced attained stature in adulthood.
The rest of this paper is structured as follows. First, we begin by reviewing existing summary papers. Second, we present an overview of estimates of the association between stunting and subsequent outcomes from long-run follow-ups of intervention studies, prospective studies that measure stunting or height contemporaneously in childhood but track cohort members into adulthood, and evidence from natural experiments, which retrospectively tie individuals to events associated with periods of undernutrition in early life. Third, we provide a comprehensive assessment of the literature from cross-sectional data that documents the relationship between height in adulthood and wages, comparing estimates from observational and quasi-experimental approaches that are designed to correct for measurement error and potential unobserved confounding. Fourth, we discuss how cost-benefit analyses of nutrition interventions have been conducted, and provide an overview of these findings. Finally, we consider whether there is evidence linking the prevalence of stunting to aggregate effects on economic growth, and whether economic growth in turn affects child undernutrition. We conclude in the discussion section with a summary of the strength of the evidence linking childhood stunting and undernutrition to adult economic outcomes, as well as a review of the implications of these findings for countries with high rates of stunting, particularly those in South Asia.
Findings
Review papers
Table 1 presents the key background papers that cover topics outlining the rationale for investing in nutrition in early childhood,15–25 and details of the long-term follow-up of a cohort who received a nutrition intervention in Guatemala, which has featured heavily in the literature.26 These papers also provide a summary of the potential pathways linking stunting and undernutrition to economic outcomes, the interaction of nutrition programmes with other childhood interventions,27 the relationship between nutrition, productivity and economic growth,18,28,29 economic returns to other interventions targeted at child and maternal health in low- and middle-income countries,30 global losses associated with malnutrition,31 the use of height as a marker for human welfare,32–36 child growth and development,37 trends in the global prevalence of stunting3,38 and the effectiveness of interventions to reduce child and maternal undernutrition.30,39–42
Table 1.
Key summary papers on the economic consequences of childhood stunting and undernutrition
| Author | Year | Focus |
|---|---|---|
| Alderman | 2010; 2013 | Summary of pathways linking stunting to economic outcomes and associated costs of malnutrition |
| Alderman et al. | 2014; 2015 | Integration of nutritional interventions with other childhood programmes, programme design and estimation of economic returns |
| Behrman et al. | 1993 | Evidence on nutrition and productivity |
| Behrman | 2009 | Summarizes follow-up study in Guatemala and benefit-cost analyses for early life nutritional interventions |
| Behrman et al. | 2017 | Potential health and economic benefits of improving early childhood nutrition, long-term benefits, and cost-benefit analysis |
| Bhutta et al. | 2008; 2013 | Interventions to address undernutrition and micronutrient deficiencies in women and children |
| Dewey and Begum | 2011 | Overview of the long-run impact of stunting |
| Fogl | 1994 | The role of physiology in economic growth |
| Halim et al. | 2015 | Economic impacts of 23 reproductive, maternal, newborn and child health (RMNCH) interventions, published in 29 empirical studies |
| Hoddinott et al. | 2013 | Functional consequences of stunting, summarizes literature around each of the links in the life cycle, and estimates benefit-cost ratios for a plausible set of nutritional interventions to reduce stunting |
| Horton and Steckel | 2011 | Estimates of the economic losses from malnutrition worldwide |
| Hübler | 2016 | Summarizes relationship between height and wages from an economic perspective, with summary of recent evidence |
| Martorell | 2005 | Overview of design and findings from the Guatemala Institute of Nutrition of Central America and Panama (INCAP) Study |
| Norgan | 2000 | Physiological perspective on the long-term economic consequences of growth retardation in children and adolescents |
| Schultz | 2003 | Summarizes key methodological challenges associated with estimating returns to height and human capital from an economic perspective |
| Steckel | 1995; 2009; 2013 | Overview of literature which uses height as a measure of human welfare |
| Strauss and Thomas | 1998 | Discusses our understanding of the interrelationships between health, nutrition and economic development |
| Sudfeld et al. | 2015 | Association of child growth with child development |
| Stevens et al. | 2012 | Summary of global prevalence and trends in child stunting |
| UNICEF | 2013 | Reviews background studies, current prevalence of malnutrition across various indicators, case studies in improving nutrition, and global initiatives |
| Victora et al. | 2008 | Associations between maternal and child undernutrition with human capital and adult health in low-income and middle-income countries |
| World Bank | 2006; 2007; 2010 | Reviews the effectiveness of nutrition interventions and rationale for investment in early child development |
Evidence from intervention studies, prospective cohorts and natural experiments
We were able to locate two long-term follow-ups of intervention studies conducted in Guatemala and Jamaica. The former, the Institute of Nutrition of Central America and Panama (INCAP) study,43,44 allocated nutritional supplements to pregnant women and infants in two Guatemalan villages in the late 1960s and 1970s. Two nearby control villages did not receive the supplements. A number of studies that follow the children included in the INCAP intervention into adulthood find effects of receiving the nutritional supplements on economic outcomes, including productive capacity, wages, expenditure and the probability of living in poverty.45–48 Studies that use intention to treat analysis (ITT) find that men who received the supplements as children had, on average, a 46% increase in wages.43 The association was not found to be statistically significant for women. An instrumental variables analysis using variation in height-for-age Z score at age 2 years predicted by receipt of the nutritional supplement, found that a 1 standard deviation increase in height-for-age was associated with a 21% increase in household per capita expenditure and a 10% point decrease in the probability of reporting living in poverty at ages 25–42.49 A second intervention study was conducted in Jamaica in the mid 1980s.50 A group of undernourished children were randomly allocated to groups that included a nutrition supplementation intervention, psychosocial stimulation, combined nutrition and stimulation, and a control group. These children were subsequently followed up with in 2007–08 at age 22. Those who received the stimulation and combined intervention were found to have increased earnings by 25% relative to the control group. The association between the nutritional supplement alone and wages was not statistically significant. These two studies, papers from which are shown in Table 2, are the only two long-term follow-ups to nutrition interventions that we are aware of.
We located five natural experiment papers which examined the long-run economic outcomes of cohorts exposed to conditions in infancy that were likely to have resulted in undernutrition for those affected. The benefit of this natural experiment approach is that the events of interest can often reasonably be considered as unexpected shocks which affect nutritional status in a way that is unrelated to unobserved characteristics of these individuals, thereby reducing concerns about unobserved confounding. Three of these events are the famine in China in 1959–61,51 the war-related famine in Greece (1941–42) and the war-related food crisis in Germany (1944–48).52,53 Although the Dutch ‘Hunger Winter’ of 1944–45 also features in this literature, we are not aware of any study that examines the economic outcomes of survivors.54 An additional paper considers exposure to rainfall in Indonesia in early life, which is positively associated with higher crop yields, stature, and thus likely better nutritional status, and found that exposure was significantly associated with higher scores on asset indices (a proxy for household wealth) for women, but was not statistically significant for men.55 Survivors of the Chinese famine in 1959–61 were found to have lower labour supply and reductions in some measures of income compared with surrounding cohorts who were not in infancy during the famine. Those in infancy during the Greek famine of 1941–42 were found to have lower occupational status when followed up on using national census data. In contrast, there was no evidence of adverse economic effects of exposure to the German food crisis in childhood, although this study found that those exposed in utero were adversely affected. Kesternich et al. (2014) find that having lived in a European country affected by conflict during World War II was associated with lower wealth in later life for those among the bottom two socioeconomic status (SES) tertiles in childhood, with poor nutrition being one potential channel for this result.56 A final study examined the relationship between height and adult outcomes using an approach based on sibling comparisons in Sweden, which has the benefit of allowing all observed and unobserved factors constant within families to be controlled for.57 This study found large returns to height in the form of increases in wages and occupational status.58 Results from these studies are shown in Table 3.
Alderman et al. (2006) use an instrumental variables approach and report that drought exposure in childhood in Zimbabwe led to height-for-age Z score 1.25 standard deviations (SD) lower, which was estimated to be associated with a 14% reduction in lifetime earnings; however, this figure is calculated from calibrated effects of schooling on earnings, rather than a direct association observed in the data, and is therefore not included in Table 3.59 Alderman et al. (2006) conduct a similar analysis for Tanzania.60
Evidence from prospective studies
Next we present evidence from prospective studies, which have the benefit of measuring stunting or undernutrition in early life rather than relying on adult height, but do not generally deal with measurement error or unobserved confounding. Most of these studies use measures of childhood height collected as part of established cohort studies in the UK, Brazil and the Philippines.61–64 One study that does included a matched control group has followed a cohort of children who were hospitalized for protein-energy malnutrition during the first year of life (matched to a cohort who did not experience the same) in Barbados in 1967–72.65 Those who experienced the undernutrition episode were found to be lower on social position and standard of living indices in adulthood. An early study in India found that height for age at age 5 years was associated with lower work capacity in the teenage years (14–17).66,67 In the Philippines, length-for-age Z score at age 2 years was found to be associated with an increase in the probability of being engaged in formal work at age 20–22 for both men and women.68 Research from US and UK cohort studies have found that height at various stages in childhood and the teenage years is positively related to work status, wages and measures of socioeconomic status in later life.69–73 In a cohort of men born in Helsinki, Finland, between 1934 and 1944, length in the first year of life was associated with subsequent earnings.74 A review of three cohort studies in low- and middle-income countries found that height-for-age Z score at age 2 was associated with an 8% increase in income in Brazil and Guatemala (although the latter was only significant at the 10% level), and a 21% increase in household assets in India.23 These data are shown in Table 4. Further notes to the studies outlined in Tables 2, 3 and 4 are presented in Table A1 in the Appendix (available as Supplementary data at IJE online).
Evidence from cross-sectional studies of adult height and adult income
A difficulty with interpreting the results in the previous section is that it is problematic to compare the magnitude of coefficients across studies because of differences in exposure and outcome measures. In addition, there are relatively few prospective studies that include measures of childhood stunting or undernutrition alongside adult economic outcomes. An alternative approach to assessing the long-run economic impacts of stunting, which has less data requirements, is to examine the relationship between adult height and adult outcomes. The benefits of this approach are that data on adult height are much more widely available, and it can be implemented with cross-sectional data. It is also much easier to compare results from this literature, as there are relatively more studies that examine adult wages or income as the outcome, and a continuous measure of stature as the exposure. As we discuss above, the wage premium for taller individuals is often used to quantify the economic impact of childhood growth restriction because of the association between childhood undernutrition and adult height.14
Nevertheless, because adult height is an imperfect proxy for our exposure of interest, we therefore separately consider the set of studies that adopt a quasi-experimental instrumental variables (IV) approach to correct for potential measurement error. Instrumental variables used in this approach typically include characteristics of respondents’ place and time of birth,75 as well as procedures designed to correct for measurement error based on observed characteristics only,76 and finally, twin differences in height and body mass kndex (BMI).77 We provide a methodological discussion of the different approaches in the Appendix (available as Supplementary data at IJE online). These IV results are presented in Table 5, where we report estimates of the expected change in wages (measured in percent) associated with a 1-cm change in adult height (known in the economics literature as the semi-elasticity).
For men, coefficient estimates range from −1% to +10%, with no statistically significant association found in Finland, East Germany and Ivory Coast.75–85 For women, coefficient estimates range from −4% in Tanzania and Ivory Coast to +12% in Finland, with non-significant estimates observed in Germany and Ivory Coast. The Tanzanian and Ivory Coast estimates for women are notable outliers as they are negative. One study gave results for a combined sample (a 2% return in Ethiopia). Mean rates of return associated with an additional centimetre of height are 5% for men in 12 studies and 6% for women in 11 studies. Assuming non-significant estimates are equal to zero lowers the mean return to 3% for men but does not affect the estimate for women. Median rates of return to a centimetre of height are 4% for men and 6% for women.
Corresponding linear regression estimates from studies that only implement ordinary least squares (OLS) models are presented in Table 6.13,58,70,72,73,79,82,86–97 Using this approach, coefficient estimates are almost all less than a percentage point. Exceptions are men in one study in China (3%), men and women in Indonesia (8% and 13%, respectively) and men in Mexico (2%). Here the mean and median return for men (based on 20 OLS studies) is 1%, and also 1% for women (based on 14 studies). For women, estimates in China, Germany and Australia are found to be not statistically significant.
For studies that report both IV and linear regression estimates, Figure 1 demonstrates the difference between the coefficient estimates for these two approaches for men and women. Overall, estimates of the median return to height are substantially higher for IV models, particularly for women (a 5 percentage point point difference). Further discussion of these papers is given in the Appendix. A summary of findings from papers which examine economic outcomes other than wages is also presented in the appendix (available as Supplementary data at IJE online).
Figure 1.
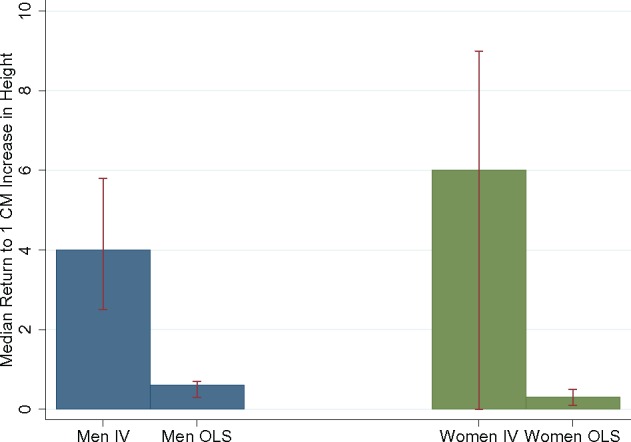
Comparison of median estimates of the wage return to a 1-cm increase in height from instrumental variables (IV) and linear regression (OLS). Error bars show the interquartile range.
Cost-benefit analysis of childhood nutrition interventions
A number of papers conduct cost-benefit analyses of an intervention or package of interventions targeted at reducing childhood stunting or undernutrition, which requires costing the economic impact. The approach typically adopted in these studies can be summarized as follows. First, the treatment effect of the programme in terms of the expected reduction in the exposure (for example, the probability of being stunted) is calculated. Then, the treatment effect is multiplied by the number of affected children to obtain an estimate of the reduction in stunting prevalence induced by the treatment. The economic benefits of this reduction are then usually calculated by calibrating the returns to height using the existing literature. For example, if the intervention increased average height by 1 cm among 100 children, and the estimated return to height is calculated at 3%, the programme is valued at 1*100*3%*average wages, potentially with some correction for discounting and estimates of labour supply across the life course. Additional benefits can be included, for example the return to improvements in test scores,5 or reductions in direct costs such as lower treatment costs for illness associated with improvements in health status. Some studies also include the value of lives saved as a result of these interventions.
Using this approach, a micronutrient supplementation and early childhood stimulation programme in Nicaragua was found to have a cost-benefit ratio of 1.5. Benefits for programme participants were calibrated using estimates from the literature on the returns to test scores which were estimated to be affected by the programme.98 In an analysis of a stunting intervention in Indonesia, the programme was found to have a cost-benefit ratio of 2.08 on the basis of productivity enhancements from reduced undernutrition, earnings from deaths averted, and household savings from diarrhoea costs avoided.6 In a review of cost-benefit ratios of nutrition interventions, estimates ranged from 3.5:1 to 42.7:1 per child, with a median of 17.9:1.22,99
A similar methodology has been used to estimate the aggregate burden of stunting worldwide. Instead of considering a particular intervention, these studies calculate the cost savings associated with reducing stunting prevalence to zero in a country. Then, wage returns for each stunted child, under the hypothetical scenario that every currently stunted child was no longer stunted, are aggregated. An early example of a study which attempts to quantify the national costs associated with stunting is that of Ross et al. (2003), who examine the impact of undernutrition on economic productivity in China.100 Using estimates of the impact of stunting on productivity from the literature, they conclude that productivity gains due to reductions in child stunting over the period 1991 to 2001 were worth US$12 billion (Yuan 101 billion) in 2001. Conducting a similar analysis, Alcázar et al. (2012) found that productivity-related costs of stunting in Peru were also large [2.2% of gross domestic product (GDP)].101 Bagriansky et al. (2014) estimated the impact of undernutrition at more than US$400 million annually in Cambodia, or approximately 2.5% of yearly GDP, of which 57% is a result of children being affected.102
A similar approach involves aggregating the costs accruing to the population in a country as a whole. For example, add up the direct costs for affected individuals in a country, potentially using different methodologies as a sensitivity analysis, then divide by the total population in that country to obtain an estimate of per capita costs, which could be expressed as a percentage of GDP. Horton and Ross (2003) estimate the productivity costs of anaemia at 0.57% of GDP in 10 countries,103 and Horton and Steckel (2011) calculate the global economic losses associated with malnutrition by aggregating losses for individual countries.31 Assuming that the impact of height on productivity is captured by the association of height with wages (earnings), and that this translates into economic growth via the share of wages in national income (approximately 50%), they consider the differential return to height at different levels of mean height based on linear regression and estimates from the literature. At the country level, they obtain estimates of the wage return to 1 cm increase in height of 4.5% at 170 cm, 4% at 171 cm, 3.5% at 172 cm and 0.5% at 178 cm. Aggregating wage impacts, these assumed productivity losses are combined with data on average height to give estimated costs as a percentage of national income in each country. Results imply that the annual GDP loss due to undernutrition is up to 12% in low- and middle-income countries. Globally, these losses are estimated to have fallen from 12% of world GDP in 1900 to 6% in 2000. The corresponding projections for 2050 imply that losses will be of the order of 6%. Based on a model originally developed for Latin America,104 the Cost of Hunger in Africa (COHA) study [http://www.costofhungerafrica.com] aims to provide economic estimates of the costs of hunger in 13 countries. A recent report on Malawi from this study group indicates that the costs associated with stunting were of the order of 10% of GDP per year.105
Overall, there is therefore a multitude of evidence that nutrition interventions are highly cost effective, and that the economic burden of undernutrition on society as a whole is likely to be large; however, these studies crucially rely on estimates of the economic return to factors such as adult height or reductions in child stunting. In practice, there does not seem to be a consensus in the literature as to what return to height should be used. In addition, studies that aggregate from individual losses may be underestimates of the total economic impact because they do not account for spillover effects on economic growth.106
The impact of stunting on economic growth
Results in the previous section reflect the potential impact of individual undernutrition on individual economic outcomes. The pathways linking stunting to individual income have been discussed previously.15–17,22,35 However, individual-level estimates do not take account of effects on aggregate capital formation, labour markets, savings behaviour, investment behaviour and other factors which make up the determinants of aggregate output. Estimating the full costs of undernutrition to society requires accounting for all of these potential effects. However, whereas height and wages tend to be correlated at the aggregate level,107 in the literature there has been surprisingly little attention paid to spillover effects of stunting on economic growth. The potential for these effects can be informed by considering the standard approach in macroeconomic growth models where national income is defined as a function of labour, capital and the efficiency with which labour and capital inputs are combined (or technological progress).108 From this perspective, the pathways through which undernutrition could affect aggregate economic growth include increases in morbidity, mortality and health expenditure and subsequent reductions in human capital investment (for example, education), physical capital investment and labour supply. Reductions in productivity because of ill health or work capacity for any given labour supply, and reductions in human capital and technological progress (due to lower levels of educational attainment and infrastructure) are likely to negatively impact not only on individuals themselves, but also on economic growth when a substantial proportion of a country's population are affected by stunting. Other relevant pathways include the impact of undernutrition on chronic disease, which would involve the diversion of productive savings (which boost investment) towards treatment costs.106 These pathways are summarized in Figure 2.
Figure 2.
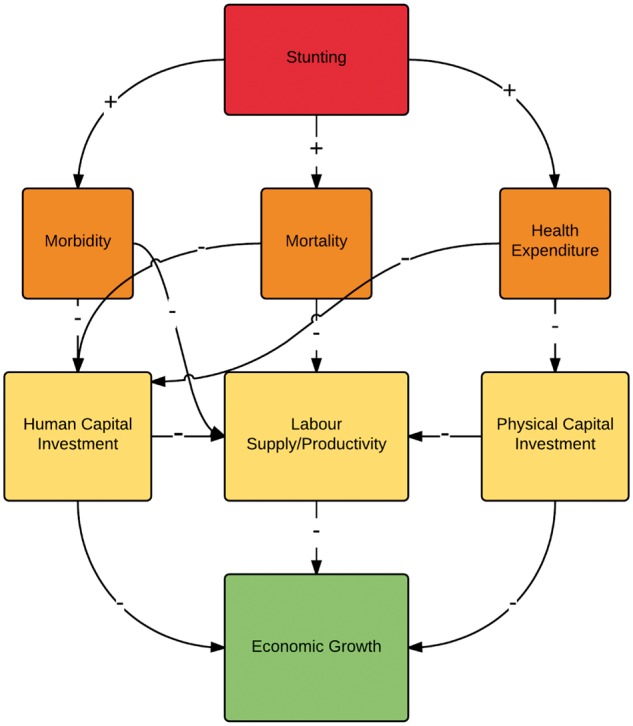
Summary of the pathways linking stunting to economic growth. Adapted from Bloom et al. (2014).106.
There is a literature in economics which examines whether there is an effect of health on economic growth. However, there are relatively few studies that consider undernutrition specifically (either childhood undernutrition or adult undernutrition) as an input in these production function models of the aggregate economy. Some recent exceptions are Chakraborty et al. (2010), Dalgaard and Strulik (2015) and Piper (2014).109–111 Estimating this relationship in practice with currently available data is problematic because it is difficult to assess whether the causal pathway runs from nutrition to economic growth, or from economic growth to nutrition. Most likely the relationship is bidirectional, but this makes it difficult to interpret parameter estimates from models that do not account for this reverse causality, because estimates of the impact on growth likely also incorporate some of the effect in the opposite direction, and vice versa. Recent summaries of the general literature on health at the macro and micro levels are provided elsewhere.112–114 There is a small number of studies that examine the relationship between adult stature specifically and economic growth. Weil (2007) incorporates height alongside other health measures into an augmented production function, and finds that health differences worldwide account for a relatively small proportion of differences in GDP (around 10% of the variance in log GDP per worker).115 Adopting an empirical approach with a co-integrating model to account for reverse causality, Arora examines whether changes in health, including adult stature, contributed to growth among a group of 10 industrialized countries over the course of the past century, and finds that health contributed between 30% and 40% to the economic growth rates over this period.116 Also in a co-integration analysis, María-Dolores and Martínez-Carrión find a bidirectional relationship between height and economic growth among Spanish regions in the period 1850–1958.117 The evidence demonstrates a strong association between economic growth and health, but because of the difficulties associated with testing theoretical models of how economic growth is produced, it is currently difficult to quantify the magnitude of these effects. However, one recent example of a paper uses an instrumental variables approach in an effort to overcome the problems associated with reverse causality, and finds that each centimeter increase in average population height is expected to raise income per capita by 6%.118 This estimate would imply that the magnitude of the return to increases in height at the national level is substantial.
The impact of economic growth on stunting
Some papers in the literature have found that economic growth is associated with a reduction in the prevalence of child stunting, but the magnitude of the relationship has generally been found to be small. Interpretation of estimates can be complicated by the fact that some studies report the impact of GDP per capita on stunting prevalence in absolute terms (the association in percentage points), whereas others report the impact on stunting prevalence in relative terms (the association in percent). Once estimates are rescaled, the magnitudes of the reported coefficients appear similar.119 Across six studies, the impact of a 10% increase in GDP per capita was found to be in the range of a 0-2% reduction in stunting.119–125 For example, Harttgan et al. (2013) find that although levels of GDP per capita have increased substantially in many low- and middle-income countries over recent decades, levels of stunting and undernutrition showed very little improvement.124 In this study, a 10% increase in GDP per capita was associated with a 1.5–1.7% reduction in stunting, which is similar to estimates of approximately 2% obtained in Heltberg (2009).122 Ruel et al. (2013) reported that a 10% increase in GDP per capita was associated with a reduction in stunting prevalence of around 6 percentage points.123 However, their study focused on the long-run impacts, as opposed to the other papers which considered more short-term associations with GDP.
There are a number of additional studies, most of which report similar results to the above. Smith and Haddad (2015) estimate that a 10% increase in GDP per capita is associated with a 1.7% reduction in stunting.1 Their estimates of the long-run impact of GDP per capita are larger, at around 6%, and comparable to their earlier estimates in Smith and Haddad (2002) and Haddad et al. (2003),126,127 where increases in national income over the 25-year period from 1970 to 1995 were found to have led to roughly half of the total reduction in the developing-country prevalence of child undernutrition over the period. In contrast, a recent analysis which adopted a multilevel approach in Indian states, found that economic growth was not associated with reductions in stunting or other measures of undernutrition.128 As far as we are aware, only one paper has examined whether the timing of economic growth is important for height, and found that economic growth in puberty and in the first year of life were most associated with the adult height of women in sub-Saharan Africa.129
Although the magnitude of the relationship between GDP per capita and stunting continues to be debated,130,131 there appears to be some agreement that economic growth alone is unlikely to be able to achieve substantial reductions in the prevalence of stunting, and that any effects are too small to rely on national income alone for achieving large reductions in child undernutrition, at least in the short run.1 The fact that some countries, such as Sri Lanka, or regions within countries, such as Kerala in India, have lower prevalence of stunting than their incomes would suggest places emphasis on other factors such as the local policy environment and the role of public health nutrition programmes. A recent paper suggests that differences in stunting prevalence across Indian states is less due to differences in inputs and more likely due to differences in the predictive power of these inputs for undernutrition.132 Moreover, a series of countries have been able to achieve rapid improvements in child nutritional status.121 Recent reports from the United Nations Children’s Fund (UNICEF) and the International Food Policy Research Institute contain a series of case studies on successful reductions in stunting prevalence in the best performing countries.38,133,134
Therefore, it seems that other more direct interventions will be required to achieve global targets for reductions in stunting and undernutrition among children. The literature has begun to emphasize that the quality of economic growth is likely to be important for how income gains translate into reductions in child undernutrition.135 The impact of intermediary factors on stunting, such as sanitation, governance, the roll-out of nutrition programmes, growth in food production and infrastructure, access to health services and infrastructure, governance, education and fertility have all been investigated previously.1,121,125,136,137 Focusing on promoting economic growth that raises the income of the least well off, and improves the quality and equity of these intermediary inputs, is thus likely to be the most effective way of ensuring that economic growth leads to reductions in the prevalence of child stunting.138
Discussion
Summary of the evidence linking childhood stunting and undernutrition to economic outcomes
The evidence reviewed in this paper supports the hypothesis that children affected by stunting or undernutrition are negatively affected in terms of a variety of economic outcomes, including productivity, occupational status and wages. The magnitude of the relationship between stunting and wages is larger in intervention studies (two nutrition programmes were associated with a 25% and a 46% increase in adult wages for affected children, respectively) than quasi-experimental studies (where we find that each centimetre increase in adult height is associated with an increase in wages of 4% for men and 6% for women), which is in turn larger than that found in observational data (where the corresponding wage estimate is 1% for men and women).
A theme in this review is that there is a great deal of heterogeneity in terms of coefficient estimates, across both countries and genders, although estimates in low- and middle-income countries do appear larger on average than those from high-income countries such as the UK and the USA. This heterogeneity is likely to partly reflect the fact that outcome measures are different (for example, hourly wages versus income), different methodologies are employed and different control variables are used across the studies. Age and period effects are also likely to be important but are not always accounted for. A methodological drawback of almost all the studies we reviewed is that very few adjust for the decision on whether to participate in the labour market, and only consider the earnings of those who are employed. It could be that those who are not currently employed would have lower earnings if they entered the labour market, and those outside the labour market may also be the most likely to be of lower height. An exception is a study of female graduates in Taiwan.84 From that perspective, the results presented here may be underestimates. The studies we report on also use a variety of different exposures to measure the impact of child undernutrition, and it is important to bear in mind that the results are therefore not always directly comparable. Intervention and prospective analyses tend to rely on measuring childhood undernutrition using height-for-age, which is understandable given that this approach provides objectively measured information which is feasible to collect in a variety of contexts, including household surveys. Whereas stunting can be used to identify growth and nutritional deficiencies, along with cumulative undernutrition, these measures also have their disadvantages (for example, they may capture other aspects of early life conditions including disease environment and genetic growth potential, and have a lesser capacity to capture marginally inadequate diets or short-run episodes).12 Cross-sectional analyses rely on proxying childhood nutritional status with adult height, which also has its limitations. It is difficult to assess the extent to which these issues affect our conclusions, without further data from prospective studies which credibly address measurement error, unobserved confounding, and selection into the labour market. An assessment of publication bias in the literature would also be beneficial. It is important to bear in mind that we do not have the same kind of evidence that would be provided by multiple RCTs conducted in a variety of different contexts, and therefore we have tried to summarize the weight of the available evidence across a range of studies from different methodologies and of varying quality. One question is how to reconcile that results from the two experimental studies are substantially higher than median quasi-experimental estimates. It is likely that there are at least two pathways linking stunting to adult outcomes, including a pure stature effect, and the effect of lost growth potential encompassing cognitive impacts of undernutrition. Unlike most quasi-experimental studies, long-run follow up of nutrition interventions can isolate the latter, which we would expect to be larger. It remains to be seen whether the magnitude found in the two existing studies is observed in subsequent trials, but nevertheless, even if we focus solely on the lower quasi-experimental median estimates, the evidence from different sources is still generally consistent with the hypothesis of substantial economic returns to nutrition in early childhood.
Stature in adulthood is also linked to other economic outcomes, including occupational status, and other measures of socioeconomic position. Studies which examine potential mechanisms indicate that there is a direct association of stature with productivity and fatigue.139,140 An alternative set of studies which examine more short-run relationships find that child undernutrition affects cognition and schooling. Controlling for these variables in height regressions generally attenuates coefficient estimates, supporting this interpretation, at least in low- and middle-income countries. Health effects of stunting across the life cycle are also likely to be substantial, as are effects of in utero environment on health and economic outcomes. Separating out optimal timing of investments in infants and children remains an important direction for future research.141 Intergenerational transmission of disadvantage is another pathway which we did not cover in this review except insofar as it relates to economic outcomes, but this is also likely to be an important consequence of child undernutrition.19,142
Cost-benefit analyses that evaluate programmes implementing nutrition interventions tend to find that they are cost-beneficial, some very cost-beneficial, and studies which aggregate costs across all affected individuals in a country or set of countries find that the total costs of child stunting and undernutrition are high. Our median quasi-experimental estimate of the return to 1 cm of height of 4% for men is similar to that used in previous cost-benefit analysis of 7%,6 research on economic growth of 3.5%115 and global estimates of the economic burden of stunting of 0.5% to 4.5% (depending on the country).31 When a high proportion of a cohort within a country are affected, these studies may miss spillover effects on labour markets and technological progress and their consequent impact on economic growth. This is an important direction for future research, and taking account of externalities in the interaction between undernourished individuals, cohorts and labour markets on economic growth, potentially using a production function approach such as that taken in more general studies of health and GDP,106 would be of great interest. In contrast to the impact of stunting or undernutrition on economic growth, there are relatively more studies that examine the impact of economic growth on stunting. In this literature, even the studies that do find an association between economic growth and stunting agree that the magnitudes involved are not large, at least in the short run. A focus on the quality of economic growth, intermediary inputs including sanitation, education, quality of diets and access to basic health services,143 and a combination of poverty reduction and direct nutrition interventions, are likely to be most effective at achieving large reductions in stunting.127
Implications for countries with high stunting prevalence in the context of Sustainable Development Goals post 2015
There has been some progress in reducing child stunting and undernutrition over recent decades, with stunting prevalence falling from 50% in 1970 to 30% in 2010 among low- and middle-income countries. However, stunting remains high in some regions, and is currently at 38% in South Asia and 37% in sub-Saharan Africa. The current momentum and international agreement on the importance of reducing undernutrition among children are apparent in the inclusion of food security and nutrition as one of the Sustainable Development Goals, the emergence of initiatives such as the Scaling Up Nutrition (SUN) movement [http://scalingupnutrition.org/] and the targets for reductions in stunting set by the World Health Assembly and United Nations and endorsed by the Sustainable Development Goals (SDGs).38 However, further evidence is needed to inform how best to prioritize effective and cost-effective interventions to reduce stunting in the most adversely affected areas. Reviews of effective treatments for the direct causes of growth restriction have identified promising interventions, including: periconceptual folic acid supplementation; maternal energy, protein, calcium and micronutrient supplementation; promotion of breastfeeding and appropriate complementary feeding of children; vitamin A and zinc supplementation for children; and management of acute malnutrition.41 However, to unleash the potential of nutrition programmes, progress is needed in addressing persistent socioeconomic inequities.2 Intervention studies suggest that a combination of nutrition and stimulation packages in early childhood may have the greatest impact.27,50,144
Although economic growth in South Asia has been rapid, with more than a doubling of GDP over the past four decades, levels of per capita GDP remain low. India experienced 8% growth in GDP from 2000 to 2010, and during the period 1981–2005 India’s poverty rate fell from 60% to 42%.4 Despite this being similar to China’s reductions in poverty, stunting fell much more rapidly in China than in India over the period. One potential explanation for this is the low coverage of nutrition interventions. For example, only 25% of vulnerable children benefited from feeding interventions and only 30–40% received vitamin A supplements.4 Uneven economic growth which does not achieve gains spread equally across the distribution of households is another potential explanation for the lack of improvements observed in India following rising aggregate income per capita.138,145
In a recent assessment of the underlying determinants of stunting in South Asia, Smith and Haddad (2015) point to factors other than economic growth which are likely to be relevant for improving levels of child undernutrition. Access to sanitation, dietary diversity of food supplies and gender equality have potentially high rates of return because they are farthest below their desired levels. In particular, only 38% in South Asia have adequate sanitation access and only 40% of the food supply is made up of non-staples, resulting in poor diet quality as highlighted by the fact that fewer than 25% of young children are fed diets that meet the minimum adequacy for child growth and development.1,135 Another area of emphasis is governance and accountability, particularly given that children are especially vulnerable to poor public services, but are not easily heard because of their lack of political voice and the relative lack of attention paid to undernutrition.4
Interventions targeting these factors are largely in the hands of states and provinces in countries such as India and Pakistan, respectively. Coupled with the results provided in this paper and the literature, there is therefore the opportunity to view investments in child nutrition as a strategy for economic growth and human capital formation at the state and local levels. States in India and provinces in Pakistan have gained increasing autonomy for administering major family and child programmes over the past three decades, with decentralization/devolution of nutrition and other social welfare budgets.146
Conclusions
In a review of evidence assessing the economic impacts of childhood stunting and undernutrition, we find that results from intervention studies and quasi-experimental research consistently indicate substantial economic returns to linear growth and reductions in stunting at the individual level. The median return in instrumental variables analyses to a 1-cm increase in height was found to be 4% for men and 6% for women. Two long-term follow-ups of intervention studies show even more substantial returns to nutrition-related programmes (16% per centimetre in a study in Guatemala). On the basis of these estimates, nutrition investments are likely to be cost beneficial, especially if they focus on the 1000 days from conception to age 2 years and on adolescence, and they prioritize evidence-based interventions identified in the literature and promoted internationally.
At the national level, progress has been uneven at reducing stunting, and South Asia and sub-Saharan Africa in particular have lagged behind other regions. In India, the slow improvement in reducing child undernutrition stands out because of rapid economic growth. Focusing on combinations of nutrition programmes and proximal determinants, such as gender equality and sanitation, may provide a more reliable method of reducing child undernutrition than low quality growth that is not broad-based and beneficial for poorer or more vulnerable children and households. Because of likely spillover effects of reductions in stunting prevalence on labour markets and productivity, investments targeted at reducing child stunting and undernutrition are likely to have substantial returns to society in terms of increases in economic growth and human capital formation.
Supplementary Data
Supplementary data are available at IJE online.
Funding
Financial support for this analysis was provided by UNICEF Regional Office for South Asia.
Conflict of interest: None to declare. The opinions expressed in this paper are those of the authors and do not necessarily reflect an official position of the institutions that they are affiliated with.
Supplementary Material
Acknowledgments
We are grateful to Matthias Blum, John Hoddonitt, and seminar participants at the 2016 Workshop on Economics and Human Biology for comments and suggestions.
References
- 1. Smith LC, Haddad L. Reducing child undernutrition: past drivers and priorities for the post-MDG era. World Dev 2015;68:180–204. [Google Scholar]
- 2. Oruamab RS. Child malnutrition and the Millennium Development Goals: much haste but less speed?. Arch Dis Child 2015;100:S19–22. [DOI] [PubMed] [Google Scholar]
- 3. Stevens GA, Finucane MM, Paciorek CJ. et al. Trends in mild, moderate, and severe stunting and underweight, and progress towards MDG 1 in 141 developing countries: a systematic analysis of population representative data. Lancet 2012;380:824–34. [DOI] [PMC free article] [PubMed] [Google Scholar]
- 4. Haddad L. Why India needs a national nutrition strategy. BMJ 2011;343:d6687. [DOI] [PubMed] [Google Scholar]
- 5. Fink G, Peet E, Danaei G. et al. Schooling and wage income losses due to early-childhood growth faltering in developing countries: national, regional, and global estimates. Am J Clin Nutr 2016;104:104–12. [DOI] [PubMed] [Google Scholar]
- 6. Qureshy LF, Alderman H, Rokx C, Pinto R, Wai-Poi M, Tandon A. Positive returns: cost-benefit analysis of a stunting intervention in Indonesia. J Dev Eff 2013;5:447–65. [Google Scholar]
- 7. Currie J. Inequality at Birth: Some Causes and Consequences. Am Econ Rev 2011;101:1–22. [Google Scholar]
- 8. Almond D, Currie J. Killing Me Softly: The Fetal Origins Hypothesis. J Econ Perspect 2011;25:153–72. [DOI] [PMC free article] [PubMed] [Google Scholar]
- 9. Currie J, Vogl T. Early-Life Health and Adult Circumstance in Developing Countries. Annu Rev Econ 2013;5:1–36. [Google Scholar]
- 10. Delaney L, Smith JP. Childhood Health: Trends and Consequences over the Life-course. Future Child 2012;22:43. [DOI] [PMC free article] [PubMed] [Google Scholar]
- 11. Almond D, Currie J. Human Capital Development before Age Five. In: Ashenfelter O, Card D (eds). Handbook of Labor Economics. Volume 4, Part B. New York, NY: Elsevier, 2011. [Google Scholar]
- 12. Corsi DJ, Subramanyam MA, Subramanian S. Commentary: Measuring nutritional status of children. Int J Epidemiol 2011;40:1030–36. [DOI] [PubMed] [Google Scholar]
- 13. Case A, Paxson C, Islam M. Making sense of the labor market height premium: Evidence from the British Household Panel Survey. Econ Lett 2009;102:174–76. [DOI] [PMC free article] [PubMed] [Google Scholar]
- 14. Stein AD, Wang M, Martorell R. et al. Growth Patterns in Early Childhood and Final Attained Stature: Data from Five Birth Cohorts from Low- And Middle-Income Countries. Am J Hum Bio 2010;22:353–59. [DOI] [PMC free article] [PubMed] [Google Scholar]
- 15. Alderman H. The economic cost of a poor start to life. J Dev Orig Health Dis 2010;1:19–25. [DOI] [PubMed] [Google Scholar]
- 16. Alderman H. Economic drivers and consequences of stunting. In: Gillman MW, Gluckman PD, Rosenfeld RG (eds). Recent Advances in Growth Research: Nutritional, Molecular and Endocrine Perspectives. Basel, Switzerland: Karger, 2013. [DOI] [PubMed] [Google Scholar]
- 17. Behrman JR, Bhalotra S, Deolalikar AB, Laxminarayan R, Nandi A Capital and Productivity Benefits of Early Childhood Nutritional Interventions. In: Jamison D, Gelband H, Horton S, Jha P, Laxminarayan R, Nugent R. (eds). Disease Control Priorities, 3rd edition. Volume 8. Washington D.C.: World Bank; 2017. [PubMed]
- 18. Behrman JR. The economic rationale for investing in nutrition in developing countries. World Dev 1993;21:1749–71. [Google Scholar]
- 19. Behrman JR. Early life nutrition and subsequent education, health, wage, and intergenerational effects. In: Spence M, Lewis M. editors. Health and Growth. Washington D.C.: World Bank, 2009. [Google Scholar]
- 20. Dewey KG, Begum K. Long‐term consequences of stunting in early life. Matern Child Nutr 2011;7:5–18. [DOI] [PMC free article] [PubMed] [Google Scholar]
- 21. World Bank. From Early Child Development to Human Development: Investing in Our Children’s Future. Young ME. (ed.). New York, NY: World Bank, 2002. [Google Scholar]
- 22. Hoddinott J, Alderman H, Behrman JR, Haddad L, Horton S. The economic rationale for investing in stunting reduction. Matern Child Nutr 2013;9:69–82. [DOI] [PMC free article] [PubMed] [Google Scholar]
- 23. Victora CG, Adair L, Fall C. et al. Maternal and child undernutrition: consequences for adult health and human capital. Lancet 2008;371:340–57. [DOI] [PMC free article] [PubMed] [Google Scholar]
- 24. World Bank. Early child development from measurement to action: a priority for growth and equity. Young ME, Richardson LM (eds.). Washington DC: World Bank, 2007. [Google Scholar]
- 25. Alderman H, Sahn DE. Public and Private Returns to Investing in Nutrition. Komlos J, Kelly IR (eds). Oxford Handbook of Economics and Human Biology. Oxford, UK: Oxford University Press, 2016. [Google Scholar]
- 26. Martorell R. The policy and program implications of research on the long-term consequences of early childhood nutrition: lessons from the INCAP follow-up study. In: Freire W (ed.). Nutrition and an Active Life: From Knowledge to Action. Washington D.C.: Pan-American Health Organization; 2005.
- 27. Alderman H, Behrman JR, Grantham-McGregor S, Lopez-Boo F, Urzua S. Economic perspectives on integrating early child stimulation with nutritional interventions. Ann N Y Acad Sci 2014;1308:129–38. [DOI] [PubMed] [Google Scholar]
- 28. Strauss J, Thomas D. Health, nutrition, and economic development. J Econ Lit 1998;36:766–817. [Google Scholar]
- 29. Fogel R. Economic Growth, Population Theory, and Physiology: The Bearing of Long-Term Processes on the Making of Economic Policy. Am Eco. Re 1994;84:369–95. [Google Scholar]
- 30. Halim N, Spielman K, Larson B. The economic consequences of selected maternal and early childhood nutrition interventions in low-and middle-income countries: a review of the literature, 2000—2013. BMC Women’s Health 2015;15:33. [DOI] [PMC free article] [PubMed] [Google Scholar]
- 31. Horton S, Steckel RH. Malnutrition: Global Economic Losses Attributable to Malnutrition 1900–2000 and Projections to 2050. Copenhagen: Copenhagen Consensus Center, 2011. [Google Scholar]
- 32. Steckel RH. Stature and the Standard of Living. J Econ Lit 1995;1903–40. [Google Scholar]
- 33. Steckel RH. Biological measures of economic history. Annu Rev Econ 2013;5(1):401–23. [Google Scholar]
- 34. Steckel RH. Heights and human welfare: Recent developments and new . Econ Hist 2009;46:1–23. [Google Scholar]
- 35. Hübler O. Height and Wages. In: Komlos J, Kelly IR (eds). The Oxford Handbook of Economics and Human Biology. Oxford, UK: Oxford University Press, 2016. [Google Scholar]
- 36. Schultz TP. Human capital, schooling and health. Econ Hum Bio 2003;1:207–21. [DOI] [PubMed] [Google Scholar]
- 37. Sudfeld CR, McCoy DC, Danaei G. et al. Linear Growth and Child Development in Low-and Middle-Income Countries: A Meta-Analysis. Pediatrics 2015;135:e1266–75. [DOI] [PubMed] [Google Scholar]
- 38. UNICEF. Improving Child Nutrition: The Achievable Imperative for Global Progress. New York, NY: United Nations Children’s Fund, 2013. [Google Scholar]
- 39. World Bank. Independent Evaluation Group International Bank for Reconstruction and Development. What Can We Learn From Nutrition Impact Evaluations?: Lessons From a Review of Interventions to Reduce Child Malnutrition in Developing Countries. New York, NY: World Bank, 2010. [Google Scholar]
- 40. Bhutta ZA, Ahmed T, Black RE. et al. What works? Interventions for maternal and child undernutrition and survival. Lancet 2008;371:417–40. [DOI] [PubMed] [Google Scholar]
- 41. Bhutta ZA, Das JK, Rizvi A. et al. Evidence-based interventions for improvement of maternal and child nutrition: what can be done and at what cost?. Lancet 2013;382:452–77. [DOI] [PubMed] [Google Scholar]
- 42. World Bank. Repositioning Nutrition as Central to Development: A Strategy for Large Scale Action. New York, NY: World Bank Publications, 2006. [Google Scholar]
- 43. Hoddinott J, Maluccio JA, Behrman JR, Flores R, Martorell R. Effect of a nutrition intervention during early childhood on economic productivity in Guatemalan adults. Lancet 2008;371(9610):411–16. [DOI] [PubMed] [Google Scholar]
- 44. Stein AD, Melgar P, Hoddinott J, Martorell R. Cohort profile: The Institute of Nutrition of Central America and Panama (INCAP) nutrition trial cohort study. Int J Epidemiol 2008;37:716–20. [DOI] [PMC free article] [PubMed] [Google Scholar]
- 45. Haas JD, Murdoch S, Rivera J, Martorell R. Early nutrition and later physical work capacity. Nutr Rev 1996;54:S41–48. [DOI] [PubMed] [Google Scholar]
- 46. Haas JD, Martinez EJ, Murdoch S, Conlisk E. Nutritional supplementation during the preschool years and physical work capacity in adolescent and young adult Guatemalans . Nut 1995;125(Suppl 4):1078S. [DOI] [PubMed] [Google Scholar]
- 47. Hoddinott J, Behrman JR, Martorell R. Labor force activities and income among young Guatemalan adults. Food Nutr Bull 2005;26:98S–109. [DOI] [PubMed] [Google Scholar]
- 48. Martorell R, Melgar P, Maluccio JA, Stein AD, Rivera JA. The nutrition intervention improved adult human capital and economic productivity. J Nutr 2010;140:411–14. [DOI] [PMC free article] [PubMed] [Google Scholar]
- 49. Hoddinott J, Behrman JR, Maluccio JA. et al. Adult consequences of growth failure in early childhood. Am J Clin Nutr 2013;98:1170–78. [DOI] [PMC free article] [PubMed] [Google Scholar]
- 50. Gertler P, Heckman J, Pinto R. et al. Labor market returns to an early childhood stimulation intervention in Jamaica. Science 2014;344:998–1001. [DOI] [PMC free article] [PubMed] [Google Scholar]
- 51. Chen Y, Zhou L-A. The long-term health and economic consequences of the 1959–1961 famine in China. J Health Econ 2007;26:659–81. [DOI] [PubMed] [Google Scholar]
- 52. Neelsen S, Stratmann T. Effects of prenatal and early life malnutrition: Evidence from the Greek famine. J Health Econ 2011;30:479–88. [DOI] [PubMed] [Google Scholar]
- 53. Jürges H. Collateral damage: The German food crisis, educational attainment and labor market outcomes of German post-war cohorts. J Health Econ 2013;32:286–303. [DOI] [PubMed] [Google Scholar]
- 54. Lumey L, Stein AD, Kahn HS. et al. Cohort profile: The Dutch Hunger Winter families study. Int J Epidemiol 2007;36:1196–204. [DOI] [PubMed] [Google Scholar]
- 55. Maccini S, Yang D. Under the Weather: Health, Schooling, and Economic Consequences of Early-Life Rainfall. Am Econ Rev 2009;99:1006–26. [DOI] [PubMed] [Google Scholar]
- 56. Kesternich I, Siflinger B, Smith JP, Winter JK. The Effects of World War II on Economic and Health Outcomes across Europe. Rev Econ Stat 2014;96:103–18. [DOI] [PMC free article] [PubMed] [Google Scholar]
- 57. Rosenzweig MR, Wolpin KI. Natural ‘natural experiments’ in economics. J Econ Lit 2000;827–74. [Google Scholar]
- 58. Lundborg P, Nystedt P, Rooth D-O. Height and earnings: The role of cognitive and noncognitive skills. J Hum Resour 2014;49:141–66. [Google Scholar]
- 59. Alderman H, Hoddinott J, Kinsey B. Long term consequences of early childhood malnutrition. Oxf Econ Pap 2006;58:450–74. [Google Scholar]
- 60. Alderman H, Hoogevee H, Rossi M. Preschool nutrition and subsequent schooling attainment: longitudinal evidence from Tanzania. Econ Dev Cult Change 2009;57:239–60. [Google Scholar]
- 61. Adair LS, Popkin BM, Akin JS. et al. Cohort Profile: The Cebu longitudinal health and nutrition survey. Int J Epidemiol 2011;40:619–25. [DOI] [PMC free article] [PubMed] [Google Scholar]
- 62. Elliott J, Shepherd P. Cohort Profile: The 1970 British birth cohort (BCS70). Int J Epidemiol 2006;35:836–43. [DOI] [PubMed] [Google Scholar]
- 63. Victora CG, Barros FC. Cohort Profile: The 1982 Pelotas (Brazil) birth cohort study. Int J Epidemiol 2006;35:237–42. [DOI] [PubMed] [Google Scholar]
- 64. Power C, Elliott J. Cohort Profile: The 1958 British birth cohort (national child development study). Int J Epidemiol 2006;35:34–41. [DOI] [PubMed] [Google Scholar]
- 65. Galler JR, Bryce C, Waber DP, Zichlin ML, Fitzmaurice GM, Eaglesfield D. Socioeconomic outcomes in adults malnourished in the first year of life: a 40-year study. Pediatrics 2012;130:e1–7. [DOI] [PMC free article] [PubMed] [Google Scholar]
- 66. Satyanarayana K, Nadamuni NA, Narasinga RB. Nutrition, physical work capacity and work output. Indian J Med Res 1978;68:88–93. [PubMed] [Google Scholar]
- 67. Satyanarayana K, Naidu AN, Rao BN. Nutritional deprivation in childhood and the body size, activity, and physical work capacity of young boys. Am J Clin Nutr 1979;32:1769–75. [DOI] [PubMed] [Google Scholar]
- 68. Carba DB, Tan VL, Adair LS. Early childhood length-for-age is associated with the work status of Filipino young adults. Econ Hum Biol 2009;7:7–17. [DOI] [PMC free article] [PubMed] [Google Scholar]
- 69. Case A, Fertig A, Paxson C. The lasting impact of childhood health and circumstance. J Health Econ 2005;24:365–89. [DOI] [PubMed] [Google Scholar]
- 70. Case A, Paxson C. Stature and Status: Height, Ability, and Labor Market Outcomes. J Polit Econ 2008;116:499–532. [DOI] [PMC free article] [PubMed] [Google Scholar]
- 71. Montgomery SM, Bartley MJ, Cook DG, Wadsworth ME. Health and social precursors of unemployment in young men in Great Britain. J Epidemiol Community Health 1996;50:415–22. [DOI] [PMC free article] [PubMed] [Google Scholar]
- 72. Persico N, Postlewaite A, Silverman D. The Effect of Adolescent Experience on Labor Market Outcomes: The Case of Height. J Polit Econ 2004;112:1019–53. [Google Scholar]
- 73. Sargent JD, Blanchflower DG. Obesity and stature in adolescence and earnings in young adulthood: analysis of a British birth cohort. Arch Pediatr Adolesc Med 1994;148:681–87. [DOI] [PubMed] [Google Scholar]
- 74. Barker DJ, Eriksson J, Forsen T, Osmond C. Infant growth and income 50 years later. Arch Dis Child 2005;90:272–73. [DOI] [PMC free article] [PubMed] [Google Scholar]
- 75. Schultz TP. Wage rentals for reproducible human capital: evidence from Ghana and the Ivory Coast. Econ Hum Biol 2003;1:331–66. [DOI] [PubMed] [Google Scholar]
- 76. Elu JU, Price GN. Ethnicity as a Barrier to Childhood and Adolescent Health Capital in Tanzania: Evidence from the Wage‐Height Relationship. Afr Dev Rev 2013;25:1–13. [Google Scholar]
- 77. Böckerman P, Vainiomäki J. Stature and life-time labor market outcomes: Accounting for unobserved differences. Labour Econ 2013;24:86–96. [Google Scholar]
- 78. Yimer S, Fantaw O. The impacts of health and nutrition on wages in Ethiopia. Afr J Bus Manag 2011;5:12174–83. [Google Scholar]
- 79. Elu JU, Price GN. Does Ethnicity Matter for Access to Childhood and Adolescent Health Capital in China? Evidence from the Wage-Height Relationship in the 2006 China Health and Nutrition Survey. Rev Black Polit Econ 2013;40:315–39. [Google Scholar]
- 80. Gao W, Smyth R. Health human capital, height and wages in China. J Dev Stud 2010;46:466–84. [Google Scholar]
- 81. Haddad LJ, Bouis HE. The impact of nutritional status on agricultural productivity: wage evidence from the Philippines. Oxf Bull Econ Stat 1991;53:45–68. [Google Scholar]
- 82. Heineck G. Up in the skies? The relationship between body height and earnings in Germany. Labour 2005;19:469–89. [Google Scholar]
- 83. Schultz TP. Wage Gains Associated with Height as a Form of Health Human Capital. Am Econ Rev 2002;92:349–53. [Google Scholar]
- 84. Tao H-L. Height, weight, and entry earnings of female graduates in Taiwan. Econ Hum Biol 2014;13:85–98. [DOI] [PubMed] [Google Scholar]
- 85. Thomas D, Strauss J. Health and wages: Evidence on men and women in urban Brazil. J Econ 1997;77:159–85. [DOI] [PubMed] [Google Scholar]
- 86. Böckerman P, Johansson E, Kiiskinen U, Heliövaara M. The relationship between physical work and the height premium: Finnish evidence. Econ Hum Bio 2010;8:414–20. [DOI] [PubMed] [Google Scholar]
- 87. Case A, Paxson C. Causes and consequences of early-life health. Demography 2010;47:S65–85. [DOI] [PMC free article] [PubMed] [Google Scholar]
- 88. Eren O, Ozbeklik S. The effect of noncognitive ability on the earnings of young men: A distributional analysis with measurement error correction. Labour Econ 2013;24:293–304. [Google Scholar]
- 89. Furnham A, Cheng H. Factors influencing adult earnings: Findings from a nationally representative sample. J Socio-Econ 2013;44:120–25. [Google Scholar]
- 90. Heineck G. A note on the height–wage differential in the UK–Cross-sectional evidence from the BHPS. Econ Lett 2008;98:288–93. [Google Scholar]
- 91. Hübler O. The nonlinear link between height and wages in Germany, 1985–2004. Econ Hum Biol 2009;7:191–99. [DOI] [PubMed] [Google Scholar]
- 92. Kortt M, Leigh A. Does Size Matter in Australia?. Econ Rec 2010;86:71–83. [Google Scholar]
- 93. Lindqvist E. Height and leadership. Rev Econ Stat 2012;94:1191–96. [Google Scholar]
- 94. Rashad I. Height, health, and income in the US, 1984–2005. Econ Hum Biol 2008;6:108–26. [DOI] [PubMed] [Google Scholar]
- 95. Rietveld CA, Hessels J, van der Zwan P. The stature of the self-employed and its relation with earnings and satisfaction. Econ Hum Biol 2015;17:59–74. [DOI] [PubMed] [Google Scholar]
- 96. Smith JP, Shen Y, Strauss J, Zhe Y, Zhao Y. The effects of childhood health on adult health and SES in China. Econ Dev Cult Change 2012;61:127. [DOI] [PMC free article] [PubMed] [Google Scholar]
- 97. Sohn K. The height premium in Indonesia. Econ Hum Biol 2014;16:1–15. [DOI] [PubMed] [Google Scholar]
- 98. Boo FL, Palloni G, Urzua S. Cost–benefit analysis of a micronutrient supplementation and early childhood stimulation program in Nicaragua. Ann N Y Acad Sci 2914;1308:139–48. [DOI] [PubMed] [Google Scholar]
- 99. Horton S, Hoddinott J. Benefits and Costs of the Food and Nutrition Targets for the Post-2015 Development Agenda. Copenhagen: Copenhagen Development Center, 2015. [Google Scholar]
- 100. Ross J, Chen C-M, He W. et al. Effects of malnutrition on economic productivity in China as estimated by PROFILES. Biomed Environ Sci 2003;16:195–205. [PubMed] [Google Scholar]
- 101. Alcázar L, Ocampo D, Huamán-Espino L, Pablo Aparco J. Economic impact of chronic, acute and global malnutrition in Peru. Rev Peru Med Exp Salud Pública 2013;30:569–74. [PubMed] [Google Scholar]
- 102. Bagriansky J, Champa N, Pak K, Whitney S, Laillou A. The economic consequences of malnutrition in Cambodia, more than 400 million US dollar lost annually. Asia Pac J Clin Nutr 2014;23:524. [DOI] [PubMed] [Google Scholar]
- 103. Horton S, Ross J. The economics of iron deficiency. Food Policy 2003;28:51–75. [Google Scholar]
- 104. Fernández A, Martínez R. Model for Analysing the Social and Economic Impact of Child Undernutrition in Latin America. Santiago: United Nations Economic Commission for Latin America and the Caribbean (ECLAC), 2007). [Google Scholar]
- 105. African Union Commission/World Food Programme. The Cost of Hunger in Malawi: Social and Economic Impacts of Child Undernutrition in Malawi: Implications on National Development and Vision 2020. Addis Ababa: African Union Commission, 2015. [Google Scholar]
- 106. Bloom D, Cafiero-Fonseca ET, McGovern ME. et al. The Macroeconomic Impact of Non-Communicable Diseases in China and India: Estimates, Projections, and Comparisons. J Econ Ageing 2014;4:100–11. [Google Scholar]
- 107. Baten J. Heights and real wages in the 18th and 19th centuries: an international overview. Jahrb Für Wirtsch Hist Yearb 2000;41:61–76. [Google Scholar]
- 108. Bloom DE, Canning D, Sevilla J. The effect of health on economic growth: a production function approach. World Dev 2004;32:1–13. [Google Scholar]
- 109. Chakraborty S, Papageorgiou C, Sebastián FP. Diseases, infection dynamics, and development. J Monet Econ 2010;57:859–72. [Google Scholar]
- 110. Dalgaard C-J, Strulik H. The physiological foundations of the wealth of nations. J. Econ Growth 2015;20: 37–73. [Google Scholar]
- 111. Piper B. A production function examination of the aggregate effects of nutrition. J Macroecon 2014;40:293–307. [Google Scholar]
- 112. Bleakley H. Health, human capital, and development. Annu Rev Econ 2010;2:283. [DOI] [PMC free article] [PubMed] [Google Scholar]
- 113. Weil DN. Health and economic growth. In: Aghion P, Durlauf SN (eds). Handbook of Economic Growth. (2A). New York, NY: Elsevier, 2014. [Google Scholar]
- 114. López-Casasnovas G, Rivera B, Currais L. Health and Economic Growth: Findings and Policy Implications. Cambridge MA: MIT Press, 2005. [Google Scholar]
- 115. Well DN. Accounting for the Effect Of Health on Economic Growth. Q J Econ 2007;122:1265–306. [Google Scholar]
- 116. Arora S. Health, human productivity, and long-term economic growth. J Econ Hist 2001;61:699–749. [Google Scholar]
- 117. María-Dolores R, Martínez-Carrión JM. The relationship between height and economic development in Spain, 1850–1958. Econ Hum Biol 2011;9:30–44. [DOI] [PubMed] [Google Scholar]
- 118. Akachi Y, Canning D. Inferring the economic standard of living and health from cohort height: Evidence from modern populations in developing countries. Econ Hum Biol 2015;19:114–28. [DOI] [PubMed] [Google Scholar]
- 119. Bershteyn A, Lyons HM, Sivam D, Myhrvold NP. Association between economic growth and early childhood nutrition. Lancet Glob Health 2015;3:e79–80. [DOI] [PubMed] [Google Scholar]
- 120. Vollmer S, Harttgen K, Subramanyam MA, Finlay J, Klasen S, Subramanian S. Association between economic growth and early childhood undernutrition: evidence from 121 Demographic and Health Surveys from 36 low-income and middle-income countries. Lancet Glob Health 2014;2:e225–34. [DOI] [PubMed] [Google Scholar]
- 121. Headey DD. Developmental drivers of nutritional change: a cross-country analysis. World Dev 2013;42:76–88. [Google Scholar]
- 122. Heltberg R. Malnutrition, poverty, and economic growth. Health Econ 2009;18:S77–88. [DOI] [PubMed] [Google Scholar]
- 123. Ruel MT, Alderman H, ;. Maternal and Child Nutrition Study Group. Nutrition-sensitive interventions and programmes: how can they help to accelerate progress in improving maternal and child nutrition?. Lancet 2013;382:536–51. [DOI] [PubMed] [Google Scholar]
- 124. Harttgen K, Klasen S, Vollmer S. Economic Growth and Child Undernutrition in sub‐Saharan Africa. Popul Dev Rev 2013;39:397–412. [Google Scholar]
- 125. Webb P, Block S. Support for agriculture during economic transformation: Impacts on poverty and undernutrition. Proc Natl Acad Sci 2012;109:12309–14. [DOI] [PMC free article] [PubMed] [Google Scholar]
- 126. Smith LC, Haddad L. How Potent Is Economic Growth in Reducing Undernutrition? What Are the Pathways of Impact? New Cross‐Country Evidence. Econ Dev Cult Change 2002;51:55–76. [Google Scholar]
- 127. Haddad L, Alderman H, Appleton S, Song L, Yohannes Y. Reducing child malnutrition: How far does income growth take us?. World Bank Econ Rev 2003;17:107–31. [Google Scholar]
- 128. Subramanyam MA, Kawachi I, Berkman LF, Subramanian S. Is economic growth associated with reduction in child undernutrition in India?. PLoS Med 2011;8:448. [DOI] [PMC free article] [PubMed] [Google Scholar]
- 129. Moradi A. Nutritional status and economic development in sub-Saharan Africa, 1950–1980. Econ Hum Biol 2010;8:16–29. [DOI] [PubMed] [Google Scholar]
- 130. Vollmer S, Harttgen K, Subramanyam MA, Finlay J, Klasen S, Subramanian S. Association between economic growth and early childhood nutrition–Authors’ reply. Lancet Glob Health 2014;2:e501–02. [DOI] [PubMed] [Google Scholar]
- 131. Alderman H, Haddad L, Headey DD, Smith L. Association between economic growth and early childhood nutrition. Lancet Glob Health 2014;2:e500. [DOI] [PubMed] [Google Scholar]
- 132. Cavatorta E, Shankar B, Flores-Martinez A. Explaining Cross-State Disparities in Child Nutrition in Rural India. World Dev 2015;76:216–37. [Google Scholar]
- 133. International Food Policy Research Institute. Global Nutrition Report 2014: Actions and Accountability to Accelerate the World’s Progress on Nutrition. Washington, DC: International Food Policy Research Institute, 2014. [DOI] [PMC free article] [PubMed] [Google Scholar]
- 134. International Food Policy Research Institute. Global Nutrition Report 2015: Actions and Accountability to Advance Nutrition and Sustainable Development. Washington, DC: International Food Policy Research Institute, 2015. [DOI] [PMC free article] [PubMed] [Google Scholar]
- 135. Aguayo VM, Menon P. Stop stunting: improving child feeding, women s nutrition and household sanitation in South Asia. Matern Child Nutr 2016;12(S1):3–11. [DOI] [PMC free article] [PubMed] [Google Scholar]
- 136. Fink G, Günther I, Hill K. The effect of water and sanitation on child health: evidence from the Demographic and Health Surveys 1986–2007. Int J. Epidemiol 2011;40:1196–204. [DOI] [PubMed] [Google Scholar]
- 137. Alderman H, Hoogeveen H, Rossi M. Reducing child malnutrition in Tanzania: Combined effects of income growth and program interventions. Econ Hum Biol 2006;4:1–23. [DOI] [PubMed] [Google Scholar]
- 138. Haddad L. Equity: Not Only for Idealists. Dev Policy Rev 2015;33:5–13. [Google Scholar]
- 139. Florêncio TT, Ferreira HS, Cavalcante JC, Assuncao M, Sawaya AL. Short stature and food habits as determining factors for the low productivity of sugarcane labourers in the State of Alagoas, north-eastern Brazil. Arch Latinoam Nutr 2008;58:33–9. [PubMed] [Google Scholar]
- 140. Price GN. The allometry of metabolism and stature: Worker fatigue and height in the Tanzanian labor market. Econ Hum Biol 2013;11:515–21. [DOI] [PubMed] [Google Scholar]
- 141. Doyle O, Harmon CP, Heckman JJ, Tremblay RE. Investing in early human development: timing and economic efficiency. Econ Hum Bio 2009;7:1–6. [DOI] [PMC free article] [PubMed] [Google Scholar]
- 142. Krzyżanowska M, Mascie-Taylor CN. Intra-and intergenerational social mobility in relation to height, weight and body mass index in a British national cohort. J Biosoc Sci 2011;43:611–18. [DOI] [PubMed] [Google Scholar]
- 143. Steckel RH. Biological measures of the standard of living. J Econ Perspect 2008;22:129–52. [DOI] [PubMed] [Google Scholar]
- 144. Yousafzai AK, Rasheed MA, Rizvi A, Armstrong R, Bhutta ZA. Effect of integrated responsive stimulation and nutrition interventions in the Lady Health Worker programme in Pakistan on child development, growth, and health outcomes: a cluster-randomised factorial effectiveness trial. Lancet 2014;384:1282–93. [DOI] [PubMed] [Google Scholar]
- 145. Haddad L, Masset E, Smith L Does The Quality of Income Growth Affect Child Nutrition Status? In: Haddad L, Kato H, Meisel N (eds). Growth is Dead, Long Live Growth: The Quality of Economic Growth and Why it Matters. Paris: Agence Française de Développement (AFD), Brighton, UK: Institute of Development Studies (IDS), Tokyo: Japan International Cooperation Agency (JICA), 2015. [Google Scholar]
- 146. Jenkins JM. Early Childhood Development as Economic Development Considerations for State-Level Policy Innovation and Experimentation. Econ Dev Q 2014;28:147–65. [Google Scholar]
Associated Data
This section collects any data citations, data availability statements, or supplementary materials included in this article.