Abstract
In this work, we synthesized a series of boronate ester fluorescence probes (E)‐4,4,5,5‐tetramethyl‐2‐(4‐styrylphenyl)‐1,3,2‐dioxaborolane (STBPin), (E)‐N,N‐dimethyl‐4‐(4‐(4,4,5,5‐tetramethyl‐1,3,2‐dioxaborolan‐2‐yl)styryl)aniline (DSTBPin), (E)‐4‐(4‐(4,4,5,5‐tetramethyl‐1,3,2‐dioxaborolan‐2‐yl)styryl)benzonitrile (CSTBPin), (E)‐2‐(4‐(4‐methoxystyryl)phenyl)‐4,4,5,5‐tetramethyl‐1,3,2‐dioxaborolane (MSTBPin), (E)‐N,N‐dimethyl‐4‐(4‐(4,4,5,5‐tetramethyl‐1,3,2‐dioxaborolan‐2‐yl)styryl)naphthalen‐1‐amine (NDSTBPin), and N,N‐dimethyl‐4‐(2‐(4‐(4,4,5,5‐tetramethyl‐1,3,2‐dioxaborolan‐2‐yl)phenyl)oxazol‐5‐yl)aniline (DAPOX‐BPin) for the detection of hydrogen peroxide (H2O2). DSTBPin and MSTBPin displayed an “Off–On” fluorescence response towards H2O2, owing to the loss of the intramolecular charge transfer (ICT) excited state. Whereas, CSTBPin displayed a decrease in fluorescence intensity in the presence of H2O2 owing to the introduction of an ICT excited state. STBPin, on the other hand, produced a small fluorescence decrease, indicating the importance of an electron‐withdrawing or electron‐donating group in these systems. Unfortunately, the longer wavelength probe, NDSTBPin, displayed a decrease in fluorescence intensity. Oxazole‐based probe DAPOX‐BPin produced a “turn‐on” response. Regrettably, DAPOX‐BPin required large concentrations of H2O2 (>3 mm) to produce noticeable changes in fluorescence intensity and, therefore, no change in fluorescence was observed in the cell imaging experiments.
Keywords: boronic acids, diagnostics, fluorescent probes, H2O2, intramolecular charge transfer (ICT)
Hydrogen peroxide (H2O2) is the simplest peroxide, playing a significant role as a signaling molecule in a variety of different biological processes.1, 2 Unfortunately, elevated levels of H2O2 exceeding the antioxidant capacity results in the damage of multiple cellular components; this is known as “oxidative stress”.3 Oxidative stress results in direct or indirect reactive oxygen species (ROS)‐mediated damage to a number of different biological targets such as nucleic acids, lipids, and proteins.4, 5 Therefore, oxidative stress has been associated with a number of pathological processes including neurodegenerative diseases, diabetes, cancer, and aging.5, 6, 7 For this reason, researchers are actively seeking new and effective approaches for H2O2 detection. With our research, we are particularly interested in the development of small‐molecule fluorescent probes,8, 9, 10, 11, 12 as they are well suited to meet the need of tools to map the spatial and temporal distribution of H2O2 in living cells. However, the major challenge for practical H2O2 sensing in biological environments is creating water‐soluble systems that respond to H2O2. Chang and co‐workers13, 14 as well as others15 have developed a range of probes for the selective detection of H2O2 based on the well‐known hydrogen‐peroxide‐mediated oxidation of arylboronates to phenols. An example of this strategy includes Peroxyfluor‐1 (PF1), a diboronate‐xanthene‐based probe, which is initially non‐fluorescent.16 Upon treatment with H2O2, oxidative deprotection of the boronates results in the generation of the highly fluorescent fluorescein. We decided to utilize this strategy for the development of ratiometric fluorescent probes for the detection of H2O2. We are particularly interested in ratiometric fluorescence probes, as they provide a method for internal calibration between the reacted and unreacted fluorescent probe. The most commonly exploited systems for the design of ratiometric fluorescent probes are fluorescence resonance energy transfer (FRET) and intramolecular charge transfer (ICT) systems.17, 18 DiCesare and Lakowicz19, 20, 21 developed a series of ICT‐based stilbene fluorescence probes for the detection of fluoride or saccharides. The addition of each target analyte to these probes resulted in a ratiometric response—a change in emission intensity and wavelength (Scheme 1).
Scheme 1.
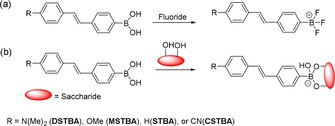
Previous work reported by DiCesare and Lakowicz a) using stilbene boronic acids for the detection of fluoride20 and b) using stilbene boronic acids for the detection of saccharides.21
Therefore, we chose to evaluate these stilbene‐based fluorescent probes towards H2O2 detection, as it is believed that the addition of H2O2 would result in the conversion of the boronate group to a phenol group accompanied by a ratiometric change in fluorescence (Scheme 2). The boronate pinacol ester (BPin) stilbenes were synthesized over the boronic acid (BA) stilbenes, owing to the ease of synthesis and straightforward 1H NMR spectroscopic characterization. Note that both BA and BPin would generate the same fluorescence response for H2O2.
Scheme 2.

Use of stilbene boronate fluorescent probes for the detection of hydrogen peroxide.
Therefore, we prepared the analogous stilbene boronate ester fluorescent probes (STBPin, DSTBPin, MSBPin, and CSTBPin) using a Horner–Wadsworth–Emmons (HWE) reaction to produce a bromo‐substituted intermediate, which was then further reacted with bis(pinacolato)diboron (B2pin2) using a palladium‐catalyzed Suzuki reaction to produce the pinacol ester probes. All of the synthesized probes contain an sp2‐hybridized boronic ester, which is an electron‐withdrawing group (EWG). Therefore, when there is an electron‐donating group (EDG) at the 4′ position, a typical ICT donor–π–acceptor (D‐π‐A) system results, whereas when an EWG is placed at the 4′ position, there is no ICT. Upon the addition of H2O2, the boronic ester is converted to an electron‐donating phenol, disrupting the charge transfer for these systems.
We initially tested the control probe, STBPin, to show that an EDG or EWG was required to produce a change in the fluorescence intensity and emission wavelength. Therefore, the addition of H2O2 (2 mm) only led to a small decrease in the fluorescence intensity (see Figure S8).
We then evaluated the fluorescence response of DSTBPin towards H2O2 and, as shown in Figure 1, the DSTBPin initial emission wavelength was 488 nm. The addition of H2O2 resulted in a ratiometric response with a blueshift in the emission wavelength from 488 to 444 nm and increase in fluorescence intensity. This observation can be explained through the oxidative conversion of the boronic ester to the electron‐donating phenol, resulting in a change from a Push–Pull ICT mechanism into a Push–Push system, increasing the electron density within the π system.
Figure 1.
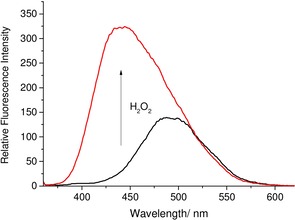
Fluorescence analysis of DSTBPin (5 μm) in pH 8.21 buffer solution (52.1 wt % MeOH) with the addition of H2O2 (2 mm) and re‐analyzed 30 min after H2O2 addition. λ ex=350 nm; slit widths: excitation: 10 nm, emission: 3 nm.
The fluorescence characteristics of MSTBA were then investigated towards H2O2. As shown in Figure 2, the emission wavelength shifted from 405 to 380 nm, accompanied by a fluorescence increase upon reaction with H2O2 (2 mm), similar to DSTBA; however, an overall smaller increase in fluorescence intensity was observed. The larger increase in fluorescence intensity for DSTBA can be attributed to the dimethlyamino group having a greater electron‐donating ability.
Figure 2.
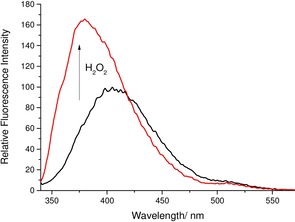
Fluorescence analysis of MSTBPin (5 μm) in pH 8.21 buffer solution (52.1 wt % MeOH) with the addition of H2O2 (2 mm) and re‐analyzed 30 min after H2O2 addition. λ ex=330 nm; slit widths: excitation: 10 nm, emission: 3 nm.
The fluorescence characteristics of CTSBA were then investigated towards H2O2. As discussed above, CTSBA contains two EWGs, resulting in a Pull–Pull system. The addition of H2O2 (2 mm) resulted in the introduction of the electron‐donating phenol group, creating a Push–Pull ICT system, accompanied by a decrease in fluorescence intensity (Figure 3).
Figure 3.
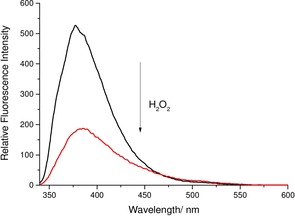
Fluorescence analysis of CSTBPin (5 μm) in pH 8.21 buffer solution (52.1 wt % MeOH) with the addition of H2O2 (2 mm) and re‐analyzed 30 min after H2O2 addition. λ ex=330 nm; slit widths: excitation: 10 nm, emission: 3 nm.
Owing to DSTBPin demonstrating the biggest “off–on” response upon reaction with H2O2, we synthesized a naphthalene dimethylamino stilbene boronate (NDSTBPin; see Figure 4) fluorescent probe for the detection of H2O2. This probe was prepared to develop a system with a longer emission wavelength that could overcome the issues associated with background fluorescence of biological materials in cell imaging experiments.
Figure 4.

NDSTBPin and DAPOX‐BPin fluorescent probes for the detection of H2O2.
NDSTBPin was synthesized by using the same synthetic procedures as the previously synthesized stilbene fluorescent probes (STBPin, DSTBPin, CSTBPin, and MSTBPin). Dimethylamino‐1‐naphthaldehyde was subjected to a HWE reaction to produce the dimethylamino‐1‐naphthyl bromo‐substituted intermediate, which was then further reacted with B2pin2 through a palladium‐catalyzed Suzuki reaction to form NDSTBPin in a modest yield (33 %).
NDSTBPin fluorescence response towards H2O2 was evaluated. The addition of H2O2 (2 mm) to NDSTBPin resulted in a blueshift in the emission wavelength. Unfortunately, a decrease in fluorescence intensity was observed, unlike DSTBPin (Figure 5). This is probably the result of extended conjugation between the BA and the dimethylamino group in NDSTBPin when compared to DSTBPin, resulting in a fluorescence response similar to STBPin. Our main focus was to develop a “turn‐on” H2O2 fluorescent probe, as it is much easier to visualize a bright signal against a dark background, thus providing easier analysis of H2O2 in a biological sample.
Figure 5.
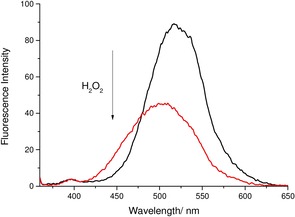
Fluorescence analysis of probe NDSTBPin (5 μm) in pH 8.21 buffer solution (52.1 wt % MeOH) with the addition of H2O2 (2 mm) and re‐analyzed 30 min after H2O2 addition. λ ex=350 nm; slit widths: excitation: 10 nm, emission: 3 nm.
Therefore, we turned our attention to the synthesis of an alternative boronate‐based fluorescence probe, a dimethylamino oxazole boronic acid (DAPOX‐PBA).19, 20 DAPOX‐BPin was synthesized through the acylation reaction of 2‐amino‐4‐dimethylaminoacetophenone with 4‐bromobenzyl chloride to afford an amide intermediate. This amide intermediate was then dehydrated by using concentrated H2SO4 to form the desired bromo‐substituted oxazole intermediate. The bromo‐substituted oxazole intermediate was subsequently subjected to a Suzuki–Miyaura reaction, using B2pin2 to afford DAPOX‐BPin in a satisfactory yield (44 %).
As shown in Figure 6, a 3.6‐fold fluorescence increase was observed for DAPOX‐BPin with the addition of H2O2. The favorable fluorescence properties of DAPOX‐BPin 20 allowed us to evaluate the detection of H2O2 with cell imaging experiments. Unfortunately, owing to its poor sensitivity [requiring millimolar concentration with a limit of detection (LOD) greater than 3 mm] towards H2O2, no change in fluorescence intensity was observed in the cell imaging experiments. Also, no change in fluorescence intensity was observed for the exogenous addition of other ROS/reactive nitrogen species or the endogenous stimulation of ROS (see Figures S9 and S10). This result was unexpected given the relatively low pK a (7.8) of DAPOX‐PBA.19, 20 This clearly indicates that a balance must be struck between enhancing the acidity of the BA and maximizing the amount of free sp2 boron available for reaction with a nucleophilic oxidant under the measurement conditions (in this case pH=7.25).
Figure 6.
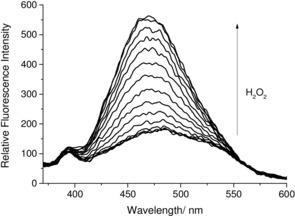
Fluorescent spectra of DAPOX‐BPin (30 nm) with the addition of H2O2 (0 mm −21 mm) in pH 7.25 buffer solution (52.1 wt % MeOH) with a 10 min wait between each measurement. λ ex=350 nm; slit widths: excitation: 10 nm, emission: 10 nm.
Overall, these boronate stilbene and oxazole fluorescent probes demonstrated a reasonable fluorescence response towards H2O2. Unfortunately, DAPOX‐BPin lacked sensitivity towards H2O2, requiring non‐biologically relevant concentrations of H2O2 (millimolar). Therefore, cell imaging experiments using DAPOX‐BPin for the detection of H2O2 resulted in no change of fluorescence intensity. We are currently working to develop a series of ICT fluorescent probes that have enhanced sensitivity towards H2O2. Our design strategy is to optimize the acidity of the BA group to enhance the reaction with nucleophilic ROS such as H2O2, whilst maximizing the amount of free sp2 boron available for the reaction.
Experimental Section
All starting materials and reagents were purchased from Sigma Aldrich, Alfa Aesar, Fluorochem, Acros Organics, or Apollo Scientific and used as received without any further purification. Unless otherwise stated, all solvents were of reagent grade and were used without distillation. Dry solvents were obtained from an Innovative Technology Inc. PS‐400‐7 solvent purification system. All water used was distilled. Stock solutions of H2O2 were prepared from commercially available (Sigma Aldrich) hydrogen peroxide (30 % in H2O) and diluted accordingly. Phosphate buffer solution (52.1 wt % MeOH) was prepared according to the literature.22 Thin‐layer chromatography was performed by using commercially available Macherey–Nagel aluminum‐backed plates coated with a 0.20 mm layer of silica gel (60 Å) containing fluorescent indicator UV254. These plates were visualized by using either ultraviolet light with a wavelength of 254 or 365 nm, or by staining the plates with vanillin or ninhydrin solution. Silica gel column chromatography was carried out by using Fisher or Sigma Aldrich 60 Å silica gel (35–70 μm).
Unless otherwise stated, all NMR spectra were obtained by using a Bruker Advance 300, with all spectra recorded in chloroform‐d or [D 6]DMSO. 1H NMR spectra were recorded at an operating frequency of 300 MHz, 11B NMR spectra were recorded at an operating frequency of 96 MHz, and 13C NMR spectra were recorded at an operating frequency of 75 MHz, with proton decoupling for all 13C NMR spectra. High‐resolution mass spectrometry (HRMS) results were typically acquired on an externally calibrated Bruker Daltonics micrOTOF time‐of‐flight mass spectrometer coupled to an electrospray source (ESI‐TOF). Fluorescence measurements were performed on a PerkinElmer luminescence spectrophotometer LS 50B/ LS 55 B utilizing a Starna silica (quartz) cuvette with a 10 mm path length (four faces polished). Data were collected by using the PerkinElmer FL Winlab software package. All solvents used in the fluorescence measurements were HPLC or fluorescence grade and the water was deionized. Further reprocessing of the data was carried in OriginPro 8.0 software. All pH measurements taken during fluorescence/absorption experiments were recorded on a Hanna Instruments HI 9321 microprocessor pH meter, which was routinely calibrated by using Fisher Chemicals standard buffer solutions (pH 4.0: phthalate; 7.0: phosphate; 10.0: borate). UV/Vis measurements were performed on a PerkinElmer Lambda 20 Spectrophotometer, utilizing a Starna silica (quartz) cuvette with a 10 mm path lengths (two faces polished). Data were collected by using the PerkinElmer UVWinlab software package. Further reprocessing of the data was carried in OriginPro 8.0 software.
See the Supporting Information for full synthetic experimental procedures.
Conflict of interest
The authors declare no conflict of interest.
Supporting information
As a service to our authors and readers, this journal provides supporting information supplied by the authors. Such materials are peer reviewed and may be re‐organized for online delivery, but are not copy‐edited or typeset. Technical support issues arising from supporting information (other than missing files) should be addressed to the authors.
Supplementary
Acknowledgements
E.V.L. thanks the EPSRC Doctoral Training Centre in Sustainable Chemical Technologies: EP/G03768X/1 for a studentship. A.C.S would like to thank the EPSRC and the University of Bath for funding. T.D.J. wishes to thank the Royal Society for a Wolfson Research Merit Award. NMR characterization facilities were provided through the Chemical Characterization and Analysis Facility (CCAF) at the University of Bath (www.bath.ac.uk/ccaf). All data supporting this study are provided as supplementary information accompanying this paper.
E. V. Lampard, A. C. Sedgwick, X. Sun, K. L. Filer, S. C. Hewins, G. Kim, J. Yoon, S. D. Bull, T. D. James, ChemistryOpen 2018, 7, 262.
Contributor Information
Adam C. Sedgwick, Email: A.C.Sedgwick@bath.ac.uk.
Prof. Tony D. James, Email: T.D.James@bath.ac.uk.
References
- 1. Weidinger A., Kozlov A. V., Biomolecules 2015, 5, 472–484. [DOI] [PMC free article] [PubMed] [Google Scholar]
- 2. Valko M., Leibfritz D., Moncol J., Cronin M. T. D., Mazur M., Telser J., Int. J. Biochem. Cell Biol. 2007, 39, 44–84. [DOI] [PubMed] [Google Scholar]
- 3. Cencioni C., Spallotta F., Martelli F., Valente S., Mai A., Zeiher A. M., Gaetano C., Int. J. Mol. Sci. 2013, 14, 17643–17663. [DOI] [PMC free article] [PubMed] [Google Scholar]
- 4. Bartsch H., Nair J., Langenbecks Arch. Surg. 2006, 391, 499–510. [DOI] [PubMed] [Google Scholar]
- 5. Ohshima H., Tatemichi M., Sawa T., Arch. Biochem. Biophys. 2003, 417, 3–11. [DOI] [PubMed] [Google Scholar]
- 6. Finkel T., Holbrook N. J., Nature 2000, 408, 239–247. [DOI] [PubMed] [Google Scholar]
- 7. Mattson M. P., Nature 2004, 430, 631–639. [DOI] [PMC free article] [PubMed] [Google Scholar]
- 8. Sedgwick A. C., Chapman R. S. L., Gardiner J. E., Peacock L. R., Kim G., Yoon J., Bull S. D., James T. D., Chem. Commun. 2017, 53, 10441–10443. [DOI] [PubMed] [Google Scholar]
- 9. Sedgwick A. C., Sun X. L., Kim G., Yoon J., Bull S. D., James T. D., Chem. Commun. 2016, 52, 12350–12352. [DOI] [PubMed] [Google Scholar]
- 10. Sedgwick A. C., Han H., Gardiner J. E., Bull S. D., He X.-P., James T. D., Chem. Commun. 2017, 53, 12822–12825. [DOI] [PubMed] [Google Scholar]
- 11. Sun X., Xu Q., Kim G., Flower S. E., Lowe J. P., Yoon J., Fossey J. S., Qian X., Bull S. D., James T. D., Chem. Sci. 2014, 5, 3368–3373. [Google Scholar]
- 12. Wu D., Sedgwick A. C., Gunnlaugsson T., Akkaya E. U., Yoon J., James T. D., Chem. Soc. Rev. 2017, 46, 7105–7123. [DOI] [PubMed] [Google Scholar]
- 13. Dickinson B. C., Huynh C., Chang C. J., J. Am. Chem. Soc. 2010, 132, 5906–5915. [DOI] [PMC free article] [PubMed] [Google Scholar]
- 14. Miller E. W., Albers A. E., Pralle A., Isacoff E. Y., Chang C. J., J. Am. Chem. Soc. 2005, 127, 16652–16659. [DOI] [PMC free article] [PubMed] [Google Scholar]
- 15. Masanta G., Heo C. H., Lim C. S., Bae S. K., Cho B. R., Kim H. M., Chem. Commun. 2012, 48, 3518–3520. [DOI] [PubMed] [Google Scholar]
- 16. Chang M. C. Y., Pralle A., Isacoff E. Y., Chang C. J., J. Am. Chem. Soc. 2004, 126, 15392–15393. [DOI] [PMC free article] [PubMed] [Google Scholar]
- 17. Yuan L., Lin W. Y., Zheng K. B., Zhu S. S., Acc. Chem. Res. 2013, 46, 1462–1473. [DOI] [PubMed] [Google Scholar]
- 18. Wu J. S., Liu W. M., Ge J. C., Zhang H. Y., Wang P. F., Chem. Soc. Rev. 2011, 40, 3483–3495. [DOI] [PubMed] [Google Scholar]
- 19. DiCesare N., Lakowicz J. R., Chem. Commun. 2001, 2022–2023. [DOI] [PMC free article] [PubMed] [Google Scholar]
- 20. DiCesare N., Lakowicz J. R., Anal. Biochem. 2002, 301, 111–116. [DOI] [PMC free article] [PubMed] [Google Scholar]
- 21. DiCesare N., Lakowicz J. R., J. Phys. Chem. A 2001, 105, 6834–6840. [DOI] [PMC free article] [PubMed] [Google Scholar]
- 22. Perrin D. D., Dempsey B., Buffers for pH and Metal Ion Control, Chapman and Hall, London, 1974. [Google Scholar]
Associated Data
This section collects any data citations, data availability statements, or supplementary materials included in this article.
Supplementary Materials
As a service to our authors and readers, this journal provides supporting information supplied by the authors. Such materials are peer reviewed and may be re‐organized for online delivery, but are not copy‐edited or typeset. Technical support issues arising from supporting information (other than missing files) should be addressed to the authors.
Supplementary


