

Abstract
Autism spectrum disorder (ASD) is characterized by impairments in social cognition, a function associated with the amygdala. Subdivisions of the amygdala have been identified which show specificity of structure, connectivity, and function. Little is known about amygdala connectivity in ASD. The aim of this study was to investigate the microstructural properties of amygdala—cortical connections and their association with ASD behaviours, and whether connectivity of specific amygdala subregions is associated with particular ASD traits. The brains of 51 high‐functioning young adults (25 with ASD; 26 controls) were scanned using MRI. Amygdala volume was measured, and amygdala—cortical connectivity estimated using probabilistic tractography. An iterative ‘winner takes all’ algorithm was used to parcellate the amygdala based on its primary cortical connections. Measures of amygdala connectivity were correlated with clinical scores. In comparison with controls, amygdala volume was greater in ASD (F(1,94) = 4.19; p = .04). In white matter (WM) tracts connecting the right amygdala to the right cortex, ASD subjects showed increased mean diffusivity (t = 2.35; p = .05), which correlated with the severity of emotion recognition deficits (rho = −0.53; p = .01). Following amygdala parcellation, in ASD subjects reduced fractional anisotropy in WM connecting the left amygdala to the temporal cortex was associated with with greater attention switching impairment (rho = −0.61; p = .02). This study demonstrates that both amygdala volume and the microstructure of connections between the amygdala and the cortex are altered in ASD. Findings indicate that the microstructure of right amygdala WM tracts are associated with overall ASD severity, but that investigation of amygdala subregions can identify more specific associations.
Keywords: amygdaloid nuclear complex, autism spectrum disorders, diffusion tensor imaging, diffusion tractography
1. INTRODUCTION
Autism spectrum disorder (ASD) is a neurodevelopmental condition associated with impaired communication skills and reduced social reciprocity, in addition to restricted and repetitive behaviours (World Health Organization, 1994). Difficulties in the recognition of emotional facial expressions and in ‘theory of mind’ — which includes the ability to ascribe emotional states to others —are typical in ASD. Lesion studies have shown that the amygdala is involved in both of these functions: Adolphs, Tranel, Damasio, and Damasio (1994) revealed that the recognition of emotionally‐charged facial expressions, in particular fear, is impaired following bilateral amygdala damage, and Shaw et al. (2004) showed that that the acquisition of ‘theory of mind’ abilities is impaired following unilateral (left or right) amygdala damage during childhood. This association between the amygdala and development of emotional intelligence suggests that structural and/or functional abnormalities in the amygdala, particularly during childhood, may play a pivotal role in the development and maintenance of autistic behaviours, a concept known as the ‘amygdala theory of autism’ (Baron‐Cohen et al., 2000).
Structural magnetic resonance imaging (MRI) studies have reported amygdala enlargement (Abell et al., 1999; Groen, Teluij, Buitelaar, & Tendolkar, 2010; Howard et al., 2000; Kim et al., 2010; Mosconi et al., 2009; Murphy et al., 2012; Schumann, Barnes, Lord, & Courchesne, 2009; Shou et al., 2017; Sparks et al., 2002) and reduction (Nacewicz, Dalton, Johnstone, & Long, 2006; Pierce, Müller, Ambrose, Allen, & Courchesne, 2001; Rojas et al., 2004) in ASD compared with neurotypical controls, in addition to findings of no significant difference in amygdala volume between ASD and control groups (Corbett et al., 2009; Dziobek, Fleck, Rogers, Wolf, & Convit, 2006; Haar, Berman, Behrmann, & Dinstein, 2016; Palmen, Durston, Nederveen, & van Engeland, 2006). These disparities may be explained by age, with early accelerated amygdala growth in ASD (Nordahl et al., 2012) that levels off or declines into later childhood (Mosconi et al., 2009), adolescence (Schumann et al., 2004), and adulthood (Nacewicz et al., 2006), although there is some evidence that elevated amygdala volume in ASD persists into adulthood (Abell et al., 1999; Howard et al., 2000; Murphy et al., 2012). Additionally, there may be sex‐based differences in both amygdala volume and its phenotypic correlates in ASD (Schumann et al., 2009). Further, evidence suggests that amygdala volume abnormalities may be associated with other neurodevelopmental and neuropsychiatric disorders, such as ADHD (Hoogman et al., 2017; Nickel et al., 2017) schizophrenia (van Erp et al., 2016; Rich et al., 2016), and fragile X syndrome (Hazlett et al., 2009). Amygdala volume in ASD has been related to the severity of social and communication deficits (Kim et al., 2010; Schumann et al., 2009), the ability to establish appropriate eye contact (Barnea‐Goraly et al., 2014), joint attention (Mosconi et al., 2009), and the severity of restricted and repetitive behaviours (Dziobek et al., 2006). We aimed to investigate group differences in amygdala volume in our study sample of young adults.
The amygdala is structurally connected to other brain regions via a network of white matter (WM) tracts. Diffusion tensor imaging (DTI) measures water diffusion in tissue, which can be used to reconstruct the anatomy of WM tracts via tractography, and provide biomarkers of WM microstructure (Basser & Pierpaoli, 1996). These include: fractional anisotropy (FA), a measure of the directional restriction of water diffusion, and mean diffusivity (MD), which measures the overall magnitude of diffusion. Reductions in FA and increases in MD can indicate a loss of WM coherence and structure (Beaulieu, 2002). Despite evidence from lesion studies and volumetric analyses that highlight the importance of the amygdala in ASD, to the best of our knowledge, no study has investigated amygdala connectivity directly in ASD. A number of previous studies of ASD have investigated microstructural differences in WM pathways that connect to temporal lobe structures: in young children with ASD, elevated FA has been identified in temporal lobe projections (Fingher et al., 2017) and the uncinate fasciculus, which links the temporal and frontal lobes (Solso et al., 2016), and reduced diffusivity reported in corpus callosum projections that link the temporal lobe with the occipital lobe (Fingher et al., 2017). Conversely in older children with ASD, significantly reduced FA has been reported in WM surrounding the amygdala (Noriuchi et al., 2010) and in the inferior longitudinal fasciculus (ILF) and the inferior fronto‐occipital fasciculus (IFOF) (both of which connect temporal lobe structures, including the amygdala) (Jou et al., 2011b). Elevated diffusion has been reported in adults with ASD in comparison to neurotypical controls in amygdala—fusiform tracts (Conturo et al., 2008), and the anterior thalamic radiation, uncinate fasciculus, and ILF (Koolschijn, Caan, Teeuw, Olabarriaga, & Geurts, 2016). In a previous tract‐based spatial statistics (TBSS) investigation of young adults, significantly elevated MD and reduced FA in the WM surrounding the amygdala was found in ASD (Gibbard et al., 2013). Taken together these findings indicate that young children with ASD show increased restriction of diffusion, which reverses such that older children and young adults with ASD have less direction‐restricted diffusion compared with neurotypical controls. Indeed Koolschijin et al. (2016) reported group differences in the effect of age on diffusion in WM tracts in ASD compared with controls. However, to the best of our knowledge, studies have not investigated amygdala connectivity directly in ASD at any age; our study aims to close this knowledge gap using DTI tractography to assess amygdala connectivity and its association with symptom severity in young adults with ASD.
Studies of animal and human pathology have shown that the amygdala comprises several nuclei (LeDoux, 1998, 1995; Saygin, Osher, Augustinack, Fischl, & Gabrieli, 2011), which are often grouped into three main subdivisions: the centromedial, laterobasal, and superficial nuclei (Amunts et al., 2005; Heimer et al., 1999). These amygdala subregions appear to differ based on their cytoarchitecture, connectivity, and function — with the centromedial nucleus associated with motor responses (Kalin, Shelton, & Davidson, 2004), the laterobasal nucleus with stimulus‐effect memory and fear response conditioning through connections with sensory regions of the cortex (Adhikari et al., 2015; Johansen et al., 2010; Stefanacci & Amaral, 2000), and the superficial nucleus posited to play a role in social cognition and responses to emotionally‐salient stimuli via its insula and basal ganglia connectivity (Bzdok, Laird, Zilles, Fox, & Eickhoff, 2013). Recent analysis of high‐resolution MRI acquired in vivo have subdivided the amygdala based on co‐registration of T1‐ and T2‐weighted structural images (Tyszka & Pauli, 2016), and measures of functional connectivity and co‐activation (Bzdok et al., 2013; Kerestes, Chase, Phillips, Ladouceur, & Eickhoff, 2017; Mishra, Rogers, Chen, & Gore, 2014; Yang et al., 2016). Recent tractography studies in healthy adults have shown that it is possible to subdivide the amygdala in vivo using WM connectivity‐based parcellation schemes: Abivardi and Bach (2017) and Bach, Behrens, Garrido, Weiskopf, and Dolan (2011) used a k‐means algorithm to parcellate the amygdala into two clusters based on connectivity to the frontal cortex and the temporal pole; Saygin et al. (2017, 2011) used a priori assumptions of amygdala—cortical connections in order to subdivide the amygdala into clusters that were in good agreement with manual tracing on a high‐resolution T1‐weighted image.
Evidence suggests that subregions of the amygdala are cytoarchitecturally altered in ASD, with increased cell packing density and reduced neuronal size identified (Bauman & Kemper, 1994), particularly in medial amygdala nuclei (Bauman & Kemper, 2005). Contrary to this, reduced neuronal density has been reported in the lateral nucleus of the amygdala in ASD (Schumann & Amaral, 2006; Wegiel et al., 2014). Recently, Saygin et al. (2017) were able to discriminate between individuals with ASD and matched controls with 59.5% accuracy, based on measures of amygdala nuclei volume. In this study, we aimed to investigate whether the structural connectivity of subdivisions of the amygdala were altered in ASD compared with neurotypical controls, and if these group differences were associated with particular autistic traits. We selected a ‘winner takes all’ method (Behrens et al., 2003) which identifies the target a voxel maximally connects to, and uses this information to divide structures into clusters of voxels with the same ‘winning’ target. This affords an anatomically‐driven approach and allows the data to drive the results, as opposed to imposing prior expectations on the underlying anatomy. Our aim was not to validate or replicate amygdala nuclei as identified using post‐mortem dissection and cytoarchitecture, which is beyond the limits of current diffusion MRI on standard clinical MRI systems. Our intention was to apply a robust data‐driven parcellation scheme to investigate amygdala—cortical connectivity, to establish whether these connections can be distinguished in ASD compared with neurotypical controls, and to dissect out those amygdala—cortical connections most strongly associated with autistic traits. To the best of our knowledge this is the first time that amygdala substructure and structural connectivity has been investigated in ASD.
2. MATERIALS AND METHODS
2.1. Participants
Twenty‐six high‐functioning young adults who had previously received a clinical diagnosis of an ASD, and 26 age‐matched neurotypical controls were recruited locally. None of the subjects had a history of neuropsychiatric disorders including anxiety, attention deficit hyperactivity disorder, depression and epilepsy. All MRI scans were visually inspected for neurological abnormalities, with no irregularities observed. The study was approved by the local ethics committee and each participant gave written informed consent. Full‐scale, verbal and performance IQ were measured using the four‐scale Wechsler Abbreviated Scale of Intelligence (Wechsler, 1999). All subjects had an IQ > 80. The autism quotient (AQ) self‐report questionnaire (Baron‐Cohen, Wheelwright, Skinner, Martin, & Clubley, 2001b), which assesses abilities in social, communication, attention to detail, attention switching, and imagination domains, was administered to all subjects. The AQ ranges from 0 to 50, with higher scores reflecting a greater incidence of autistic traits in an individual. The Autism Diagnostic Observation Schedule (Lord et al., 1989) semistructured interview was conducted with the ASD subjects to confirm their previous clinical diagnosis. One subject was subsequently excluded from the study as their diagnosis could not be re‐confirmed, leaving a total of 25 in the ASD group. Two‐tailed t tests and chi‐squared tests were used to compare demographic measures between groups.
2.2. Data acquisition and preprocessing
Whole‐brain MRI was carried out on a 1.5 T Siemens Magnetom Avanto scanner (Siemens, Erlangen, Germany) with 40 mT/m gradients and a 12‐channel receive head coil. The total imaging protocol took 42 min. A T1‐weighted three‐dimensional fast low angle shot sequence was acquired with flip angle = 15°; TR = 11 ms; TE = 4.94 ms; voxel size = 1 mm isotropic; slices = 176. The DTI protocol consisted of a twice‐refocused spin echo diffusion‐weighted echo planar imaging sequence with 60 unique gradient directions (b = 1,000 s/mm2). Three images without diffusion weighting (b = 0) were interleaved. The parameters were: TR = 7,300 ms; TE = 81 ms; voxel size = 2.5 mm isotropic; 60 axial slices. The protocol also included resting‐state and task‐based functional MRI (fMRI), the results of which are reported elsewhere. The imaging protocol included an fMRI task. The task was a modified version of ‘Reading the Mind in the Eyes’ (Baron‐Cohen, Jolliffe, Mortimore, & Robertson, 1997; Baron‐Cohen, Wheelwright, Hill, Raste, & Plumb, 2001a) in which participants viewed images of eyes and were asked to identify the person's emotional state from a choice of four emotional descriptors. The participant was familiarized with the words prior to scanning. The control task involved assessing the person's age. Participants viewed alternate blocks of emotion and age estimations, with three blocks of each in total. Scores for the emotional component of the task were higher in subjects who accurately identified the emotion portrayed. Emotion recognition scores were correlated with structural brain measures in this study.
All scans were visually inspected for abnormalities, motion and other artefacts. There was no evidence that motion or other artefacts varied between groups. The DTI data were preprocessed using TractoR version 2.1 (Clayden et al., 2011) and FMRIB Software Library (FSL) version 4.1 (Smith et al., 2004). Briefly, within each participant, a reference b = 0 volume was brain‐extracted (Smith, 2002) and the diffusion‐weighted volumes registered to this reference to correct for eddy current distortions. A diffusion tensor was derived at each voxel using a standard least‐squares process to provide a voxelwise calculation of FA and MD. FSL's BEDPOSTX was applied in order to estimate diffusion parameters within each voxel using a ball and two sticks model, thus allowing for estimation of up to two WM fibre directions per voxel (Behrens, Berg, Jbabdi, Rushworth, & Woolrich, 2007).
2.3. Region of interest segmentation and volume estimation
Whole brain volume was calculated on the T1‐weighted scans using the FSL tool SIENAX (Smith, De Stefano, Jenkinson, & Matthews, 2001; Smith et al., 2002). Briefly, SIENAX brain extracts the images, affine‐registers them to MNI152 space then uses partial volume estimation to segment tissue types. The skull is used for normalization.
Left and right amygdala volumes were calculated on the T1‐weighted scans using the FSL tool FIRST (Patenaude, Smith, Kennedy, & Jenkinson, 2011). In summary, FIRST registers all subjects’ scans to standard space and then uses shape and appearance models to segment subcortical gray matter structures, including the amygdala. In order to reduce the incidence of registration errors, the FIRST process was modified (cf. Novak et al., 2014): the transformation required in the registration was estimated using a brain‐extracted scan; FIRST was then carried out on the original whole‐head scan using the transformation calculated with the brain‐extracted scan. The amygdala regions of interest were separated from the other subcortical segmentations and amygdala volume estimated using FSL utilities. Amygdala volume was compared between groups using a two‐way ANCOVA with age, gender, full‐scale IQ, and whole brain volume as covariates.
Cortical gray matter was segmented using FreeSurfer (Fischl, Sereno, Tootell, & Dale, 1999). Briefly, motion correction was carried out prior to removal of nonbrain tissue and transformation to Talairach space. Intensity normalization was then applied prior to estimation of grey matter/WM and gray matter/cerebrospinal fluid boundaries. Finally, the cerebral cortex was parcellated into 68 regions of interest based on gyral and sulcal structure (Fischl, 2004). Cortical grey matter regions of interest were grouped into frontal, parietal, occipital, temporal, and insula lobes using FSL utilities. All registrations and segmentations were visually inspected for accuracy.
2.4. ‘Winner takes all’ amygdala parcellation
Regions of interest were registered from T1 space into diffusion space using a combination of FSL's linear registration tool FLIRT (Jenkinson, Bannister, Brady, & Smith, 2002) and nonlinear method FNIRT. All registrations were visually assessed.
Using tract orientation information from FSL's BEDPOSTX, TractoR was used to seed probabilistic tractography from each amygdala voxel using the five ipsilateral regions of interest − frontal, parietal, temporal, occipital, and insula cortices — as targets, and the corresponding contralateral target as an exclusion mask. 5,000 streamlines were seeded from each voxel. Since tracking propagated in both directions from the seed voxel, only portions of the streamlines that proceeded from the seed in the direction of the target and terminated at the target were retained. The numbers of streamlines connecting each amygdala voxel to the cortical targets were recorded in a connectivity matrix.
An iterative ‘winner takes all’ process was run in R using a script specifically written for this study, based on the method outlined by Behrens et al. (2003). The script interrogated the connectivity matrix and parcellated the amygdala based on its structural connectivity. Each amygdala voxel was assigned to a cluster based on the cortical target it was maximally connected to, as defined by the highest number of connecting streamlines. In order to avoid aberrant connections, we enforced a condition that at least 50% of participants had to demonstrate a connection between the amygdala and a given target. If not, this target was excluded and new ‘winners’ were then found in affected voxels. This process was repeated until each participant's amygdala voxels were assigned to a cluster. Cluster volume was measured using FSL utilities and included as a covariate in group comparison and correlation analyses of each cluster's WM tract microstructure.
2.5. Estimation of DTI parameters in WM tracts
FA and MD values in each voxel of WM connecting amygdala clusters to their ‘winning’ target were weighted by the number of streamlines in that voxel. The weighted FA and MD values were averaged across the whole tract, preventing rarely‐visited voxels from affecting the average, and ensuring that tract microstructure was accurately represented. The DTI metrics, representative of WM microstructure, were compared between groups using linear regression with age, gender, and full‐scale IQ as covariates. Ipsilateral amygdala volume was additionally included as a covariate for whole amygdala analyses; amygdala cluster volume was used when comparing tracts arising from each amygdala cluster. False discovery rate (FDR) multiple comparisons correction was applied across each group of independent tests. FA and MD are typically correlated with one another, so FDR correction was therefore applied separately for measures of FA from tracts in the left and right hemispheres, and for MD in the left and right hemispheres.
2.6. Association between amygdala structural measures and clinical scores
In order to investigate the specificity of associations between the amygdala and particular characteristics of ASD, amygdala—cortical WM tract microstructure was correlated with AQ subscores in social, communication, attention to detail, attention switching, and imagination domains, and emotion recognition score from the ‘Reading the Mind in the Eyes’ task.
Due to non‐normality of the behavioural and imaging data, partial Spearman correlation was applied with age, gender and full‐scale IQ included as covariates for all correlations. Additionally, amygdala volume was included as a covariate for analyses of whole amygdala tract measures, and respective amygdala cluster volume for analysis of cluster tract measures. FDR correction was applied across each group of independent tests.
3. RESULTS
3.1. Participant demographics
Table 1 summarizes participant demographics. Analysis using two‐tailed t tests showed no significant group differences in age, verbal IQ, performance IQ or full‐scale IQ, and analysis using chi‐squared tests showed no significant group differences in sex or handedness. AQ was significantly higher in the ASD group, as expected.
Table 1.
Participant demographics and cognitive test scores
| Control (n = 26) | Autism (n = 25) | t statistic | χ2 | p value | |
|---|---|---|---|---|---|
| Sex | 21M:5F | 21M:4F | – | <0.001 | 1.00 |
| Handedness | 26R:0L | 23R:2L | – | 0.56 | .45 |
| Age (years) |
24.73 (4.10) [18.83 –33.30] |
23.22 (4.05) [18.31 –31.90] |
1.32 | – | .20 |
| Full‐scale IQ |
122.00 (7.98) [105–138] |
119.40 (11.59) [94–136] |
0.86 | – | .39 |
| Verbal IQ |
119.73 (9.01) [102–136] |
116.84 (12.56) [84–135] |
0.94 | – | .35 |
| Performance IQ |
118.73 (7.07) [103–129] |
117.36 (11.04) [88–135] |
0.53 | – | .60 |
| AQ |
13.35 (7.81) [4 ‐ 37] |
36.56 (6.53) [22–49] |
−11.53 | – | <.0001 |
| ADOSa | – |
9.22 (4.11) [3–20] |
– | – | – |
Data are expressed as mean (SD) [range].
ADOS = autism diagnostic observation schedule; AQ = autism quotient; IQ = intelligence quotient.
Combined social and communication subscores.
3.2. Whole brain and amygdala volume group comparison
As shown in Table 2, linear regression analysis showed no significant group differences in whole brain volume normalized for skull size (t = 0.49; p = .63). For amygdala volume, the two‐way ANCOVA showed a significant main effect of group, with amygdala volume greater in ASD compared with controls (F(1,94) = 4.19; p = .04), and a significant main effect of hemisphere, with left amygdala volumes larger than right amygdala volumes (F(1,94) = 5.27; p = .02). The group × hemisphere interaction was not significant, meaning that there was no effect of group on the hemispheric asymmetry in amygdala volume; see Table 2 for mean left and right amygdala volumes in each group.
Table 2.
Whole brain and amygdala volumes (cm3) by group
| Control (n = 26) | Autism (n = 25) | t statistic | p value | |
|---|---|---|---|---|
| Whole brain | 1304.76 (121.68) [1100.18–1628.93] | 1320.30 (104.95) [1040.45–1579.89] | 0.49 | .63 |
| Left amygdala | 1.79 (0.26) [1.36–2.44] | 1.87 (0.30) [1.16–2.44] | – | – |
| Right amygdala | 1.60 (0.29) [0.93–2.16] | 1.81 (0.32) [1.04–2.54] | – | – |
Data are expressed as mean (SD) [range].
3.3. Amygdala WM tract microstructure group comparison
Average MD in right‐hemisphere WM tracts connecting the amygdala with the cortex was significantly elevated in the ASD group compared with controls (t = 2.35; p = .05, FDR‐corrected) (see Figure 1). No significant group differences were detected for FA in right hemisphere amygdala — cortical tracts or for FA or MD in amygdala — cortical tracts of the left hemisphere.
Figure 1.
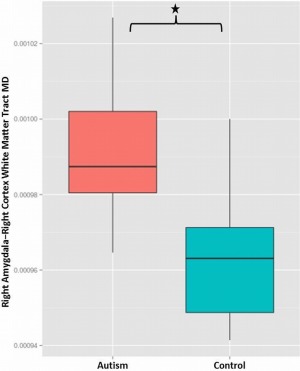
Box and whisker plot showing significantly elevated mean diffusivity (MD) in white matter tracts connecting the right amygdala with the right cortex in the autism group (left) compared with the controls (right) following correction for the influence of age, gender, full‐scale IQ, and right amygdala volume (t = 2.35; p = .05, FDR‐corrected) [Color figure can be viewed at http://wileyonlinelibrary.com]
3.4. Association between amygdala−cortex WM tract microstructure and autism severity in ASD subjects
MD in right‐hemisphere WM connecting the amygdala with the cortex was negatively correlated with performance in the ‘Reading the Mind in the Eyes’ task (rho = −0.53; p = .01, FDR‐corrected; see Figure 2). There was a nonsignificant trend association between FA in these same tracts and AQ (rho = −0.44; p = .06, FDR‐corrected).
Figure 2.
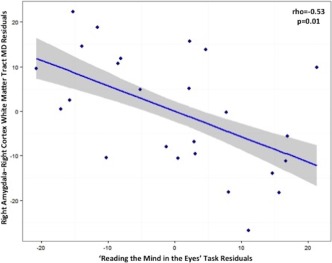
Plot showing the result of partial Spearman correlation in the autism group between score in a ‘Reading the Mind in the Eyes’ task and mean diffusivity (MD) of white matter tracts connecting the right amygdala with the right‐hemisphere cortical grey matter (rho = −0.53; p = .01, FDR‐corrected). A lower ‘Reading the Mind in the Eyes’ score reflects greater autism severity, whilst higher MD represents less restriction of water diffusion in the tissue, which may be associated with reduced microstructural integrity of the white matter. Age, gender, full‐scale IQ, and right amygdala volume were covariates. The shaded panel represents standard error [Color figure can be viewed at http://wileyonlinelibrary.com]
3.5. Amygdala parcellation
Amygdala subdivision using the ‘winner takes all’ algorithm identified clusters of voxels demonstrating maximal structural connectivity to the same cortical target, thus segmenting the amygdala in vivo based on its structural connectivity (see Figure 3). Bilaterally, this resulted in four possible clusters connecting to the frontal lobe, parietal lobe, temporal lobe, and insula cortices. There was no occipital cortex‐connecting cluster in any subject, which indicates that it was not a ‘winning’ target for the number of subjects required to denote a cluster. Figure 4 shows an example of the tractography output, showing connectivity between the amygdala clusters and their ‘winning’ cortical target.
Figure 3.
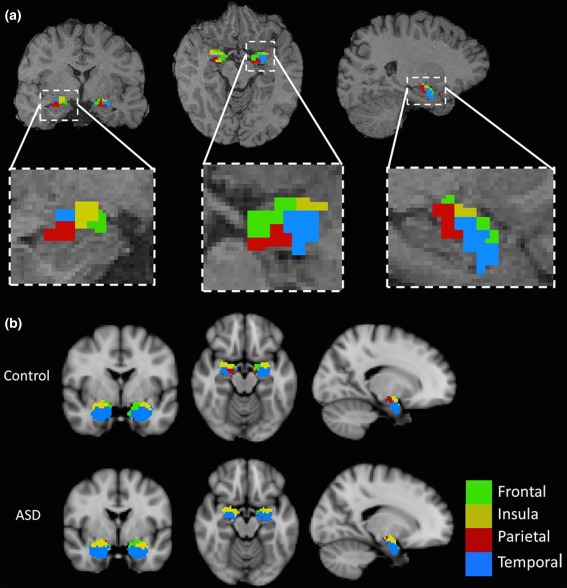
(a) A representative subject showing the results of ‘winner takes all’ parcellation of the amygdala in vivo overlaid on the participant's T1‐weighted scan, and panels at higher magnification below. Parcellation was based on the amygdala's structural connectivity profile: probabilistic tractography was seeded from each amygdala voxel to ipsilateral frontal, parietal, temporal, occipital, and insula cortices; each voxel was assigned a ‘winning’ target which it maximally connected to: frontal cortex (green), parietal cortex (red), temporal cortex (blue), and insula cortex (yellow). The occipital lobe was not a winning target for any voxel. (b) Group‐averaged maps showing the results of ‘winner takes all’ parcellation of the amygdala in vivo in the control and ASD groups overlaid on a T1‐weighted image in MNI space, taken from FSL's anatomical atlases. The group maps were generated by aligning each participant's parcellation in MNI space and assigning voxels to the modal cluster for the group: frontal cortex (green), parietal cortex (red), temporal cortex (blue), and insula cortex (yellow) [Color figure can be viewed at http://wileyonlinelibrary.com]
Figure 4.
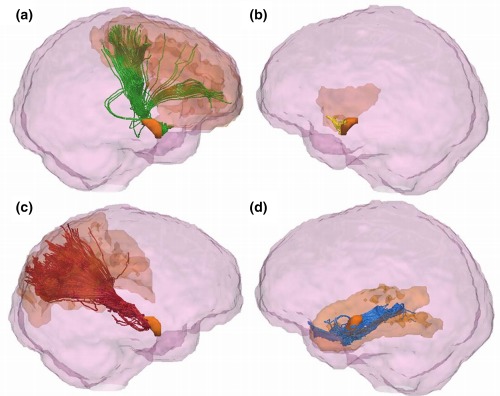
An example of the results of probabilistic tractography seeded from clusters of amygdala voxels and terminating at each cluster's ‘winning’ cortical target. Tracts connecting the amygdala frontal cluster with the frontal cortex are shown in green (a), yellow for connections between the amygdala and the insula cortex (b), red for the parietal cortex (c), and blue for the temporal cortex (d). The amygdala and cortical targets are shown in orange within each panel. The images were obtained by visualizing the tracts and regions of interest in TrackVis (Wang and Wedeen, 2007), and overlaying these on a glass representation of the brain. A cutoff in the X‐plane was applied in order to allow for better visualization of the tract pathways [Color figure can be viewed at http://wileyonlinelibrary.com]
3.6. Amygdala cluster WM tract microstructure group comparison
The only significant group difference in amygdala cluster WM tract microstructure prior to multiple comparisons correction, was for reduced average FA in WM tracts connecting the right amygdala insula cluster with the right insula cortex in ASD compared with controls (t = −2.32; p = .10, FDR‐corrected [p = .03 prior to correction]); however, this result did not remain significant following correction for multiple comparisons. There were no further significant group differences in FA or MD of WM tracts from the other amygdala clusters.
3.7. Association between amygdala cluster WM tract microstructure and autism severity in ASD subjects
Correlations between the five AQ domains and measures of FA and MD in WM tracts connecting the amygdala clusters to the cortex were investigated in the ASD group. Table 3 summarizes the results that were significant prior to correction for multiple comparisons. As can be seen from the table, the only result that remained significant following correction was that FA in tracts joining the left amygdala temporal cluster with the left temporal cortex was negatively correlated with AQ attention switching (rho = −0.61; p = .02, FDR‐corrected; see Figure 5).
Table 3.
Results of correlations between amygdala cluster white matter tract microstructure and autism severity, as measured by the AQ, in ASD participants
| White matter tract | DTI metric | AQ domain | Rho | Uncorrected p value | Corrected p value |
|---|---|---|---|---|---|
| Left amygdala temporal cluster–left temporal cortex | FA | Attention switching | −0.61 | .001 | .02 |
| Communication | −0.44 | .03 | .27 | ||
| MD | Communication | 0.46 | .02 | .22 | |
| Imagination | 0.41 | .04 | .25 | ||
| Right amygdala temporal cluster–right temporal cortex | FA | Attention switching | −0.50 | .01 | .20 |
| MD | Attention switching | 0.43 | .03 | .65 | |
| Left amygdala parietal cluster–left parietal cortex | MD | Communication | 0.39 | .05 | .25 |
| Attention switching | 0.47 | .02 | .22 | ||
| Right amygdala parietal cluster–right parietal cortex | FA | Communication | −0.46 | .02 | .20 |
AQ = autism quotient; DTI = diffusion tensor imaging; FA = fractional anisotropy; MD = mean diffusivity.
Figure 5.
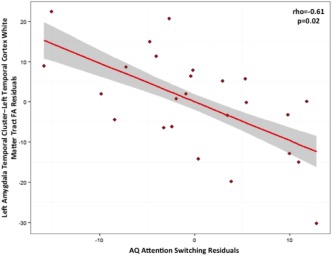
Plot showing the result of partial Spearman correlation in the autism group between autism quotient (AQ) attention switching score and fractional anisotropy (FA) of white matter connecting the left amygdala temporal cluster to the temporal cortex (rho = −0.61; p = .02, FDR‐corrected). Elevated AQ scores are associated with greater symptom severity, and lower FA is reflective of reduced white matter microstructural coherence. Age, gender, full‐scale IQ, and respective amygdala temporal cluster volume were covariates. The shaded panel represents standard error [Color figure can be viewed at http://wileyonlinelibrary.com]
Correlations between the same cluster tract FA and MD measures and score on the ‘Reading the Mind in the Eyes’ task were also carried out within the ASD group. Prior to correction for multiple comparisons, there was a positive correlation between score on the ‘Reading the Mind in the Eyes’ task and FA of WM connecting the left parietal lobe with the left amygdala parietal cluster (rho = 0.45; p = .10, FDR‐corrected [p = .02 prior to correction]); however, this result did not remain significant following correction. There were no other significant results.
4. DISCUSSION
The main findings of this study in young adults were that amygdala volume was significantly elevated in the ASD group compared with neurotypical controls, and that right hemisphere amygdala — cortical connections had less microstructural density, as measured by MD. Elevated MD in these right amygdala — cortical WM tracts was associated with increased severity of the autistic phenotype, as measured by impaired emotion recognition. Another finding was that parcellation of the amygdala into subregions that share similar cortical connectivity enabled identification of amygdala — cortical connections most associated with a particular autistic behaviour: reduced microstructural integrity of left amygdala—temporal connections was related to greater difficulty with attention switching. Results provide evidence that the amygdala is altered in ASD, both in terms of its volume, and in the microstructural properties of its connections to the cortex. The correlation results suggest that there may be some specificity regarding amygdala—cortical connectivity and its association with ASD symptoms. Further investigation of amygdala subregions may help to uncover associations between specific amygdala connections and characteristics of the ASD phenotype.
We found significantly elevated amygdala volume in our ASD group compared with controls. The group × hemisphere interaction was not significant, which suggests that hemispheric asymmetry in amygdala volume was not significantly different between the groups. This is in agreement with studies that have reported volumetric differences in both left and right amygdalae in ASD (Pierce et al., 2001; Schumann et al., 2004), correlating with clinical characteristics of autism (Mosconi et al., 2009; Schumann et al., 2009). Functional deficits in response to social stimuli have been reported bilaterally in the amygdalae of autistic subjects (Baron‐Cohen et al., 1999; Pierce et al., 2001). However, it contrasts with previous studies that have reported hemisphere‐specific group differences in amygdala volume, such as Murphy et al.'s (2012) study in which right, but not left, amygdala volume group differences survived correction for brain volume, and studies in which group differences in amygdala volume were reported in the left amygdala, but not the right amygdala (Abell et al., 1999; Rojas et al., 2004; Shou et al., 2017). Our finding also contrasts with studies that did not find a significant difference in amygdala volume between ASD and control groups (Corbett et al., 2009; Dziobek et al., 2006; Haar et al., 2016; Palmen et al., 2006). It is likely that amygdala volume findings in ASD are influenced by several factors, including study participant age (Mosconi et al., 2009; Murphy et al., 2012; Nacewicz et al., 2006; Nordahl et al., 2012; Schumann et al., 2004) and sex (Schumann et al., 2009).
Significantly reduced microstructural density of WM tracts connecting the right amygdala to the cortex was found in our ASD group compared with controls, as measured by elevated MD. Higher MD in these WM tracts was significantly associated with poorer emotion recognition scores, as measured by the ‘Reading the Mind in the Eyes’ task. To the best of our knowledge, no other study has investigated amygdala connectivity directly in ASD; nevertheless, our finding is consistent with reports of elevated diffusion in WM tracts connecting the amygdala to the fusiform gyrus (Conturo et al., 2008), and in WM tracts that connect to the amygdala, including the anterior thalamic radiation, uncinate fasciculus, and ILF (Koolschijn et al., 2016). It is also consistent with our previous report from a voxel‐based analysis in the same study cohort, in which we identified significantly elevated MD in widespread regions of WM in the ASD group compared with controls, including WM voxels surrounding the amygdala (Gibbard et al., 2013). However, for amygdala — cortical tracts in the left hemisphere we did not detect any significant group differences in WM microstructure, or associations between microstructure and ASD symptom severity. This suggests that ASD‐related differences in amygdala structural connectivity are more apparent in the right amygdala compared with the left amygdala, and that, in our study sample, emotion recognition ability is significantly associated with connectivity in the right, but not left amygdala. Further analysis to directly compare the left and right amygdalae, and to confirm our finding in a larger study sample will be required to investigate this hypothesis.
Parcellation analysis enabled further investigation of amygdala—cortical connectivity, with the aim of identifying specificity with regards to amygdala—cortical connectivity dysfunction in ASD. Associations between ASD symptom severity, as measured by the AQ and ‘Reading the Mind in the Eyes’, and amygdala cluster tract WM microstructure were investigated. The only result that survived correction for multiple comparisons was that reduced microstructural coherence of left amygdala—temporal cortex WM tracts, as measured by FA, was associated with reduced ability to switch attention between tasks, as measured by the AQ attention switching domain. This result suggests that the microstructure of local left hemisphere connections between the amygdala and the temporal lobe cortex is associated specifically with attention switching deficits in ASD. This contrasts with our finding of significantly reduced coherence of WM tracts from the whole amygdala to the whole cortex in the right hemisphere, which was significantly associated with reduced emotion recognition ability, a key characteristic of ASD. This suggests that the right and left amygdalae play distinct roles in ASD with, perhaps, the right amygdala associated more generally with emotion recognition deficits in ASD, and a small domain of the left amygdala associated with ASD‐related attention switching deficits. Further evidence is needed to support this hypothesis, but it is consistent with evidence that the left amygdala interprets physiological arousal arising from specific stimuli, while the right amygdala mediates nonspecific, automatic activations (Gläscher & Adolphs, 2003) — emotion recognition involves the recruitment and integration of multiple senses, so may therefore be an ability that is more likely to associate with a more generally‐receptive right amygdala than a left amygdala that is more selective. Particular roles for the left and right amygdalae have been reported in women with Turner syndrome (Skuse, Morris, & Dolan, 2005), a condition associated with increased incidence of ASD (Creswell & Skuse, 1999) and elevated amygdala volume (Good et al., 2003). Further, hemispheric specificity has been reported for the functional activation (Baron‐Cohen et al., 1999; Green et al., 2013) of the amygdala in ASD, and for the microstructure of adjacent WM in ASD (Ecker et al., 2012; Jou et al., 2011b; Noriuchi et al., 2010; Radua, Via, Catani, & Mataix‐Cols, 2011). Our results, along with this previous evidence, suggest that the amygdalae and their cortical connections may be lateralized with regards to their structural connections and impact on ASD symptoms, and that amygdala subregions may have specific associations with ASD traits. In a recent study by Saygin et al. (2017), amygdala parcellation at high field strengths enabled discrimination between individuals with ASD and matched controls with 59.5% accuracy, which suggests that amygdala domains are a valuable area for future ASD research.
Many findings in our parcellation analysis did not survive correction for multiple corrections. The methodology used in this investigation necessitated multiple comparisons correction due to the large number of statistical tests. However, those findings that were significant prior to FDR correction can be used to generate future hypotheses for targeted analysis of amygdala subregion connectivity in ASD. Our findings that were significant prior to multiple comparisons correction indicated that WM microstructure may be altered in the ASD group for connections between the amygdala and insula cortex. The insula is highly connected to structures of the social brain (Skuse & Gallagher, 2009), and is thought to be the locus of self‐awareness (Craig, 2009) — an ability that is impaired in ASD. Our nonsignificant finding is consistent with previous reports of microstructural WM deficits in the insula lobe in ASD compared with controls (Cheng et al., 2010; Jou et al., 2011a). Further findings that did not survive correction for multiple comparisons were that microstructural impairments, as measured by FA and MD, in WM linking the amygdala and both the temporal and parietal cortices were associated with communication and attention switching difficulties. However, reduced imagination ability was associated only with amygdala—temporal connectivity, and emotion recognition difficulty was associated only with compromise of amygdala—parietal tracts. These findings are consistent with previous research that identified associations between measures of temporal lobe WM microstructure and ASD severity (Abdel Razek, Mazroa, & Baz, 2014; Cheung et al., 2009), and between measures of parietal lobe WM microstructure and ASD‐related processing deficits (Kana, Libero, Hu, Deshpande, & Colburn, 2014). This suggests that amygdala connectivity to insula, parietal and temporal cortices may be associated with ASD, and our study further indicates that amygdala subregions and their structural connections may show specificity in their association with particular ASD traits. This warrants further investigation.
Our study has some limitations. The study sample was high functioning, with high IQ scores. This means that our findings are not representative of the entire ASD population; however, it does increase the likelihood that our findings reflect ASD‐related differences, independent of IQ. The occipital cortex was not represented in the amygdala parcellation results. This does not mean that these connections are not present — indeed the ILF connects temporal lobe structures with the occipital lobe (Catani, Jones, Donato, & Ffytche, 2003). Rather, it may be that each amygdala voxel was maximally connected to another cortical target or that the number of subjects with ‘winning’ occipital connections was below threshold. Connection probability decreases with distance; a high number of streamlines were seeded during tractography to maximize the probability that all possible streamlines were identified. Additionally, larger streamline groups, such as those from the whole amygdala, average over more voxels than smaller streamline groups, such as those from the amygdala clusters. The larger streamline groups will tend to average out sources of within‐ and between‐subject variance, such as noise and tract extent, while the smaller streamline groups are more sensitive to this variance. The low resolution of MRI scans relative to actual WM tract dimensions may cause partial volume effects, and the directionality of WM connections cannot be determined using tractography; postmortem or tracer studies would be necessary. Errors may be introduced during registration and segmentation, although this was mitigated by visual assessment. It is not possible to infer causality using correlation analyses. FDR was used to correct for multiple comparisons. FDR is not as conservative as some other approaches, however it was considered appropriate in the context of this exploratory study in order to moderate false negatives. Several correlation results did not survive multiple comparisons correction. This may be ameliorated by a larger sample size; however, some correlation results did survive correction in this study sample. Future studies could reduce the number of statistical tests by restricting hypotheses to those connections we have identified as pertinent. Investigation of the functional connectivity of each of the amygdala subregions we identified in this study would further understanding of the complex interface between structure and function. Our work indicates that amygdala connectivity has potential as a biomarker of severity in different domains of ASD; larger, longitudinal cohorts would be needed to support this and to show specificity, since the amygdala has been implicated in several neurodevelopmental conditions.
5. CONCLUSION
In summary our study is, to the best of our knowledge, the first to specifically investigate the structural connectivity of subdivisions of the amygdala in vivo in ASD. Findings indicate that amygdala connections are microstructurally compromised in ASD, and that microstructural aberrations in particular amygdala—cortical WM tracts may be associated with particular ASD‐related impairments. Amygdala volume was elevated in ASD compared with controls. This study advances understanding of the neurological underpinnings of autistic behaviours, and has implications for further studies of amygdala connectivity.
ACKNOWLEDGMENTS
We thank all participants who took part in the study, and Tina Banks and Charlotte Sanderson for data acquisition assistance. CAC acknowledges European Union Grant FP7–2009‐C 238292. CRG was funded by a UCL Grand Challenge studentship, and JR was funded by an Erasmus Mundus Chinese Collaborative PhD studentship.
Gibbard CR, Ren J, Skuse DH, Clayden JD, Clark CA. Structural connectivity of the amygdala in young adults with autism spectrum disorder. Hum Brain Mapp. 2018;39:1270–1282. 10.1002/hbm.23915
Funding information European Union Grant, Grant Number: FP7‐2009‐C 238292; UCL Grand Challenge Studentship; Erasmus Mundus Chinese Collaborative PhD Studentship
REFERENCES
- Abdel Razek, A. , Mazroa, J. , & Baz, H. (2014). Assessment of white matter integrity of autistic preschool children with diffusion weighted MR imaging. Brain & Development, 36, 28–34. [DOI] [PubMed] [Google Scholar]
- Abell, F. , Krams, M. , Ashburner, J. , Passingham, R. , Friston, K. , Frackowiak, R. , … Frith, U. (1999). The neuroanatomy of autism: A voxel‐based whole brain analysis of structural scans. Neuroreport, 10, 1647–1651. [DOI] [PubMed] [Google Scholar]
- Abivardi, A. , & Bach, D. R. (2017). Deconstructing white matter connectivity of human amygdala nuclei with thalamus and cortex subdivisions in vivo . Human Brain Mapping, 38, 3927–3940. [DOI] [PMC free article] [PubMed] [Google Scholar]
- Adhikari, A. , Lerner, T. N. , Finkelstein, J. , Pak, S. , Jennings, J. H. , Davidson, T. J. , … Deisseroth, K. (2015). Basomedial amygdala mediates top‐down control of anxiety and fear. Nature, 527, 179–185. [DOI] [PMC free article] [PubMed] [Google Scholar]
- Adolphs, R. , Tranel, D. , Damasio, H. , & Damasio, A. (1994). Impaired recognition of emotion in facial expressions following bilateral damage to the human amygdala. Nature, 372, 669–672. [DOI] [PubMed] [Google Scholar]
- Amunts, K. , Kedo, O. , Kindler, M. , Pieperhoff, P. , Mohlberg, H. , Shah, N. J. , … Zilles, K. (2005). Cytoarchitectonic mapping of the human amygdala, hippocampal region and entorhinal cortex: Intersubject variability and probability maps. Anatomy & Embryology, 210, 343–352. [DOI] [PubMed] [Google Scholar]
- Bach, D. R. , Behrens, T. E. , Garrido, L. , Weiskopf, N. , & Dolan, R. J. (2011). Deep and superficial amygdala nuclei projections revealed in vivo by probabilistic tractography. The Journal of Neuroscience: The Official Journal of the Society for Neuroscience, 31, 618–623. [DOI] [PMC free article] [PubMed] [Google Scholar]
- Barnea‐Goraly, N. , Frazier, T. W. , Piacenza, L. , Minshew, N. J. , Keshavan, M. S. , Reiss, A. L. , & Hardan, A. Y. (2014). A preliminary longitudinal volumetric MRI study of amygdala and hippocampal volumes in autism. Progress in Neuro‐Psychopharmacology & Biological Psychiatry, 48, 124–128. [DOI] [PMC free article] [PubMed] [Google Scholar]
- Baron‐Cohen, S. , Jolliffe, T. , Mortimore, C. , & Robertson, M. (1997). Another advanced test of theory of mind: Evidence from very high functioning adults with autism or Asperger syndrome. Journal of Child Psychology & Psychiatry, and Allied Disciplines, 38, 813–822. [DOI] [PubMed] [Google Scholar]
- Baron‐Cohen, S. , Ring, H. A. , Bullmore, E. T. , Wheelwright, S. , Ashwin, C. , & Williams, S. C. (2000). The amygdala theory of autism. Neuroscience & Biobehavioural Reviews, 24, 355–364. [DOI] [PubMed] [Google Scholar]
- Baron‐Cohen, S. , Ring, H. A. , Wheelwright, S. , Bullmore, E. T. , Brammer, M. J. , Simmons, A. , & Williams, S. C. (1999). Social intelligence in the normal and autistic brain: An fMRI study. The European Journal of Neuroscience, 11, 1891–1898. [DOI] [PubMed] [Google Scholar]
- Baron‐Cohen, S. , Wheelwright, S. , Hill, J. , Raste, Y. , & Plumb, I. (2001a). The “Reading the Mind in the Eyes” test revised version: A study with normal adults, and adults with Asperger syndrome or high‐functioning autism. Journal of Child Psychology & Psychiatry, & Allied Disciplines, 42, 241–251. [PubMed] [Google Scholar]
- Baron‐Cohen, S. , Wheelwright, S. , Skinner, R. , Martin, J. , & Clubley, E. (2001b). The autism‐spectrum quotient (AQ): Evidence from Asperger syndrome/high‐functioning autism, males and females, scientists and mathematicians. Journal of Autism & Developmental Disorders, 31, 5–17. [DOI] [PubMed] [Google Scholar]
- Basser, P. J. , & Pierpaoli, C. (1996). Microstructural and physiological features of tissues elucidated by quantitative‐diffusion‐tensor MRI. Journal of Magnetic Resonance (San Diego, California: 1997), 213, 560–570. [DOI] [PubMed] [Google Scholar]
- Bauman, M. L. , & Kemper, T. L. (1994). Neuroanatomic observations of the brain in autism In Bauman M., Kemper T. L. (Eds.) The neurobiology of autism (pp. 119–145). Baltimore: Johns Hopkins University Press. [Google Scholar]
- Bauman, M. L. , & Kemper, T. L. (2005). Neuroanatomic observations of the brain in autism: A review and future directions. International Journal of Developmental Neuroscience: The Official Journal of the International Society for Developmental Neuroscience, 23, 183–187. [DOI] [PubMed] [Google Scholar]
- Beaulieu, C. (2002). The basis of anisotropic water diffusion in the nervous system: A technical review. NMRi in Biomedicine, 15, 435–455. [DOI] [PubMed] [Google Scholar]
- Behrens, T. E. J. , Berg, H. J. , Jbabdi, S. , Rushworth, M. F. S. , & Woolrich, M. W. (2007). Probabilistic diffusion tractography with multiple fibre orientations: What can we gain? Neuroimage, 34, 144–155. [DOI] [PMC free article] [PubMed] [Google Scholar]
- Behrens, T. E. J. , Johansen‐Berg, H. , Woolrich, M. W. , Smith, S. M. , Wheeler‐Kingshott, C. A. M. , Boulby, P. A. , … Matthews, P. M. (2003). Non‐invasive mapping of connections between human thalamus and cortex using diffusion imaging. Nature Neuroscience, 6, 750–757. [DOI] [PubMed] [Google Scholar]
- Bzdok, D. , Laird, A. R. , Zilles, K. , Fox, P. T. , & Eickhoff, S. B. (2013). An investigation of the structural, connectional, and functional subspecialization in the human amygdala. Human Brain Mapping, 34, 3247–3266. [DOI] [PMC free article] [PubMed] [Google Scholar]
- Catani, M. , Jones, D. K. , Donato, R. , & Ffytche, D. (2003). Occipito‐temporal connections in the human brain. Brain: A Journal of Neurology, 126, 2093–2107. [DOI] [PubMed] [Google Scholar]
- Cheng, Y. , Chou, K. , Chen, I. , Fan, Y. , Decety, J. , & Lin, C. (2010). Atypical development of white matter microstructure in adolescents with autism spectrum disorders. Neuroimage, 50, 873–882. [DOI] [PubMed] [Google Scholar]
- Cheung, C. , Chua, S. E. , Cheung, V. , Khong, P. L. , Tai, K. S. , Wong, T. K. W. , … McAlonan, G. M. (2009). White matter fractional anisotrophy differences and correlates of diagnostic symptoms in autism. Journal of Child Psychology & Psychiatry, 50, 1102–1112. [DOI] [PubMed] [Google Scholar]
- Clayden, J. D. , Muñoz Maniega, S. , Storkey, A. J. , King, M. D. , Bastin, M. E. , & Clark, C. A. (2011). TractoR: Magnetic resonance imaging and tractography with R. Journal of Statistical Software, 44, 1–18. [Google Scholar]
- Conturo, T. E. , Williams, D. E. , Smith, C. D. , Gultepe, E. , Akbudak, E. , & Minshew, N. J. (2008). Neuronal fiber pathway abnormalities in autism: An initial MRI diffusion tensor tracking study of hippocampo‐fusiform and amygdalo‐fusiform pathways. Journal of the International Neuropsychological Society, 14, 933–946. [DOI] [PMC free article] [PubMed] [Google Scholar]
- Corbett, B. , Carmean, V. , Ravizza, S. , Wendelken, C. , Henry, M. , Carter, C. , Rivera, S. (2009). A functional and structural study of emotion and face processing in children with autism. Psychiatry Research, 173, 196–205. [DOI] [PMC free article] [PubMed] [Google Scholar]
- Craig, A. D. (2009). How do you feel‐now? The anterior insula and human awareness. Nature Reviews: Neuroscience, 10, 59–70. [DOI] [PubMed] [Google Scholar]
- Creswell, C. S. , & Skuse, D. H. (1999). Autism in association with Turner syndrome: Genetic implications for male vulnerability to pervasive developmental disorders. Neurocase, 5, 511–518. [Google Scholar]
- Dziobek, I. , Fleck, S. , Rogers, K. , Wolf, O. T. , & Convit, A. (2006). The “amygdala theory of autism” revisited : Linking structure to behaviour. Neuropsychologia, 44, 1891–1899. [DOI] [PubMed] [Google Scholar]
- Ecker, C. , Suckling, J. , Deoni, S. C. , Lombardo, M. V. , Bullmore, E. T. , Baron‐Cohen, S. , … Murphy, D. G. (2012). Brain anatomy and its relationship to behaviour in adults with autism spectrum disorder: A multicenter magnetic resonance imaging study. Archives of General Psychiatry, 69, 195–209. [DOI] [PubMed] [Google Scholar]
- van Erp, T. G. M. , Hibar, D. P. , Rasmussen, J. M. , Glahn, D. C. , Pearlson, G. D. , Andreassen, O. A. , … Turner, J. A. (2016). Subcortical brain volume abnormalities in 2028 individuals with schizophrenia and 2540 healthy controls via the ENIGMA consortium. Molecular Psychiatry, 21, 547–553. [DOI] [PMC free article] [PubMed] [Google Scholar]
- Fingher, N. , Dinstein, I. , Ben‐Shachar, M. , Haar, S. , Dale, A. , Eyler, L. , Pierce, K. , & Courchesne, E. (2017). Toddlers later diagnosed with autism exhibit multiple structural abnormalities in temporal corpus callosum fibers. Cortex, 97, 291–305. [DOI] [PMC free article] [PubMed] [Google Scholar]
- Fischl, B. (2004). Automatically parcellating the human cerebral cortex. Cerebral Cortex (New York, NY: 1991), 14, 11–22. [DOI] [PubMed] [Google Scholar]
- Fischl, B. , Sereno, M. I. , Tootell, R. B. , & Dale, A. M. (1999). High‐resolution intersubject averaging and a coordinate system for the cortical surface. Human Brain Mapping, 8, 272–284. [DOI] [PMC free article] [PubMed] [Google Scholar]
- Gibbard, C. R. , Ren, J. , Seunarine, K. K. , Clayden, J. D. , Skuse, D. H. , & Clark, C. A. (2013). White matter microstructure correlates with autism trait severity in a combined clinical‐control sample of high‐functioning adults. NeuroImage Clinics, 3, 106–114. [DOI] [PMC free article] [PubMed] [Google Scholar]
- Gläscher, J. , & Adolphs, R. (2003). Processing of the arousal of subliminal and supraliminal emotional stimuli by the human amygdala. The Journal of Neuroscience: The Official Journal of the Society for Neuroscience, 23, 10274–10282. [DOI] [PMC free article] [PubMed] [Google Scholar]
- Good, C. D. , Lawrence, K. , Thomas, N. S. , Price, C. J. , Ashburner, J. , Friston, K. J. , … Skuse, D. H. (2003). Dosage‐sensitive X‐linked locus influences the development of amygdala and orbitofrontal cortex, and fear recognition in humans. Brain, 126, 2431–2446. [DOI] [PubMed] [Google Scholar]
- Green, S. A. , Rudie, J. D. , Colich, N. L. , Wood, J. J. , Shirinyan, D. , Hernandez, L. , … Bookheimer, S. Y. (2013). Overreactive brain responses to sensory stimuli in youth with autism spectrum disorders. Journal of the American Academy of Child & Adolescent Psychiatry, 52, 1158–1172. [DOI] [PMC free article] [PubMed] [Google Scholar]
- Groen, W. , Teluij, M. , Buitelaar, J. , & Tendolkar, I. (2010). Amygdala and hippocampus enlargement during adolescence in autism. Journal of the American Academy of Child and Adolescent Psychiatry, 49, 552–560. [DOI] [PubMed] [Google Scholar]
- Haar, S. , Berman, S. , Behrmann, M. , & Dinstein, I. (2016). Anatomical abnormalities in autism? Cerebral Cortex (New York, NY, 1991), 26, 1440–1452. [DOI] [PubMed] [Google Scholar]
- Hazlett, H. C. , Poe, M. D. , Lightbody, A. A. , Gerig, G. , MacFall, J. R. , Ross, A. K. , … Piven, J. (2009). Teasing apart the heterogeneity of autism: Same behaviour, different brains in toddlers with fragile X syndrome and autism. Journal of Neurodevelopmental Disorders, 1, 81–90. [DOI] [PMC free article] [PubMed] [Google Scholar]
- Heimer, L. , de Olmos, J. S. , Alheid, G. F. , Pearson, J. , Sakamoto, N. , Shinoda, K. , … Switzer, R. C. (1999). The human basal forebrain. Part II. In: The Primate Nervous System, Part III, 57–226.
- Hoogman, M. , Bralten, J. , Hibar, D. P. , Mennes, M. , Zwiers, M. P. , Schweren, L. S. J. , … Franke, B. (2017). Subcortical brain volume differences in participants with attention deficit hyperactivity disorder in children and adults: A cross‐sectional mega‐analysis. The Lancet: Psychiatry, 4, 310–319. [DOI] [PMC free article] [PubMed] [Google Scholar]
- Howard, M. A. , Cowell, P. E. , Boucher, J. , Broks, P. , Mayes, A. , Farrant, A. , & Roberts, N. (2000). Convergent neuroanatomical and behavioural evidence of an amygdala hypothesis of autism. Neuroreport, 11, 2931–2935. [DOI] [PubMed] [Google Scholar]
- Jenkinson, M. , Bannister, P. , Brady, M. , & Smith, S. (2002). Improved optimization for the robust and accurate linear registration and motion correction of brain images. Neuroimage, 17, 825–841. [DOI] [PubMed] [Google Scholar]
- Johansen, J. P. , Hamanaka, H. , Monfils, M. H. , Behnia, R. , Deisseroth, K. , Blair, H. T. , & LeDoux, J. E. (2010). Optical activation of lateral amygdala pyramidal cells instructs associative fear learning. Proceedings of the National Academy of Sciences of the United States of America USA, 107, 12692–12697. [DOI] [PMC free article] [PubMed] [Google Scholar]
- Jou, R. J. , Mateljevic, N. , Kaiser, M. D. , Sugrue, D. R. , Volkmar, F. R. , & Pelphrey, K. A. (2011a). Structural neural phenotype of autism: Preliminary evidence from a diffusion tensor imaging study using tract‐based spatial statistics. American Journal of Neuroradiology, 32, 1607–1613. [DOI] [PMC free article] [PubMed] [Google Scholar]
- Jou, R. J. , Jackowski, A. P. , Papademetris, X. , Rajeevan, N. , Staib, L. H. , & Volkmar, F. R. (2011b). Diffusion tensor imaging in autism spectrum disorders: Preliminary evidence of abnormal neural connectivity. Australian & New Zealand Journal of Psychiatry, 45, 153–162. [DOI] [PMC free article] [PubMed] [Google Scholar]
- Kalin, N. H. , Shelton, S. E. , & Davidson, R. J. (2004). The role of the central nucleus of the amygdala in mediating fear and anxiety in the primate. The Journal of Neuroscience: The Official Journal of the Society for Neuroscience, 24, 5506–5515. [DOI] [PMC free article] [PubMed] [Google Scholar]
- Kana, R. K. , Libero, L. E. , Hu, C. P. , Deshpande, H. D. , & Colburn, J. S. (2014). Functional brain networks and white matter underlying theory‐of‐mind in autism. Social Cognitive & Affective Neuroscience, 9, 98–105. [DOI] [PMC free article] [PubMed] [Google Scholar]
- Kerestes, R. , Chase, H. W. , Phillips, M. L. , Ladouceur, C. D. , & Eickhoff, S. B. (2017). Multimodal evaluation of the amygdala's functional connectivity. Neuroimage, 148, 219–229. [DOI] [PMC free article] [PubMed] [Google Scholar]
- Kim, J. E. , Lyoo, I. K. , Estes, A. M. , Renshaw, P. F. , Shaw, D. W. , Friedman, S. D. , … Dager, S. R. (2010). Laterobasal amygdalar enlargement in 6‐ to 7‐year‐old children with autism spectrum disorder. Archives of General Psychiatry, 67, 1187–1197. [DOI] [PubMed] [Google Scholar]
- Koolschijn, P. C. M. P. , Caan, M. W. A. , Teeuw, J. , Olabarriaga, S. D. , & Geurts, H. M. (2016). Age‐related differences in autism: The case of white matter microstructure. Human Brain Mapping, 96, 82–96. [DOI] [PMC free article] [PubMed] [Google Scholar]
- LeDoux, J. (1998). Fear and the brain: Where have we been, and where are we going? Biological Psychiatry, 44, 1229–1238. [DOI] [PubMed] [Google Scholar]
- LeDoux, J. E. (1995). Emotion: Clues from the brain. Annual Review of Psychology, 46, 209–235. [DOI] [PubMed] [Google Scholar]
- Lord, C. , Rutter, M. , Goode, S. , Heemsbergen, J. , Jordan, H. , Mawhood, L. , & Schopler, E. (1989). Autism diagnostic observation schedule: A standardized observation of communicative and social behaviour. Journal of Autism & Developmental Disorders, 19, 185–212. [DOI] [PubMed] [Google Scholar]
- Mishra, A. , Rogers, B. P. , Chen, L. M. , & Gore, J. C. (2014). Functional connectivity‐based parcellation of amygdala using self‐organized mapping: A data driven approach. Human Brain Mapping, 35, 1247–1260. [DOI] [PMC free article] [PubMed] [Google Scholar]
- Mosconi, M. W. , Cody‐Hazlett, H. , Poe, M. D. , Gerig, G. , Gimpel‐Smith, R. , & Piven, J. (2009). Longitudinal study of amygdala volume and joint attention in 2‐ to 4‐year‐old children with autism. Archives of General Psychiatry, 66, 509–516. [DOI] [PMC free article] [PubMed] [Google Scholar]
- Murphy, C. M. , Deeley, Q. , Daly, E. M. , Ecker, C. , O'brien, F. M. , Hallahan, B. , … Murphy, D. G. (2012). Anatomy and aging of the amygdala and hippocampus in autism spectrum disorder: An in vivo magnetic resonance imaging study of Asperger syndrome. Autism Research, 5, 3–12. [DOI] [PubMed] [Google Scholar]
- Nacewicz, B. M. , Dalton, K. M. , Johnstone, T. , & Long, M. T. (2006). Amygdala volume and nonverbal social impairment in adolescent and adult males with autism. Archives of General Psychiatry, 63, 1417–1428. [DOI] [PMC free article] [PubMed] [Google Scholar]
- Nickel, K. , Tebartz van Elst, L. , Perlov, E. , Jitten‐Schachenmeier, R. , Beier, D. , Endres, D. , … Maier, S. (2017). Manual morphometry of hippocampus and amygdala in adults with attention‐deficit hyperactivity disorder. Psychiatry Research: Neuroimaging, 267, 32–35. [DOI] [PubMed] [Google Scholar]
- Nordahl, C. W. , Scholz, R. , Yang, X. , Buonocore, M. H. , Simon, T. , Rogers, S. , & Amaral, D. G. (2012). Increased rate of amygdala growth in children aged 2 to 4 years with autism spectrum disorders. Archives of General Psychiatry, 69, 53–61. [DOI] [PMC free article] [PubMed] [Google Scholar]
- Noriuchi, M. , Kikuchi, Y. , Yoshiura, T. , Kira, R. , Shigeto, H. , Hara, T. , … Kamio, Y. (2010). Altered white matter fractional anisotropy and social impairment in children with autism spectrum disorder. Brain Research, 1362, 141–149. [DOI] [PubMed] [Google Scholar]
- Novak, M. J. U. , Seunarine, K. K. , Gibbard, C. R. , Hobbs, N. Z. , Scahill, R. I. , Clark, C. A. , & Tabrizi, S. J. (2014). White matter integrity in premanifest and early Huntington's disease is related to caudate loss and disease progression. Cortex, 52, 98–112. [DOI] [PubMed] [Google Scholar]
- Palmen, S. , Durston, S. , Nederveen, H. , & van Engeland, H. (2006). No evidence for preferential involvement of medial temporal lobe structures in high‐functioning autism. Psychological Medicine, 36, 827–834. [DOI] [PubMed] [Google Scholar]
- Patenaude, B. , Smith, S. M. , Kennedy, D. N. , & Jenkinson, M. (2011). A Bayesian model of shape and appearance for subcortical brain segmentation. Neuroimage, 56, 907–922. [DOI] [PMC free article] [PubMed] [Google Scholar]
- Pierce, K. , Müller, R. A. , Ambrose, J. , Allen, G. , & Courchesne, E. (2001). Face processing occurs outside the fusiform “face area” in autism: Evidence from functional MRI. Brain: A Journal of Neurology, 124, 2059–2073. [DOI] [PubMed] [Google Scholar]
- Radua, J. , Via, E. , Catani, M. , & Mataix‐Cols, D. (2011). Voxel‐based meta‐analysis of regional white‐matter volume differences in autism spectrum disorder versus healthy controls. Psychological Medicine, 41, 1539–1550. [DOI] [PubMed] [Google Scholar]
- Rich, A. M. , Cho, Y. T. , Tang, Y. , Savic, A. , Krystal, J. H. , Wang, F. , … Anticevic, A. (2016). Amygdala volume is reduced in early course schizophrenia. Psychiatry Research, 250, 50–60. [DOI] [PMC free article] [PubMed] [Google Scholar]
- Rojas, D. C. , Smith, J. A. , Benkers, T. L. , Camou, S. L. , Reite, M. L. , & Rogers, S. J. (2004). Hippocampus and amygdala volumes in parents of children with autistic disorder. The American Journal of Psychiatry, 161, 2038–2044. [DOI] [PubMed] [Google Scholar]
- Saygin, Z. M. , Kliemann, D. , Iglesias, J. E. , van der Kouwe, A. J. W. , Boyd, E. , Reuter, M. , … Augustinack, J. C. (2017). High‐resolution magnetic resonance imaging reveals nuclei of the human amygdala: Manual segmentation to automatic atlas. Neuroimage, 155, 370–382. [DOI] [PMC free article] [PubMed] [Google Scholar]
- Saygin, Z. M. , Osher, D. E. , Augustinack, J. , Fischl, B. , & Gabrieli, J. D. E. (2011). Connectivity‐based segmentation of human amygdala nuclei using probabilistic tractography. Neuroimage, 56, 1353–1361. [DOI] [PMC free article] [PubMed] [Google Scholar]
- Schumann, C. M. , & Amaral, D. G. (2006). Stereological analysis of amygdala neuron number in autism. The Journal of Neuroscience: The Official Journal of the Society for Neuroscience, 26, 7674–7679. [DOI] [PMC free article] [PubMed] [Google Scholar]
- Schumann, C. M. , Barnes, C. C. , Lord, C. , & Courchesne, E. (2009). Amygdala enlargement in toddlers with autism related to severity of social and communication impairments. Biological Psychiatry, 66, 942–949. [DOI] [PMC free article] [PubMed] [Google Scholar]
- Schumann, C. M. , Hamstra, J. , Goodlin‐Jones, B. L. , Lotspeich, L. J. , Kwon, H. , Buonocore, M. H. , … Amaral, D. G. (2004). The amygdala is enlarged in children but not adolescents with autism; the hippocampus is enlarged at all ages. The Journal of Neuroscience: The Official Journal of the Society for Neuroscience, 24, 6392–6401. [DOI] [PMC free article] [PubMed] [Google Scholar]
- Shaw, P. , Lawrence, E. J. , Radbourne, C. , Bramham, J. , Polkey, C. E. , & David, A. S. (2004). The impact of early and late damage to the human amygdala on “theory of mind” reasoning. Brain: A Journal of Neurology, 127, 1535–1548. [DOI] [PubMed] [Google Scholar]
- Shou, X.‐J. , Xu, X.‐J. , Zeng, X.‐Z. , Liu, Y. , Yuan, H.‐S. , Xing, Y. , … Han, J.‐S. (2017). A volumetric and functional connectivity MRI study of brain arginine–vasopressin pathways in autistic children. Neuroscience Bulletin, 0, 1–13. [DOI] [PMC free article] [PubMed] [Google Scholar]
- Skuse, D. H. , Morris, J. S. , & Dolan, R. J. (2005). Functional dissociation of amygdala‐modulated arousal and cognitive appraisal, in Turner syndrome. Brain: A Journal of Neurology, 128, 2084–2096. [DOI] [PubMed] [Google Scholar]
- Skuse, D. H. , & Gallagher, L. (2009). Dopaminergic–neuropeptide interactions in the social brain. Trends in Cognitive Sciences, 13, 27–35. [DOI] [PubMed] [Google Scholar]
- Smith, S. M. , De Stefano, N. , Jenkinson, M. , & Matthews, P. M. (2001). Normalized accurate measurement of longitudinal brain change. Journal of Computer Assisted Tomography, 25, 466–475. [DOI] [PubMed] [Google Scholar]
- Smith, S. (2002). Fast robust automated brain extraction. Human Brain Mapping, 17, 143–155. [DOI] [PMC free article] [PubMed] [Google Scholar]
- Smith, S. , Jenkinson, M. , Woolrich, M. , Beckmann, C. , Behrens, T. , Johansen‐Berg, H. , … Matthews, P. (2004). Advances in functional and structural MR image analysis and implementation as FSL. Neuroimage, 23 Suppl 1, S208–S219. [DOI] [PubMed] [Google Scholar]
- Smith, S. , Zhang, Y. , Jenkinson, M. , Chen, J. , Matthews, P. , Federico, A. , & De Stefano, N. (2002). Accurate, robust, and automated longitudinal and cross‐sectional brain change analysis. Neuroimage, 17, 479–489. [DOI] [PubMed] [Google Scholar]
- Solso, S. , Xu, R. , Proudfoot, J. , Hagler, D. J. , Campbell, K. , Venkatraman, V. , … Courchesne, E. (2016). Diffusion tensor imaging provides evidence of possible axonal overconnectivity in frontal lobes in autism spectrum disorder toddlers. Biological Psychiatry, 79, 676–684. [DOI] [PMC free article] [PubMed] [Google Scholar]
- Sparks, B. F. , Friedman, S. D. , Shaw, D. W. , Aylward, E. H. , Echelard, D. , Artru, A. A. , … Dager, S. R. (2002). Brain structural abnormalities in young children with autism spectrum disorder. Neurology, 59, 184–192. [DOI] [PubMed] [Google Scholar]
- Stefanacci, L. , & Amaral, D. G. (2000). Topographic organization of cortical inputs to the lateral nucleus of the macaque monkey amygdala : A retrograde tracing study. The Journal of Comparative Neurology, 421, 52–79. [DOI] [PubMed] [Google Scholar]
- Tyszka, J. M. , & Pauli, W. M. (2016). In vivo delineation of subdivisions of the human amygdaloid complex in a high‐resolution group template. Human Brain Mapping, 37, 3979–3998. [DOI] [PMC free article] [PubMed] [Google Scholar]
- Wang, R. , & Wedeen, V. J. (2007). http://TrackVis.org. Martinos Center for Biomedical Imaging, Massachusetts General Hospital.
- Wechsler, D. (1999). Wechsler abbreviated scale of intelligence (WASI) manual. San Antonio, TX: The Psychological Corporation. [Google Scholar]
- Wegiel, J. , Flory, M. , Kuchna, I. , Nowicki, K. , Ma, S. Y. , Imaki, H. , … Brown, W. T. (2014). Stereological study of the neuronal number and volume of 38 brain subdivisions of subjects diagnosed with autism reveals significant alterations restricted to the striatum, amygdala and cerebellum. Acta Neuropathologica Communications, 2, 141. [DOI] [PMC free article] [PubMed] [Google Scholar]
- World Health Organization (1994). International classification of diseases: ICD‐10 (10th ed.). Geneva, Switzerland: World Health Organization; Vol. 2. [Google Scholar]
- Yang, Y. , Fan, L. , Chu, C. , Zhuo, J. , Wang, J. , Fox, P. T. , … Jiang, T. (2016). Identifying functional subdivisions in the human brain using meta‐analytic activation modeling‐based parcellation. Neuroimage, 1, 300–309. [DOI] [PMC free article] [PubMed] [Google Scholar]