Abstract
Luminal fluid reabsorption plays a fundamental role in male fertility. We demonstrated that the ubiquitous GPCR signaling proteins Gq and β-arrestin-1 are essential for fluid reabsorption because they mediate coupling between an orphan receptor ADGRG2 (GPR64) and the ion channel CFTR. A reduction in protein level or deficiency of ADGRG2, Gq or β-arrestin-1 in a mouse model led to an imbalance in pH homeostasis in the efferent ductules due to decreased constitutive CFTR currents. Efferent ductule dysfunction was rescued by the specific activation of another GPCR, AGTR2. Further mechanistic analysis revealed that β-arrestin-1 acts as a scaffold for ADGRG2/CFTR complex formation in apical membranes, whereas specific residues of ADGRG2 confer coupling specificity for different G protein subtypes, this specificity is critical for male fertility. Therefore, manipulation of the signaling components of the ADGRG2-Gq/β-arrestin-1/CFTR complex by small molecules may be an effective therapeutic strategy for male infertility.
Research organism: Mouse
Introduction
Male infertility is transforming from a personal issue to a public health problem because approximately 15% of reproductive-age couples are infertile, and male infertility accounts for approximately 50% of this sterility (Hamada et al., 2012; Jodar et al., 2015). The unique structure of the male reproductive system increases the difficulty of determining the working mechanisms. Among male reproductive system, the efferent ductules of the male testis play important roles during sperm transportation and maturation by reabsorbing the fluid of the rete testis and maintaining the homeostasis of water and ion metabolism (Hess et al., 1997). Whereas a dysfunction of the efferent ductule reabsorption capacity caused by a developmental defect that produces improper signaling results in epididymal obstructions and abnormal spermiostasis, which ultimately lead to infertility in both humans and other mammals (Hendry et al., 1990; Nistal et al., 1999), manipulating the reabsorption function in the efferent ductules could be developed into a useful contraceptive method for males (Gottwald et al., 2006).
Receptors play key roles in the regulation of fluid reabsorption in tissues such as the proximal tubules and alveoli (Haithcock et al., 1999; Thomson et al., 2006). In contrast, only a few receptor functions in the efferent ductules have been characterized. Nuclear estrogen receptor α (ERα) must be activated for male reproductive tract development and reabsorption function maintenance to occur (Hess et al., 1997). However, the mechanism by which fluid reabsorption is regulated by cell surface receptors in the efferent ductules is only beginning to be appreciated (Shum et al., 2008). Knockout of an orphan G-protein-coupled receptor (GPCR), ADGRG2 (adhesion G-protein-coupled receptor G2), results in male infertility due to dysregulated fluid reabsorption in the efferent ductules, suggesting an active role for this cell surface receptor in regulating these processes (Davies et al., 2004). However, how ADGRG2 regulates water-ion homeostasis and fluid reabsorption remains elusive.
ADGRG2 belongs to the seven transmembrane receptor superfamily (Hamann et al., 2015), which regulates approximately 80% of signal transduction across the plasma membrane and accounts for 30% of current clinical prescription drug targets. Five different types of G proteins and arrestins act as signaling hubs downstream of these GPCRs, mediating most of their functions (Alvarez-Curto et al., 2016; Cahill et al., 2017; Dong et al., 2017; Li et al., 2018; Liu et al., 2017; Nuber et al., 2016; Thomsen et al., 2016; Yang et al., 2015). In the efferent ductules, it remains unclear how G proteins and their parallel signaling molecules, the arrestins, regulate reabsorption as well as fertility.
Here, we developed a new labeling method utilizing specific red fluorescent protein (RFP) expression driven by the ADGRG2 promoter, which enabled a detailed mechanistic study of efferent ductule functions. By exploiting Adgrg2-/Y, Gnaq+/-, Arrb1-/- and Arrb2-/- knockout mouse models, together with the combination of pharmacological interventions and electrophysiological approaches, we have identified the importance of the ubiquitous Gq protein and β-arrestin-1, which confer the ADGRG2 constitutive activity to a basic cystic fibrosis transmembrane conductance regulator (CFTR) current, in fluid reabsorption in the efferent ductules. Both specific Gq activity- and β-arrestin-1 scaffolding-mediated ADGRG2/CFTR coupling are required for male fertility and Cl-/acid-base homeostasis in the efferent ductules. Our results not only reveal how fluid reabsorption in the male efferent ductules is precisely controlled by a specific subcellular signaling compartment encompassing ADGRG2, CFTR, β-arrestin-1 and Gq in non-ciliated cells but also provide a foundation for the development of new therapeutic approaches to control male fertility.
Results
Gq activity is required for fluid reabsorption and male fertility
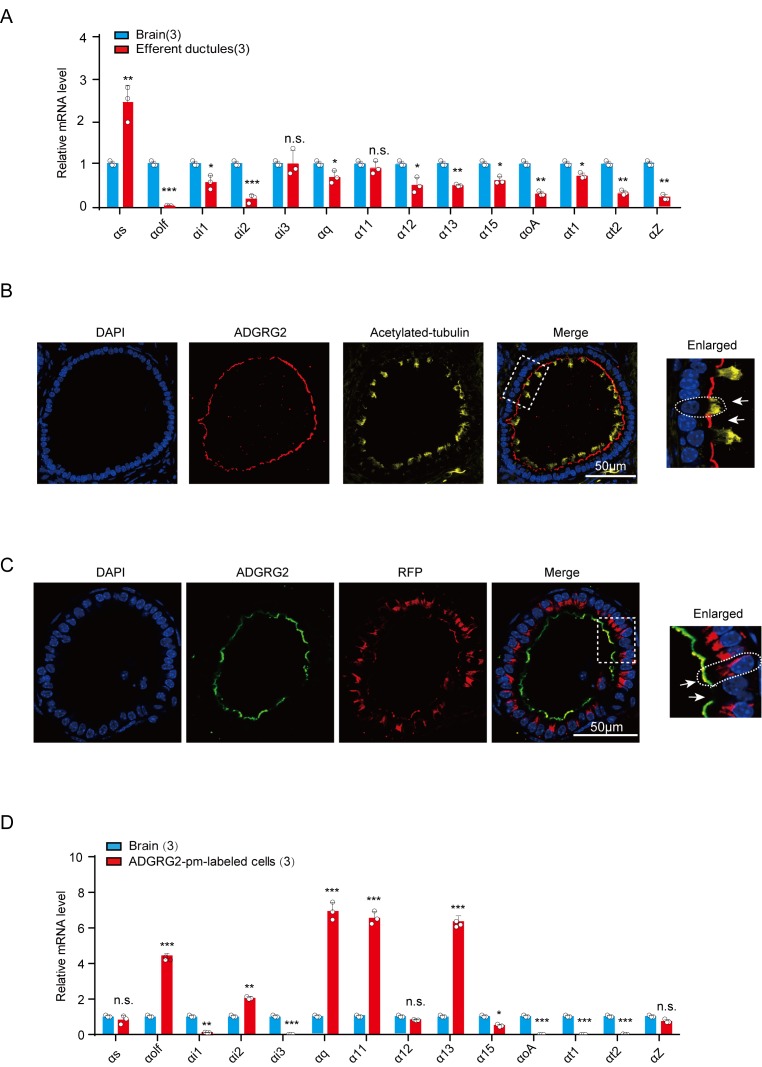
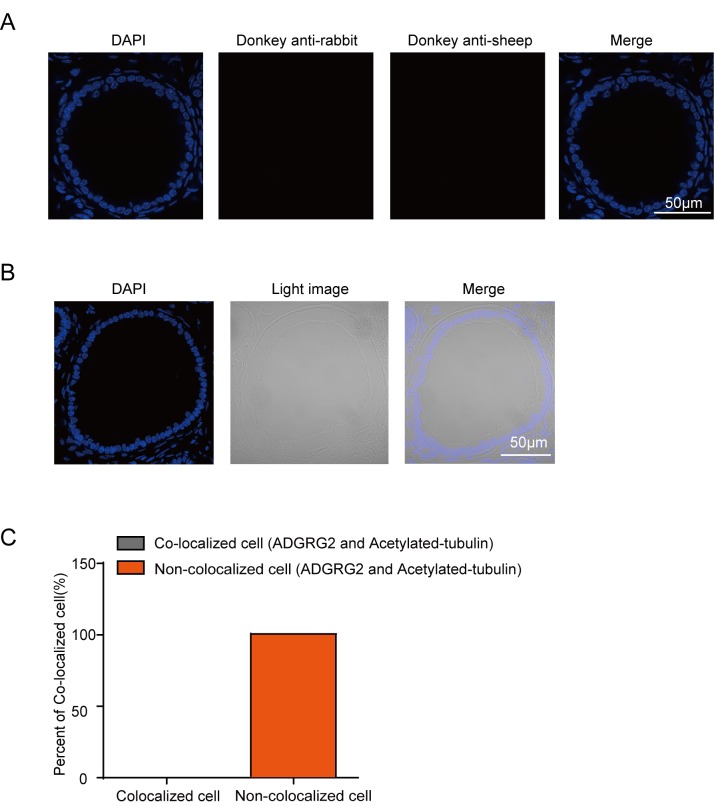
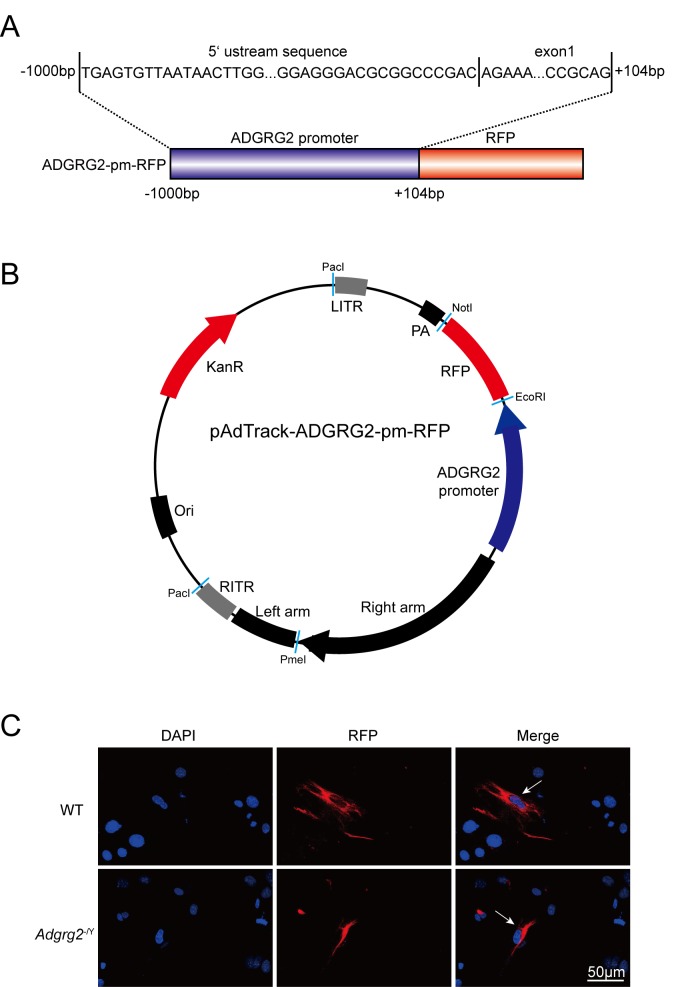
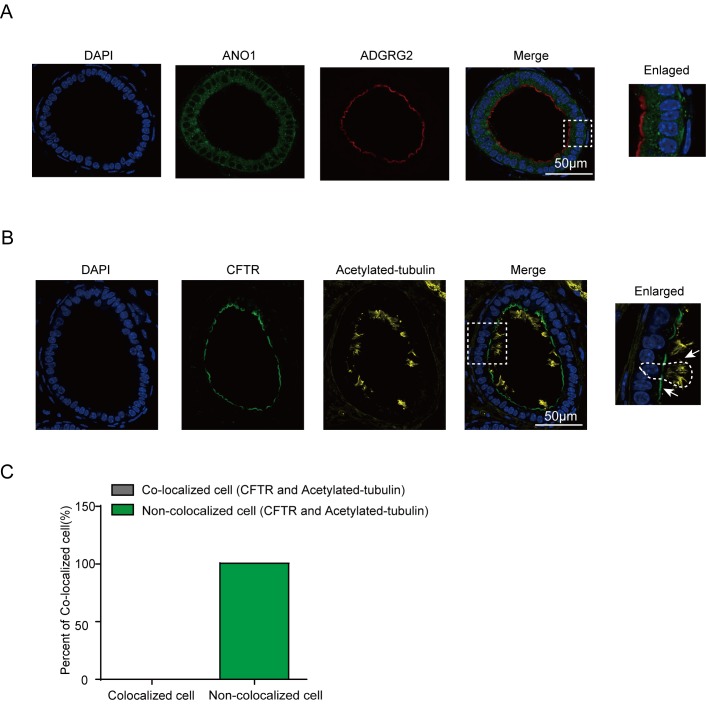
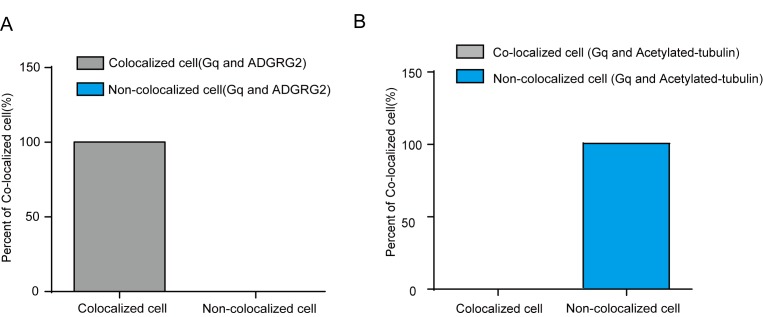
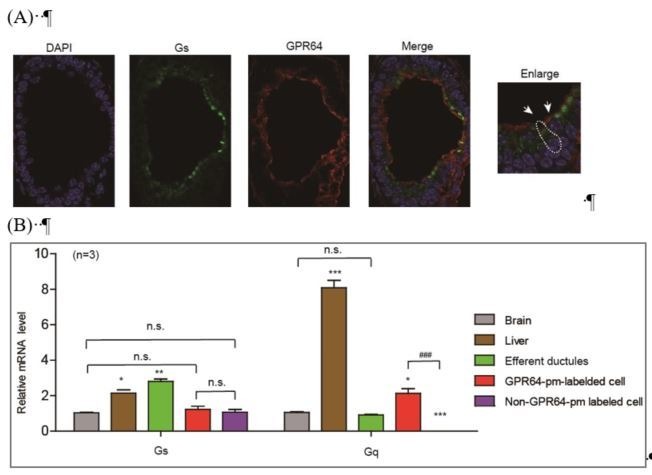
Previous studies have found that knockout of the orphan receptor ADGRG2 causes infertility and fluid reabsorption dysfunction in the efferent ductules, indicating important roles for GPCR signaling in male reproductive functions. Downstream of GPCRs, there are 16 Gα proteins that mediate diverse GPCR functions (DeVree et al., 2016). However, the expression of these G protein subtypes and their functions in the efferent ductules have not been investigated. Here, we show that Gs is more enriched, while G11 and Gi3 have expression levels in the efferent ductules similar to those in brain tissue, whereas all other 11 tested G protein subtypes have detectable expression levels in the efferent ductules (Figure 1A). ADGRG2 localizes in cells devoid of acetylated-tubulin staining, suggesting that it is specifically expressed in non-ciliated cells (Figure 1B and Figure 1—figure supplement 1A–C). We next used the promoter region of ADGRG2 to direct the expression of the fluorescent protein RFP, which enabled the specific labeling of ADGRG2-expressing non-ciliated cells in the efferent ductules (Figure 1C and Figure 1—figure supplement 2A–C). After fluorescence-activated cell sorting (FACS), quantitative RT-PCR (qRT-PCR) results indicated that ADGRG2-expressing non-ciliated cells have expression levels of Golf, Gi2, Gq, G11, and G13 that are higher than those in brain tissue and expression levels of Gs, G12 and Gz that are similar to those in brain tissue (Figure 1D).
Figure 1. The expression of G protein subtypes in the efferent ductules and ADGRG2 promoter-labeled non-ciliated cells.
(A) qRT-PCR analysis of mRNA transcription profiles of G proteins in brain tissues and the efferent ductules of WT (n = 3) male mice. Expression levels were normalized to GAPDH levels. *p<0.05, **p<0.01, ***p<0.001, efferent ductules compared with brain tissue. (B) Co-localization analysis of ADGRG2 (red fluorescence) and acetylated-tubulin (green fluorescence) in the efferent ductules of WT mice. Scale bars, 50 μm. (C) Co-localization of ADGRG2 (green fluorescence) and RFP (red fluorescence) in the same cells of male murine efferent ductules infected with the ADGRG2 promoter RFP adenovirus in WT mice. Scale bars, 50 μm. (D) qRT-PCR analysis of mRNA transcription profiles of G protein subtypes in brain tissues and isolated ADGRG2 promoter-labeled non-ciliated cells derived from the efferent ductules of WT (n = 3) male mice. Expression levels were normalized to GAPDH levels. *p<0.05, **p<0.01, ***p<0.001, ADGRG2 promoter-labeled efferent ductule cells compared with brain tissues. n.s., no significant difference. At least three independent biological replicates were performed for Figure 1A and D.
Figure 1—figure supplement 1. ADGRG2 is specifically expressed in non-ciliated cells.
Figure 1—figure supplement 2. The construction of the mouse ADGRG2-promoter-RFP used in the labeling of ADGRG2-expressed cells.
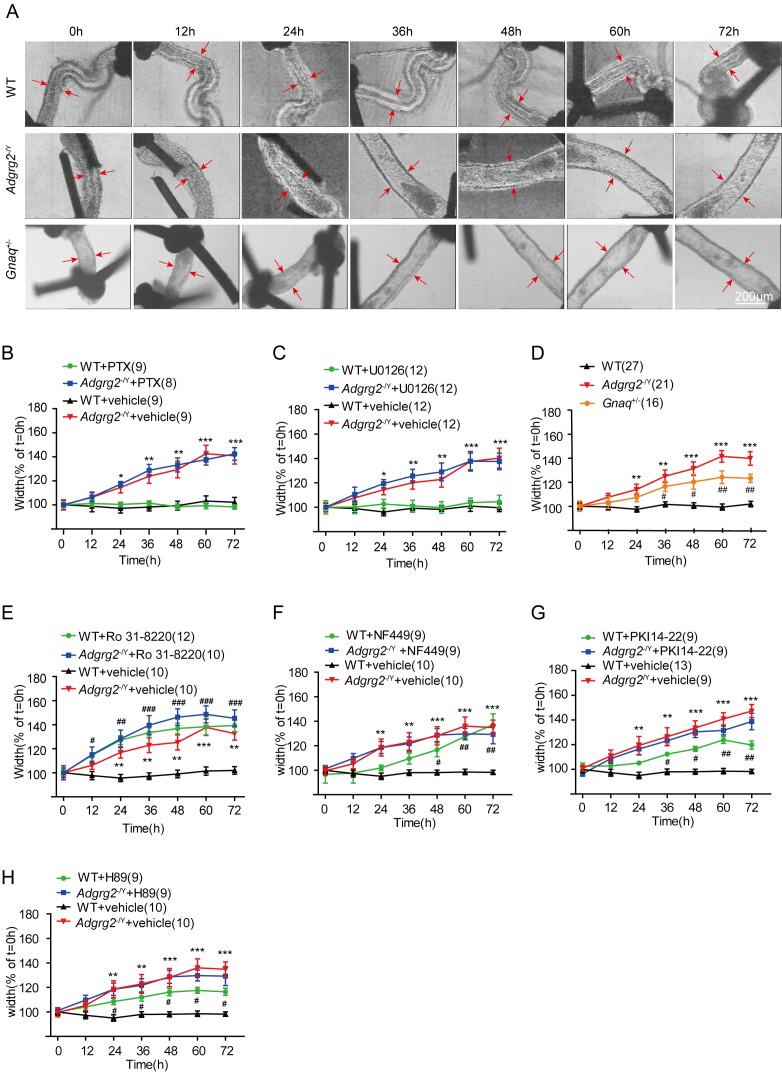
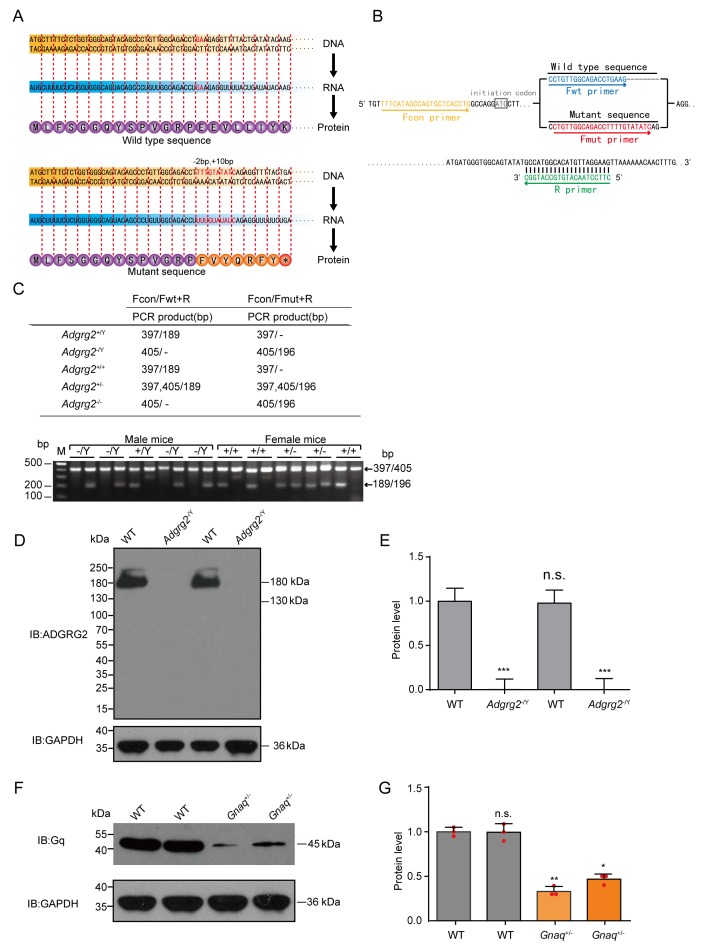
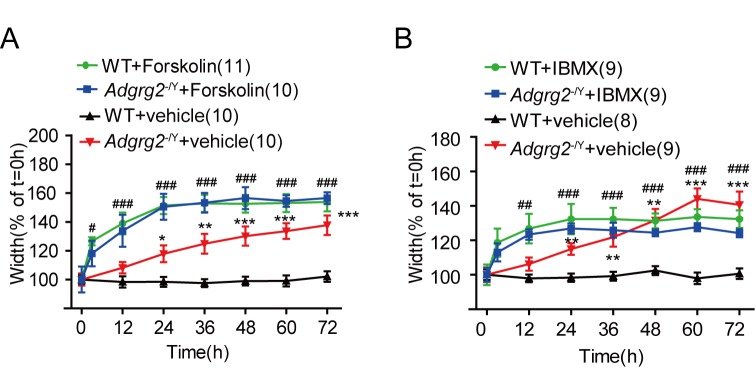
We next investigated the contribution of different G protein subtype signaling pathways to fluid reabsorption in the efferent ductules using specific pharmacological interventions and knockout models. An ADGRG2 knockout mouse was produced by introducing an 11-nucleotide sequence into the first exon of the ADGRG2 gene (Figure 2—figure supplement 1), thereby creating a positive control for fluid reabsorption dysfunction in the efferent ductules (Davies et al., 2004). The wild-type (WT) mice did not show size alterations due to the normal reabsorption of luminal fluid, but the ligated efferent ductules derived from the ADGRG2 knockout mice displayed a 40% increase in luminal area after 72 hr of in vitro culture (Figure 2A). Application of the Gi inhibitor pertussis toxin (PTX) or the MEK-ERK signaling inhibitor U0126 did not have a significant effect on the efferent ductules (Figure 2B and C). In contrast, a 50% reduction in Gq protein levels in Gnaq+/- mice or the application of the protein kinase C(PKC) inhibitor Ro 31–8220 significantly impaired fluid reabsorption in the efferent ductules, which mimicked the phenotype of the ductules derived from Adgrg2-/Y mice (Figure 2A and D–E and Figure 2—figure supplement 1F–G). The contribution of Gs-PKA (protein kinase A) signaling to fluid reabsorption of the efferent ductules is confounded. While the application of the Gs inhibitor NF449 or the PKA inhibitors PKI14-22 or H89 to the efferent ductules derived from WT mice slightly increased the volume of the efferent ductules (Figure 2F–H), cAMP regulators, such as the adenyl cyclase activator forskolin (FSK) and the phosphodiesterase (PDE) inhibitor 3-isobutyl-1-methylxanthine(IBMX), increased the volume of the efferent ductules in an acute manner in both Adgrg2-/Y mice and WT littermates (Figure 2—figure supplement 2A–B). These results suggested that Gs-PKA signaling is finely tuned in the efferent ductules to maintain its fluid reabsorption function because both increasing and decreasing its activity caused detrimental effects. In conclusion, Gi and MEK-ERK signaling exerted no significant effects, whereas Gq-PKC signaling was required for efficient fluid reabsorption in the efferent ductules.
Figure 2. Gq activity is required for fluid reabsorption.
(A) Images of cultured ligated efferent ductules derived from WT male mice, Adgrg2-/Y mice and Gnaq+/- male mice. Ductule segments were selected by examination of the ciliary beat, which is a marker of cell integrity. Ductule pieces from Adgrg2-/Y, Gnaq+/- or WT mice were ligated, microdissected and cultured for up to 72 hr. Scale bars, 200 μm. (B–C, E–H) Effects of pharmacological intervention on the diameters of ligated efferent ductules derived from WT or Adgrg2-/Y mice. (B) PTX (100 ng/ml), a Gi inhibitory protein. WT (n = 9) or Adgrg2-/Y (n = 8); (C) U0126 (10 μM), a MEK inhibitor (ERK pathway blockade), WT (n = 12) or Adgrg2-/Y (n = 12). (E) Ro 31–8220 (500 nM), a protein kinase C (PKC) inhibitor, WT (n = 12) or Adgrg2-/Y (n = 10); (F) NF449 (1 μM), a Gs inhibitor, WT (n = 9) or Adgrg2-/Y (n = 9); (G) PKI14-22 (300 nM), a PKA inhibitor, WT (n = 9) or Adgrg2-/Y (n = 9); (H) H89 (500 nM), a non-selective PKA inhibitor, WT (n = 9) or Adgrg2-/Y (n = 9). (D) Diameters of the luminal ductules derived from WT (n = 27) mice remained unchanged over 72 hr, whereas the lumens of the ductules derived from Adgrg2-/Y (n = 21) mice and Gnaq+/- (n = 16) mice were significantly increased, indicating fluid reabsorption dysfunction. (2B-2H) *p<0.05, **p<0.01, ***p<0.001, Adgrg2-/Y mice or Gnaq+/- mice were compared with WT mice. #p<0.05, ##p<0.01, ###p<0.001, treatment with selective inhibitors or stimulators was compared with control vehicles. n.s., no significant difference. At least three independent biological replicates were performed for Figure 2B–H.
Figure 2—figure supplement 1. The ADGRG2 protein knockout strategy, PCR strategy and western blot results of Adgrg2-/Y and Gnaq+/- mice.
Figure 2—figure supplement 2. Effects of Forskolin and IBMX on the diameters of ligated efferent ductules derived from WT or Adgrg2-/Y mice.
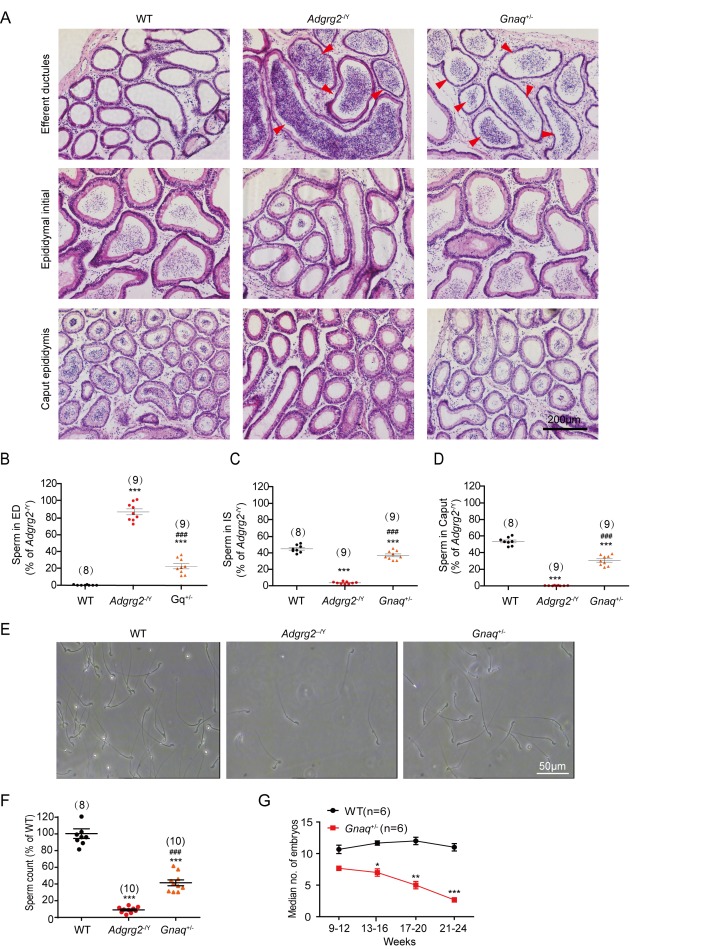
The efferent ductules of the Gnaq+/- animals consistently showed the accumulation of obstructed spermatozoa compared with those of WT mice, whereas the lumen of the initial segment and caput region in Gnaq+/- mice contained significantly reduced sperm levels (Figure 3A–D). Sperm numbers prepared from the caudal epididymis and the birth rate of the Gnaq+/- mice were also significantly decreased compared with their WT littermates (Figure 3E–G). Taken together, these data demonstrated that among different G protein subtypes, Gq activity is required for fluid reabsorption and male fertility.
Figure 3. Gq expression is required for sperm transportation and male fertility.
(A) Representative hematoxylin and eosin staining of WT, Adgrg2-/Y or Gnaq+/- mice. Scale bars, 200 μm. (B–D) Corresponding bar graphs demonstrating the accumulation of spermatozoa according to the hematoxylin and eosin staining of WT (n = 8), Adgrg2-/Y (n = 9) or Gnaq+/- (n = 9) mice. ED: efferent ductules; IS: epididymal initial segment; CA: caput epididymis. (E) Representative photographs of caudal sperm preparation from the caudal epididymis of WT, Adgrg2-/Y or Gnaq+/- mice. Scale bars, 50 μm. (F) Bar graph depicting the quantitative analysis of the number of sperm shown in (Figure 1E) of WT (n = 8), Adgrg2-/Y (n = 10) or Gnaq+/- (n = 10) mice. (G) Line graph depicting the fertility of Gnaq+/- (n = 6) and WT (n = 6) male mice at various ages, as measured by the median number of embryos. (3B-D and 3 F-G): *p<0.05, **p<0.01, ***p<0.001, Adgrg2-/Y mice or Gnaq+/- mice were compared with WT mice. #p<0.05, ##p<0.01, ###p<0.001. Gnaq+/- mice were compared with Adgrg2-/Y mice. n.s., no significant difference. At least three independent biological replicates were performed for Figure 3B–D and and F–G.
ADGRG2 and CFTR coupling in the efferent ductules and its function in fluid reabsorption
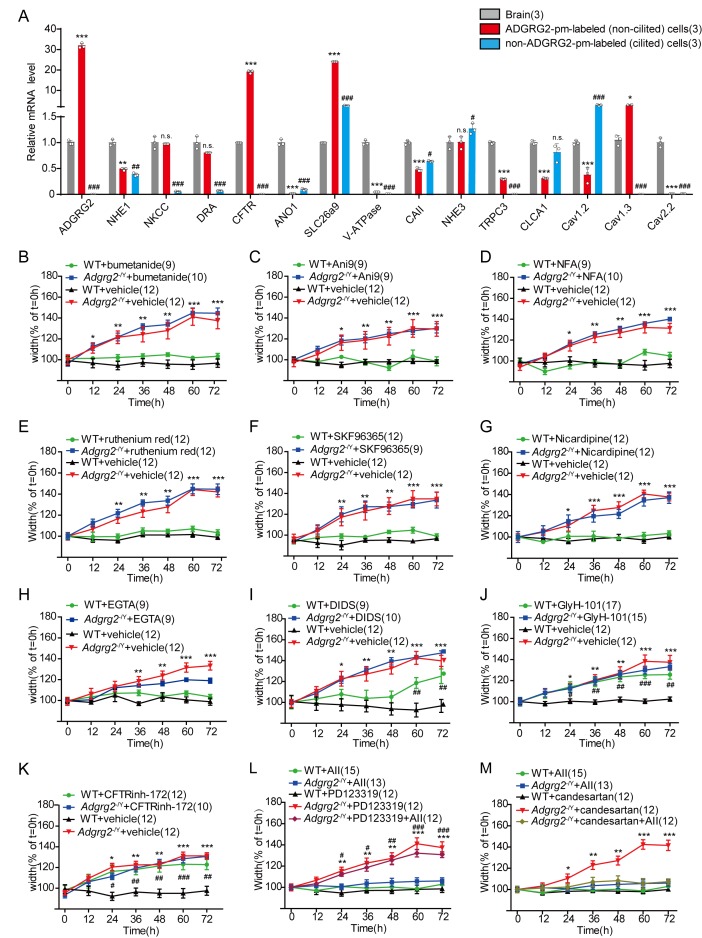
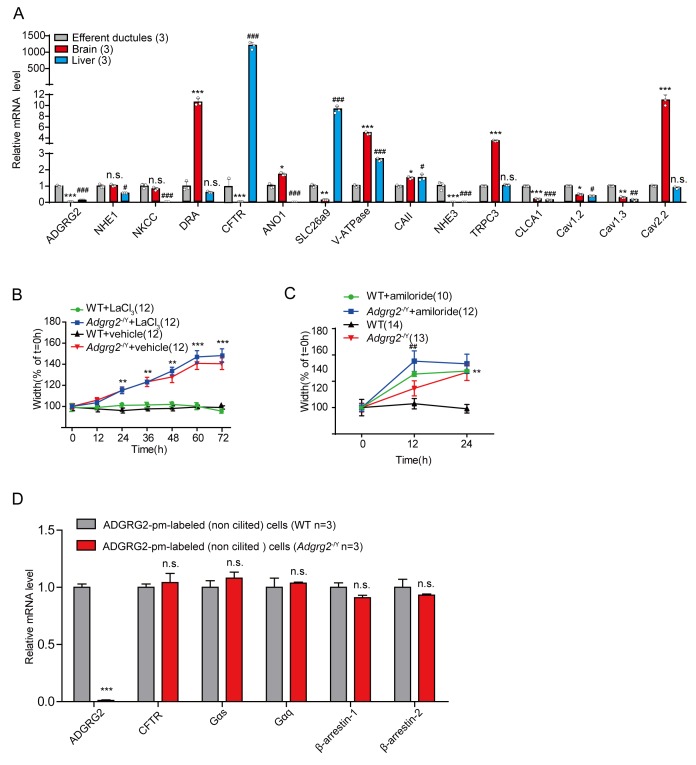
Membrane proteins, including bicarbonate and chloride transporters, sodium/potassium pumps and specific ion channels, are potential osmotic drivers for fluid secretion and reabsorption in the efferent ductules (Estévez et al., 2001; Harvey, 1992; Liu et al., 2015; Park et al., 2001; Russell, 2000; Xiao et al., 2012; Xiao et al., 2011; Zhou et al., 2001). Therefore, we examined the expression levels of these membrane proteins in the efferent ductules and ADGRG2 promoter-labeled ductule cells (Figure 4A and Figure 4—figure supplement 1A). Specifically, Na+-K+-Cl- cotransporter (NKCC), down-regulated in adenoma (DRA), CFTR, solute carrier family 26 member 9(SLC26a9), Na+/H+ exchanger 3(NHE3) and the L-type voltage dependent calcium channel Cav1.3 levels were readily measured in ADGRG2 promoter-labeled non-ciliated ductule cells; Na+/H+ exchanger 1(NHE1), carbonic anhydrase II(CAII), Short transient receptor potential channel 3(TRPC3), chloride channel accessory 1(CLCA1) and Cav1.2 had lower but detectable expression levels, whereas anoctamin-1 (ANO1), V-ATPase and Cav2.2 demonstrated very little expression (Figure 4A and Figure 4—figure supplement 1A). Notably, we used the ADGRG2 promoter to label the non-ciliated cells, as the ADGRG2 receptor is specifically expressed on the apical membrane of these cells in efferent ductules (Figure 1B–C and Figure 1—figure supplements 1–2). A higher expression level of a particular membrane protein, such as CFTR, in the ADGRG2 promoter-labeled cells indicated that these membrane proteins are enriched in non-ciliated cells in efferent ductules but does not indicate that the expression of these proteins is dependent on ADGRG2. For example, the CFTR expression level in ADGRG2 promoter-labeled efferent ductule cells derived from Adgrg2-/Y mice did not differ significantly from that in the cells derived from their WT littermates (Figure 4—figure supplement 1D).
Figure 4. Inhibition of CFTR activity in the efferent ductules pheno-copied the activity in Adgrg2-/Y mice.
(A) qRT-PCR analysis of the mRNA transcription profiles of potential osmotic drivers including selective ion channels and transporters in ADGRG2 promoter-labeled cells, non-ADGRG2 promoter-labeled cells and brain tissues of WT (n = 3) male mice. Expression levels were normalized to GAPDH levels. *p<0.05, **p<0.01, ***p<0.001, ADGRG2 promoter-labeled cells were compared with brain tissues. #p<0.05, ##p<0.01, ###p<0.001, non-ADGRG2 promoter-labeled cells were compared with brain tissues. (B–M) Effects of different channel blockers on the diameters of luminal ductules derived from WT or Adgrg2-/Y mice. (B) Bumetanide (10 μM), an NKCC blocker, WT (n = 9) or Adgrg2-/Y (n = 10); (C) Ani9 (150 nM), an ANO1 inhibitor, WT (n = 9) or Adgrg2-/Y (n = 9); (D) NFA (20 μM), a CaCC inhibitor, WT (n = 9) or Adgrg2-/Y (n = 10); (E) ruthenium red (10 μM), a non-specific TRP channel blocker, WT (n = 12) or Adgrg2-/Y (n = 12); (F) SKF96365 (10 μM), a TRPC channel inhibitor, WT (n = 12) or Adgrg2-/Y (n = 9); (G) nicardipine (20 μM), an L-type calcium channel blocker, WT (n = 12) or Adgrg2-/Y (n = 12); (H) EGTA (5 mM), an extracellular calcium chelator, WT (n = 9) or Adgrg2-/Y (n = 9); (I) DIDS (20 μM), a chloride-bicarbonate exchanger blocker, WT (n = 9) or Adgrg2-/Y (n = 10); (J) GlyH-101 (25 μM), a non-specific CFTR inhibitor, WT (n = 17) or Adgrg2-/Y (n = 15); (K) CFTRinh-172(10 μM), a specific CFTR inhibitor, WT (n = 12) or Adgrg2-/Y (n = 10). (L) Effects of angiotensin II (100 nM, an angiotensin receptor agonist) and PD123319 (1 μM, an AT2 receptor antagonist) on the diameters of luminal ductules derived from WT or Adgrg2-/Y mice (n ≥ 12). (M) Effects of angiotensin II (100 nM) and candesartan (1 μM, an AT1 receptor antagonist) on the diameters of luminal ductules derived from WT or Adgrg2-/Y mice (n ≥ 12). Application of GlyH-101 and CFTRinh-172 to ligated ductules derived from WT mice recapitulated the phenotype of the ductules derived from Adgrg2-/Y mice. (4A-M)*p<0.05, **p<0.01, ***p<0.001; Adgrg2-/Y mice compared with WT mice. #p<0.05, ##p<0.01, ###p<0.001. Treatment with selective inhibitors or stimulators was compared with control vehicles. n.s., no significant difference. At least three independent biological replicates were performed for Figure 4A–M.
Figure 4—figure supplement 1. Expression and functional analysis of potential osmotic drivers in efferent ductules.
We next used a panel of pharmacological blockers to examine whether the inappropriate regulation of these membrane protein functions was involved in the ADGRG2- or Gq-mediated regulation of fluid reabsorption in the efferent ductules. Importantly, application of the NKCC blocker bumetanide, the ANO1 inhibitor Ani9, the calcium-dependent chloride channel (CaCC) inhibitor niflumic acid (NFA), TRP channel inhibitors including ruthenium red, SKF96365 and LaCl3, the L-type calcium channel blocker nicardipine or chelating extracellular calcium with EGTA showed no significant effects on fluid reabsorption in the efferent ductules in ligation experiments (Figure 4B–H and Figure 4—figure supplement 1B). Application of 4,4'-diisothiocyano-2,2'-stilbenedisulfonic acid (DIDS) to block the chloride-bicarbonate exchanger exerted a small effect only after 60 hr (Figure 4I), and the application of amiloride to inhibit sodium/hydrogen antiporter NHE1 activity exerted an acute effect on fluid reabsorption (Figure 4—figure supplement 1C), an outcome different from that observed in Adgrg2-/Y or Gnaq+/- mice (Figure 2D). In contrast, blocking CFTR activity either with GlyH-101 or CFTRinh-172 had significant effects on fluid reabsorption in the efferent ductules and pheno-copied the Adgrg2-/Y mice (Figure 4J–K). Collectively, the phenotype caused by inactivating ADGRG2 and administering a CFTR channel blocker in WT mice suggested that CFTR and ADGRG2 may be functionally connected to the regulation of fluid reabsorption.
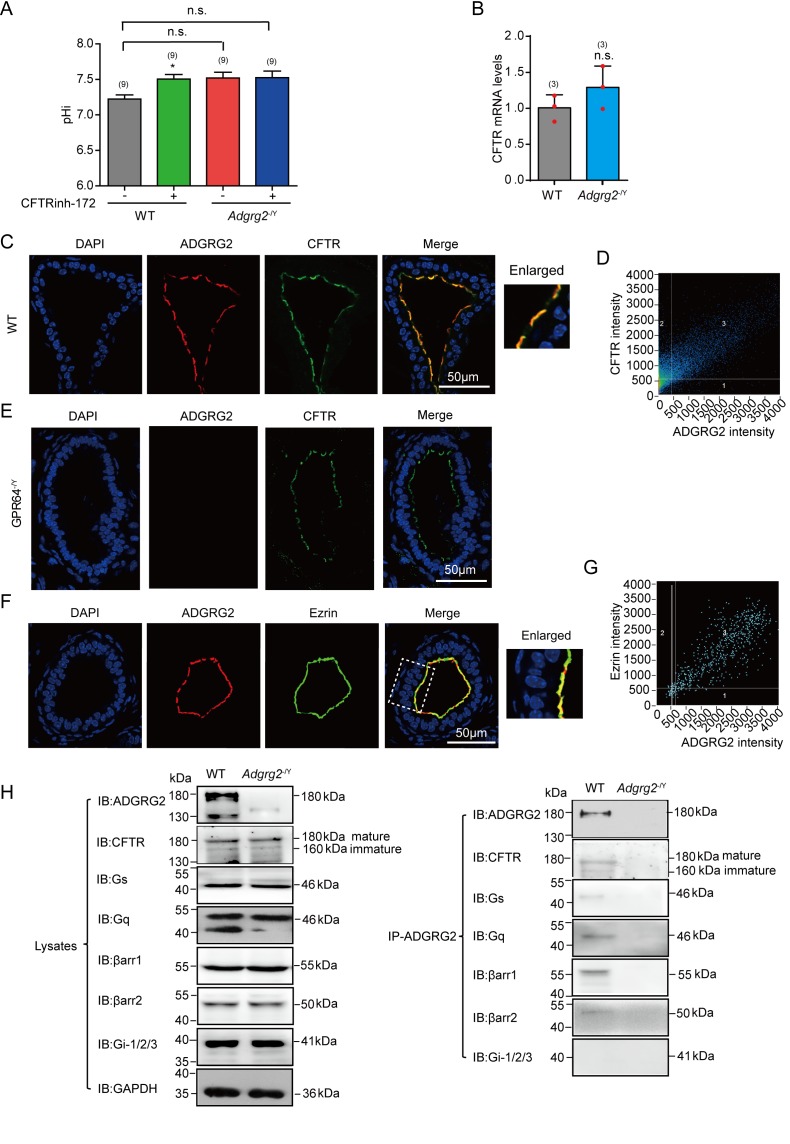
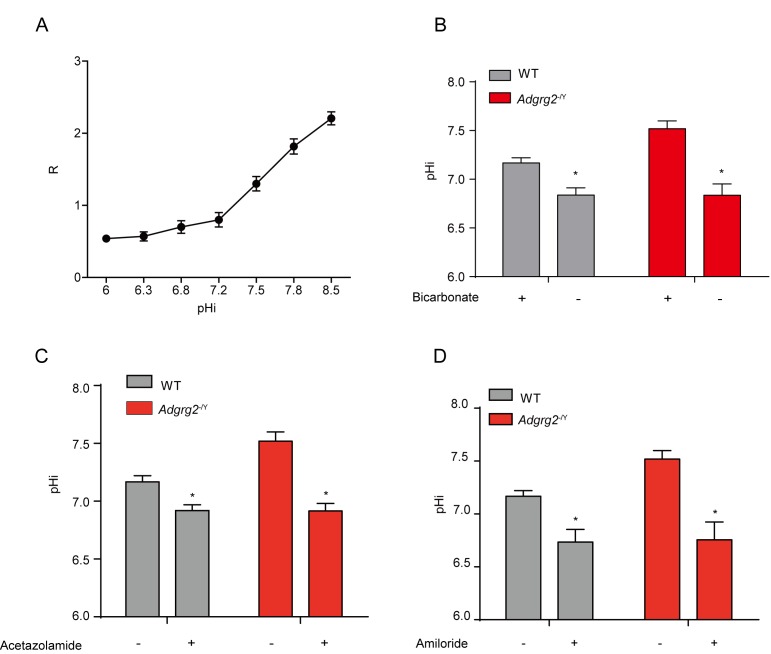
CFTR is the key regulator of pH homeostasis and chloride in the reproductive and renal systems and has important functions in fluid reabsorption (Chen et al., 2012). Therefore, we measured the pH value of the efferent ductules. The pH homeostasis was impaired in Adgrg2-/Y mice, with a pH value of 7.6 for the inner solution in the efferent ductules, compared to a pH of 7.2 in WT littermates (Figure 5A and Figure 5—figure supplement 2). This dysfunction was not caused by decreased CFTR expression because the mRNA levels of CFTR in the Adgrg2-/Y mice were not reduced compared with those of their WT littermates (Figure 5B and Figure 5—figure supplement 1). Moreover, application of the CFTR inhibitor CFTRinh-172 increased the pH value of the efferent ductules in WT mice by approximately 0.3 but did not have a significant effect in Adgrg2-/Y mice, suggesting that CFTR dysfunction in Adgrg2-/Y mice influences pH homeostasis (Figure 5A–B). Importantly, the pH imbalance in Adgrg2-/Y mice was rescued by bicarb-free media or application of the carbonic anhydrase inhibitor acetazolamide (Figure 5—figure supplement 2B–C).
Figure 5. Functional coupling and co-localization of CFTR and ADGRG2 on the apical membrane in the efferent ductules.
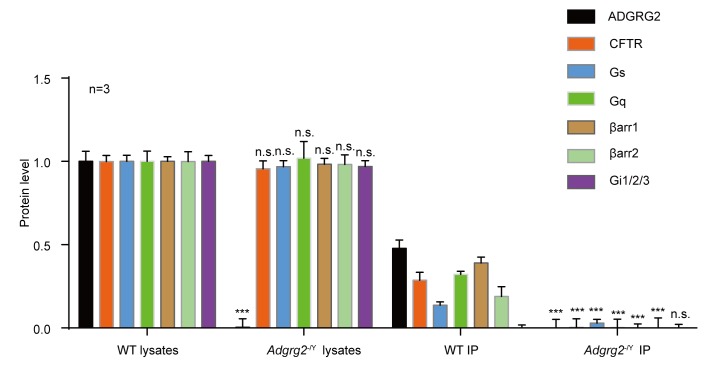
(A) Intracellular pH (pHi) of the ligated efferent ductules from WT (n = 9) mice and Adgrg2-/Y (n = 9) mice were measured by carboxy-SNARF (5 μM), with or without incubation with the CFTR inhibitor CFTRinh-172. (B) qRT-PCR analysis of CFTR levels in the efferent ductules of WT (n = 3) or Adgrg2-/Y (n = 3) mice. (C) Co-localization of ADGRG2 (red fluorescence) and CFTR (sc-8909, Santa Cruz, green fluorescence) in the male efferent ductules of WT mice. Scale bars, 50 μm. (D) Analysis of ADGRG2 and CFTR fluorescence intensities by Pearson’s correlation analysis. The Pearson's correlation coefficient was 0.76. (E) Immunofluorescence staining of ADGRG2 (red fluorescence) and CFTR (sc-8909, Santa Cruz, green fluorescence) in the efferent ductules of Adgrg2-/Y mice. Scale bars, 50 μm. (F) Co-localization of ADGRG2 (red fluorescence) and ezrin (green fluorescence) in the male efferent ductules of WT mice. Scale bars, 50 μm. (G) Analysis of ADGRG2 and ezrin fluorescence intensities by Pearson’s correlation analysis. The Pearson's correlation coefficient was 0.69. (H) ADGRG2 was immunoprecipitated with an anti-ADGRG2 antibody from the male efferent ductules of WT mice or Adgrg2-/Y mice, and co-precipitated CFTR, Gs, Gq, β-arrestin-1, β-arrestin-2 and Gi-1/2/3 levels were examined by using specific corresponding antibodies (CFTR antibody:20738–1-AP, Proteintech). (5A-5B) *p<0.05, **p<0.01, ***p<0.001, Adgrg2-/Y mice compared with WT mice. #p<0.05, ##p<0.01, ###p<0.001. Treatment with selective inhibitors or stimulators was compared with control vehicles. n.s., no significant difference. At least three independent biological replicates were performed for Figure 5A–B.
Figure 5—figure supplement 1. Representative agrose gel for the reverse transcription PCR analysis of CFTR mRNA level in efferent ductules of WT or Adgrg2-/Y mice.
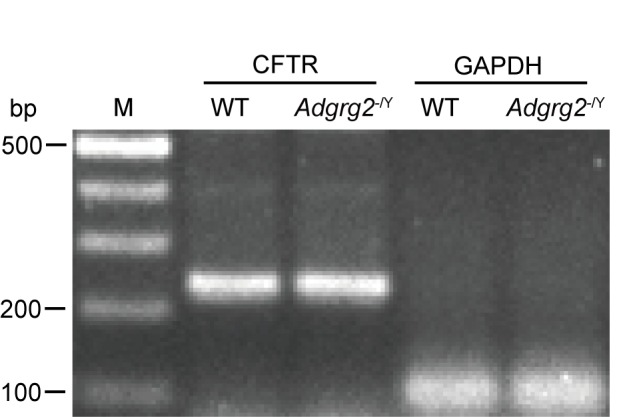
Figure 5—figure supplement 2. pH homeostasis in the efferent ductules was impaired in Adgrg2-/Y mice.
Figure 5—figure supplement 3. Immunostaining experiments for CFTR location in efferent ductules.
Figure 5—figure supplement 4. Bar graph representation and statistical analyses of Figure 5H.
In particular, unambiguous co-localization of ADGRG2 and CFTR on the apical membrane was detected (Figure 5C–G and Figure 5—figure supplement 3) and ADGRG2 was associated with CFTR in co-immunoprecipitation assays (Figure 5H and Figure 5—figure supplement 4). Taken together, these results suggest a complex formation and functional coupling of ADGRG2 and CFTR in the non-ciliated cells of the efferent ductules.
The outwardly rectifying whole-cell Cl- current (IADGRG2-ED) of ADGRG2 promoter-labeled efferent ductule cells
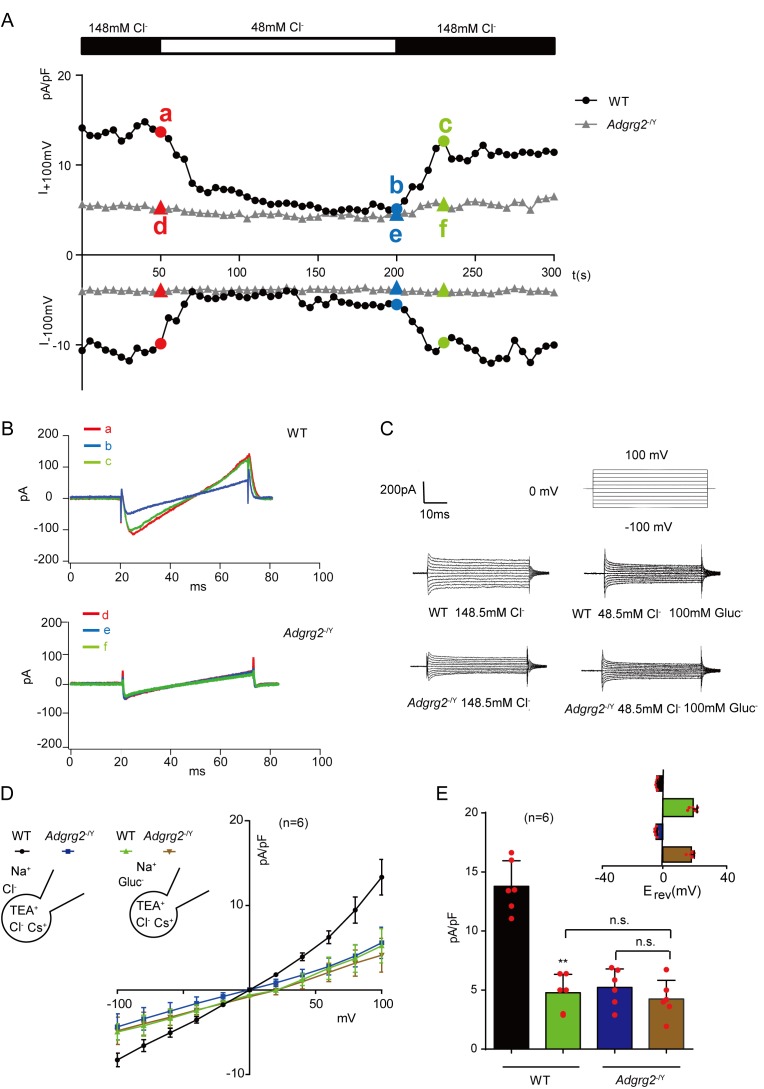
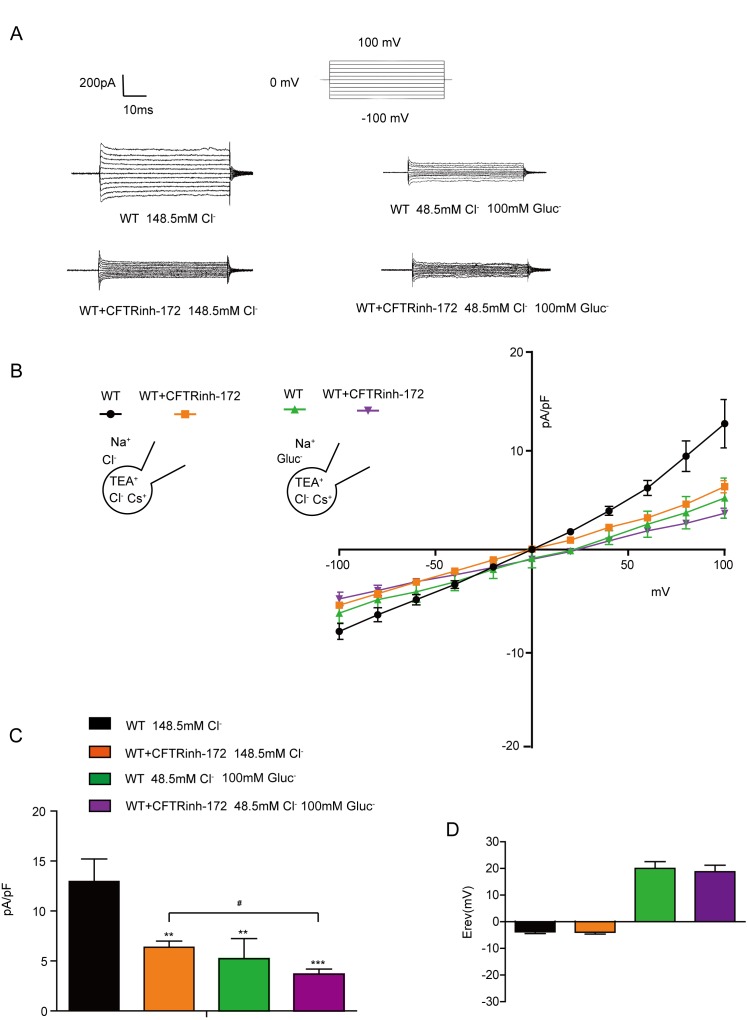
We then performed whole-cell Cl- recording of primary ADGRG2 promoter-labeled efferent ductule cells derived from WT and Adgrg2-/Y mice with normal Cl- concentrations or by substituting Cl- with gluconate (Gluc-) in the bath solution (Figure 6A–E and Table 1). Patch-clamp recording on ADGRG2 promoter-labeled non-ciliated cells derived from WT mice revealed a reversible whole-cell Cl- current (IADGRG2-ED), which was significantly diminished in response to substitution of the bath Cl- solution with Gluc- (148.5 mM Cl- was replaced by 48.5 mM Cl- and 100 mM Gluc-) (Figure 6A–B). This whole-cell Cl- current (IADGRG2-ED) was recovered once Gluc- was substituted with Cl- solution (Figure 6A–B). Further I-V analysis identified an outwardly rectifying whole-cell Cl- current (IADGRG2-ED) of wild type mice, which was significantly reduced in response to Gluc- substitution (Figure 6C–E and Table 1). The change in the reversal potential (Erev) with Gluc- replacement followed the Nernst equation (Figure 6C and Table 1). In contrast, the IADGRG2-ED of Adgrg2-/Y mice was substantially lower than the IADGRG2-ED of their WT littermates, which showed no significant changes in response to substitution of the bath Cl- solution with Gluc- (Figure 6A–6E and Table 1). These results suggested that ADGRG2 deficiency in the efferent ductules significantly reduced the whole-cell Cl- current of ADGRG2 promoter-labeled non-ciliated cells.
Figure 6. The whole-cell Cl- current recording of ADGRG2 promoter-labeled efferent ductule cells.
(A) Time course of whole-cell Cl- current (IADGRG2-ED) at +100 and −100 mV in ADGRG2 promoter-labeled efferent ductule cells derived from Adgrg2-/Y mice or their littermates. An ‘a’ or ‘d’ indicates the substitution of the Cl- bath solution with Gluc- (148.5 mM Cl- was replaced by 48.5 mM Cl- and 100 mM Gluc-); and ‘b’ or ‘e’ indicates the substitution of the Gluc- bath solution with Cl- (148.5 mM Cl-). ‘a’,”b’ and ‘c’ belong to WT mice. ‘d’,”e’ and ‘f’ belong to Adgrg2-/Y mice. (B) The current-voltage relationship of IADGRG2-ED at specific time points (from 6A) is shown. (C) The whole cell Cl- current of IADGRG2-ED elicited by voltage steps between −100 mV and +100 mV in a representative ADGRG2-promoter-RFP labeled efferent ductule cells derived from the Adgrg2-/Y mice and their wild type littermates. The outwardly rectifying IADGRG2-ED was significantly diminished when bath Cl- was substituted for gluconate (Gluc-). (D) Representative whole-cell Cl- current of ADGRG2 promoter-labeled efferent ductule cells; IADGRG2-ED versus voltage (I–V) relationships in response to voltage ramps recorded with a CsCl pipette solution in Adgrg2-/Y (n = 8) or WT mice (n = 8). The outwardly rectifying IADGRG2-ED was significantly diminished, and its reversal potential (Erev) shifted to the positive direction when Cl- was substituted for Gluc-. (E) Average current densities (pA/pF) measured at 100 mV of (C). Inset: average Erev (±s.e.m., n = 8 for each condition). **p<0.01, IADGRG2-ED in Gluc- solution was compared with IADGRG2-ED in Cl- solution. ns, no significant difference. At least three independent biological replicates were performed.
Table 1. Average reversal potential calculated at different Cl- concentrations for Figure 6C.
Average reversal potential(Erev) (±s.e.m., n = 8 for each condition) in Figure 6C and calculated Nernst potential at different Cl- concentrations. The Nernst equation was: Erev=-RT/Z [Ln (Cl-)in/(Cl-)out].
| Group | Erev[Cl-]o148.5 mM(mV) | Erev[Cl-]o48.5 mM(mV) |
|---|---|---|
| Nernst | −4.6 | 25.3 |
| WT | −4.0 ± 0.51 | 20.1 ± 2.52 |
| Adgrg2-/Y | −4.1 ± 0.36 | 19.4 ± 2.47 |
CFTR mediates the whole-cell Cl- current of ADGRG2 promoter-labeled efferent ductule cells
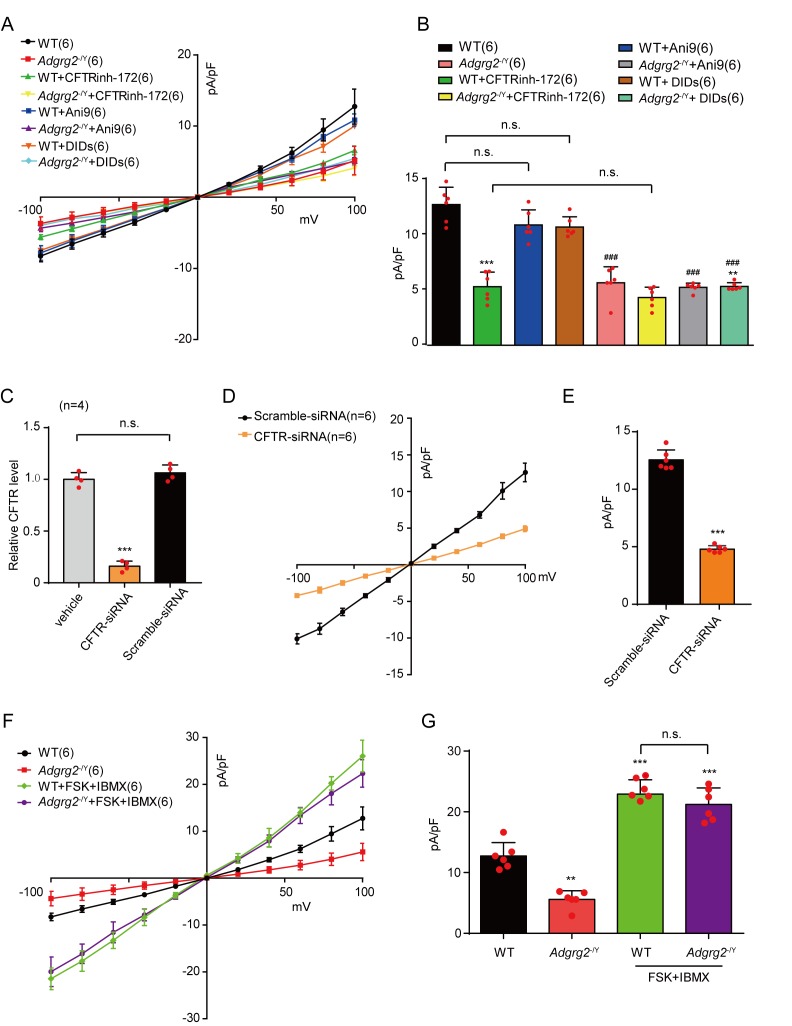
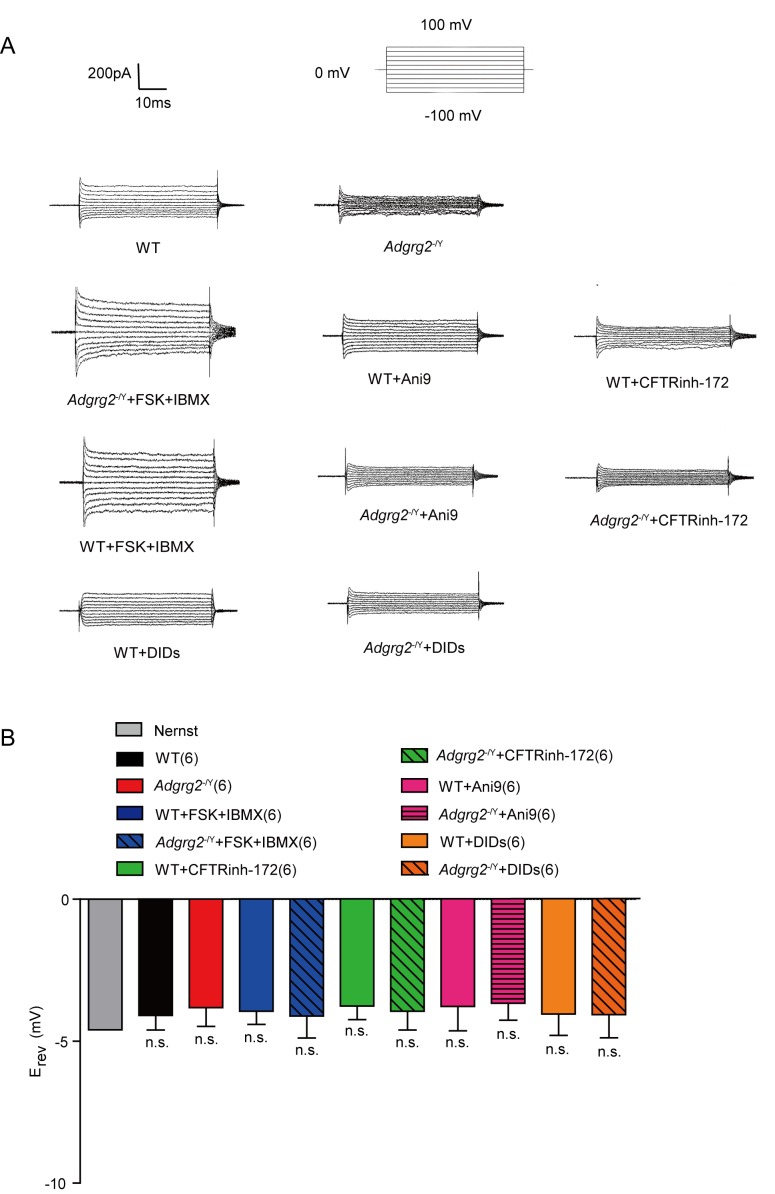
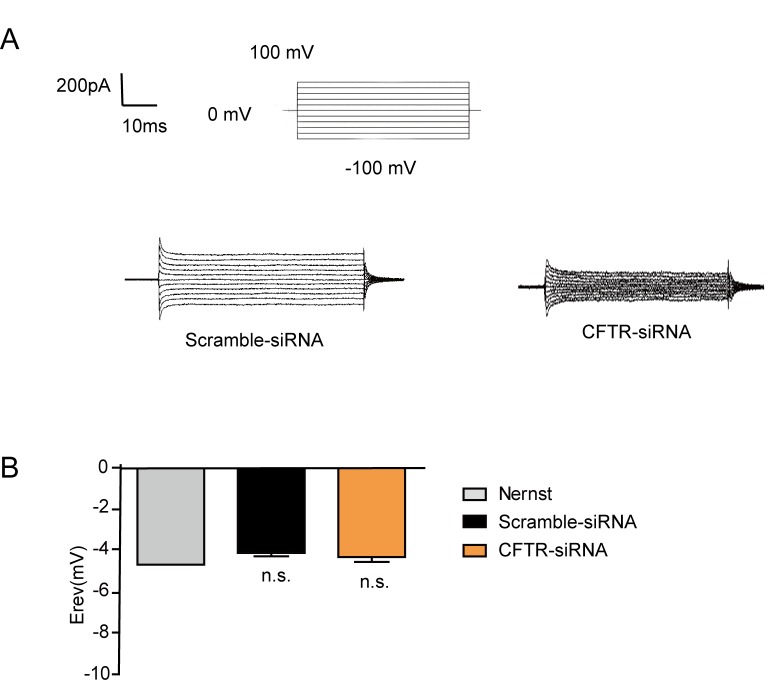
We next examined the effects of different Cl- channel and transporter inhibitors on the IADGRG2-ED of efferent ductule cells derived from Adgrg2-/Y mice and their WT littermates. Although application of the ANO1 inhibitor Ani9 or the chloride-bicarbonate exchanger inhibitor DIDS exerted no significant effects on the IADGRG2-ED of WT mice, the specific CFTR inhibitor CFTRinh-172 significantly reduced the IADGRG2-ED current (Figure 7A–B and Figure 7—figure supplement 1). Moreover, the difference in the IADGRG2-ED between Adgrg2-/Y mice and their WT littermates was eliminated by the application of CFTRinh-172(Figure 7A–B). After the application of CFTRinh-172, the IADGRG2-ED showed no significant response to Gluc- substitution in the bath solution (Figure 7—figure supplement 2). Consistently, when we knocked down CFTR expression in efferent ductules (Figure 7C), the whole-cell Cl- current (IADGRG2-ED) of WT mice was significantly reduced (Figure 7D–E and Figure 7—figure supplement 3). These results suggested that CFTR is essentially activated in ADGRG2 promoter-labeled efferent ductule cells, which mediate the observed outwardly rectifying whole-cell Cl- current, and ADGRG2 is required for the basic activation of CFTR in these cells.
Figure 7. Cl- currents in the non-ciliated cells of the efferent ductules through CFTR.
(A, D and F) Corresponding I-V curves of the whole-cell Cl- IADGRG2-ED currents recorded in Figure 6 and (A, D and F) Corresponding I-V curves of the whole-cell Cl- IADGRG2-ED currents recorded in Figure 7—figure supplement 1(A,F) and Figure 7—figure supplement 3(D). WT (n = 6), Adgrg2-/Y (n = 6); WT +CFTRinh-172 (n = 6), Adgrg2-/Y+CFTRinh-172 (n = 6), WT +ANI9 (n = 6), Adgrg2-/Y+ANI9 (n = 6), WT +DIDS (n = 6), Adgrg2-/Y+DIDS (n = 6); WT +Control RNAi (n = 6), WT +CFTR RNAi (n = 6), Adgrg2-/Y+Control RNAi (n = 6), Adgrg2-/Y+CFTR RNAi (n = 6); WT +FSK + IBMX (n = 6), Adgrg2-/Y+FSK+IBMX (n = 6). (B,E and G) Corresponding bar graph depicting the average current densities (pA/pF) measured at 100 mV in (A), (D) and (F). (C) qRT-PCR analysis of CFTR levels in the efferent ductules treated with CFTR siRNA (n = 3) or control RNAi (n = 3). (B, E and G) *p<0.05, **p<0.01, ***p<0.001, Adgrg2-/Y mice compared with WT mice. #p<0.05, ##p<0.01, ###p<0.001. Treatment with selective inhibitors, stimulators or CFTR RNAi was compared with control vehicles or control RNAi. n.s., no significant difference. At least three independent biological replicates were performed for Figure 7B,E and G.
Figure 7—figure supplement 1. Effects of different stimulators or inhibitors of osmotic drivers on I ADGRG2-ED Cl- currents of efferent ductule cells derived from Adgrg2-/Y mice and their wild type littermates.
Figure 7—figure supplement 2. Effects of Cl- concentration change and CFTRinh-172 on the IADGRG2-ED Cl- currents.
Figure 7—figure supplement 3. Effects of CFTR knocked down on the I ADGRG2-ED Cl- currents.
CFTR is activated by FSK and IBMX (Lu et al., 2010). In response to FSK and IBMX stimulation, the IADGRG2-ED of both Adgrg2-/Y and WT mice significantly increased to similar levels (Figure 7F–G), consistent with the western blot results, indicating that CFTR expression levels did not change in Adgrg2-/Y mice. The results also indicated that basic CFTR activation in ADGRG2 promoter-labeled efferent ductule cells does not represent the full activation state (Figure 7F–G).
Gq activity is required for ADGRG2/CFTR coupling in the efferent ductules
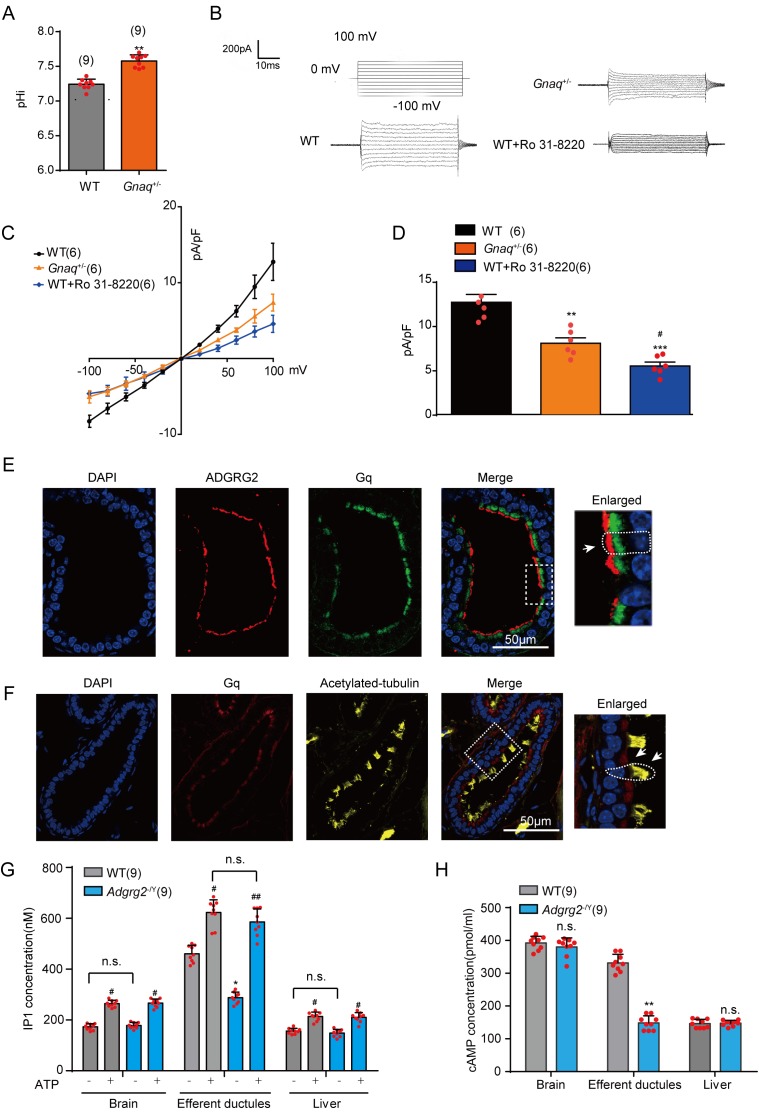
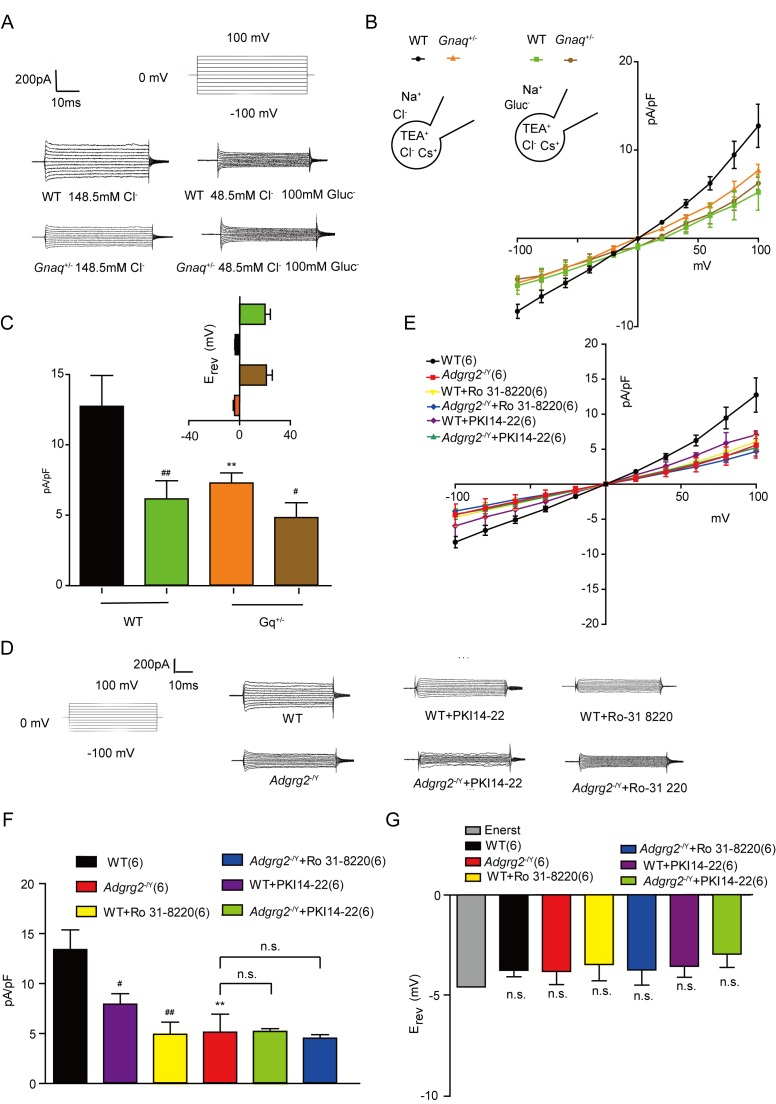
Similar to Adgrg2-/Y mice, the efferent ductules derived from Gnaq+/- mice exhibited imbalances in pH homeostasis (Figure 8A). We utilized Gnaq+/- mice because Gnaq-/- mice were not available due to the infertility of the Gnaq+/- mice. Consistently, we observed a significantly decreased whole-cell Cl- IADGRG2-ED current of the ADGRG2 promoter-RFP-labeled primary non-ciliated cells in Gnaq+/- mice compared with that observed in their WT littermates (Figure 8B–D and Figure 8—figure supplement 1A–B). The application of Ro 31–8220, an inhibitor of the Gq downstream effector PKC, further inhibited the observed IADGRG2-ED and showed much stronger effects than the PKA inhibitor PKI 14–22 (Figure 8—figure supplement 1D–G). These results indicated that the Gq-PKC pathway plays critical roles in basic CFTR activation in the efferent ductules, which controls Cl- and pH homeostasis for efficient fluid reabsorption.
Figure 8. Gq activity regulated Cl- current and pH homeostasis in the efferent ductules.
(A) Intracellular pH (pHi) of the ligated efferent ductules from WT (n = 9) mice or Gnaq+/- (n = 9) mice was measured by carboxy-SNARF. (B). The whole-cell Cl- current of the IADGRG2-ED elicited by voltage steps between −100 mV and +100 mV in representative ADGRG2 promoter-RFP-labeled efferent ductule cells derived from Gnaq+/- mice, their WT littermates, or WT murine cells incubated with the PKC inhibitor Ro 31–8220 (500 nM). The whole-cell Cl- IADGRG2-ED current was recorded with a CsCl pipette solution (101 mM CsCl, 10 mM EGTA, 10 mM Hepes, 20 mM TEACl, 2 mM MgATP, 2 mM MgCl2, 5.8 mM glucose, pH7.2, with D-mannitol compensated for osm 290) and a bath solution containing 138 mM NaCl, 4.5 mM KCI, 2 mM CaCl2, 1 mM MgCl2, 5 mM glucose, and 10 mM HEPES, pH 7.4 with D-mannitol compensated for osm 310. (C) Corresponding I-V curves of the whole-cell Cl- currents recorded in (B). WT (n = 6), Gnaq+/- (n = 6), WT +Ro 31–8220 (n = 6). (D) Corresponding bar graph of the average current densities (pA/pF) measured at 100 mV according to (C). (E) Co-localization of ADGRG2 (red) and Gq (green) in the male efferent ductules. Scale bars, 50 μm. (F) Co-localization of Gq (red) and acetylated-tubulin (yellow) in the male efferent ductules. Scale bars, 50 μm. (G) IP1 levels in the brain tissues, ligated efferent ductules, and livers of WT (n = 9) or Adgrg2-/Y (n = 9) mice in response to ATP (5 mM) or control vehicles, measured by ELISA. (H) cAMP concentrations in the brains, ligated efferent ductules, and livers of WT (n = 9) or Adgrg2-/Y (n = 9) mice were measured using ELISA. (8A,8D,8G-H) *p<0.05, **p<0.01, ***p<0.001, Adgrg2-/Y mice or Gnaq+/-mice compared with WT mice. #p<0.05, ##p<0.01, ###p<0.001, ATP- or Ro 31–8220-treated cells were compared with control vehicles. n.s., no significant difference. At least three independent biological replicates were performed for Figure 8A,D,G and H.
Figure 8—figure supplement 1. Effects of G protein signaling on the I ADGRG2-ED Cl- currents.
Figure 8—figure supplement 2. Gq is localized in the ADGRG2 expressed cells, but not the acetylated-tubulin-labeled cells in efferent ductules.
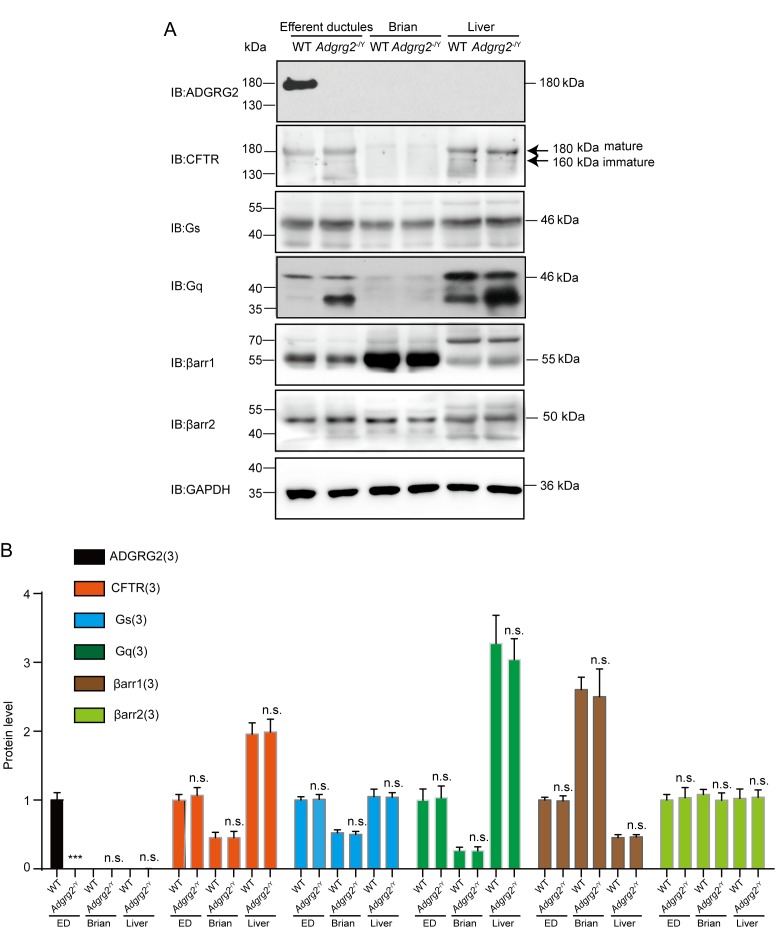
Figure 8—figure supplement 3. The expression of ADGRG2, CFTR, Gs, Gq, β-arrestin-1, β-arrestin-2 in efferent ductules, brain and liver tissue of WT and Adgrg2-/Y mice.
We next investigated whether Gq activation by ADGRG2 is required for CFTR function, as both Gq and ADGRG2 are required for normal CFTR currents in the efferent ductules. In the efferent ductules, the Gq is localized in ADGRG2-expressing cells but not acetylated tubulin-labeled cells (Figure 8E–F and Figure 8—figure supplement 2). Consistently, Gq was readily detected in ADGRG2 antibody immuno-precipitated complexes, whereas Gi was not detectable, suggesting a physical interaction of ADGRG2 with Gq in the efferent ductules (Figure 5H and Figure 5—figure supplement 4). Moreover, the endogenous resting IP1 and cAMP levels of the ligated efferent ductules derived from the Adgrg2-/Y mice were significantly lower than those of their WT littermates (Figure 8G and H). These decreases were not caused by changes in the expression of the Gs-Adenyl-cyclase or Gq-PLC (Phospholipase C) system because Gs and Gq protein levels were similar (Figure 8—figure supplement 3), and the application of ATP induced similar levels of IP3 accumulation in the Adgrg2-/Y mice and their WT littermates (Figure 8G). Taken together, these data indicate that Gq regulates fluid reabsorption by mediating ADGRG2/CFTR coupling, and both the Gq-IP3-PKC pathway and the Gs-cAMP pathway were activated in ADGRG2 promoter-labeled efferent ductule cells.
Previous studies have shown that the activation of Angiotensin II receptor, type 2(AGTR2) increases proton secretion (Shum et al., 2008). We therefore stimulated the efferent ductules with different concentrations of angiotensin II and evaluated whether they rescued the fluid reabsorption dysfunction in Adgrg2-/Y mice by restoring pH homeostasis in the efferent ductules. Although applying 1 μM angiotensin II had no significant effect, administering 100 nM angiotensin II restored fluid reabsorption in the efferent ductules derived from Adgrg2-/Y mice (Figure 4L–M). This rescue was blocked by only the AGTR2 antagonist PD123319 (Figure 4L) but not by the Angiotensin II receptor, type 1(AGTR1) antagonist candesartan (Figure 4M). In summary, Gq and ADGRG2 regulated fluid reabsorption by maintaining pH and chloride homeostasis. The pharmacological activation of AGTR2 rescued the ADGRG2 or Gq dysfunction involved in fluid reabsorption in the efferent ductules.
ADGRG2/CFTR complex formation mediated by β-arrestin-1 but not β-arrestin-2 is essential for fluid reabsorption in the efferent ductules
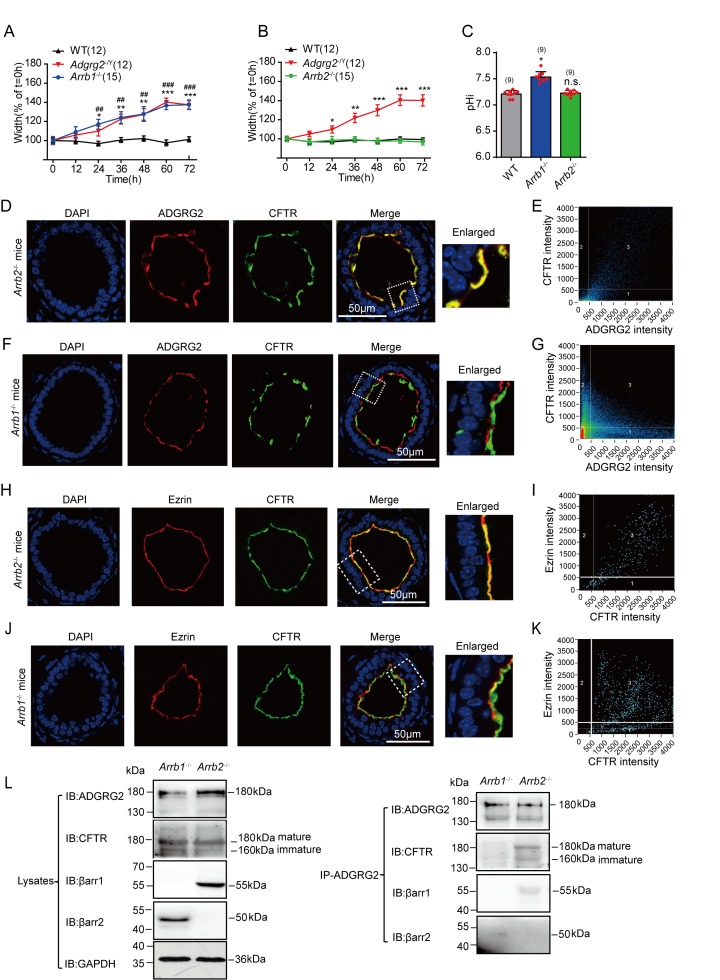
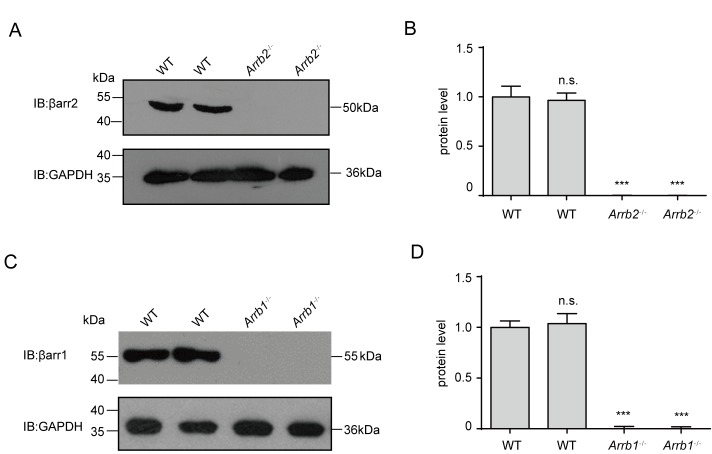
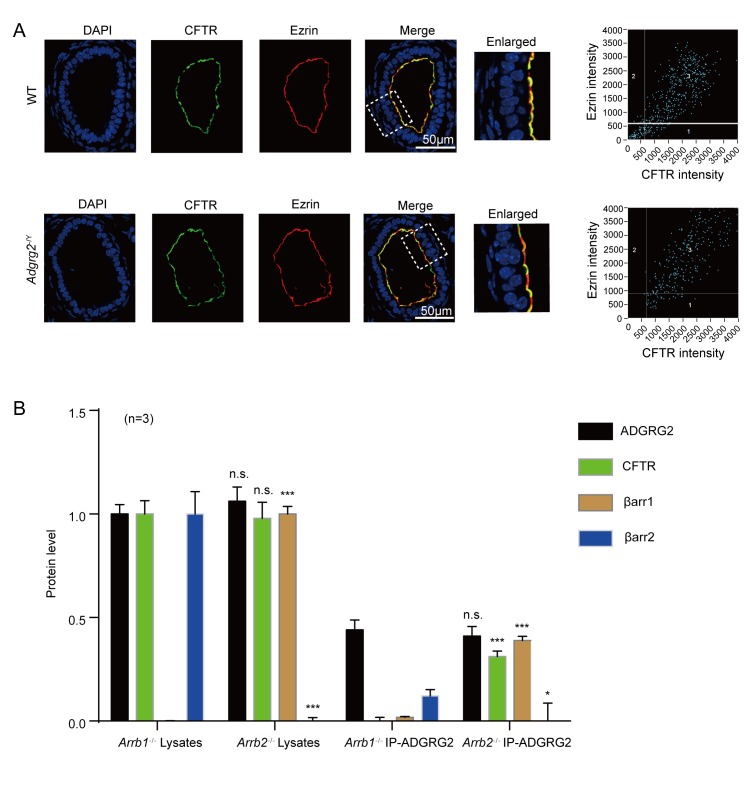
In parallel with G protein signaling, arrestins mediate important functions downstream of many GPCRs, including the connection of GPCR activation to channel functions (Alvarez-Curto et al., 2016; Dong et al., 2017; Liu et al., 2017; Thomsen et al., 2016). We therefore examined the fluid reabsorption in Arrb1-/- and Arrb2-/- knockout mice. Whereas the efferent ductules derived from Arrb2-/- knockout mice showed normal fluid reabsorption as well as pH homeostasis compared to their WT littermates, these functions of the efferent ductules derived from Arrb1-/- knockout mice were significantly impaired (Figure 9A–C and Figure 9—figure supplement 1). Moreover, whereas ADGRG2 and CFTR co-localized in the apical membrane regions of the non-ciliated cells of the efferent ductules derived from Arrb2-/- or WT mice, they were separated in Arrb1-/- mice (Figure 9D–K). In β-arrestin-1-deficient efferent ductules, CFTR localized away from ezrin (Figure 9F–K), an apical membrane marker, suggesting that β-arrestin-1 is required for the correct localization of CFTR. Consistently, whereas CFTR was co-immunoprecipitated with ADGRG2 in WT and Arrb2-/- mice, it was not found in ADGRG2-immunoprecipitated complexes from the efferent ductules derived from Arrb1-/- mice, further suggesting that β-arrestin-1 is an essential component in a signaling complex encompassing ADGRG2 and CFTR in the efferent ductules (Figures 5H and 9L and Figure 9—figure supplement 2).
Figure 9. β-arrestin-1 is required for fluid reabsorption in the efferent ductules via scaffolding ADGRG2/CFTR complex formation.
(A) Diameters of the luminal ductules derived from WT (n = 12), Adgrg2-/Y (n = 12) or Arrb1-/- (n = 15) mice. (B) Diameters of the luminal ductules derived from WT (n = 12), Adgrg2-/Y (n = 12) or Arrb2-/- (n = 15) mice. (C) Intracellular pH (pHi) of the ligated efferent ductules derived from WT (n = 9), Arrb1-/- (n = 9) or Arrb2-/- (n = 9) mice were measured by carboxy-SNARF. (D) Co-localization of ADGRG2 (red fluorescence) and CFTR (sc-8909, Santa Cruz, green fluorescence) in the male efferent ductules of Arrb2-/- mice. (E) Analysis of ADGRG2 and CFTR fluorescence intensities in Arrb2-/- mice by Pearson’s correlation analysis. The Pearson's correlation coefficient was 0.62. (F) Localization of ADGRG2 (red fluorescence) and CFTR (sc-8909, Santa Cruz, green fluorescence) in the male efferent ductules of Arrb1-/- mice. (G) Analysis of ADGRG2 and CFTR fluorescence intensities in Arrb1-/- mice by Pearson’s correlation analysis. The Pearson's correlation coefficient was −0.15. (H) Co-localization of ezrin (red fluorescence) and CFTR (sc-8909, Santa Cruz, green fluorescence) in the male efferent ductules of Arrb2-/- mice. (I) Analysis of ezrin and CFTR fluorescence intensities in Arrb2-/- mice by Pearson’s correlation analysis. The Pearson's correlation coefficient was 0.66. (J) Co-localization of ezrin (red fluorescence) and CFTR (sc-8909, Santa Cruz, green fluorescence) in the male efferent ductules of Arrb1-/- mice. (K) Analysis of ezrin and CFTR fluorescence intensities in Arrb1-/- mice by Pearson’s correlation analysis. The Pearson's correlation coefficient was −0.15. (L) ADGRG2 was immunoprecipitated by an anti-ADGRG2 antibody in the male efferent ductules of Arrb1-/- mice or Arrb2-/- mice, and co-precipitates with CFTR, β-arrestin-1, and β-arrestin-2 were examined by using specific corresponding antibodies (CFTR antibody:20738–1-AP, Proteintech). (9A-C) *p<0.05, **p<0.01, ***p<0.001, Adgrg2-/Y mice compared with WT mice. #p<0.05, ##p<0.01, ###p<0.001, Arrb1-/- mice or Arrb2-/- mice compared with WT mice. ns, no significant difference. At least three independent biological replicates were performed for Figure 9A–C and L.
Figure 9—figure supplement 1. Western blot analysis of β-arrestin1/2 expression in the efferent duct tissue.
Figure 9—figure supplement 2. β-arrestin-1 is an essential component in a signaling complex encompassing the ADGRG2 and CFTR in efferent ductules.
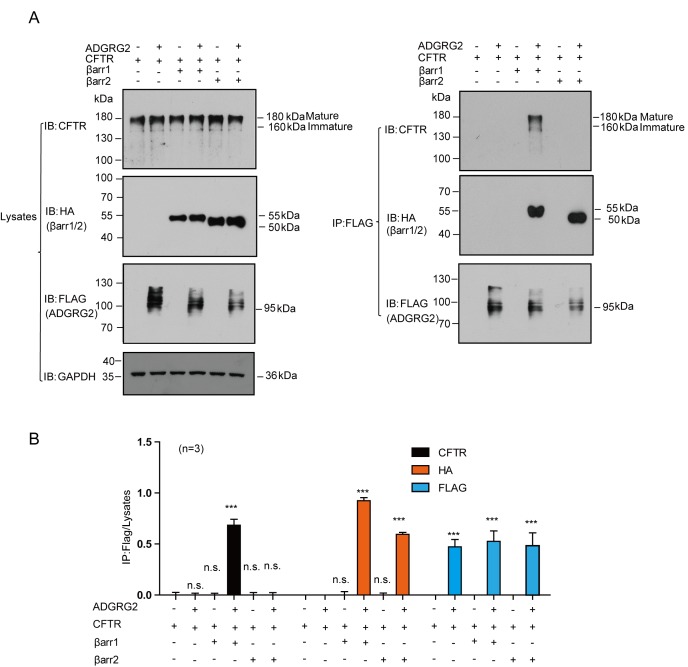
Figure 9—figure supplement 3. The complex formation between ADGRG2, β-arrestin-1 and CFTR in HEK293 cells.
We therefore used HEK293 cells to investigate the in vitro role of β-arrestins in ADGRG2/CFTR complex formation. Overexpression of β-arrestin-1 but not β-arrestin-2 promoted the interaction between ADGRG2 and CFTR (Figure 9—figure supplement 3), confirming the essential role of β-arrestin-1 in assembly of ADGRG2/CFTR coupling.
Molecular determinants of ADGRG2 coupling with G protein subtypes and their contribution to the regulation of CFTR activity in vitro
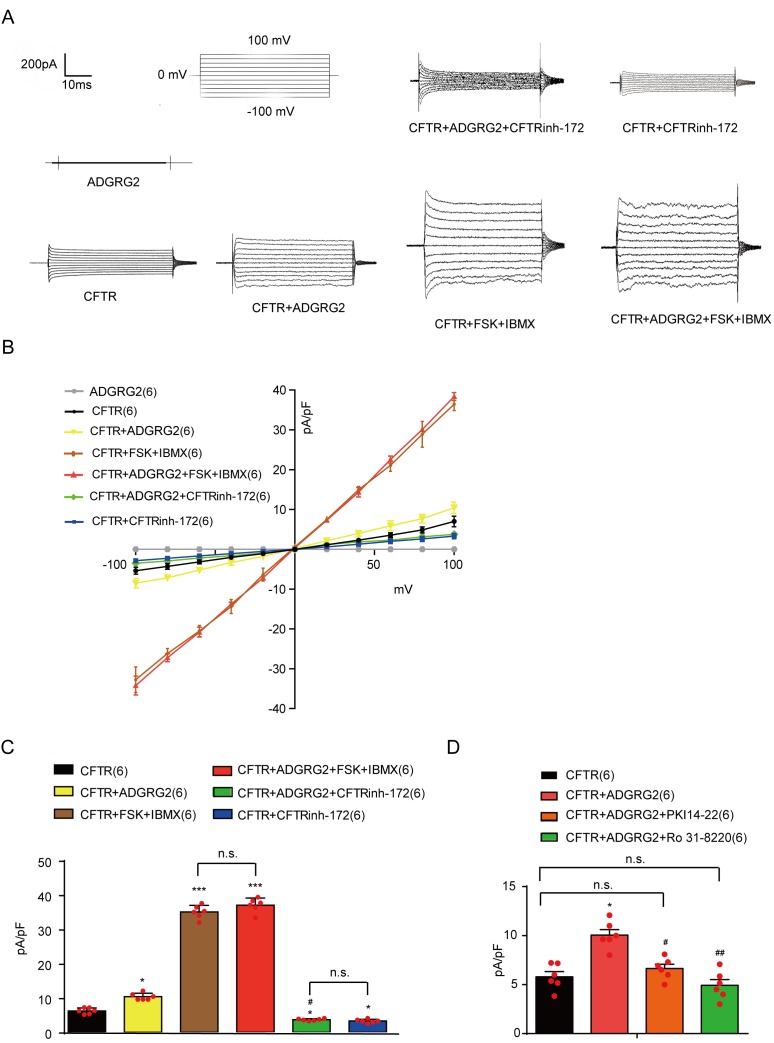
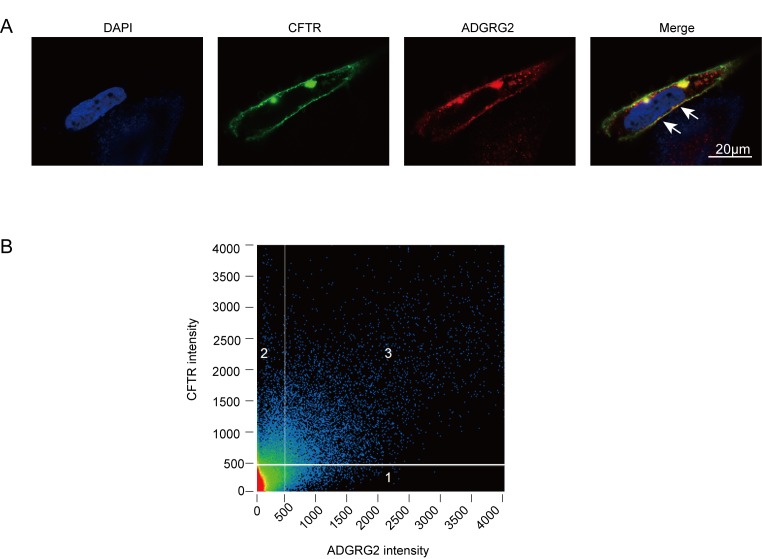
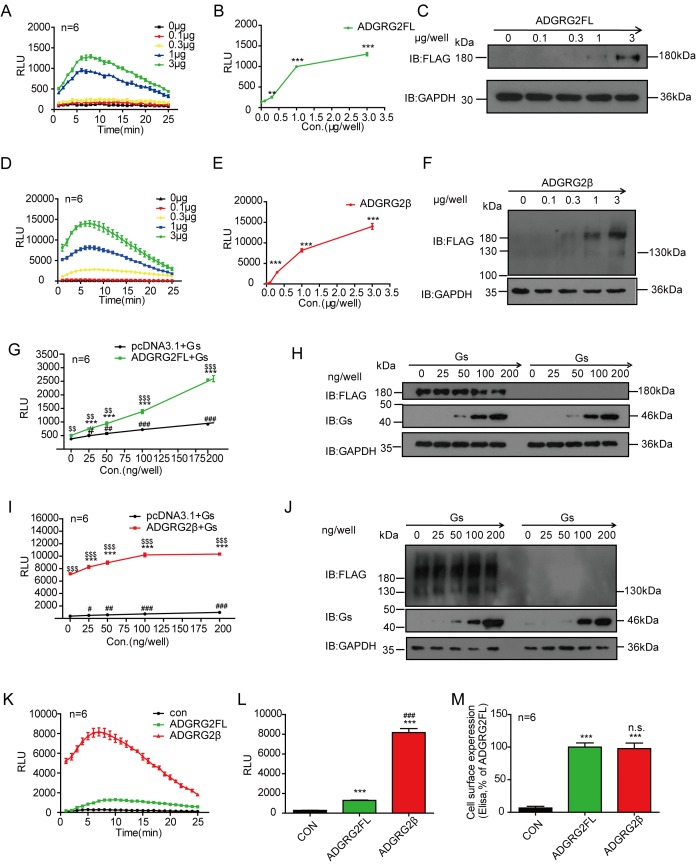
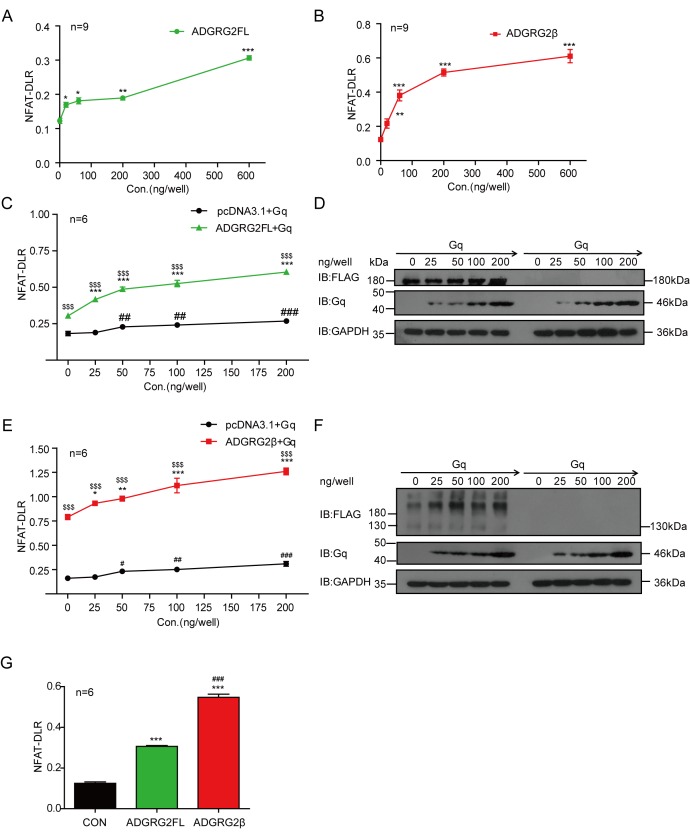
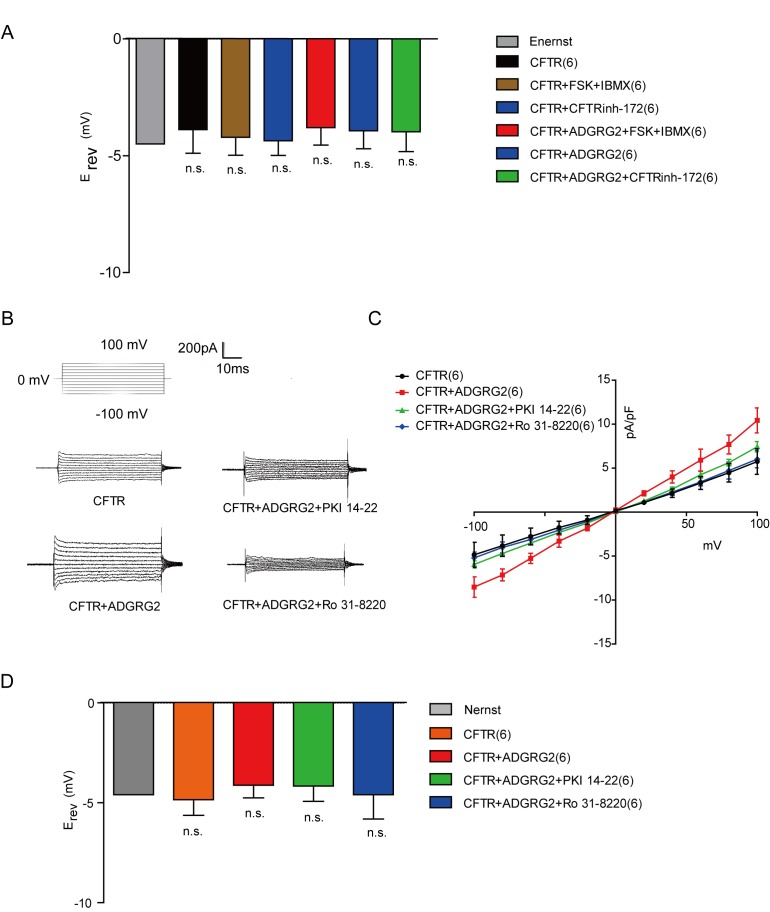
ADGRG2 belongs to the adhesion GPCR group of the GPCR superfamily (Purcell and Hall, 2018; Monk et al., 2015). Whereas the endogenous ligand of ADGRG2 in the testis is unknown, several members of the same adhesion GPCR subfamily, such as VLGR1 and GPR56, showed constitutive activity via overexpression in a heterologous system (Purcell and Hall, 2018; Hu et al., 2014; Paavola et al., 2011). To dissect the molecular mechanism underlying ADGRG2 signaling in the modulation of CFTR functions, we overexpressed ADGRG2 and CFTR in HEK293 cells (Figure 10—figure supplement 1). In vitro, the overexpression of ADGRG2 causes constitutive Gs and Gq coupling activity; a stronger effect is observed with ADGRG2β (Figure 10—figure supplements 2–5). Whole-cell recordings were performed to examine the effects of ADGRG2 and CFTR co-expression on membrane currents by using an I-V analysis (Figure 10A). The co-expression of ADGRG2 and CFTR significantly increased the amplitude and slope of the current responses, which were significantly reduced by the CFTR inhibitor CFTRinh-172, compared with cells transfected with CFTR alone, indicating that CFTR channels are activated by ADGRG2 in a recombinant system (Figure 10B–D). Similar to primary efferent ductule cells (Figure 7F–G), the application of FSK and IBMX further increased the whole-cell Cl- current in the presence of both ADGRG2 and CFTR, confirming that ADGRG2 increased the basal activity of CFTR but did not stimulate CFTR to a full activation state (Figure 10B–C and Figure 10—figure supplement 5A).
Figure 10. ADGRG2 upregulates CFTR Cl- currents through G protein signaling.
(A) Whole-cell Cl- currents recorded with a CsCl pipette solution in HEK293 cells transfected with plasmids encoding ADGRG2 or/and CFTR, with or without CFTR inhibitor CFTRinh-172(10 μM) or its activator (FSK (10 μM)+IBMX (100 μM)). (B) Corresponding I-V curves of the whole-cell Cl- currents recorded in (C). ADGRG2 (n = 6), CFTR (n = 6), CFTR + CFTRinh-172(n = 6), CFTR + FSK + IBMX (n = 6), CFTR + ADGRG2 (n = 6), CFTR + ADGRG2+CFTRinh-172(n = 6), CFTR + ADGRG2+FSK + IBMX (n = 6). (C and D) Bar graph representation of average current densities (pA/pF) measured at 100 mV according to (B) and Figure 9; (C and D) Bar graph representation of average current densities (pA/pF) measured at100mVaccording to (B) and Figure 10–figure supplement 5C. (10C-10D) *p<0.05, **p<0.01, ***p<0.001, HEK293 cells transfected with CFTR compared with cells transfected with pCDNA3.1. #p<0.05, ##p<0.01, ###p<0.001, HEK293 cells transfected with ADGRG2 compared with non-ADGRG2 transfected cells. $p<0.05, $$, p<0.01, $$$, p<0.001, CFTRinh-172, FSK, NF449, U73122 or Ro 31–8220 compared with control vehicle. n.s., no significant difference. At least three independent biological replicates were performed for Figure 10C–D.
Figure 10—figure supplement 1. Co-localization analysis of ADGRG2 and CFTR in HEK293 cells.
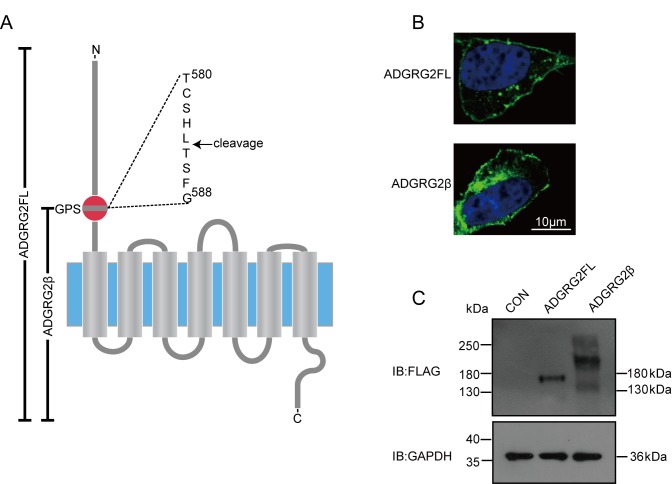
Figure 10—figure supplement 2. Construction and expression of ADGRG2-full length (ADGRG2FL) and a truncated form ADGRG2β.
Figure 10—figure supplement 3. Overexpression of ADGRG2FL and ADGRG2β lead to constitutive increased cellular cAMP levels.
Figure 10—figure supplement 4. Overexpression of ADGRG2FL and ADGRG2β have constitutive Gq-NFAT signaling activities.
Figure 10—figure supplement 5. ADGRG2 upregulates CFTR Cl- currents and Cl- efflux through G protein signaling.
Importantly, increased CFTR activity induced by ADGRG2 was significantly diminished by the PKC inhibitor Ro 31-8220 (Figure 10D and Figure 10—figure supplement 5B–D). Taken together, these data demonstrate that ADGRG2 increases CFTR Cl- currents through the activation of Gq-PLC-PKC signaling.
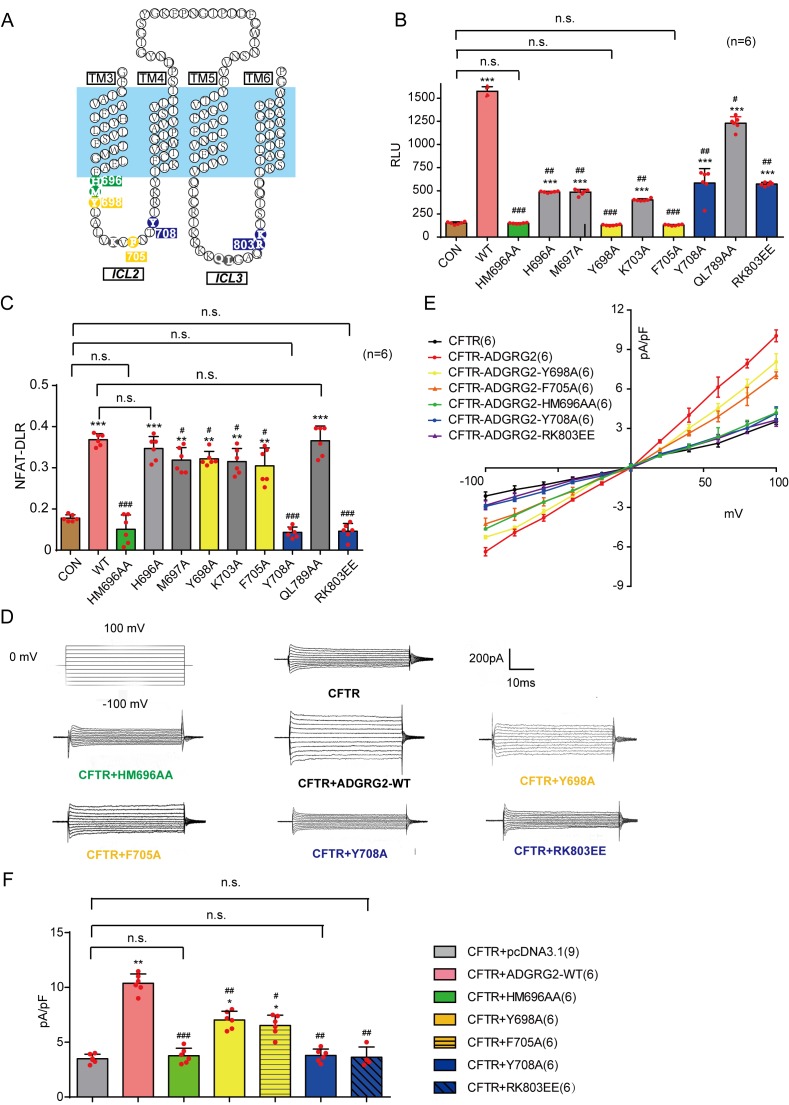
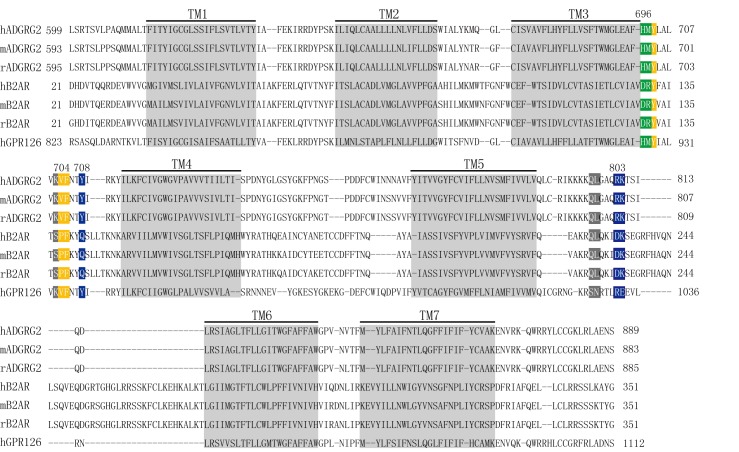
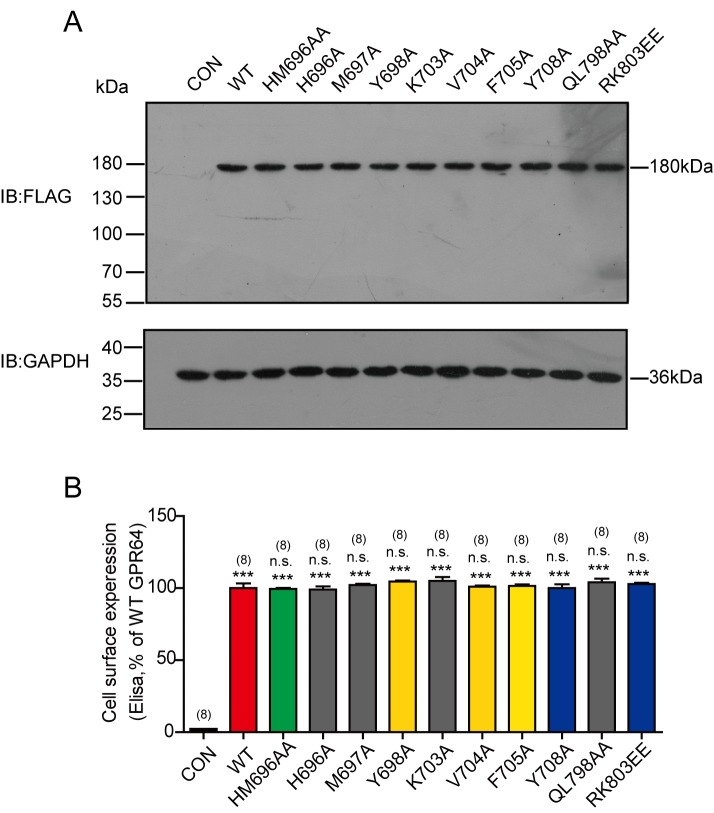
Previous crystallographic studies have shown that the intracellular loop 2 of the β2-adrenergic receptor is important for Gs coupling, and mutations in the intracellular loop three affect G protein coupling activity by receptors (Hu et al., 2014; Rasmussen et al., 2011). We therefore selected mutations in intracellular loops 2 and 3 and examined their effects on the constitutive activity of ADGRG2 in Gs or Gq signaling, as detected by cAMP or NFAT-dual-luciferase reporter (DLR) luciferase measurements (Figure 11A–C and Figure 11—figure supplement 1) in HEK293 cells. Under the equal expression of these mutants in the cell membrane, a double mutation in the ‘DRY’ motif H696A/M697A of ADGRG2 eliminated coupling activity with both Gs and Gq (Figure 11B–C and Figure 11—figure supplement 2). Three mutations in intracellular loop 2, specifically Y698A and F705A, significantly impaired the Gs coupling activity of ADGRG2 but did not exert significant effects on NFAT-DLR activity (Figure 11B–C). However, Y708A in intracellular loop 2 and R803E/K804E in intracellular loop 3 nearly abolished the Gq coupling activity of ADGRG2 but did not have significant effects on intracellular cAMP levels compared with the WT ADGRG2. Thus, the ‘DRY/HMY’ motif mutant is a G-protein dysfunctional mutant for both Gs and Gq signaling, Y698A and F705A are specific Gs-defective mutants, and Y708A and R803E/K804E are specific Gq-defective mutants of ADGRG2 (Figure 11B–C).
Figure 11. Key mutations of ADGRG2 downregulates CFTR Cl- currents through G protein signaling.
(A) Schematic representation of the location of the selected ADGRG2 mutants in intracellular loop 2 and loop 3 of ADGRG2. (B) Effects of the overexpression of ADGRG2 (n = 6) and its mutations (n = 6) on cAMP levels. (C) Effects of the overexpression of ADGRG2 (n = 6) and its mutations (n = 6) on NFAT-DLR activation. (D) Whole-cell Cl- currents recorded with a CsCl pipette solution in HEK293 cells overexpressing CFTR, CFTR and ADGRG2-WT, CFTR and ADGRG2-HM696AA, CFTR and ADGRG2-Y698A, CFTR and ADGRG2-F705A, CFTR and ADGRG2-Y708A or CFTR and ADGRG2-RK803EE. (E) Corresponding I-V curves for the whole-cell Cl- currents recorded in (D). (F) Bar graph representation of average current densities (pA/pF) measured at 100 mV according to (E). (11B-11C and 11F) *p<0.05, **p<0.01, ***p<0.001, cells transfected with ADGRG2-WT or mutants compared with the control plasmid (pCDNA3.1). #p<0.05, ##p<0.01, ###p<0.001, cells overexpressing ADGRG2 mutants compared with ADGRG2-WT. n.s., no significant difference. At least three independent biological replicates were performed for Figure 11B–C,F.
Figure 11—figure supplement 1. Sequence alignment of the transmembrane domains of ADGRG2 (Homo sapiens, Mus musculus, Rattus norvegicus), β2AR (H. sapiens, M. musculus, and R. norvegicus), and GPR126 (H. sapiens).
Figure 11—figure supplement 2. Western blot and ELISA analysis of the expression of these mutants in the cell membrane.
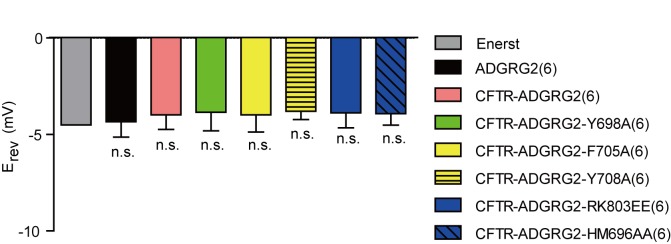
Figure 11—figure supplement 3. Corresponding bar graph of average reversal potential(Erev) (±s.e.m., n = 6 for each condition) recorded in Figure 11D–11E and calculated Nernst potential.
The coupling of these ADGRG2 mutants to CFTR activity was then examined using the whole-cell recording technique. Voltage clamps were used to generate the I-V relationships of the CFTR currents in cells co-transfected with CFTR and ADGRG2 (Figure 11D–F and Figure 11—figure supplement 3). Interestingly, although the mutant with a specific Gs signaling defect showed decreased coupling of ADGRG2 to CFTR, the Gq-dysfunctional mutant and the H696A/M697A double Gs/Gq signaling-defective mutant did not demonstrate coupling between ADGRG2 and CFTR (Figure 11D–F). Taken together, these results demonstrate that specific residues in intracellular loops 2 and 3 are determinants of the G protein subtype coupling of ADGRG2. Furthermore, downstream of ADGRG2, Gq signaling is essential for CFTR activation in recombinant in vitro systems.
Effects of the conditional expression of WT-ADGRG2 or its selective G-subtype signaling mutants on the rescue of reproductive defects in Adgrg2-/Y mice
We next examined how the molecular determinants of ADGRG2/G protein subtype interactions contribute to the function of ADGRG2 infertility in vivo. Both ADGRG2 WT and G protein subtype mutants were conditionally expressed in the efferent ductules via virus infection under the 1 kb ADGRG2 promoter (Figure 12A). Similar to ADGRG2 WT mice, exogenously introduced ADGRG2 WT and mutants specifically localized to the inner surface of the non-ciliated cells of the efferent ductules (Figure 12—figure supplement 1A).
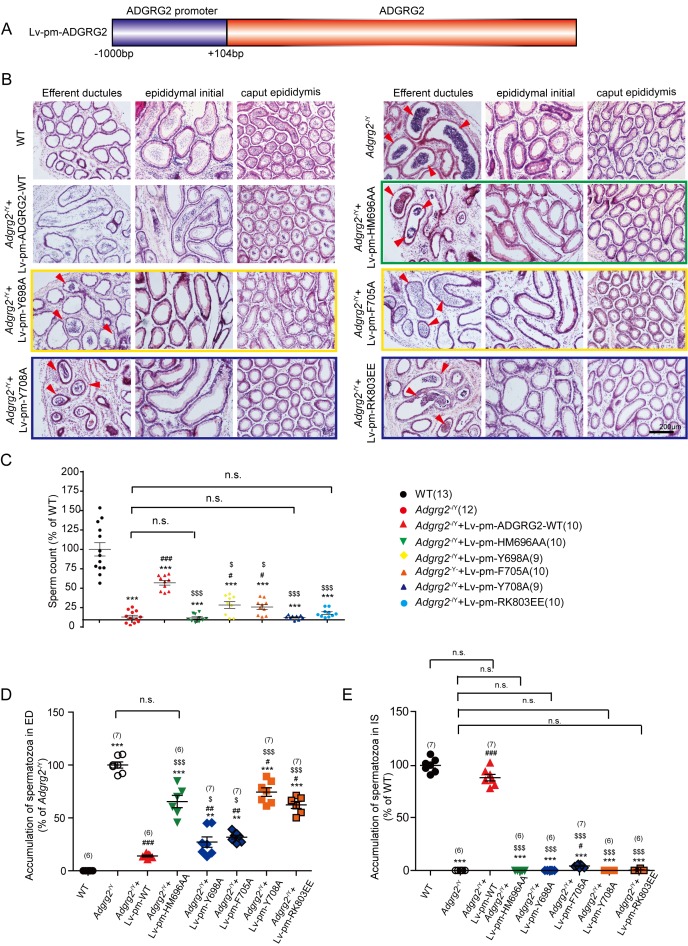
Figure 12. Conditional expression of ADGRG2 wild-type or its selective G-subtype signaling mutants in the efferent ductules in Adgrg2-/Y mice and their effects on the morphology, sperm maturation of efferent ductules.
(A) Schematic representation of the mouse ADGRG2 promoters used in the rescue experiment. (B) Representative hematoxylin-eosin staining of the WT mice, Adgrg2-/Y mice or Adgrg2-/Y mice infected with lentivirus encoding ADGRG2-WT or different G-subtype mutants at the efferent ductules, initial segment or caput of the epididymis. Scale bars, 200 μm. (C) Bar graph representing the quantitative analysis of the number of sperm shown in Figure 12B from at least four independent experiments. (D–E) The corresponding bar graph of the accumulation of spermatozoa according to the hematoxyline-eosin staining of the WT, Adgrg2-/Y mice or Adgrg2-/Y mice infected with lentivirus encoding GRP64-WT or different G subtype mutants at the efferent ductules (D) or initial segment (E) of epididymis. (C–E) *p<0.05, **p<0.01, ***p<0.001; Adgrg2-/Y mice compared with WT mice. #p<0.05, ##p<0.01, ###p<0.001; Adgrg2-/Ymice infected with the lentivirus encoding different ADGRG2 constructs compared with Adgrg2-/Y mice infected with the control lentivirus. $, p<0.05, $$$, p<0.001; Adgrg2-/Ymice infected with the lentivirus encoding different ADGRG2 constructs compared with Adgrg2-/Y mice infected with the ADGRG2-WT lentivirus. n.s., no significant difference. At least three independent biological replicates were performed for Figure 12C–E.
Figure 12—figure supplement 1. Effect of the conditional expression of ADGRG2-WT or its selective G-subtype signaling mutants on the rescue of reproductive defects in Adgrg2-/Y mice.
The efferent ductules of Adgrg2-/Y animals frequently exhibited the accumulation of obstructed spermatozoa compared with observations in WT mice (Figure 12B). The conditional expression of ADGRG2 in non-ciliated cells in Adgrg2-/Y mice significantly reduced this obstruction, whereas the expression of G protein signaling-deficient mutants of ADGRG2, including Y698A, F705A, Y708A, RK803EE and HM696AA, significantly reduced this rescue effect (Figure 12B–E and Figure 12—figure supplement 1B–C). Specifically, conditional infection of the Gs/Gq double signaling-deficient mutant ADGRG2-HM696AA or the Gq signaling-deficient mutants Y708A and RK803EE did not result in differing levels of accumulation in the efferent ductules compared with those in Adgrg2-/Y mice infected with a control virus. The Gs signaling-deficient mutants Y698A and F705A exhibited improved rescue activity compared with the Gq mutants (Figure 12B–E and Figure 12—figure supplement 1B–C).
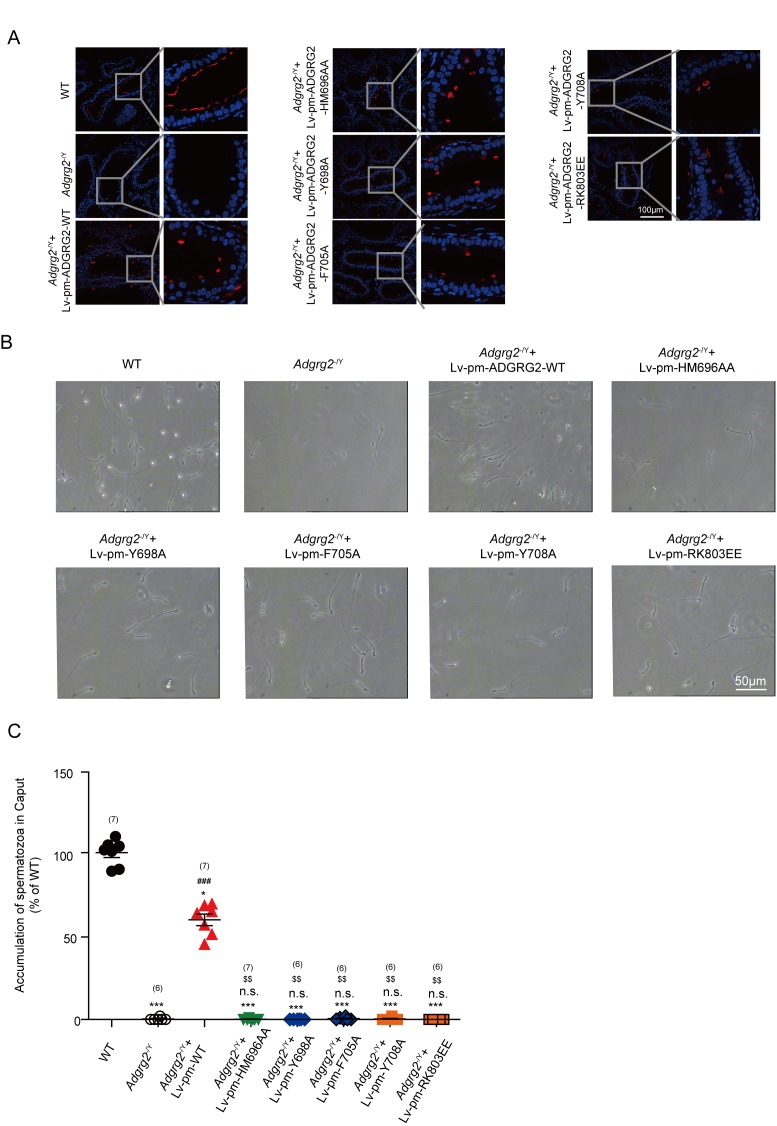
Consistent with observations in the efferent ductules, the lumen of the initial segment and caput region in Adgrg2-/Y mice showed reduced sperm numbers compared with those in WT mice (Figure 12B,D–E and Figure 12—figure supplement 1C). The exogenous introduction of WT ADGRG2 to non-ciliated cells nearly restored the appearance of sperm in the initial segment and significantly increased sperm numbers in the caput (Figure 12B and E and Figure 12—figure supplement 1C). However, introducing any of the Gs or Gq signaling-deficient mutants into Adgrg2-/Y mice did not induce a significant effect on sperm number restoration in these regions (Figure 12B and E and Figure 12—figure supplement 1C).
Sperm prepared from the caudal epididymis were then examined. Adgrg2-/Y mice exhibited significantly reduced sperm numbers and presented morphologically abnormal sperm compared with those of WT mice (Figure 12C and Figure 12—figure supplement 1B). Conditional expression of WT ADGRG2 in the efferent ductules restored sperm numbers in the caudal epididymis by more than half, whereas exogenous introduction of the two Gs-deficient mutants Y698A and F705A into Adgrg2-/Y mice increased sperm numbers by 5–10% compared with those in Adgrg2-/Y mice. Expression of the other 4 Gs-, Gq- or double-deficient mutants did not rescue the phenotype (Figure 12C).
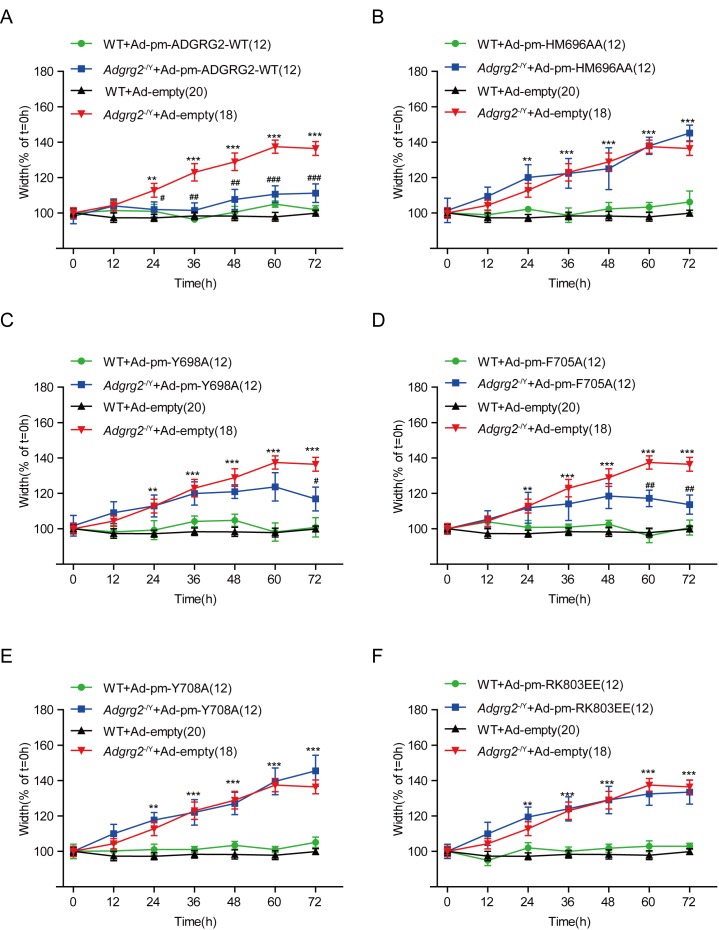
To investigate whether the sperm production phenotype was related to fluid reabsorption, we isolated the efferent ductules after virus infection with the WT ADGRG2 or one of the mutants and measured the luminal area after ligation. Interestingly, conditional expression of the Gs-deficient mutations Y698A and F705A marginally reduced the inflation of the efferent ductules of Adgrg2-/Y mice, whereas the Gq signaling mutants did not exert significant effects on the luminal volume (Figure 13A–F). This result is consistent with the effects of these mutants on sperm numbers in the caudal epididymis, thereby suggesting a direct correlation between efferent ductule reabsorption ability and mature sperm numbers (Figures 12C and 13A–F). Taken together, our results demonstrate that Gq activity is required downstream of ADGRG2, and Gs function contributes to fluid reabsorption in the efferent ductules and sperm transportation.
Figure 13. Effects of conditional expression of ADGRG2 wild-type or its selective G-subtype signaling mutants in Adgrg2-/Y mice on the fluid reabsorption of efferent ductules.
(A) Effects of the expression of the ADGRG2-WT adenovirus on the diameter of the ligated efferent ductules derived from the WT or Adgrg2-/Y mice. (B–F) Effects of the expression of adenovirus encoding different ADGRG2 mutants on the diameter of the ligated efferent ductules derived from the WT (n = 12) or Adgrg2-/Y (n = 12) mice. (A–F) *p<0.05, **p<0.01, ***p<0.001; Adgrg2-/Y mice infected with the empty adenovirus compared with WT mice infected with the empty adenovirus. #p<0.05, ##p<0.01, ###p<0.001; Adgrg2-/Y mice infected with the adenovirus encoding different ADGRG2 constructs compared with Adgrg2-/Y mice infected with the control adenovirus. n.s., no significant difference.
Discussion
Fluid reabsorption is the main function of the efferent ductules and is essential for sperm maturation; it therefore serves as a promising target for the development of new contraceptive methods for men (Hess, 2002). The cell surface orphan receptor ADGRG2 is an X-linked gene specifically expressed in the reproductive system, and recent studies have found that its deficiency results in the dysfunction of fluid reabsorption and male fertility. However, the mechanism by which fluid reabsorption is regulated by ADGRG2 in the efferent ductules remains unclear (Davies et al., 2004). ADGRG2 belongs to the adhesion GPCR (aGPCRs) subfamily, whose members are either structurally essential in specific tissues (VLGR1 participates in forming the ankle link) or critical signaling molecules in the nervous and immune systems (GPR56, CD97 and EMRs) (Purcell and Hall, 2018; Sun et al., 2013; Sun et al., 2016). Although the efferent ductules of Adgrg2-/Y mice exhibit normal morphology, our results here have identified essential signaling roles for ADGRG2 in non-ciliated cells of the efferent ductules to maintain pH homeostasis as well as the basic CFTR outward-rectifying current, which is required for fluid reabsorption and sperm maturation. Currently, there have been no reported endogenous ADGRG2 ligands. While an unknown ADGRG2 agonist may be responsible for ADGRG2 function in the efferent ductules, it is also likely that the constitutive activity of ADGRG2 in non-ciliated cells is sufficient to maintain the basic CFTR current and pH homeostasis, which is supported by our data using both primary ADGRG2 promoter-labeled efferent ductule cells and a recombinant heterologous HEK293 system (Figures 5–7 and Figure 10). Therefore, our results provide an example of the functional relevance of the constitutive activity of aGPCRs. Moreover, there are several examples indicating the constitutive activity of aGPCRs is tunable by mechanical stimulation (Purcell and Hall, 2018; Petersen et al., 2015; Scholz et al., 2015). As ADGRG2 was expressed in efferent ductules that were controlled by extensive tension, it will be interesting to investigate the effects of tension on ADGRG2 functions in future studies.
Downstream of GPCRs, 16 different G protein subtypes and arrestins play important roles in almost every aspect of human physiological processes (Liu et al., 2017; Ning et al., 2015; Yang et al., 2015, 2017). However, the expression and function of five different G protein subtypes as well as arrestins in the efferent ductules have never been systematically investigated. Here, we have determined that the majority of G protein subtypes are expressed in the efferent ductules (Figure 1A and D). Gq activity is essential for male fertility by maintaining basic CFTR activity and pH homeostasis in the efferent ductules (Figure 14). In particular, specific residues in intracellular loops 2 and 3 are structural determinants of the ADGRG2/Gq interaction (Figures 11–14), which mediates the constitutive activity of Gq-PLC-IP3 signaling in non-ciliated cells of the efferent ductules.
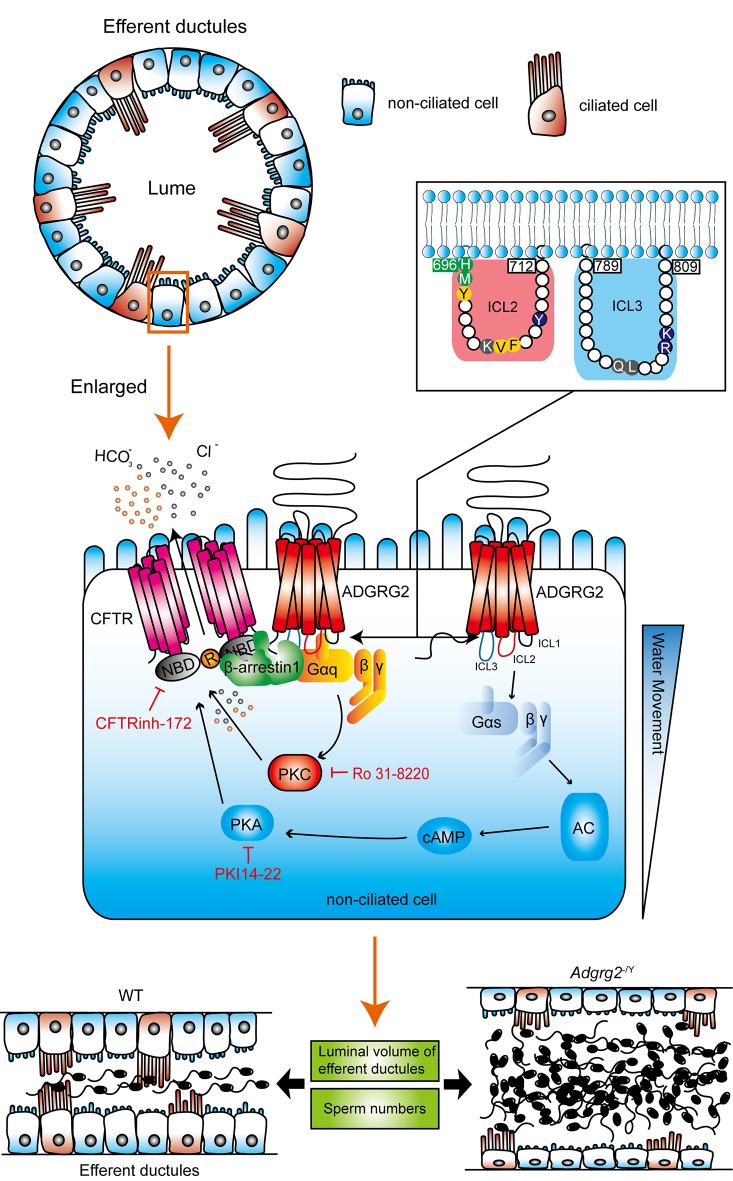
Figure 14. Schematic diagram depicting the GPCR signaling pathway in the regulation fluid reabsorption in the efferent ductules.
The ADGRG2 and CFTR localized at cell plasma membrane, whereas Gs and Gq localize at the inner surface of non-ciliated cells. Deficiency of ADGRG2 in Adgrg2-/Y mice, reducing the Gq protein level by half in Gnaq+/- mice or PKC inhibitor Ro 31–8220 significantly destroyed the coupling of ADGRG2 to CFTR, thus impaired Cl- and H+ homeostasis and fluid reabsorption of efferent ductules. Structurally, residues in intracellular loops 2 and 3 of ADGRG2 are required for the specific interactions between ADGRG2 and Gq, which are required for CFTR and ADGRG2 coupling and fluid reabsorption. In addition to G protein signaling, β-arrestin-1 is also required for fluid reabsorption in efferent ductules by scaffolding the ADGRG2 and CFTR coupling and complex formation. Therefore, a signaling complex including ADGRG2, Gq, β-arrestin-1 and CFTR that specifically localizes in non-ciliated cells is responsible for the regulation of Cl- and H+ homeostasis and fluid reabsorption in the efferent ductules; thus, these functions are important for male fertility. Moreover, activation of the AGTR2 could rescue the H+ metabolic disorder caused by ADGRG2 deficiency, which restored the ability of fluid reabsorption in efferent ductules, providing a potential therapeutic strategy in treatment of male infertility caused by dysfunction of GPCR-CFTR signaling in non-ciliated cells.
Notably, we found that ADGRG2 and Gq regulate fluid reabsorption in the efferent ductules via the activation of CFTR, an important ion channel whose mutation leads to cystic fibrosis (CF). One of the hallmarks of CF is infertility (Cutting, 2015; Massie et al., 2014), which has a 97–98% incidence rate in male CF patients (Chen et al., 2012). CFTR knockout and the application of specific CFTR inhibitors in animal models indicate that CFTR plays important roles in spermatogenesis and sperm capacitation (Chen et al., 2012). Here, we demonstrated the specific co-localization of ADGRG2 and CFTR in the apical membrane in the non-ciliated cells of the efferent ductules (Figure 5 and Figure 9). CFTR was basically active in ADGRG2 promoter-labeled efferent ductule cells, and this activity was significantly decreased by ADGRG2 or Gq deficiency. The application of a specific CFTR inhibitor, CFTRinh-172, consistently pheno-copied the ligated efferent ductules of Adgrg2-/Y mice (Figure 4K). Further pharmacological intervention in the efferent ductules and recombinant experiments in vitro confirmed the coupling of ADGRG2 and CFTR activity through Gq. Moreover, previous studies have shown that PKC phosphorylation is required for subsequent PKA phosphorylation to fully activate CFTR (Chappe et al., 2004; Jia et al., 1997). Our study not only agreed with the observation that PKC and PKA lie downstream of Gq and Gs, respectively, but also suggested that ADGRG2-activated Gq primes the full activation of CFTR in the efferent ductules. Therefore, our results demonstrate that the physiological and functional coupling of ADGRG2 and CFTR mediated by Gq in the non-ciliated cells of the efferent ductules primes the basic activity of CFTR, which is essential for fluid reabsorption. The ADGRG2-Gq-CFTR signaling axis is important to maintain male reproductive functions (Figure 14).
Parallel to G protein signaling, β-arrestins are known to play important roles in almost all GPCR functions (Cahill et al., 2017; Dong et al., 2017; Liu et al., 2017; Yang et al., 2017). Knockout of β-arrestin-1 but not β-arrestin-2 abolished the co-localization of ADGRG2 and CFTR, demonstrating the essential role of β-arrestin-1 in assembling ADGRG2/CFTR/Gq signaling compartmentalization to regulate Cl- and pH homeostasis during fluid reabsorption in the efferent ductules. For decades, GPCR/β-arrestin complexes were thought to play fundamental roles in the internalization and desensitization of G protein signaling. Recently, a mega complex encompassing the GPCR, G trimer proteins and β-arrestins was identified by using an in vitro reconstruction system in HEK293 cells to provide a new paradigm of GPCR signaling (Thomsen et al., 2016). Consistently, we identified the ability of β-arrestin-1 to facilitate ADGRG2/Gq/CFTR signaling compartmentalization, which indicated that such a receptor/G protein/β-arrestin mega complex plays important roles in the regulation of important physiological processes, such as fluid reabsorption in the efferent ductules.
Finally, our results suggest that the inhibition of either CFTR or ADGRG2 impairs the resorptive function of the efferent ductules, which may confer a contraceptive function. Indeed, anti-spermatogenic agents, such as indazole compounds, block CFTR activity (Chen et al., 2005; Gong et al., 2002). Compared with CFTR, which is broadly expressed and has important functions in many tissues, ADGRG2 is specifically expressed in the efferent ductules and epididymis. Contraceptive compounds targeting ADGRG2 may have fewer side effects. Moreover, the dysfunction of ADGRG2 or CFTR is rescued by the activation of AGTR2 in the efferent ductules (Shum et al., 2008). Therefore, a specific agonist of AGTR2 should be considered for the development of therapeutic methods to treat male infertility caused by impaired ADGRG2-Gq-CFTR signaling, such as that observed in CF patients.
Materials and methods
Key resources table.
| Reagent type (species) or resource |
Designation | Source or reference | Identifiers | Additional information |
|---|---|---|---|---|
| Chemical compound, drug | PTX | Enzo | Cat#:BML-G100 | 100 ng/ml |
| Chemical compound, drug | U0126 | Sigma | Cat#:U120 | 10 μM |
| Chemical compound, drug | Ro 31–8220 | Adooq | Cat#:A13514 | 500 nM |
| Chemical compound, drug | NF449 | Tocris | Cat#:1391 | 1 μM |
| Chemical compound, drug | PKI14-22 | Adooq | Cat#:A16031 | 300 nM |
| Chemical compound, drug | H89 | Beyotime | Cat#:S1643 | 500 nM |
| Chemical compound, drug | bumetanide | Aladdin | Cat#:B129942 | 10 μM |
| Chemical compound, drug | Ani9 | Sigma | Cat#:SML1813 | 150 nM |
| Chemical compound, drug | Niflumic acid (NFA) | Aladdin | Cat#:N129597 | 20 μM |
| Chemical compound, drug | DIDS | Sigma | Cat#:D3514 | 20 μM |
| Chemical compound, drug | GlyH-101 | Adooq | Cat#:A13723 | 10 μM |
| Chemical compound, drug | CFTRinh-172 | Adooq | Cat#:A12897 | 10 μM |
| Chemical compound, drug | EGTA | Aladdin | Cat#:E104434 | 5 mM |
| Chemical compound, drug | SKF96365 | Sigma | Cat#:S7809 | 10 μM |
| Chemical compound, drug | Ruthenium red | Sigma | Cat#:R2751 | 10 μM |
| Chemical compound, drug | Nicardipine | Sigma | Cat#:N7510 | 20 μM |
| Chemical compound, drug | LaCl3 | Sigma | Cat#:449830 | 100 μM |
| Chemical compound, drug | IBMX | Sigma | Cat#:I7018 | 100 μM |
| Chemical compound, drug | U73122 | Sigma | Cat#:U6756 | 10 μM |
| Chemical compound, drug | Forskolin | Beyotime | Cat#:S1612 | 10 μM |
| Chemical compound, drug | PD123319 | Adooq | Cat#:A13201 | 1 μM |
| Chemical compound, drug | Candesartan | Adooq | Cat#:A10175 | 1 μM |
| Chemical compound, drug | Amiloride | Aladdin | Cat#:A129545 | 1 mM |
| Chemical compound, drug | Acetazolamide | Medchem express | Cat#:HY-B0782 | 500 μM |
| Peptide, recombinant protein | ANGII | China Peptides | 100 nM | |
| Commercial assay or kit | Carboxy SNARF−1, acetoxymethyl ester | Invitrogen | Cat#:C-1272 | 5 μM |
| Commercial assay or kit | Lipofectamine TM2000 | Invitrogen | Cat#:11668–019 | |
| Commercial assay or kit | Collagenase I | sigma | Cat#:C0130 | |
| Commercial assay or kit | cAMP ELISA kit | R and D systems | Cat#:KGE012B | |
| Commercial assay or kit | IP1 ELISA assay | Shanghai Lanpai Biotechnology Co., Ltd | Cat#:lp034186 | |
| Commercial assay or kit | The dual-luciferase reporter assay system | Promega | Cat#:E1960 | |
| Antibody | ADGRG2 antibody(rabbit polyclonal) | Sigma | RRID:AB_1078923 | |
| Antibody | ADGRG2 antibody(rabbit polyclonal) | Sigma | RRID:AB_2722557 | |
| Antibody | ADGRG2 antibody(sheep polyclonal) | R and D systems | RRID:AB_2722556 | |
| Antibody | CFTR antibody(goat polyclonal) | Santa Cruz | RRID:AB_638427 | |
| Antibody | CFTR antibody(rabbit polyclonal) | Proteintech | RRID:AB_2722558 | |
| Antibody | Gq antibody(goat polyclonal) | Santa Cruz | RRID:AB_2279038 | |
| Antibody | Gq antibody(rabbit polyclonal) | Proteintech | RRID:AB_2111647 | |
| Antibody | Flag antibody(mouse monoclonal) | Sigma | RRID:AB_259529 | |
| Antibody | HA antibody(mouse monoclonal) | Santa Cruz | RRID:AB_627809 | |
| Antibody | GAPDH(rabbit monoclonal) | Cell Signaling | RRID:AB_10622025 | |
| Antibody | Gs antibody(rabbit polyclonal) | Proteintech | RRID:AB_2111668 | |
| Antibody | Gi antibody(mouse monoclonal) | Santa Cruz | RRID:AB_2722559 | |
| Antibody | β-arrestin-1 antibody(rabbit polyclonal) | Dr R.J. Lefkowitz | A1CT | |
| Antibody | β-arrestin-2 antibody(rabbit polyclonal) | Dr R.J. Lefkowitz | A2CT | |
| Antibody | ANO1 antibody(rabbit polyclonal) | Proteintech | RRID:AB_2722560 | |
| Antibody | Ezrin antibody(rabbit polyclonal) | Proteintech | RRID:AB_2722561 | |
| Antibody | Acetylated Tubulin(Lys40) Antibody(mouse monoclonal) | Proteintech | RRID:AB_2722562 | |
| Antibody | Donkey anti-sheep IgG(H + L) (secondary antibody) | Abcam | RRID:AB_2716768 | |
| Antibody | Donkey anti-rabbit IgG(H + L) (secondary antibody) | Invitrogen | RRID:AB_2534017 | |
| Antibody | Donkey anti-mouse IgG(H + L) (secondary antibody) | Invitrogen | RRID:AB_141607 | |
| Antibody | Donkey anti-goat IgG(H + L) (secondary antibody) | Invitrogen | RRID:AB_142672, RRID:AB_141788 | |
| Antibody | HRP-conjugated Affinipure Rabbit Anti-Sheep IgG(H + L) | Proteintech | RRID:AB_2722563 | |
| Antibody | HRP-conjugated Affinipure Goat Anti-Rabbit IgG(H + L) | Proteintech | RRID:AB_2722564 | |
| Antibody | HRP-conjugated Affinipure Goat Anti-Rabbit IgG(H + L) | Proteintech | RRID:AB_2722565 |
All other chemicals or reagents were from Sigma unless otherwise specified.
Mice
Mice were individually housed in the Shandong University on a 12:12 light: dark cycle with access to food and water ad libitum. The use of mice were approved by the animal ethics committee of Shandong university medical school (protocol LL-201502036). All animal care and experiments were reviewed and approved by the Animal Use Committee of Shandong University, School of Medicine. Adgrg2+/- mice were obtained from Dr DLL and MYL at East China Normal University, Shanghai, China. Adgrg2-/Y mice and WT mice were generated by crossing WT (C57BL/6J) males mice and Adgrg2+/- females mice. Arrb1-/- and Arrb2-/- mice were obtained from Dr RJ Lefkowitz (Duke University, Durham, NC); Arrb1-/- and WT mice were generated by crossing Arrb1+/- male mice and Arrb1+/- female mice. Arrb2-/- and WT mice mice were generated by crossing Arrb2+/- male mice and Arrb2+/- female mice. Gnaq+/- mice were obtained from Dr JL Liu at Shanghai Jiao Tong University. Gnaq+/- mice and WT mice were generated by crossing Gnaq+/- male mice and Gnaq+/- female mice. All C57BL/6J male mice were purchased from Beijing Vital River Laboratory Animal Technology.
Genotyping the Adgrg2-/Y KO mice
Genotyping of the intercrossed mice were examined using following primers: Fcon (Forward-control): TTTCATAGCCAGTGCTCACCTG, Fwt (Forward-wild-type): CCTGTTGGCAGACCTGAAG, Fmut (Forward-mutant): CTGTTGGCAGACCTTTTGTATATC, R (Reverse-general): CTTCCTAACATGTGCCATGGC. For the wild-type Adgrg2+/Y mice, Fcon, Fwt and R primers were used to generate two PCR products (189 bp, 397 bp); and Fcon, Fmut and R primers were used to generate one PCR product (397 bp). For the mutant Adgrg2-/Y, Fcon, Fwt and R primers were used to generate one PCR product (405 bp); and Fcon, Fmut and R primers were used to generate two PCR products (196 bp, 405 bp). The female mice were genotyped by the same method. The knockout of ADGRG2 in these mice was confirmed by western blotting.
Preparation of the membrane fraction of the epididymis and efferent ductules
The membrane fraction of the epididymis or efferent ductules was prepared from pooled mouse tissues (n = 4–6). These tissues (epididymis or efferent ductules) were dounced in a glass tube within ten volumes of homogenization buffer (75 mM Tris-Cl, pH 7.4; 2 mM EDTA, and 1 mM DTT supplemented with protease inhibitor cocktail). The dounced suspension was centrifuged at 1000 rpm for 15 min to discard the unbroken tissues. The collected suspensions were then centrifuged at 17,000 rpm for 1 hr to prepare the plasma membrane fraction. For the western blot or immunoprecipitation assays, the membranes were re-suspended in lysis buffer (50 mM Tris pH 8.0; 150 mM NaCl; 10% glycerol; 0.5% NP-40; 0.5 mM EDTA; and 0.01% DDM supplemented with protease inhibitor cocktail (Roche, Basel Switzerland) for 30 min.
Isolation and ligation of efferent ductules
The efferent ductules were microdissected into 1–1.5 mm lengths and incubated for 24 hr in M199 culture medium containing nonessential amino acids (0.1 mM), sodium pyruvate (1 mM), glutamine (4 mM), 5α-dihydrotestosterone (1 nM), 10% fetal bovine serum, penicillin (100 IU/ml), and streptomycin (100 μg/ml) at 34°C in 95% humidified air and 5% CO2. The segments were then ligated on two ends to exclude the entry and exit of fluids. Digital images of the ductules were analyzed at 0, 3, 12, 24, 36, 48, 60 and 72 hr after ligation. Damaged ductal segments were discarded. A rapid ciliary beat and clear lumens were used as evaluation standards for ductile segments that had undergone ligation. Between 9 and 36 total ductal segments from at least three mice were analyzed for each group. The differences between the means were calculated by one-way or two-way ANOVA.
Recombinant adenovirus construction (Wang et al., 2009)
The recombinant adenovirus carrying the RFP or ADGRG2 gene with the ADGRG2 promoter (pm-ADGRG2) from the epididymal genome was produced in our laboratory using the AdEasy system for the rapid generation of recombinant adenoviruses according to the established protocol (Luo et al., 2007). An adenovirus carrying green fluorescent protein (GFP) was used as a control. For the in vivo studies, a single exposure to 5 × 10⁸ plaque-forming units (pfu) of pm-RFP or pm-ADGRG2 adenovirus was delivered to isolated efferent ductules and incubated for 24 hr to allow for sufficient infection. Epididymal efferent ductules or epididymal efferent ductule epithelium were prepared for further experiments.
Measurement of intracellular pH (pHi) with carboxy-SNARF−1
Digital images of the ductules were analyzed at 36 hr after ligation. Intracellular pH is examined with SNARF-1, a pH-sensitive fluorophore with a pKa of about 7.5. To load SNARF-1, cultured ductules were incubated with 5 μM SNARF-1-AM (diluted from a 1 mM stock solution in DMSO) for 45 min in culture medium at 37°C, 5% CO2. The cells are washed twice with buffer containing 110 mM NaCl, 5 mM KCl, 1.25 mM CaCl2, 1.0 mM Mg2SO4, 0.5 mM Na2HPO4, 0.5 mM KH2PO4, and 20 mM HEPES, pH 7.4, then placed on the microscope stage in buffer containing 5 mM KCl, 110 mM NaCl, 1.2 mM NaH2PO4, 25 mM NaHCO3, 30 mM glucose, 10 U/ml penicillin, 10 μg/ml streptomycin, and 25 mM HEPES, pH 7.30. The fluorescence was examined using an LSM 780 laser confocal fluorescence microscope (Carl Zeiss) with the excitation wavelength at 488 nm. The emissions of SNARF-1 at 590 and 635 nm were captured in the first two consecutive scans.
Intracellular pH calibration (Seksek et al., 1991)
In vivo pH calibration was performed according to the method developed by Seksek et al. Briefly, after incubation with the fluorescent probe, cells were washed in a buffer containing 10 mM Hepes, 130 mM KCl, 20 mM NaCl, 1 mM CaCl2, 1 mM KH2PO4, 0.5 mM MgSO4, at various pH values obtained by addition of small amounts of 0.1 M solutions of KOH or HCl. The pH changes of the external buffer of the cell suspension were followed with a Tacussel Isis 20000 pH-meter. Addition of nigericin (1 pg/ml) and valinomycin (5 pM) allowed an exchange of K+ for H+ which resulted in a rapid equilibration of external and internal pH. The fluorescence of the probe was excited at 488 nm, then the emission of SNARF-1 at 590 and 635 nm were captured in the first two consecutive scans. The fluorescent ratio values obtained for each pH point were used for the calibration curve obtained with Prism software, from which pHi values of the samples (6.0–8.5) were determined. Determinations were performed in quintuplicate. The sensor does not have significant effects on cell viability.
The effect of bicarbonate on intracellular pH was determined by incubating ductules in culture medium containing 25 mM bicarbonate for 40 min at 37°C, and then transferring these ductules into bicarbonate-free salt solution and then the fluorescence of the SNARF-1 probe was examined (Teti et al., 1989). Bicarbonate-free solutions were prepared by substituting NaHCO3 with Na- gluconate and equilibrating with air.
1 mM amiloride or 500 μM acetazolamide were added 100 s after the beginning of the measurement to examine the effects of acetazolamide and amiloride.
Quantitative real-time PCR
Total RNA from the mouse efferent ductules was extracted using a standard TRIzol RNA isolation method (Invitrogen, Carlsbad, CA) as previously described (Wang et al., 2014). The reverse transcription and PCR experiments were performed with the Revertra Ace qPCR RT Kit (TOYOBO FSQ-101) using 0.5 μg of each sample, according to the manufacturer’s protocols. The quantitative real-time PCR was conducted in the LightCycler apparatus (Bio-Rad) using the FastStart Universal SYBR Green Master (Roche). The qPCR protocol was as follows: 95°C for 10 min; 40 cycles of 95°C for 15 s and 60°C for 1 min; and then increasing temperatures from 65°C to 95°C at 0.1 °C/s. The mRNA level was normalized to GAPDH in the same sample and then compared with the control. All primers are listed in Supplementary file 1 and Supplementary file 2.
Immunofluorescence staining
The mice were decapitated, and the epididymis and efferent ductules were removed immediately. After dissection, the epididymis and efferent ductules were fixed in 4% paraformaldehyde by immersion overnight at 4°C. The fixed tissues were then rinsed for 4 hr at 4°C in PBS containing 10% sucrose, for 8 hr in 20% sucrose, and then overnight in 30% sucrose. The tissues were embedded in Tissue-Tek OCT compound (Sakura Fintek USA, Inc., Torrance, CA) and then mounted and frozen at −25°C. Subsequently, 8-μm-thick coronal serial sections were cut at the level of the efferent ductules and mounted on poly-D-lysine-coated slides. The slides were incubated in citrate buffer solution for antigen retrieval. Non-specific binding sites were blocked with 2.5% (wt/vol) BSA, 1% (vol/vol) donkey serum and 0.1% (vol/vol) Triton X-100 in PBS for 1 hr. After blocking, the slides were incubated in primary antibody against ADGRG2 (1:300), CFTR (1:50), Gs (1:20), Gq (1:20), ANO1(1:50), Anti-ezrin(1:50) or Anti-Acetylated Tubulin(Lys40)(1:50) at 4°C overnight. Subsequently, the slides were incubated for 1.5 hr with the secondary antibody (1:500, Invitrogen) at room temperature. For nuclear staining, the slides were incubated with DAPI (1:2000, Beyotime) for 15 min at room temperature. The immunofluorescence results were examined using a LSM 780 laser confocal fluorescence microscope (Carl Zeiss). The normal saline group was treated as the control.
Culture of mouse epididymal efferent duct epithelium (Leung et al., 2001)
After opening the lower abdomen, the efferent ductules were isolated under sterile conditions to remove fat or connective tissue. The ductules were severed into small segments and then transferred to Hanks balanced salt solution (HBSS) containing 0.2% (w/v) collagenase I and 0.1% (w/v) trypsin. Subsequently, the ductules were incubated at 34°C for 1 hr with vigorous shaking (150 strokes/min) and then separated by centrifugation at 800 g for 5 min. The pellets were re-suspended in HBSS containing collagenase I 0.2% (w/v) for 30 min at 34°C with vigorous shaking. The solutions were then centrifuged again at 800 g for 5 min, and the cell pellets were re-suspended in HBSS buffer containing 0.2% (w/v) collagenase I and then subjected to repeated pipetting for 15 min. Finally, the cells were centrifuged at 800 × g again for 5 min and resuspended in M199 medium. The cell suspension was incubated at 34°C for 5–6 hr in 5% CO2. The resulting fibroblasts and smooth muscle cells were attached to the bottom of the culture flask, whereas the epithelial cells were in suspension. The suspensions were collected, and the epithelial cells were seeded on culture flasks.
Constructs
The wild-type ADGRG2 full-length (ADGRG2FL) plasmid was obtained from Professor Xu Z. G. at Shandong University School of Life Sciences, Jinan, Shandong, China. ADGRG2 was cloned from mouse total cDNA libraries using the following primers: forward, ATTCTCGAGGATGCTTTTCTCTGGTGGG; and reverse, ATTGAATTCCATTTGCTCGATAAAGTG. The sequences were inserted into the mammalian pEGFP-N2 expression vector, and then ADGRG2FL and ADGRG2 C-terminal truncations (ADGRG2β) were subcloned into the pcDNA3.1 expression vector, with the flag sequence added at the N-terminus. The ADGRG2FL mutants (HM696AA, H696A, M697A, Y698A, K703A, V704A, F705A, Y708A, QL798AA, RK803EE) were generated using a QuikChange Mutagenesis Kit (Stratagene). All of the mutations were verified by DNA sequencing. All primers are listed in Supplementary file 3.
Cell culture, transfection, and western blotting
HEK293 cells were obtained from Cell Resource Center of Shanghai Institute for Biological Sciences(Chinese Academy of Sciences, Shanghai, China). The cell line was validated by STR profiling (Shanghai Biowing Applied Biotechnology (SBWAB) Co. Ltd.) and was negative for mycoplasma as measured by MycoAlert Mycoplasma Detection Kit (Lonza). HEK293 cells were maintained in Dulbecco’s modified Eagle’s medium (DMEM) supplemented with 10% heat-inactivated fetal bovine serum (Hyclone Thermo Scientific, Scoresby, Victoria, Australia), penicillin (100 IU/ml), and streptomycin (100 μg/ml) as previously described (Hu et al., 2014; Wang et al., 2014). For receptor or other protein expression, plasmids carrying the desired genes were transfected into cells using Lipofectamine TM 2000 (Invitrogen). To monitor the protein expression levels, cells were collected 48–72 hr post-transfection with lysis buffer (50 mM Tris, pH 8.0; 150 mM NaCl; 1 mM NaF; 1% NP-40; 2 mM EDTA; Tris-HCl, pH 8.0; 10% glycerol; 0.25% sodium deoxycholate; 1 mM Na3VO4; 0.3 μM aprotinin; 130 μM bestatin; 1 μM leupeptin; 1 μM repstatin; and 0.5% IAA). The cell lysates were subjected to end-to-end rotation for 20 min and spun at 12,000 rpm for 20 min at 4°C. Then, an equal volume of 2 × loading buffer was added. Proteins were denatured in the loading buffer and subjected to western blot analysis. The protein bands from the western blot were quantified using ImageJ software (National Institutes of Health, Bethesda MD). Each experiment was repeated at least in triplicate. A data analysis was conducted using GraphPad software.
Co-immunoprecipitation
The efferent ductules of WT or Adgrg2-/Y mice were dissected into small pieces. The interaction between proteins is stabilized by addition of 1 ml of cross-linker buffer (D-PBS containing 10 mM HEPES and 2.5 mM DSP in 1:1 (v/v) dimethyl sulfoxide (DMSO)) as previously described(Ning et al., 2015; Yang et al., 2015). After continuous slow agitation for 30 min at room temperature, crosslinking was stopped by adding 25 mM Tris-HCl (pH 7.5) and incubated for another 15 min. The tissue were washed with cold PBS and then lysed in cold lysis buffer with protease inhibitors. After centrifugation, the supernatants were incubated with anti-ADGRG2 antibody (AF7977, R and D systems) for at least 2 hr at 4°C. Next, Protein A/G PLUS-Agarose (sc-2003, Santa Cruz) was added, and the complexes were incubated overnight at 4°C. The beads were washed with PBS buffer several times, and proteins were denatured in the SDS-PAGE loading buffer and subjected to western blot analysis with the indicated antibodies.
Whole-cell patch-clamp recording (Guo et al., 2014)
The efferent ductules infected by adenovirus with the ADGRG2 promoter were isolated, and epithelial cells were purified and cultured on coverslips before the patch-clamp recording. ADGRG2-promoter labeling was achieved by observation of the RFP fluorescence with the microscope. HEK293 cells transfected with plasmids encoding CFTR together with or without the ADGRG2 wild type or its mutants were cultured on coverslips before the patch-clamp recording. Borosilicate glass-made patch pipettes (Vitrex, Modulohm A/S, Herlev, Denmark) were pulled with a micropipette puller (P-97, Sutter Instrument Co.) to a resistance of 5–7 MΩ after they were filled with pipette solution. The ionic current was recorded with a data acquisition system (DigiData 1322A, Axon Instruments) and an amplifier (Axopatch-200B, Axon Instruments, Foster City, CA). The command voltages were controlled by a computer equipped with pClamp Version nine software. For the whole cell Cl- current measurement, cells were bathed in a solution of NaCl at 130 mM, KCl at 5 mM, MgCl2 at 1 mM, CaCl2 at 2.5 mM, and HEPES 20 mM, and D-mannitol was added to an osmolarity of 310 (pH 7.4). Pipettes were filled with a solution of 101 mM CsCl, 10 mM EGTA, 10 mM Hepes, 20 mM TEACl, 2 mM MgATP, 2 mM MgCl2, 5.8 mM glucose, pH7.2, with D-mannitol compensated for osm 290. When the whole-cell giga-seal was formed, the capacitance of the cell was measured. The whole-cell current was obtained by a voltage clamp with the commanding voltage elevated from −100 mV to +100 mV in 20 mV increments (Yu et al., 2011). Further validation of these observed currents were Cl- selective was provided by experiments in which 100 mM of the extracellular Cl- was replaced by gluconate.
cAMP ELISA
The efferent ductules were carefully microdissected under sterile conditions to remove fat or connective tissue and then were ligated on two ends to exclude the entry and exit of fluids. After 24 hr, these tissues were rinsed with PBS and homogenized with a tissue homogenizer in cold 0.1 N HCl containing 500 μM IBMX at a 1:5 ratio (w/v). The supernatants were collected after the centrifugation of the tissue lysates at 10,000 × g and then neutralized with 1 N NaOH. The supernatant was collected for the cAMP determination by ELISA according to the manufacturer’s instructions.
IP1 ELISA
The efferent ductules were ligated on two ends for 24 hr, and then were added 5 mM ATP or control vehicles to the tissues for 30 min. After half an hour, the tissues were homogenized with a tissue homogenizer in an assay buffer (10 mM HEPES, 1 mM CaCl2, 0.5 mM MgCl2, 4.2 mM KCl, 146 mM NaCl, 5.5 mM glucose, 50 mM LiCl, pH 7.4). The 50 mM LiCl was added to block the IP1 degradation. The lysates were centrifuged at 10,000 × g to remove insoluble components, and the supernatant was then collected for IP1 determination by ELISA (lp034186) according to the manufacturer’s instructions.
GloSensor cAMP assay
The GloSensor cAMP assay was performed as previously described (Binkowski et al., 2009; Fan et al., 2008; Hu et al., 2014; Kimple et al., 2009). HEK293 cells were transfected with the GloSensor plasmid and the desired expression plasmids (0.8 μg of total DNA) with Lipofectamine 2000 in 24-well dishes. Twenty-four hours after transfection, the cells were plated on 96-well plates at a cell density of 20,000 cells/well. The cells were maintained in DMEM for another 24 hr, washed with PBS and then incubated with 100 μl of solution containing 10% FBS, 2% (v/v) GloSensor cAMP reagent and 88% CO2-independent medium in each well for 2 hr. The cAMP signal was examined using a luminescence counter (Mithras LB 940).
NFAT dual-luciferase reporter(DLR) assay (Hu et al., 2014)
HEK293 cells in 24-well dishes were co-transfected with plasmids encoding ADGRG2 or its mutants, pGL4.16-NFAT luciferase or pGL4.16-basic luciferase, and pRL-TK Renilla using Lipofectamine 2000. These cells were cultured for approximately 48 hr and then harvested by the addition of 1 × passive lysis buffer. After incubation for 15 min at room temperature with shaking, the cell lysates were centrifuged for 10 min at 12,000 rpm at 4°C. NFAT-DLR activity was quantified by a standard luciferase reporter gene assay and then normalized to Renilla luciferase activity (Promega) as previously described (Wang et al., 2014). At least three independent experiments were executed for each dual-luciferase reporter (DLR) assay.
Recombinant lentivirus construction and lentivirus injection
Recombinant lentiviruses containing the ADGRG2 gene and its mutants (HM696AA, H696A, M697A, Y698A, K703A, V704A, F705A, Y708A, QL798AA, RK803EE) under the ADGRG2 promoter were produced according to standard procedures (Tiscornia et al., 2006; Ye et al., 2008). The lentivirus titer was 1 × 10⁹ TU/ml. Mice were anesthetized with 10% chloral hydrate and then the conditional expression of ADGRG2-WT or its selective G-subtype signaling mutants’ lentivirus were microinjected into the interstitial space of the efferent ductules and the initial segment of epididymis at a multiplicity of infection of 100. After 14–21 days, the epididymis transfected with lentivirus were collected for use in further experiments.
Histology (Mendive et al., 2006)
The epididymis and efferent ductules were removed and fixed overnight at 4°C in 4% paraformaldehyde and stored in 70% ethanol until further use. The tissues were dehydrated, embedded in paraffin, and then sectioned into 10 μm slices. In most cases, the whole epididymis was sectioned, and representative samples throughout the organ were mounted on slides for hematoxylin and eosin staining. Hematoxylin and eosin staining was performed according to standard procedures.
Analysis of spermatozoa (Davies et al., 2004)
Spermatozoa from the caudal epididymis of the wild-type (n = 13) or Adgrg2-/Y knockout (n = 12) mice (ages between 15 and 20 weeks) were collected. The caudal region from the epididymis was open and incubated for 10 min in PBS at 34°C to allow the spermatozoa to appear. The spermatozoa were counted and analyzed by spreading the diluted homogenous suspension over a microscope slide.
Treatment of mice efferent ductules with CFTR siRNA dicer
CFTR siRNA was designed as described before (Ruan et al., 2012; Wang et al., 2006) and chemically modified by the manufacturer (GenePharma). Sequences corresponding to the siRNA of scrambled were: sense, 5’-CUUCCUCUCU UUCUCUCCCU UGUGA-3’; and antisense, 5’- TCACA AGGGAGAGAA AGAGAGGAAG-3’ or CFTR-specific siRNA-CFTR, dicer-1: sense, 5’-GUGCAAAUUCAGAGCUUUGUGGAACAG-3’; and antisense, 5’- CUGUUCCACAAA GCUCTGAAUUUGCAC-3’; CFTR-specific siRNA-CFTR, dicer-2: sense,5’-GACAACUUGUUAGUCUUCUUUCCAA-3’; and antisense, 5’- UUGGAAAGAAGACUAACAAGUUGUC-3’; CFTR-specific siRNA-CFTR, dicer-3: sense, 5’-GAGAUUGAU GGUGUCUCAUGGAAUU-3’; and antisense, 5’-AAUUCCAUGAGACACCAUCAAUCUC-3’; For in vivo studies, 15 μg of the siRNA dissolved in 30% pluronic gel (Pluronic F-127, Sigma) solution was delivered to the mice efferent ductules immediately as previously described (Wang et al., 2009). After 7 days, the epididymis transfected with siRNA were collected for further experiments.
Statistics
All the western blots were performed independently for at least three times, and the representative experimental results were shown in the main or supplementary figure. All the data are presented as the mean ±SD from at least three independent experiments. Statistical comparisons were performed using an ANOVA with GraphPad Prism5. Significant differences were accepted at p<0.05. The sequence alignments were performed using T-coffee.
Funding Statement
The funders had no role in study design, data collection and interpretation, or the decision to submit the work for publication.
Contributor Information
Dali Li, Email: dlli@bio.ecnu.edu.cn.
Xiao Yu, Email: yuxiao@sdu.edu.cn.
Jin-Peng Sun, Email: sunjinpeng@sdu.edu.cn.
Michel Bagnat, Duke University, United States.
Funding Information
This paper was supported by the following grants:
National Natural Science Foundation of China 31470789 to Jin-Peng Sun.
National Natural Science Foundation of China 31611540337 to Ka Young Chung, Jin-Peng Sun.
National Natural Science Foundation of China 81773704 to Jin-Peng Sun.
Shandong Natural Science Fund for Distinguished Young Scholars JQ201517 to Jin-Peng Sun.
Shandong Provincial Natural Science Foundation ZR2014CP007 to Dao-Lai Zhang.
National Natural Science Foundation of China 31671197 to Xiao Yu.
The Program for Changjiang Scholars and Innovative Research Team in University IRT13028 to Xiao Yu.
National Natural Science Foundation of China 31471102 to Xiao Yu.
National Science Fund for Distinguished Young Scholars 81525005 to Fan Yi.
Additional information
Competing interests
No competing interests declared.
Author contributions
Data curation, Software, Formal analysis, Funding acquisition, Investigation, Visualization, Methodology, Writing—original draft.
Data curation, Software, Formal analysis, Investigation, Visualization, Methodology, Writing—original draft.
Software, Investigation, Visualization, Methodology.
Software, Investigation, Visualization, Methodology.
Software, Investigation, Methodology.
Investigation, Methodology.
Investigation, Methodology.
Investigation.
Formal analysis.
Supervision.
Investigation, Methodology.
Investigation.
Investigation.
Investigation.
Methodology.
Methodology.
Methodology.
Methodology.
Methodology.
Methodology.
Data curation.
Data curation.
Resources.
Data curation.
Resources.
Resources.
Conceptualization, Data curation, Formal analysis, Supervision, Funding acquisition, Validation, Methodology, Project administration.
Conceptualization, Data curation, Formal analysis, Supervision, Funding acquisition, Validation, Methodology, Writing—original draft, Project administration, Writing—review and editing.
Ethics
Animal experimentation: Mice were individually housed in the Shandong university on a 12:12 light:dark cycle with access to food and water ad libitum.The use of mice was approved by the animal ethics committee of Shandong university medical school (protocol LL-201502036). All animal care and experiments were reviewed and approved by the Animal Use Committee of Shandong University School of Medicine.
Additional files
References
- Alvarez-Curto E, Inoue A, Jenkins L, Raihan SZ, Prihandoko R, Tobin AB, Milligan G. Targeted elimination of G proteins and arrestins defines their specific contributions to both intensity and duration of G protein-coupled receptor signaling. Journal of Biological Chemistry. 2016;291:27147–27159. doi: 10.1074/jbc.M116.754887. [DOI] [PMC free article] [PubMed] [Google Scholar]
- Binkowski B, Fan F, Wood K. Engineered luciferases for molecular sensing in living cells. Current Opinion in Biotechnology. 2009;20:14–18. doi: 10.1016/j.copbio.2009.02.013. [DOI] [PubMed] [Google Scholar]
- Cahill TJ, Thomsen AR, Tarrasch JT, Plouffe B, Nguyen AH, Yang F, Huang LY, Kahsai AW, Bassoni DL, Gavino BJ, Lamerdin JE, Triest S, Shukla AK, Berger B, Little J, Antar A, Blanc A, Qu CX, Chen X, Kawakami K, Inoue A, Aoki J, Steyaert J, Sun JP, Bouvier M, Skiniotis G, Lefkowitz RJ. Distinct conformations of GPCR-β-arrestin complexes mediate desensitization, signaling, and endocytosis. PNAS. 2017;114:2562–2567. doi: 10.1073/pnas.1701529114. [DOI] [PMC free article] [PubMed] [Google Scholar]
- Chappe V, Hinkson DA, Howell LD, Evagelidis A, Liao J, Chang XB, Riordan JR, Hanrahan JW. Stimulatory and inhibitory protein kinase C consensus sequences regulate the cystic fibrosis transmembrane conductance regulator. PNAS. 2004;101:390–395. doi: 10.1073/pnas.0303411101. [DOI] [PMC free article] [PubMed] [Google Scholar]
- Chen H, Ruan YC, Xu WM, Chen J, Chan HC. Regulation of male fertility by CFTR and implications in male infertility. Human Reproduction Update. 2012;18:703–713. doi: 10.1093/humupd/dms027. [DOI] [PubMed] [Google Scholar]
- Chen XK, Wang LC, Zhou Y, Cai Q, Prakriya M, Duan KL, Sheng ZH, Lingle C, Zhou Z. Activation of GPCRs modulates quantal size in chromaffin cells through G(betagamma) and PKC. Nature Neuroscience. 2005;8:1160–1168. doi: 10.1038/nn1529. [DOI] [PubMed] [Google Scholar]
- Cutting GR. Cystic fibrosis genetics: from molecular understanding to clinical application. Nature Reviews Genetics. 2015;16:45–56. doi: 10.1038/nrg3849. [DOI] [PMC free article] [PubMed] [Google Scholar]
- Davies B, Baumann C, Kirchhoff C, Ivell R, Nubbemeyer R, Habenicht UF, Theuring F, Gottwald U. Targeted deletion of the epididymal receptor HE6 results in fluid dysregulation and male infertility. Molecular and Cellular Biology. 2004;24:8642–8648. doi: 10.1128/MCB.24.19.8642-8648.2004. [DOI] [PMC free article] [PubMed] [Google Scholar]
- DeVree BT, Mahoney JP, Vélez-Ruiz GA, Rasmussen SG, Kuszak AJ, Edwald E, Fung JJ, Manglik A, Masureel M, Du Y, Matt RA, Pardon E, Steyaert J, Kobilka BK, Sunahara RK. Allosteric coupling from G protein to the agonist-binding pocket in GPCRs. Nature. 2016;535:182–186. doi: 10.1038/nature18324. [DOI] [PMC free article] [PubMed] [Google Scholar]
- Dong JH, Wang YJ, Cui M, Wang XJ, Zheng WS, Ma ML, Yang F, He DF, Hu QX, Zhang DL, Ning SL, Liu CH, Wang C, Wang Y, Li XY, Yi F, Lin A, Kahsai AW, Cahill TJ, Chen ZY, Yu X, Sun JP. Adaptive activation of a stress response pathway improves learning and memory through Gs and β-Arrestin-1-regulated lactate metabolism. Biological Psychiatry. 2017;81:654–670. doi: 10.1016/j.biopsych.2016.09.025. [DOI] [PMC free article] [PubMed] [Google Scholar]
- Estévez R, Boettger T, Stein V, Birkenhäger R, Otto E, Hildebrandt F, Jentsch TJ. Barttin is a Cl- channel beta-subunit crucial for renal Cl- reabsorption and inner ear K+ secretion. Nature. 2001;414:558–561. doi: 10.1038/35107099. [DOI] [PubMed] [Google Scholar]
- Fan F, Binkowski BF, Butler BL, Stecha PF, Lewis MK, Wood KV. Novel genetically encoded biosensors using firefly luciferase. ACS Chemical Biology. 2008;3:346–351. doi: 10.1021/cb8000414. [DOI] [PubMed] [Google Scholar]
- Gong XD, Linsdell P, Cheung KH, Leung GP, Wong PY. Indazole inhibition of cystic fibrosis transmembrane conductance regulator Cl(-) channels in rat epididymal epithelial cells. Biology of Reproduction. 2002;67:1888–1896. doi: 10.1095/biolreprod.102.007450. [DOI] [PubMed] [Google Scholar]
- Gottwald U, Davies B, Fritsch M, Habenicht UF. New approaches for male fertility control: HE6 as an example of a putative target. Molecular and Cellular Endocrinology. 2006;250:49–57. doi: 10.1016/j.mce.2005.12.024. [DOI] [PubMed] [Google Scholar]
- Guo JH, Chen H, Ruan YC, Zhang XL, Zhang XH, Fok KL, Tsang LL, Yu MK, Huang WQ, Sun X, Chung YW, Jiang X, Sohma Y, Chan HC. Glucose-induced electrical activities and insulin secretion in pancreatic islet β-cells are modulated by CFTR. Nature Communications. 2014;5:4420. doi: 10.1038/ncomms5420. [DOI] [PMC free article] [PubMed] [Google Scholar]
- Haithcock D, Jiao H, Cui XL, Hopfer U, Douglas JG. Renal proximal tubular AT2 receptor: signaling and transport. Journal of the American Society of Nephrology : JASN. 1999;10:S69–74. [PubMed] [Google Scholar]
- Hamada AJ, Montgomery B, Agarwal A. Male infertility: a critical review of pharmacologic management. Expert Opinion on Pharmacotherapy. 2012;13:2511–2531. doi: 10.1517/14656566.2012.740011. [DOI] [PubMed] [Google Scholar]
- Hamann J, Aust G, Araç D, Engel FB, Formstone C, Fredriksson R, Hall RA, Harty BL, Kirchhoff C, Knapp B, Krishnan A, Liebscher I, Lin HH, Martinelli DC, Monk KR, Peeters MC, Piao X, Prömel S, Schöneberg T, Schwartz TW, Singer K, Stacey M, Ushkaryov YA, Vallon M, Wolfrum U, Wright MW, Xu L, Langenhan T, Schiöth HB. International union of basic and clinical pharmacology. XCIV. adhesion G protein-coupled receptors. Pharmacological Reviews. 2015;67:338–367. doi: 10.1124/pr.114.009647. [DOI] [PMC free article] [PubMed] [Google Scholar]
- Harvey WR. Physiology of V-ATPases. The Journal of Experimental Biology. 1992;172:1–17. [PubMed] [Google Scholar]
- Hendry WF, Levison DA, Parkinson MC, Parslow JM, Royle MG. Testicular obstruction: clinicopathological studies. Annals of the Royal College of Surgeons of England. 1990;72:396–407. [PMC free article] [PubMed] [Google Scholar]
- Hess RA, Bunick D, Lee KH, Bahr J, Taylor JA, Korach KS, Lubahn DB. A role for oestrogens in the male reproductive system. Nature. 1997;390:509–512. doi: 10.1038/37352. [DOI] [PMC free article] [PubMed] [Google Scholar]
- Hess RA. The Efferent Ductules: Structure and Functions. 2002. [Google Scholar]
- Hu QX, Dong JH, Du HB, Zhang DL, Ren HZ, Ma ML, Cai Y, Zhao TC, Yin XL, Yu X, Xue T, Xu ZG, Sun JP. Constitutive Gαi coupling activity of very large G protein-coupled receptor 1 (VLGR1) and its regulation by PDZD7 protein. The Journal of Biological Chemistry. 2014;289:24215–24225. doi: 10.1074/jbc.M114.549816. [DOI] [PMC free article] [PubMed] [Google Scholar]
- Jia Y, Mathews CJ, Hanrahan JW. Phosphorylation by protein kinase C is required for acute activation of cystic fibrosis transmembrane conductance regulator by protein kinase A. Journal of Biological Chemistry. 1997;272:4978–4984. doi: 10.1074/jbc.272.8.4978. [DOI] [PubMed] [Google Scholar]
- Jodar M, Sendler E, Moskovtsev SI, Librach CL, Goodrich R, Swanson S, Hauser R, Diamond MP, Krawetz SA. Absence of sperm RNA elements correlates with idiopathic male infertility. Science Translational Medicine. 2015;7:re296. doi: 10.1126/scitranslmed.aab1287. [DOI] [PMC free article] [PubMed] [Google Scholar]
- Kimple AJ, Soundararajan M, Hutsell SQ, Roos AK, Urban DJ, Setola V, Temple BR, Roth BL, Knapp S, Willard FS, Siderovski DP. Structural determinants of G-protein alpha subunit selectivity by regulator of G-protein signaling 2 (RGS2) Journal of Biological Chemistry. 2009;284:19402–19411. doi: 10.1074/jbc.M109.024711. [DOI] [PMC free article] [PubMed] [Google Scholar]
- Leung GP, Tse CM, Chew SB, Wong PY. Expression of multiple Na+/H+ exchanger isoforms in cultured epithelial cells from rat efferent duct and cauda epididymidis. Biology of Reproduction. 2001;64:482–490. doi: 10.1095/biolreprod64.2.482. [DOI] [PubMed] [Google Scholar]
- Li T, Yu B, Liu Z, Li J, Ma M, Wang Y, Zhu M, Yin H, Wang X, Fu Y, Yu F, Wang X, Fang X, Sun J, Kong W. Homocysteine directly interacts and activates the angiotensin II type I receptor to aggravate vascular injury. Nature Communications. 2018;9:11. doi: 10.1038/s41467-017-02401-7. [DOI] [PMC free article] [PubMed] [Google Scholar]
- Liu CH, Gong Z, Liang ZL, Liu ZX, Yang F, Sun YJ, Ma ML, Wang YJ, Ji CR, Wang YH, Wang MJ, Cui FA, Lin A, Zheng WS, He DF, Qu CX, Xiao P, Liu CY, Thomsen AR, Joseph Cahill T, Kahsai AW, Yi F, Xiao KH, Xue T, Zhou Z, Yu X, Sun JP. Arrestin-biased AT1R agonism induces acute catecholamine secretion through TRPC3 coupling. Nature Communications. 2017;8:14335. doi: 10.1038/ncomms14335. [DOI] [PMC free article] [PubMed] [Google Scholar]
- Liu X, Li T, Riederer B, Lenzen H, Ludolph L, Yeruva S, Tuo B, Soleimani M, Seidler U. Loss of Slc26a9 anion transporter alters intestinal electrolyte and HCO3(-) transport and reduces survival in CFTR-deficient mice. Pflügers Archiv - European Journal of Physiology. 2015;467:1261–1275. doi: 10.1007/s00424-014-1543-x. [DOI] [PMC free article] [PubMed] [Google Scholar]
- Lu M, Dong K, Egan ME, Giebisch GH, Boulpaep EL, Hebert SC. Mouse cystic fibrosis transmembrane conductance regulator forms cAMP-PKA-regulated apical chloride channels in cortical collecting duct. PNAS. 2010;107:6082–6087. doi: 10.1073/pnas.0902661107. [DOI] [PMC free article] [PubMed] [Google Scholar]
- Luo J, Deng ZL, Luo X, Tang N, Song WX, Chen J, Sharff KA, Luu HH, Haydon RC, Kinzler KW, Vogelstein B, He TC. A protocol for rapid generation of recombinant adenoviruses using the AdEasy system. Nature Protocols. 2007;2:1236–1247. doi: 10.1038/nprot.2007.135. [DOI] [PubMed] [Google Scholar]
- Massie J, Castellani C, Grody WW. Carrier screening for cystic fibrosis in the new era of medications that restore CFTR function. The Lancet. 2014;383:923–925. doi: 10.1016/S0140-6736(13)61092-2. [DOI] [PubMed] [Google Scholar]
- Mendive F, Laurent P, Van Schoore G, Skarnes W, Pochet R, Vassart G. Defective postnatal development of the male reproductive tract in LGR4 knockout mice. Developmental Biology. 2006;290:421–434. doi: 10.1016/j.ydbio.2005.11.043. [DOI] [PubMed] [Google Scholar]
- Monk KR, Hamann J, Langenhan T, Nijmeijer S, Schöneberg T, Liebscher I. Adhesion G protein-coupled receptors: from in vitro pharmacology to in vivo mechanisms. Molecular Pharmacology. 2015;88:617–623. doi: 10.1124/mol.115.098749. [DOI] [PMC free article] [PubMed] [Google Scholar]
- Ning SL, Zheng WS, Su J, Liang N, Li H, Zhang DL, Liu CH, Dong JH, Zhang ZK, Cui M, Hu QX, Chen CC, Liu CH, Wang C, Pang Q, Chen YX, Yu X, Sun JP. Different downstream signalling of CCK1 receptors regulates distinct functions of CCK in pancreatic beta cells. British Journal of Pharmacology. 2015;172:5050–5067. doi: 10.1111/bph.13271. [DOI] [PMC free article] [PubMed] [Google Scholar]
- Nistal M, Riestra ML, Galmés-Belmonte I, Paniagua R. Testicular biopsy in patients with obstructive azoospermia. The American Journal of Surgical Pathology. 1999;23:1546–1554. doi: 10.1097/00000478-199912000-00013. [DOI] [PubMed] [Google Scholar]
- Nuber S, Zabel U, Lorenz K, Nuber A, Milligan G, Tobin AB, Lohse MJ, Hoffmann C. β-Arrestin biosensors reveal a rapid, receptor-dependent activation/deactivation cycle. Nature. 2016;531:661–664. doi: 10.1038/nature17198. [DOI] [PMC free article] [PubMed] [Google Scholar]
- Paavola KJ, Stephenson JR, Ritter SL, Alter SP, Hall RA. The N terminus of the adhesion G protein-coupled receptor GPR56 controls receptor signaling activity. Journal of Biological Chemistry. 2011;286:28914–28921. doi: 10.1074/jbc.M111.247973. [DOI] [PMC free article] [PubMed] [Google Scholar]
- Park K, Evans RL, Watson GE, Nehrke K, Richardson L, Bell SM, Schultheis PJ, Hand AR, Shull GE, Melvin JE. Defective fluid secretion and NaCl absorption in the parotid glands of Na+/H+ exchanger-deficient mice. Journal of Biological Chemistry. 2001;276:27042–27050. doi: 10.1074/jbc.M102901200. [DOI] [PubMed] [Google Scholar]
- Petersen SC, Luo R, Liebscher I, Giera S, Jeong SJ, Mogha A, Ghidinelli M, Feltri ML, Schöneberg T, Piao X, Monk KR. The adhesion GPCR GPR126 has distinct, domain-dependent functions in Schwann cell development mediated by interaction with laminin-211. Neuron. 2015;85:755–769. doi: 10.1016/j.neuron.2014.12.057. [DOI] [PMC free article] [PubMed] [Google Scholar]
- Purcell RH, Hall RA. Adhesion G protein-coupled receptors as drug targets. Annual Review of Pharmacology and Toxicology. 2018;58:429–449. doi: 10.1146/annurev-pharmtox-010617-052933. [DOI] [PMC free article] [PubMed] [Google Scholar]
- Rasmussen SG, DeVree BT, Zou Y, Kruse AC, Chung KY, Kobilka TS, Thian FS, Chae PS, Pardon E, Calinski D, Mathiesen JM, Shah ST, Lyons JA, Caffrey M, Gellman SH, Steyaert J, Skiniotis G, Weis WI, Sunahara RK, Kobilka BK. Crystal structure of the β2 adrenergic receptor-Gs protein complex. Nature. 2011;477:549–555. doi: 10.1038/nature10361. [DOI] [PMC free article] [PubMed] [Google Scholar]
- Ruan YC, Shum WW, Belleannée C, Da Silva N, Breton S. ATP secretion in the male reproductive tract: essential role of CFTR. The Journal of Physiology. 2012;590:4209–4222. doi: 10.1113/jphysiol.2012.230581. [DOI] [PMC free article] [PubMed] [Google Scholar]
- Russell JM. Sodium-potassium-chloride cotransport. Physiological Reviews. 2000;80:211–276. doi: 10.1152/physrev.2000.80.1.211. [DOI] [PubMed] [Google Scholar]
- Scholz N, Gehring J, Guan C, Ljaschenko D, Fischer R, Lakshmanan V, Kittel RJ, Langenhan T. The adhesion GPCR latrophilin/CIRL shapes mechanosensation. Cell Reports. 2015;11:866–874. doi: 10.1016/j.celrep.2015.04.008. [DOI] [PubMed] [Google Scholar]
- Seksek O, Henry-Toulmé N, Sureau F, Bolard J. SNARF-1 as an intracellular pH indicator in laser microspectrofluorometry: a critical assessment. Analytical Biochemistry. 1991;193:49–54. doi: 10.1016/0003-2697(91)90042-R. [DOI] [PubMed] [Google Scholar]
- Shum WW, Da Silva N, McKee M, Smith PJ, Brown D, Breton S. Transepithelial projections from basal cells are luminal sensors in pseudostratified epithelia. Cell. 2008;135:1108–1117. doi: 10.1016/j.cell.2008.10.020. [DOI] [PMC free article] [PubMed] [Google Scholar]
- Sun J, Zhang D, Wang Y, Lin H, Yu X, Xu Z. The role of G protein-coupled receptors in cochlear planar cell polarity. The International Journal of Biochemistry & Cell Biology. 2016;77:220–225. doi: 10.1016/j.biocel.2016.02.011. [DOI] [PubMed] [Google Scholar]
- Sun JP, Li R, Ren HZ, Xu AT, Yu X, Xu ZG. The very large G protein coupled receptor (Vlgr1) in hair cells. Journal of Molecular Neuroscience. 2013;50:204–214. doi: 10.1007/s12031-012-9911-5. [DOI] [PubMed] [Google Scholar]
- Teti A, Blair HC, Teitelbaum SL, Kahn AJ, Koziol C, Konsek J, Zambonin-Zallone A, Schlesinger PH. Cytoplasmic pH regulation and chloride/bicarbonate exchange in avian osteoclasts. Journal of Clinical Investigation. 1989;83:227–233. doi: 10.1172/JCI113863. [DOI] [PMC free article] [PubMed] [Google Scholar]
- Thomsen ARB, Plouffe B, Cahill TJ, Shukla AK, Tarrasch JT, Dosey AM, Kahsai AW, Strachan RT, Pani B, Mahoney JP, Huang L, Breton B, Heydenreich FM, Sunahara RK, Skiniotis G, Bouvier M, Lefkowitz RJ. GPCR-G protein-β-arrestin super-complex mediates sustained g protein signaling. Cell. 2016;166:907–919. doi: 10.1016/j.cell.2016.07.004. [DOI] [PMC free article] [PubMed] [Google Scholar]
- Thomson SC, Deng A, Wead L, Richter K, Blantz RC, Vallon V. An unexpected role for angiotensin II in the link between dietary salt and proximal reabsorption. Journal of Clinical Investigation. 2006;116:1110–1116. doi: 10.1172/JCI26092. [DOI] [PMC free article] [PubMed] [Google Scholar]
- Tiscornia G, Singer O, Verma IM. Production and purification of lentiviral vectors. Nature Protocols. 2006;1:241–245. doi: 10.1038/nprot.2006.37. [DOI] [PubMed] [Google Scholar]
- Wang HM, Dong JH, Li Q, Hu Q, Ning SL, Zheng W, Cui M, Chen TS, Xie X, Sun JP, Yu X. A stress response pathway in mice upregulates somatostatin level and transcription in pancreatic delta cells through Gs and β-arrestin 1. Diabetologia. 2014;57:1899–1910. doi: 10.1007/s00125-014-3290-0. [DOI] [PubMed] [Google Scholar]
- Wang L, Zheng J, Bai X, Liu B, Liu CJ, Xu Q, Zhu Y, Wang N, Kong W, Wang X. ADAMTS-7 mediates vascular smooth muscle cell migration and neointima formation in balloon-injured rat arteries. Circulation Research. 2009;104:688–698. doi: 10.1161/CIRCRESAHA.108.188425. [DOI] [PubMed] [Google Scholar]
- Wang Y, Soyombo AA, Shcheynikov N, Zeng W, Dorwart M, Marino CR, Thomas PJ, Muallem S. Slc26a6 regulates CFTR activity in vivo to determine pancreatic duct HCO3- secretion: relevance to cystic fibrosis. The EMBO Journal. 2006;25:5049–5057. doi: 10.1038/sj.emboj.7601387. [DOI] [PMC free article] [PubMed] [Google Scholar]
- Xiao F, Juric M, Li J, Riederer B, Yeruva S, Singh AK, Zheng L, Glage S, Kollias G, Dudeja P, Tian DA, Xu G, Zhu J, Bachmann O, Seidler U. Loss of downregulated in adenoma (DRA) impairs mucosal HCO3(-) secretion in murine ileocolonic inflammation. Inflammatory Bowel Diseases. 2012;18:101–111. doi: 10.1002/ibd.21744. [DOI] [PMC free article] [PubMed] [Google Scholar]
- Xiao Q, Yu K, Perez-Cornejo P, Cui Y, Arreola J, Hartzell HC. Voltage- and calcium-dependent gating of TMEM16A/Ano1 chloride channels are physically coupled by the first intracellular loop. PNAS. 2011;108:8891–8896. doi: 10.1073/pnas.1102147108. [DOI] [PMC free article] [PubMed] [Google Scholar]
- Yang F, Yu X, Liu C, Qu CX, Gong Z, Liu HD, Li FH, Wang HM, He DF, Yi F, Song C, Tian CL, Xiao KH, Wang JY, Sun JP. Phospho-selective mechanisms of arrestin conformations and functions revealed by unnatural amino acid incorporation and (19)F-NMR. Nature Communications. 2015;6:8202. doi: 10.1038/ncomms9202. [DOI] [PMC free article] [PubMed] [Google Scholar]
- Yang Z, Yang F, Zhang D, Liu Z, Lin A, Liu C, Xiao P, Yu X, Sun JP. Phosphorylation of G protein-coupled receptors: from the barcode hypothesis to the flute model. Molecular Pharmacology. 2017;92:201–210. doi: 10.1124/mol.116.107839. [DOI] [PubMed] [Google Scholar]
- Ye Z, Yu X, Cheng L. Lentiviral gene transduction of mouse and human stem cells. Methods in molecular biology. 2008;430:243–253. doi: 10.1007/978-1-59745-182-6_17. [DOI] [PubMed] [Google Scholar]
- Yu YC, Miki H, Nakamura Y, Hanyuda A, Matsuzaki Y, Abe Y, Yasui M, Tanaka K, Hwang TC, Bompadre SG, Sohma Y. Curcumin and genistein additively potentiate G551D-CFTR. Journal of Cystic Fibrosis. 2011;10:243–252. doi: 10.1016/j.jcf.2011.03.001. [DOI] [PMC free article] [PubMed] [Google Scholar]
- Zhou Q, Clarke L, Nie R, Carnes K, Lai LW, Lien YH, Verkman A, Lubahn D, Fisher JS, Katzenellenbogen BS, Hess RA. Estrogen action and male fertility: roles of the sodium/hydrogen exchanger-3 and fluid reabsorption in reproductive tract function. PNAS. 2001;98:14132–14137. doi: 10.1073/pnas.241245898. [DOI] [PMC free article] [PubMed] [Google Scholar]


