

Abstract
Background
Caffeine intake has been inversely associated with Parkinson’s disease (PD) risk. This relationship may be modified by polymorphisms of GRIN2A and CYP1A2 but the results of previous studies have been inconsistent.
Method
We examined the interaction of caffeine intake with GRIN2A-rs4998386 and CYP1A2-rs762551 polymorphisms in influencing PD risk among 829 incident cases of PD and 2,754 matched controls selected among participants in three large prospective ongoing cohorts: the Nurses’ Health Study, the Health Professionals’ Follow-up Study, and the Cancer Prevention Study II Nutrition Cohort. Matching factors included cohort, birth year, source of DNA, date of DNA collection, and race. Relative risks (RRs) and 95% confidence intervals (CI) were estimated using conditional logistic models. Interactions were tested both on the multiplicative scale and on the additive scale.
Results
Overall, caffeine intake was associated with a lower PD risk (adjusted RR for highest vs lowest tertile= 0.70; 95% CI: 0.57, 0.86; p<0.001). In analyses stratified by GRIN2A-rs4998386 genotype, the multivariable-adjusted RR of PD comparing the highest to the lowest tertile of caffeine was 0.69 (95% CI: 0.55, 0.88; p<0.01) among individuals homozygous for the C allele, and 0.85 (95% CI: 0.55, 1.32; p=0.47; pRERI=0.43) among carrier the T allele. Interactions between caffeine and GRIN2A were not significant in either the multiplicative or additive scale. We also did not observe significant interactions for CYP1A2-rs762551 and incident PD risk.
Conclusion
Our findings do not support the hypothesis of an interaction between the GRIN2A-rs4998386 or CYP1A2-rs762551 polymorphism and caffeine intake in determining PD risk.
Keywords: caffeine, Parkinson’s disease, GRIN2A, interaction, CYP1A2
Introduction
Numerous cohort and case-control studies have suggested a large environmental component in predicting Parkinson’s disease (PD) risk.1,2 Among these determinants, caffeine intake is one of the most well-established protective factors of PD.3–8 In 2011, Hamza et al. conducted a genome-wide association and interaction study (GWAIS) in Parkinson’s disease (PD) with the joint test for each SNP’s main effect and its interaction with coffee.9 The investigators identified rs4998386 (C->T) and 11 neighboring SNPs in the GRIN2A gene to have significant interactions with caffeine on PD risk. This interaction is intriguing, because GRIN2A encodes a subunit of the N-methyl-D-aspartate (NMDA) glutamate receptor that regulates excitatory neurotransmissions in the brain and could thus plausibly influence the course of neurodegeneration leading to PD.10–12 The results of subsequent studies, however, have failed to confirm this interaction – in an investigation in Sweden a significant interaction was observed in the opposite direction,13 whereas in a third investigation in a pooled, diverse population from Rochester, Seattle, France, and Denmark, no interactions were found.14
Similarly conflicting results were reported on the caffeine-gene interaction with CYP1A2,15–18 which encodes the cytochrome P450 CYP1A2 enzyme that is responsible for metabolizing over 90% of caffeine into paraxanthine.19,20 Individuals with the rs762551 A->C SNP have lower CYP1A2 inducibility, rendering slower caffeine metabolism.
Important limitations of previous studies include the uncertain representativeness of the control groups, the inclusion of prevalent cases of PD, insufficient matching and adjustment of confounders, and that caffeine consumption was largely assessed retrospectively.
Therefore, we evaluated the presence of additive and multiplicative interaction between caffeine intake and GRIN2A-rs4998386 and CYP1A2-rs762551 polymorphisms on PD risk in a case-control study nested within three longitudinal cohorts.
Methods
Study population
The current study was comprised of participants who provided blood or buccal cell samples from three longitudinal cohorts: the Nurses’ Health Study (NHS), the Health Professionals Follow-up Study (HPFS), and the Cancer Prevention Study II Nutrition Survey cohort (CPS-IIN).
In 1976, the NHS enrolled 121,700 female registered nurses of ages 30–55 who returned mailed, self-administered questionnaires regarding lifestyle factors and disease occurrence. In 1986, the HPFS enrolled 51,529 male health professionals of ages 40–75 who returned similar questionnaires as in the NHS; these questionnaires were collected every two years for both cohorts. Nutritional information, including coffee consumption and other caffeinated beverages, was ascertained via validated semi-quantitative food frequency questionnaire (SFFQ) generally every four years for the NHS and HPFS with an approximately 94% overall response rate.21 Between 1992 and 1993, the CPS-IIN was established as a subgroup of the American Cancer Society CPS-II Cohort, which included 1.2 million American men and women. The CPS-IIN included 184,190 participants (86,404 men and 97,786 women) of ages 50–74 years. Questionnaires were administered in 1992, 1997, and every 2 years thereafter, with the response rate of 90%.22
Blood samples were collected from 1989–1990 in the NHS (n=32,825), 1993–1995 in the HPFS (n=18,159), and 1998–2001 in the CPS-IIN (n=39,371). Participants who had not provided blood samples were invited to provide buccal cell samples. The invitation package for the HPFS included two cytobrushes (one for each cheek), instructions for use, and a consent form for permission to examine genetic markers of diseases. The invitation package for the NHS contained a small empty cup with a cap, a bottle of Scope mouthwash, instructions for use, and a similar consent form. Since the latter procedure produces a higher DNA yield and greater genotyping success, it was chosen over the cytobrush collection procedure used in the HPFS. The buccal sample collection procedure via mouthwash for the CPS-IIN was very similar to that of NHS. In total, buccal samples were collected from an additional 33,744 women from 2002–2004 in the NHS, 13,979 men from 2004–2006 in the HPFS, and approximately 67,000 individuals from 1998–2001 in the CPS-IIN.
Participants were followed from the return date of the baseline questionnaire until the date of first PD symptoms, date of death, date of the latest completed questionnaire or end of follow-up (NHS: June 1980 – 2012; HPFS: January 1986 – 2012; CPS-IIN: October 1999 – 2009), whichever occurred first.
PD case ascertainment and control selection
Individuals who reported PD via biennial self-report questionnaires were asked for permission to contact their neurologist to confirm their diagnoses. We then contacted patients’ neurologists and requested for them to either return a self-administered diagnostic questionnaire that asked to confirm the case or to send a copy of the patient’s medical records. In years prior to 2003, PD cases were considered confirmed if the treating neurologist considered the diagnosis as definite or probable, the final diagnosis of PD by a neurologist was included in the medical record, or the medical record indicated the presence of at least two out of four cardinal signs of PD (among which, one being resting tremor or bradykinesia) in the absence of features indicating other diagnoses. After 2003, a similar procedure was used to identify confirmed PD case with the exception that the medical records were requested from all PD cases and reviewed by a neurologist specializing in movement disorders. We used the diagnosis of the neurologist specializing in movement disorders to determine cases if it differed from that of the original neurologist. Only confirmed cases were included in the analyses.
In NHS and HPFS, between 2 and 6 controls who were alive on the date of the case’s diagnosis and had never reported a diagnosis of PD were randomly selected and matched to the case; for the CPS-IIN cohort, one control was selected per case. Within each cohort, we matched the controls to cases based on sex, birth year (± 1 year), race (white vs. other), source of DNA (blood or buccal smear), and, for participants with blood samples, fasting status (>8 hours vs. less or unknown) and time of blood draw (in 2-hour intervals).
Caffeine and other covariate assessment
Information on lifestyle practices, such as smoking status and physical activity was collected biennially by self-report questionnaires for all cohorts. Dietary data, including coffee and caffeine intake, was collected via self-administered SFFQs every four years for the NHS and HPFS. The SFFQs captured average intake pattern of food and beverages over the past 12 months using nine possible multiple-choice responses for each item’s intake frequency, ranging from “never or less than once per month” to “6 or more times per day”. Information on coffee and caffeine was comprehensively assessed on the 1999 FFQ for the CPS-IIN; therefore, we considered 1999 as the study baseline for the CPS-IIN.
We used the U.S. Department of Agriculture food-composition sources to estimate participants’ reported average intake of one serving of a caffeinated beverage or food into total daily average intake of caffeine using the following caffeine content values: 137 mg caffeine per cup of coffee, 47 mg of caffeine per cup of non-herbal tea, 46 mg of caffeine per can or bottle of cola beverage, and 7 mg per serving of chocolate.23 The reproducibility and validity of the FFQs have been previously reported for the NHS23 and HPFS;24,25 the CPS-IIN cohort used a slightly modified version of the Harvard FFQ which was validated in similar populations.24,25
Laboratory analyses
Genomic DNA was extracted from buffy coat with QIAamp (Qiagen Inc, Chatsworth, CA), which was then genotyped using the TaqMan assay on the ABI PRISM 7900HT Sequence Detection System, a high-throughput real-time PCR system (Applied Biosystems, Foster City, CA).
Statistical analysis
We tested the Hardy-Weinberg equilibrium (HWE) assumption for both the rs4998386 and rs762551 SNP using a χ2 test, comparing the observed to expected genotype frequencies in all of the cohorts. Conditional logistic regression models, which adjust for matching factors, were used to estimate relative risks (RRs) and corresponding 95% confidence intervals (CIs) to assess the association between each of the exposure categories and PD risk.
Using cohort-specific distribution of covariates, we dichotomized total caffeine intake (most recent intake relative to the date of diagnosis for the NHS and HPFS; at baseline for the CPS-IIN) as high caffeine intake compared to low caffeine intake at the median intake level among controls (366.0 mg/day for NHS; 156.5 mg/day for HPFS, 80.8 mg/day for CPS II-N). In addition, we used cohort-specific tertiles of caffeine intake, and, in selected analyses, caffeine as a continuous variable. Physical activity was dichotomized at each cohort’s respective median levels and smoking status was categorized as never/ever. Because the homozygous TT genotype of the rs4998396 SNP was very rare in all of our cohorts (<1%), the CT and TT genotypes were combined for the dominant model of inheritance (i.e., CC vs. CT/TT). The exposure categories were composed of the four possible combinations of the GRIN2A SNP genotypes and dichotomized caffeine levels, among which the reference was the category with low caffeine intake and having a TT or CT genotype (category with lowest PD risk). This design allowed us to calculate two indices of additive interaction: relative excess risk due to interaction (RERI) and the attributable proportion due to interaction (AP). RERI measures whether the joint effect of both exposures is greater than the combined effects of individual exposures while AP measures the proportion of the combined effect due to the interaction. An RERI and AP of 0 suggests exact additivity (i.e., no additive interaction), an RERI or AP >0 indicates presence of super-additive interaction, and an RERI or AP <0 of sub-additive interaction. We calculated the RERI and AP and their 95% CIs by inserting the regression coefficients and covariance matrix from the conditional logistic regression models using SAS into an Excel spreadsheet proposed by Andersson et al.26 To conduct tests of additive interactions, we reversed the coding of both the GRIN2A SNP (i.e., CT/TT vs. CC(ref)) and caffeine categorization (i.e., low vs. high(ref)), as the interpretations of the additive interaction indices are only meaningful for factors with harmful effects.27 In addition, we performed tests of multiplicative interaction between dichotomized caffeine intake and the GRIN2A SNP genotype on the risk of PD by testing the significance of the product term between the SNP and caffeine intake. Multiplicative interaction was also assessed using continuous caffeine intake (per additional 100 mg/day) due to the large variation in caffeine intake across cohorts.
We conducted analyses separately for the NHS and HPFS in addition to combining them to increase power. Because the CPS-IIN lacked sufficient genotyped data, we could not perform cohort-specific analyses for the GRIN2A SNP. Rather, we performed analyses including the CPS-IIN cohort with the health professional cohorts. Since genotyping information for the rs762551 SNP was not available in the CPS-IIN, we performed similar interaction analyses only in the NHS and HPFS using an additive model of inheritance (i.e., per increasing minor allele). We conducted similar analyses with coffee, since it is the main source of caffeine in the cohorts. All statistical analyses were conducted using SAS, version 9.4 (SAS Institute, Cary, NC).
RESULTS
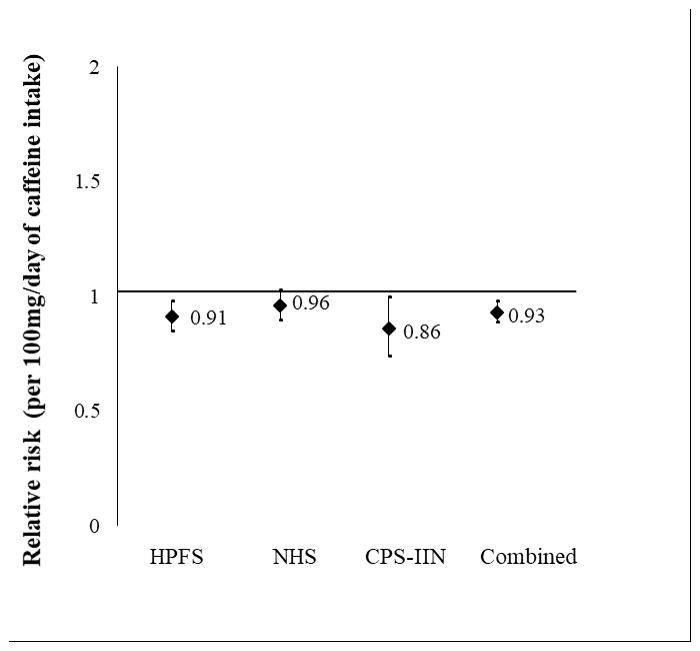
A total of 829 incident PD cases (286 from HPFS; 393 from NHS; 150 from CPS-IIN) were documented and matched with 2,754 controls. The genotype and allele frequencies of the GRIN2A SNP rs4998386 were comparable between cases and controls and the Hardy-Weinberg equilibrium assumption was confirmed in all cohorts (p>0.05) (Table 1). Although there was a trend towards a protective effect among homozygous CC carriers, there was no significant association between the genotype frequencies and PD risk under the dominant model in any of the cohorts. In the combined cohorts (NHS, HPFS, and CPS-IIN), participants had a 7% reduced risk of PD per increasing 100 mg/day of caffeine intake, adjusting for the matching factors (RR= 0.93, 95% CI: 0.89, 0.98; p<0.01) (Figure 1).
Table 1.
Genotype and allele frequencies for GRIN2A rs4998386 in Parkinson’s disease
| Allele frequency (%) | Genotype counts (%) | ||||||||
|---|---|---|---|---|---|---|---|---|---|
|
|
|
||||||||
| N | C | T | HWE P-value |
CC | CT | TT | RR (95% CI) | p-value | |
| HPFS | |||||||||
| PD | 286 | 527 (92.1) | 45 (7.9) | 242 (84.6) | 43 (15.0) | 1 (0.4) | 0.98 (0.68, 1.42)* | 0.92 | |
| Control | 964 | 1,764 (91.5) | 164 (8.5) | 0.40 | 809 (83.9) | 146 (15.2) | 9 (0.9) | 0.95 (0.65, 1.40)** | 0.81 |
|
| |||||||||
| NHS | |||||||||
| PD | 393 | 692 (88.0) | 94 (12.0) | 301 (76.6) | 90 (22.9) | 2 (0.5) | 0.82 (0.63, 1.07)* | 0.15 | |
| Control | 1,625 | 2,902 (89.3) | 348 (10.7) | 0.23 | 1,291 (79.5) | 320 (19.7) | 14 (0.9) | 0.80 (0.61, 1.05)** | 0.11 |
|
| |||||||||
| CPS-IIN† | |||||||||
| PD | 150 | 264 (88.0) | 36 (12.0) | 114 (76.0) | 36 (24.0) | 0 (0.0) | 0.88 (0.50, 1.56)* | 0.66 | |
| Control | 165 | 295 (89.4) | 35 (10.6) | 0.13 | 130 (78.8) | 35 (21.2) | 0 (0.0) | ||
|
| |||||||||
| HPFS, NHS, CPS-IIN | |||||||||
| PD | 829 | 1,483 (89.5) | 175 (10.6) | 657 (79.3) | 169 (20.4) | 3 (0.4) | 0.88 (0.72, 1.07)* | 0.20 | |
| Control | 2,754 | 4,961 (90.1) | 547 (9.9) | 0.38 | 2,230 (81.0) | 501 (18.2) | 23 (0.8) | 0.85 (0.70, 1.05)** | 0.13 |
Dominant model (CC vs. CT/TT)
Model excluding the rs4998386_TT genotype
There were no participants with the TT genotype for CPS-IIN
Figure 1.
Results of the joint effects of GRIN2A SNP genotype and total caffeine intake in the combined cohorts are presented in Supplementary table 1. Participants with the GRIN2A-rs4998386_CC genotype and high caffeine intake had a 26% reduced risk compared to referent group with a CT/TT genotype and low caffeine intake (RR= 0.74, 95% CI: 0.56, 0.99; p=0.04). In addition, participants with high caffeine intake had 19% reduced risk of PD compared to those with low caffeine intake among CC carriers (RR=0.81, 95% CI: 0.67, 0.97; p=0.02). However, these results were attenuated after additional adjustment for smoking status and physical activity (Table 2). There was no sufficient evidence for additive (RERI= −0.11; 95% CI: −0.60, 0.39; pRERI=0.68; AP= −0.08; 95% CI: −0.48, 0.31; pAP= 0.69) or multiplicative interaction (pmult= 0.61), regardless of additional covariate adjustment. Similarly, no significant multiplicative interactions were found between rs4998386 genotype and caffeine intake as a continuous variable (per 100 mg/day) (RR=0.92; CI: 0.82, 1.03; pmult= 0.15).
Table 2.
Interaction between GRIN2A SNP rs4998386 genotype and total caffeine intake on the risk of PD in the NHS, HPFS, and CPS-IIN, adjusting for matching factors, smoking, and physical activity

|
When assessing caffeine intake in tertiles, we found that CC carriers with the highest tertile of caffeine intake had 0.60 times the PD risk compared to CT/TT carriers with the lowest tertile of caffeine intake (95% CI: 0.42, 0.86; p<0.01) (Supplementary table 2). Furthermore, among CC carriers, participants in higher tertiles of caffeine consumption had a significantly decreased risk of PD compared to participants who had the lowest tertile of caffeine consumption (RR2vs1= 0.77; 95% CI: 0.62, 0.96; p=0.02; RR3vs1= 0.66; 95%CI: 0.52, 0.83; p<0.001). However, neither additive interaction nor multiplicative interaction was detected. Further adjustment for smoking status and physical activity did not change results (Table 3). Results of cohort-specific associations are presented in Supplementary tables 3a–d.
Table 3.
Interaction between GRIN2A SNP rs4998386 genotype and total caffeine intake in tertiles on the risk of PD in the NHS, HPFS, and CPS-IIN, adjusting for matching factors, smoking, and physical activity

|
In addition, we tested the caffeine interaction with the CYP1A2 rs762551 polymorphism on PD risk. In the NHS, each increasing minor allele of the CYP1A2 polymorphism was associated with a 42% increased PD risk (p=0.02). However, no significant additive or multiplicative interactions were found between the CYP1A2 rs762551 polymorphism and caffeine on PD risk in any of the cohorts (Table 4 and Supplementary tables 4–6).
Table 4.
Interaction between CYP1A2 SNP rs762551 genotype and total caffeine intake on the risk of PD in the NHS and HPFS, adjusting for matching factors, smoking, and physical activity

|
Discussion
In our present study of three large, prospective cohorts, we found no evidence of an interaction between caffeine intake and GRIN2A rs4998386 or CYP1A2 rs762551 polymorphisms in determining PD risk.
Consistent with the results of previous studies, PD risk decreased with increasing caffeine intake, but this inverse association was similar across genotypes of GRIN2A and CYP1A2, which did not significantly contribute to predict PD risk. In our cohorts, PD risk tended to be lower among carriers of the GRIN2A rs4998386_CC genotype, whereas a couple of previous studies reported a trend toward a protective effect of the T allele.9, 13 Overall, these results are consistent with chance fluctuations and suggest that GRIN2A is not a determinant of PD risk and does not modify the effects of caffeine. Although the median caffeine intake among our three cohorts varied widely, the results were consistent across cohorts without significant heterogeneity in RR estimates.
A limitation of our study is that we may not have had enough power to detect a caffeine-GRIN2A SNP interaction on PD risk. Interaction studies generally require substantially larger sample sizes compared to those required to detect a main effect of the same magnitude; this may explain our lack of association in our cohorts, as Hamza et al. (2011) performed pooled analyses among 2,474 cases and 2,848 controls.9 However, the fact that previous studies reached opposite conclusions with regards to the interaction between caffeine and GRIN2A (i.e. inverse association between caffeine and PD was stronger among carrier of the T allele in one study,9 but among homozygous for the C allele in the others,13,14 Supplementary table 7), is consistent with the conclusion that the relation between caffeine and PD risk is unlikely to be substantially modified by GRIN2A.
Finally, we found that the CYP1A2 rs762551 SNP was associated with an increased risk in the NHS, but not in the HPFS. No interaction was detected between the SNP and caffeine intake on PD risk, which is consistent with studies across multiple cohorts.15,16,18
The main strengths of our study include our nested case-control study design with prospectively collected data. Furthermore, we performed interaction analyses on the multiplicative and additive scale, which could provide more insight and lead to a better understanding of the biological mechanism through which multiple factors are involved in disease pathogenesis. A limitation of our study is the restricted generalizability of our results to other populations, as the participants in our cohorts are predominantly of European descent. However, our homogenous population is instrumental in reducing the risk of confounding by population stratification bias.
In conclusion, our results do not support the hypotheses that caffeine consumption interacts with GRIN2A-rs4998386 SNP or with CYP1A2-rs726551 polymorphisms to affect PD risk.
Supplementary Material
Acknowledgments
CA167552, and by Department of Defense grant W81XWH-14-0131.
Footnotes
Author Contributions:
Drafting/revising the manuscript: I.Y.K., E.J.O., K.C.H., X.G., M.A.S., M.L.M., M.T.H., R.A.B., A.A.
Study concept/design: A.A., X.G., M.A.S.
Analysis or interpretation of design: I.Y.K., E.J.O., K.C.H., X.G., M.A.S., M.L.M., M.T.H., R.A.B., A.A.
Statistical analysis: I.Y.K.
Acquisition of data: X.G., M.A.S., A.Q
Study supervision: A.A.
Obtaining funding: A.A.
Relevant conflicts of interest/financial disclosures:
Dr. Ascherio receives research funding from the National Institutes of Health, the Department of Defense, the National Multiple Sclerosis Society, and the ALS Association. Dr. Gao has served on committee of Parkinson Study Group and received funding from the National Institutes of Health/National Institute of Neurological Disorders and Stroke. All other authors have nothing to report.
References
- 1.Ascherio A, Schwarzschild MA. The epidemiology of Parkinson’s disease: risk factors and prevention. Lancet Neurol. 2016;15:1257–1272. doi: 10.1016/S1474-4422(16)30230-7. [DOI] [PubMed] [Google Scholar]
- 2.Hernán MA, Takkouche B, Caamaño-Isorna F, Gestal-Otero JJ. A meta-analysis of coffee drinking, cigarette smoking, and the risk of Parkinson’s disease: Coffee, Smoking, and PD. Ann Neurol. 2002;52:276–284. doi: 10.1002/ana.10277. [DOI] [PubMed] [Google Scholar]
- 3.Ascherio A, et al. Prospective study of caffeine consumption and risk of Parkinson’s disease in men and women. Ann Neurol. 2001;50:56–63. doi: 10.1002/ana.1052. [DOI] [PubMed] [Google Scholar]
- 4.Hu G, Bidel S, Jousilahti P, Antikainen R, Tuomilehto J. Coffee and tea consumption and the risk of Parkinson’s disease. Mov Disord. 2007;22:2242–2248. doi: 10.1002/mds.21706. [DOI] [PubMed] [Google Scholar]
- 5.Sääksjärvi K, et al. Prospective study of coffee consumption and risk of Parkinson’s disease. Eur J Clin Nutr. 2008;62:908–915. doi: 10.1038/sj.ejcn.1602788. [DOI] [PubMed] [Google Scholar]
- 6.Palacios N, et al. Caffeine and risk of Parkinson’s disease in a large cohort of men and women. Mov Disord. 2012;27:1276–1282. doi: 10.1002/mds.25076. [DOI] [PMC free article] [PubMed] [Google Scholar]
- 7.Liu R, et al. Caffeine Intake, Smoking, and Risk of Parkinson Disease in Men and Women. Am J Epidemiol. 2012;175:1200–1207. doi: 10.1093/aje/kwr451. [DOI] [PMC free article] [PubMed] [Google Scholar]
- 8.Ross G, Abbott RD, Petrovitch H, et al. Association of coffee and caffeine intake with the risk of parkinson disease. JAMA. 2000;283:2674–2679. doi: 10.1001/jama.283.20.2674. [DOI] [PubMed] [Google Scholar]
- 9.Hamza TH, et al. Genome-Wide Gene-Environment Study Identifies Glutamate Receptor Gene GRIN2A as a Parkinson’s Disease Modifier Gene via Interaction with Coffee. PLoS Genet. 2011;7:e1002237. doi: 10.1371/journal.pgen.1002237. [DOI] [PMC free article] [PubMed] [Google Scholar]
- 10.Caudle WM, Zhang J. Glutamate, excitotoxicity, and programmed cell death in parkinson disease. Exp Neurol. 2009;220:230–233. doi: 10.1016/j.expneurol.2009.09.027. [DOI] [PubMed] [Google Scholar]
- 11.Choi DW. Glutamate neurotoxicity and diseases of the nervous system. Neuron. 1988;1:623–634. doi: 10.1016/0896-6273(88)90162-6. [DOI] [PubMed] [Google Scholar]
- 12.Boeck CR, Kroth EH, Bronzatto MJ, Vendite D. Adenosine receptors co-operate with NMDA preconditioning to protect cerebellar granule cells against glutamate neurotoxicity. Neuropharmacology. 2005;49:17–24. doi: 10.1016/j.neuropharm.2005.01.024. [DOI] [PubMed] [Google Scholar]
- 13.Yamada-Fowler N, Fredrikson M, Söderkvist P. Caffeine Interaction with Glutamate Receptor Gene GRIN2A: Parkinson’s Disease in Swedish Population. PLoS ONE. 2014;9:e99294. doi: 10.1371/journal.pone.0099294. [DOI] [PMC free article] [PubMed] [Google Scholar]
- 14.Ahmed I, et al. Lack of Replication of the GRIN2A-by-Coffee Interaction in Parkinson Disease. PLoS Genet. 2014;10:e1004788. doi: 10.1371/journal.pgen.1004788. [DOI] [PMC free article] [PubMed] [Google Scholar]
- 15.Palacios N, et al. Polymorphisms of caffeine metabolism and estrogen receptor genes and risk of Parkinson’s disease in men and women. Parkinsonism Relat Disord. 2010;16:370–375. doi: 10.1016/j.parkreldis.2010.02.012. [DOI] [PMC free article] [PubMed] [Google Scholar]
- 16.Tan EK, et al. Association between caffeine intake and risk of Parkinson’s disease among fast and slow metabolizers. Pharmacogenet Genomics. 2007;17:1001–1005. doi: 10.1097/FPC.0b013e3282f09265. [DOI] [PubMed] [Google Scholar]
- 17.Popat RA, et al. Coffee, ADORA2A, and CYP1A2: the caffeine connection in Parkinson’s disease: ADORA2A and CYP1A2 variants and PD risk. Eur J Neurol. 2011;18:756–765. doi: 10.1111/j.1468-1331.2011.03353.x. [DOI] [PMC free article] [PubMed] [Google Scholar]
- 18.Chuang Y-H, et al. Gene-Environment Interaction in Parkinson’s Disease: Coffee, ADORA2A, and CYP1A2. Neuroepidemiology. 2016:192–200. doi: 10.1159/000450855. [DOI] [PMC free article] [PubMed] [Google Scholar]
- 19.Butler MA, Iwasaki M, Guengerich FP, Kadlubar FF. Human cytochrome P-450PA (P-450IA2), the phenacetin O-deethylase, is primarily responsible for the hepatic 3-demethylation of caffeine and N-oxidation of carcinogenic arylamines. Proc Natl Acad Sci. 1989;86:7696–7700. doi: 10.1073/pnas.86.20.7696. [DOI] [PMC free article] [PubMed] [Google Scholar]
- 20.Schwarzschild MA, et al. Neuroprotection by caffeine and more specific A2A receptor antagonists in animal models of Parkinson’s disease. Neurology. 2003;61:S55–S61. doi: 10.1212/01.wnl.0000095214.53646.72. [DOI] [PubMed] [Google Scholar]
- 21.Gao X, Simon KC, Han J, Schwarzschild MA, Ascherio A. Genetic determinants of hair color and parkinson’s disease risk. Ann Neurol. 2009;65:76–82. doi: 10.1002/ana.21535. [DOI] [PMC free article] [PubMed] [Google Scholar]
- 22.Calle EE, et al. The American Cancer Society Cancer Prevention Study II Nutrition Cohort: Rationale, study design, and baseline characteristics. Cancer. 2002;94:2490–2501. doi: 10.1002/cncr.101970. [DOI] [PubMed] [Google Scholar]
- 23.Willett WC, Bain C, Witschi J, Hennekens CH, Speizer FE. Reproducibility and validity of a semiquantitative food frequency questionnaire. Am J Epidemiol. 1985;122:51–65. doi: 10.1093/oxfordjournals.aje.a114086. [DOI] [PubMed] [Google Scholar]
- 24.Rimm EB, Giovannucci EL, Stampfer MJ, Colditz GA. Reproducibility and Validity of an Expanded Self-Administered Semiquantitative Food Frequency Questionnaire among Male Health Professionals. Am J Epidemiol. 1992;135:1114–1126. doi: 10.1093/oxfordjournals.aje.a116211. [DOI] [PubMed] [Google Scholar]
- 25.Feskanich D, et al. Reproducibility and validity of food intake measurements from a semiquantitative food frequency questionnaire. J Am Diet Assoc. 1993;93:790–796. doi: 10.1016/0002-8223(93)91754-e. [DOI] [PubMed] [Google Scholar]
- 26.Andersson T, Alfredsson L, Källberg H, Zdravkovic S, Ahlbom A. Calculating measures of biological interaction. Eur J Epidemiol. 2005;20:575–579. doi: 10.1007/s10654-005-7835-x. [DOI] [PubMed] [Google Scholar]
- 27.Knol MJ, et al. Estimating measures of interaction on an additive scale for preventive exposures. Eur J Epidemiol. 2011;26:433–438. doi: 10.1007/s10654-011-9554-9. [DOI] [PMC free article] [PubMed] [Google Scholar]
- 28.Ascherio A. Coffee Consumption, Gender, and Parkinson’s Disease Mortality in the Cancer Prevention Study II Cohort: The Modifying Effects of Estrogen. Am J Epidemiol. 2004;160:977–984. doi: 10.1093/aje/kwh312. [DOI] [PubMed] [Google Scholar]
Associated Data
This section collects any data citations, data availability statements, or supplementary materials included in this article.