Abstract
Recent advances in mechanobiology have accumulated strong evidence showing close correlations between the physiological conditions and mechanical properties of cells. In this paper, a novel optomechanical technique to characterize the stiffness of single adherent cells attached on a substrate is reported. The oscillation in a cell’s height on a vertically vibrating reflective substrate is measured with a laser Doppler vibrometer as apparent changes in the phase of the measured velocity. This apparent phase shift and the height oscillation are shown to be affected by the mechanical properties of human colorectal adenocarcinoma cells (HT-29). The reported optomechanical technique can provide high-throughput stiffness measurement of single adherent cells over time with minimal perturbation.
Introduction
The mechanical properties of cells are affected by various biological processes and can be used as biophysical indicators for cellular malignancy and other physiological conditions.1 Many diseases including cancer,2 blood diseases,3 and inflammation4 are often associated with the changes in the mechanical properties of cells. For example, it was reported that metastatic cancer cells show 70% lower stiffness compared to benign cells and that lower stiffness of cancer cells was correlated with higher invasiveness.5 These correlations between the cell’s status and its mechanical properties have practical implications considering the potential of developing simple and rapid diagnostic techniques based on these mechanical biomarkers.
There have been active research efforts to develop tools that can characterize the mechanical stiffness of cells. Since the development of a method based on magnetic particles by Crick and Hughes to measure the cell’s stiffness,6 various methods have been developed, such as micropipette aspiration,7 magnetic twisting cytometry,8,9 cell indentation with atomic force microscopy (AFM),5,10 optical tweezers,11 and various microfluidic approaches.12,13 These techniques can be largely divided into two categories: those that require cells to be suspended and those that can measure adherent cells on a substrate. The techniques for suspended cells mostly use a flow-through configuration,12–14 in which suspended cells are transported into the sensing area as a single stream in a laminar flow. Then, the cells are either (i) deformed by external forces11,12 or (ii) forced to pass through a narrow channel.13 These methods based on a flow-through configuration are usually able to achieve high throughput. However, such methods require cells to be suspended in media, whereas a major portion of human cells are adherent cells that require attachment to a substrate for growth and proliferation. On the other hand, a direct-contact configuration is suitable for measuring the stiffness of adherent cells without detaching them. Mechanical probes such as AFM cantilevers,5,10 micropipettes,7 and magnetic beads8,9 physically come into contact with the target cells. This configuration is suitable to track the stiffness of the same cell over time and measure the stiffness on a subcellular level in conjunction with high-resolution imaging. However, these methods tend to have limited throughput compared to the flow-through configuration. In this report, analytical modeling and experimental data of a novel optomechanical phenomenon, termed as vibration-induced phase shift (VIPS), are presented. This VIPS measurement can be used as a non-invasive technique to characterize the mechanical stiffness of single cells in their physiological condition with high throughput.
Measurement principles and methods
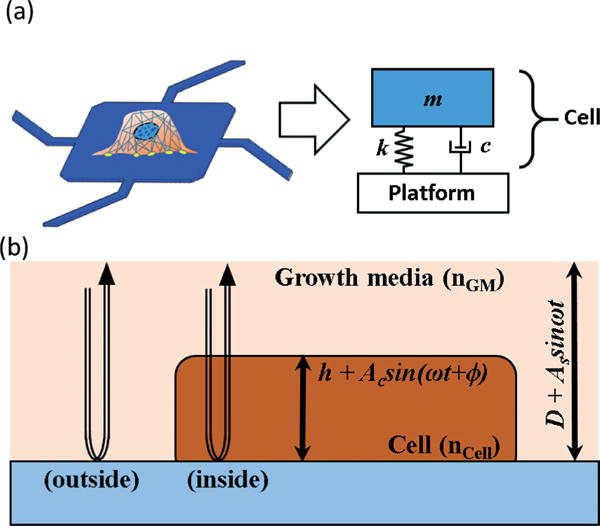
In earlier studies,15 it has been experimentally shown that a cell’s inertial loading on a mass sensor is affected by its stiffness. This observation implies that a cell on a vertically vibrating substrate experiences structural deformation which is mostly oscillation of its height, and the degree of the height oscillation is inversely proportional to the cell stiffness. The described technique in this report uses a laser Doppler vibrometer (LDV) to measure the amplitude and phase of this height oscillation, which are used to extract the elasticity of single cells. An adherent cell attached on a solid substrate can be modeled as a second-order harmonic oscillator, as shown in Fig. 1(a). When the substrate vertically oscillates, the cell is forced to vibrate (i.e. cell height is oscillating) at the same frequency but with different amplitude and phase. The amplitude and the phase of the cell height oscillation are a strong function of elasticity and viscosity of the cell along with the actuation frequency. Since the cell has a higher refractive index compared to the surrounding media, this oscillation of the cell height can be detected optically with LDV.
Fig. 1.

Schematic diagram of optomechanical stiffness measurement. (a) A cell on a sensor can be modelled as a spring-damper-mass system. (b) When the LDV laser is located inside the cell body, oscillation of the cell body modulates the optical path length of the LDV laser, causing the apparent shift of the measured velocity’s phase.
The schematic diagram of a single cell on a vibrating substrate and an LDV’s measurement laser is shown in Fig. 1(b). The experimental setup is similar to that in an earlier study.15 The LDV is an optical instrument that can measure a time-derivative of the optical path length (OPL) of the measurement laser reflected from a target surface. In Fig. 1(b), h, Ac, D, As, ω, ϕ, nGM, and nCell represent the static cell height, the amplitude of the cell’s height oscillation, the distance of the substrate to the LDV, the amplitude of substrate’s vibration, the angular frequency of the vibration, the phase of height oscillation, the refractive index of the media, and the refractive index of the cell, respectively. The substrate has a static distance D to the LDV and oscillates in a vertical direction with an angular frequency of ω and an amplitude of As. The adherent cell on the substrate has a static height of h and oscillates at the same frequency but with different amplitude Ac and phase ϕ.
When the measurement laser is located on the vibrating substrate outside the cell as shown in Fig. 1(b), the total OPLIJt) is as follows:
| (1) |
The output of the LDV is the time-derivative of OPLIJt) in eqn (1), which is the velocity of the platform multiplied by nGM. On the other hand, when the measurement laser passes through the cell as shown in Fig. 1(b), the measurement laser experiences an additional modulation of OPL from the cell’s height oscillations, as follows:
| (2) |
The lock-in-amplifier can analyze the velocity output of the LDV with respect to the reference actuation signal to extract the apparent amplitude increase, ΔA and the apparent phase shift, Δϕ of the measured velocity. This apparent phase shift is termed as VIPS.
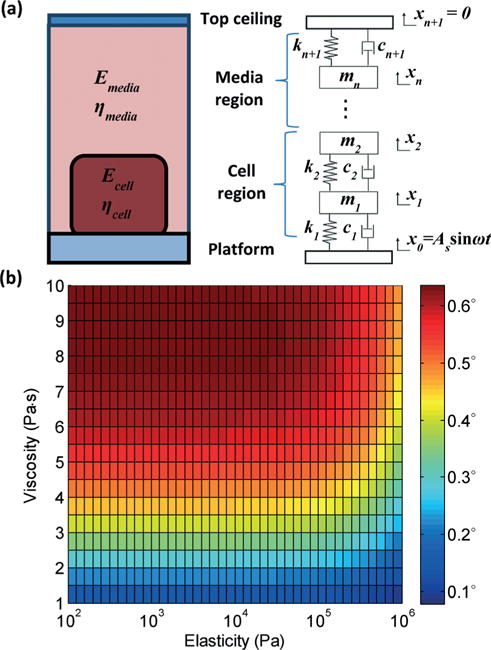
To fully characterize the relationship between the mechanical properties of cells and VIPS, a one-dimensional analytical model is established. In this model, a 10 μm thick cell region and a 5 mm thick growth media region between a vibrating platform and a glass top ceiling of the culture well are modeled with over 500 layers of mass-spring-damper systems, as shown in Fig. 2(a). The platform is assumed to vibrate sinusoidally (x0 = As sin ωt) as an external loading, and the glass ceiling is assumed to be stationary (xn+1 = 0) as a boundary condition. The mechanical properties of water16,17 are used as those of the growth media. The force equation between each layer can be described as follows:
| (3) |
where xi, ki, and ci are the displacement, spring constant, and damping coefficient of ith layer, respectively (see the ESI†). From this model, Ac and ϕ are calculated with varying elasticity and viscosity of the cell body. Then, eqn (2) is used to convert these values into VIPS or Δϕ in eqn (2), as shown in Fig. 2(b). Based on the reported values18,19 of nCell of 1.38 and nGM of 1.35, VIPS is calculated to be in the range of 0–0.6° and increases with decreasing elasticity and increasing viscosity.
Fig. 2.

Mechanical modeling of cell’s height oscillation on a vibrating platform and VIPS. (a) A one-dimensional analytical model is developed to simulate the height oscillation of the cell. (b) Calculated VIPS with varying elasticity and viscosity is presented.
Results
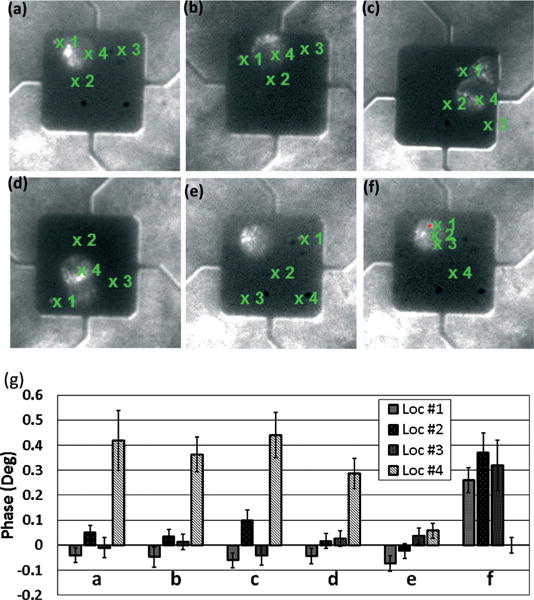
MEMS mass sensors in earlier studies15 are used as vibrating substrates to induce VIPS. The platform of the sensor is designed to vibrate vertically for uniform mass sensitivity.20 The mass sensor is used to apply vertical vibration to target cells with an actuation frequency of 50 kHz and an amplitude of 100 pm. As shown in Fig. 3, human colon adenocarcinoma cells (HT-29) are cultured on mass sensors which are functionalized with collagen similar to those in earlier studies.15 While the platform of a mass sensor oscillates at a fixed frequency, the phase of the substrate’s velocity is measured by the LDV and the lock-in-amplifier at three locations (location #1–#3) outside but near the cell and one location (location #4) inside the cell, as shown in Fig. 3(a)–(d). It takes about a few seconds to measure the phase at each location. For each sensor, the average of the phases measured at the locations outside the cell is used as a reference. The relative phase values of the velocity at four locations are shown in Fig. 3(g). As shown in the plot, an increased phase is clearly observed when the velocity is measured through the cell (location #4) and the apparent phase shift is about 0.4°. In Fig. 3(e), four locations are placed outside the cell as a control and the differences in the measured phase are much smaller. Furthermore, in Fig. 3(f), three locations are placed inside the cell and one location is placed outside the cell, showing consistently a higher phase inside the cell. The increase of the velocity’s amplitude or ΔA, which can be used to decouple elasticity and viscosity, is not confirmed due to noise in the signal (data not shown).
Fig. 3.

VIPS measurement. (a–d) Loc #1–#3 are located outside the cells and Loc #4 is located inside the cell. A phase shift of about 0.4 degrees is clearly shown in the plot in (g). (e) Loc #1–#4 are all located outside the cell as a control. Measured phases are close to each other. (f) Loc #1–#3 are located inside the cell and Loc #4 is located outside the cell. Loc #1–#3 show considerably higher values of the phase than Loc #4. (g) The measured phase of (a–f).
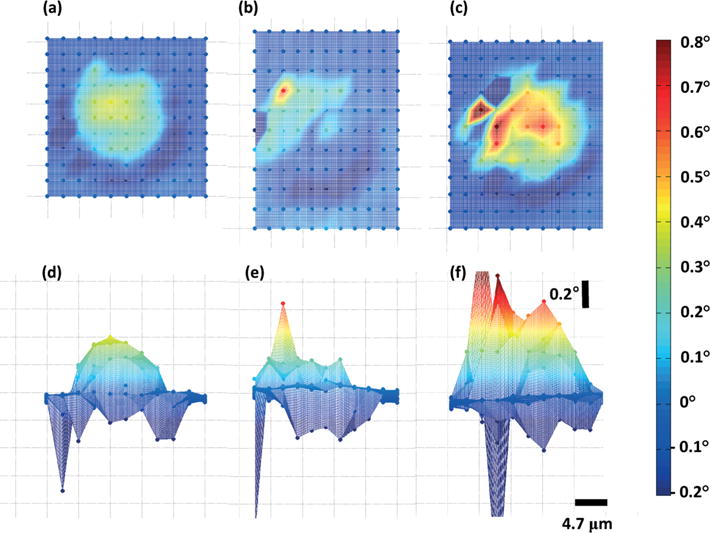
The measurement laser is scanned over the entire cell to obtain the 2-dimensional measurement of VIPS as shown in Fig. 4. The measurement points are marked as solid circular dots and the total number of the measurement points is over ~120 for each measurement. The VIPS profile between the measurement points is calculated with linear interpolation. To demonstrate the sensitivity of the VIPS measurement, we modulated the stiffness of the target cells and compared their 2D VIPS measurements to those of untreated live cells. To increase the stiffness, the target cells are exposed to 4% paraformaldehyde for 30 minutes, which crosslinks inter-cellular proteins and increases cell stiffness.21,22 To decrease the stiffness, the cells are exposed to 0.1 μg mL−1 cytochalasin D (Cyto-D) and 10 μg ml−1 nocodazole (Noc) for at least 2 hours. Cyto-D is widely used to disrupt actin filaments and reduce cell stiffness.12,23–25 Noc interferes microtubules by inhibiting tubulin polymerization26 and is known to decrease cell stiffness.24,25,27,28 While some studies show that Noc increases cell stiffness8,29 by upregulating actin assembly through Rho signaling,30,31 such observations are limited to the cases where cells are exposed to Noc alone. The combination of Cyto-D and Noc is used in this study, as it is reported that the combined use of Cyto-D and Noc is more effective in reducing cell stiffness than using Cyto-D alone in earlier studies.24,25
Fig. 4.

Scanning measurement of the cells with different treatment. (a and d): Top and side views of the fresh and live cell. (b and e): Top and side views of the cell whose stiffness was increased by chemical fixation. (c and f): Top and side views of the cell whose stiffness was decreased by nocadazole and cytochalasin D treatment.
The platform area outside the cell shows a uniform phase centered around 0°, whereas the phase increase is clearly observed inside the cell. In Fig. 4(a) and (d), the top view and the side view of the VIPS measurement of a live HT-29 cell are presented, where a smooth dome-shaped increase of the phase is observed. The maximum increase of VIPS is about 0.4° and the mean ± standard deviation of the points near the center of the cell is 0.30 ± 0.06°. Interestingly, a sharp decrease of the phase is observed at the perimeter of the cells, and is believed to originate from the optical interference of the measurement laser and the cellular membrane on the side of the cell. The same cell in Fig. 4(a) is chemically fixed with 4% paraformaldehyde to increase its stiffness and the VIPS is measured, as shown in Fig. 4(b) and (e). The fixed cell shows a reduced VIPS around 0.2° (0.07 ± 0.12°), but also had a distinctive profile. The measured phase is sloped from the north-west to the south-east direction, and the phase profile is rough and peaked. The VIPS measurement of a cell, which is treated with Cyto-D and Noc to reduce its stiffness, is shown in Fig. 4(c) and (f). The chemically treated cell shows a maximum VIPS over 0.6° which is much larger than those of the live cell and the fixed cell. Besides, it shows a rough phase profile with a mean ± standard deviation of 0.38 ± 0.16°. In summary, the live cell shows a smooth phase profile with a maximum phase shift of 0.4°, and the fixed cell shows a sloped phase profile with a maximum phase shift of 0.2°. The cell treated with Cyto-D and Noc shows highly increased VIPS with a maximum phase shift over 0.6°.
Conclusions
A newly observed optomechanical phenomenon (VIPS) is reported with theoretical analysis and experimental data. It is clearly shown that the cell with lower mechanical stiffness exhibits larger VIPS, demonstrating the potential of noninvasive mechanical phenotyping of adherent cells. Furthermore, the VIPS measurement techniques share a common platform with a MEMS mass sensor15 for single cell growth measurement and it can be seamlessly integrated into multi-modal mechanical characterization of single cells.
Supplementary Material
Acknowledgments
K. Park gratefully acknowledges support from the Louisiana Board of Regents IJLEQSFIJ2014-17)-RD-A-05). This work was conducted at UIUC and supported by EEC-0425626 (NSF Nanoscale Science and Engineering Center at Ohio State University).
Footnotes
Electronic supplementary information (ESI) available. See DOI: 10.1039/c5lc00444f
References
- 1.Di Carlo D. J Lab Autom. 2012;17:32–42. doi: 10.1177/2211068211431630. [DOI] [PubMed] [Google Scholar]
- 2.Suresh S, Spatz J, Mills J, Micoulet A, Dao M, Lim C, Beil M, Seufferlein T. Acta Biomater. 2005;1:15–30. doi: 10.1016/j.actbio.2004.09.001. [DOI] [PubMed] [Google Scholar]
- 3.Brandao M, Fontes A, Barjas-Castro M, Barbosa L, Costa FF, Cesar C, Saad S. Eur J Haematol. 2003;70:207–211. doi: 10.1034/j.1600-0609.2003.00027.x. [DOI] [PubMed] [Google Scholar]
- 4.Drost EM, MacNee W. Eur J Immunol. 2002;32:393–403. doi: 10.1002/1521-4141(200202)32:2<393::AID-IMMU393>3.0.CO;2-5. [DOI] [PubMed] [Google Scholar]
- 5.Cross SE, Jin YS, Rao J, Gimzewski JK. Nat Nanotechnol. 2007;2:780–783. doi: 10.1038/nnano.2007.388. [DOI] [PubMed] [Google Scholar]
- 6.Crick F, Hughes A. Exp Cell Res. 1950;1:37–80. [Google Scholar]
- 7.Hochmuth RM. J Forensic Biomech. 2000;33:15–22. doi: 10.1016/s0021-9290(99)00175-x. [DOI] [PubMed] [Google Scholar]
- 8.Tee SY, Fu J, Chen CS, Janmey PA. Biophys J. 2011;100:L25–L27. doi: 10.1016/j.bpj.2010.12.3744. [DOI] [PMC free article] [PubMed] [Google Scholar]
- 9.Maksym GN, Fabry B, Butler JP, Navajas D, Tschumperlin DJ, Laporte JD, Fredberg JJ. J Appl Physiol. 2000;89:1619–1632. doi: 10.1152/jappl.2000.89.4.1619. [DOI] [PubMed] [Google Scholar]
- 10.Hoh JH, Schoenenberger CA. J Cell Sci. 1994;107:1105–1114. doi: 10.1242/jcs.107.5.1105. [DOI] [PubMed] [Google Scholar]
- 11.Lim C, Dao M, Suresh S, Sow C, Chew K. Acta Mater. 2004;52:1837–1845. [Google Scholar]
- 12.Otto O, Rosendahl P, Mietke A, Golfier S, Herold C, Klaue D, Girardo S, Pagliara S, Ekpenyong A, Jacobi A. Nat Methods. 2015;12:199–202. doi: 10.1038/nmeth.3281. [DOI] [PubMed] [Google Scholar]
- 13.Byun S, Son S, Amodei D, Cermak N, Shaw J, Kang JH, Hecht VC, Winslow MM, Jacks T, Mallick P, Manalis SR. Proc Natl Acad Sci U S A. 2013;110:7580–7585. doi: 10.1073/pnas.1218806110. [DOI] [PMC free article] [PubMed] [Google Scholar]
- 14.Di Carlo D, Irimia D, Tompkins RG, Toner M. Proc Natl Acad Sci U S A. 2007;104:18892–18897. doi: 10.1073/pnas.0704958104. [DOI] [PMC free article] [PubMed] [Google Scholar]
- 15.Park K, Millet LJ, Kim N, Li H, Jin X, Popescua G, Aluru NR, Hsia KJ, Bashir R. Proc Natl Acad Sci U S A. 2010;107:20691–20696. doi: 10.1073/pnas.1011365107. [DOI] [PMC free article] [PubMed] [Google Scholar]
- 16.Hanes WM, editor. CRC Handbook of Chemistry and Physics. CRC; Boulder, Colorado: 2011. [Google Scholar]
- 17.Cheng Y, Yang F, Xu JY, Liu XJ. Appl Phys Lett. 2008;92:151913. [Google Scholar]
- 18.Marquet P, Rappaz B, Magistretti PJ, Cuche E, Emery Y, Colomb T, Depeursinge C. Opt Lett. 2005;30:468–470. doi: 10.1364/ol.30.000468. [DOI] [PubMed] [Google Scholar]
- 19.Liang X, Liu A, Lim C, Ayi T, Yap P. Sens Actuators, A. 2007;133:349–354. [Google Scholar]
- 20.Park K, Kim N, Morisette DT, Aluru NR, Bashir R. J Microelectromech Syst. 2012;21:702–711. [Google Scholar]
- 21.Codan B, Martinelli V, Mestroni L, Sbaizero O. Mater Sci Eng, C. 2013;33:3303–3308. doi: 10.1016/j.msec.2013.04.009. [DOI] [PubMed] [Google Scholar]
- 22.Grimm KB, Oberleithner H, Fels J. Nanotechnology. 2014;25:215101. doi: 10.1088/0957-4484/25/21/215101. [DOI] [PubMed] [Google Scholar]
- 23.Takai E, Costa KD, Shaheen A, Hung CT, Guo XE. Ann Biomed Eng. 2005;33:963–971. doi: 10.1007/s10439-005-3555-3. [DOI] [PubMed] [Google Scholar]
- 24.Wang N, Butler JP, Ingber DE. Science. 1993;260:1124–1127. doi: 10.1126/science.7684161. [DOI] [PubMed] [Google Scholar]
- 25.Ingber DE, Prusty D, Sun Z, Betensky H, Wang N. J Biomech. 1995;28:1471–1484. doi: 10.1016/0021-9290(95)00095-x. [DOI] [PubMed] [Google Scholar]
- 26.Vasquez RJ, Howell B, Yvon A, Wadsworth P, Cassimeris L. Mol Biol Cell. 1997;8:973–985. doi: 10.1091/mbc.8.6.973. [DOI] [PMC free article] [PubMed] [Google Scholar]
- 27.Berquand A, Holloschi A, Trendelenburg M, Kioschis P. Microsc Today. 2010;18:34–37. [Google Scholar]
- 28.Pelling AE, Dawson DW, Carreon DM, Christiansen JJ, Shen RR, Teitell MA, Gimzewski JK. Nanomed: Nanotechnol, Biol Med. 2007;3:43–52. doi: 10.1016/j.nano.2006.11.006. [DOI] [PubMed] [Google Scholar]
- 29.Wu H, Kuhn T, Moy V. Scanning. 1998;20:389–397. doi: 10.1002/sca.1998.4950200504. [DOI] [PubMed] [Google Scholar]
- 30.Krendel M, Zenke FT, Bokoch GM. Nat Cell Biol. 2002;4:294–301. doi: 10.1038/ncb773. [DOI] [PubMed] [Google Scholar]
- 31.Chang YC, Nalbant P, Birkenfeld J, Chang ZF, Bokoch GM. Mol Biol Cell. 2008;19:2147–2153. doi: 10.1091/mbc.E07-12-1269. [DOI] [PMC free article] [PubMed] [Google Scholar]
Associated Data
This section collects any data citations, data availability statements, or supplementary materials included in this article.


