Abstract
DNA is an excellent medium for data archival. Recent efforts have illustrated the potential for information storage in DNA using synthesized oligonucleotides assembled in vitro1–6. A relatively unexplored avenue of information storage in DNA is the ability to write information into the genome of a living cell by the addition of nucleotides over time. Using the Cas1-Cas2 integrase, the CRISPR-Cas microbial immune system stores the nucleotide content of invading viruses to confer adaptive immunity7. Harnessed, this system has the potential to write arbitrary information into the genome8. Here, we use the CRISPR-Cas system to encode images and a short movie into the genomes of a population of living bacteria. In doing so, we push the technical limits of this information storage system and optimize strategies to minimize those limitations. We additionally uncover underlying principles of the CRISPR-Cas adaptation system, including sequence determinants of spacer acquisition relevant for understanding both the basic biology of bacterial adaptation as well as its technological applications. This work demonstrates that this system can capture and stably store practical amounts of real data within the genomes of populations of living cells.
By combining the principles of information storage in DNA with DNA capture systems capable of functioning in living cells, one can create living organisms that capture, store, and propagate information over time. In prokaryotic viral defense, the CRISPR associated (Cas) proteins, Cas1 and Cas2, function as an integrase complex to acquire nucleotides from invading viruses and store them in the CRISPR array7,9,10. In previous work, we found that we could direct the system to acquire synthetic sequences into the CRISPR array if those sequences are supplied as oligonucleotides8. Using this approach we showed simple molecular recordings by supplying different oligo sequences over time.
Here, we radically scale up this approach to define the information capacity that the system can record with an eye toward future biological recordings. Rather than arbitrary sequences, we encode real information – images – and optimize the method of delivery, nucleotide content of the sequences, and reconstruction method (for which we use a population of bacteria). In the E. coli Type I-E CRISPR-Cas system, DNA from invading viruses is inserted into a genomic CRISPR array in 33-base units termed spacers11. The sequences from which spacers are derived are termed protospacers12. Here, we began with an image (Extended Data Fig. 1a). We stored pixel values in a nucleotide code, distributed over many individual synthetic protospacer oligos. We electroporated these oligos into a population of bacteria, each harboring a functional CRISPR array and overexpressing the Cas1-Cas2 integrase complex, allowing cells to acquire the oligos into their genome. We recover the information by high-throughput sequencing: newly acquired spacers are decoded to reconstruct the original image.
We first encoded images of a human hand using two different pixel value encoding strategies: a rigid strategy (handR), in which 4 pixel colors were each specified by a different base (Extended Data Fig. 1b,c); and a flexible strategy (handF), in which 21 possible pixel colors were specified by a degenerate nucleotide triplet table (Fig. 1a,b). To distribute the information across multiple protospacers, we gave each protospacer a barcode that defined which pixel set–or “pixet”–was encoded by the nucleotides in that spacer. Four nucleotides define each pixet, and the pixels of a given pixet are distributed across the image (Fig. 1c, Extended Data Fig. 1d). We included a protospacer adjacent motif (PAM) on each protospacer, which increases the efficiency of acquisition and determines orientation of spacer insertion8,13–15. After adding the PAM and pixet, we were left with 28 bases per protospacer to encode pixel values.
Figure 1.
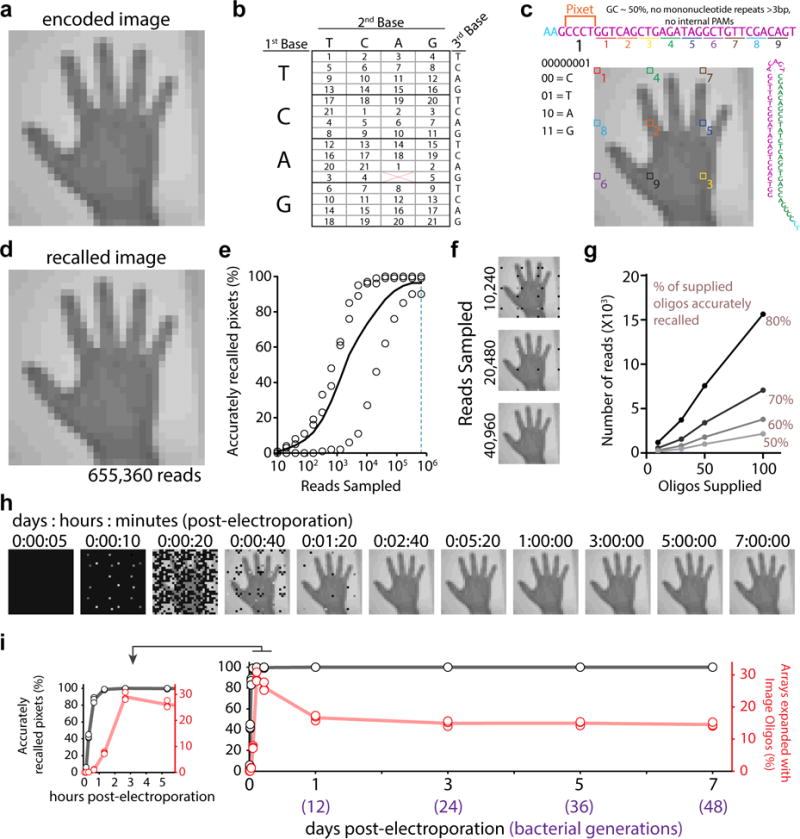
An image into the genome. a. handF image. b. Encoding for 21 colors. c. Sequence at top shows the linear protospacer with pixet code followed by pixel values (distributed across image). Pixet shown under nucleotides, with binary-to-nucleotide conversion. Small colorful numbers below protospacer indicate individual pixels boxed on the image. Minimal hairpin protospacer shown on the right. d. One replicate at 655,360 reads. Black shown if no pixel information recovered. e. Accurately recalled pixets by read depth. Unfilled circles indicate points from individual replicates, black line shows the mean. f. Result of down-sampling the sequencing reads. g. Reads required to reach 50, 60, 70, and 80% accuracy on a given oligo set as a function of number of oligos supplied. h. Image recall at time-points after electroporation. i. Quantification of the percentage of accurately recalled pixets (in black) and percentage of arrays with oligo-derived spacers (in red) by time-point. Unfilled circles represent individual replicates, lines show the mean. Inset graph (left) expands first six hours. Statistical details in Supplementary Table 1.
For handR, each of the 28 bases encoded a pixel value, thereby distributing a 4-color, 56×56 pixel image across 112 oligo protospacers (total information content of 784 bytes). For handF, the 28 bases encoded 9 pixels, each specified by a nucleotide triplet. Specific triplet combinations were chosen to build sequences we thought might increase acquisition efficiency–GC-content around 50%, no mononucleotide repeats >3 bp, and no internal PAMs. For the handF, we distributed a 21-color, 30×30 pixel image across 100 protospacers (total information content of ~494 bytes). Oligo protospacers were supplied in a minimal hairpin format (design based on insights from the crystal structure16,17) to prevent segregation of the two strands into different cells during electroporation (see Supplementary Information, Extended Data Fig. 2).
For each image, we electroporated the pooled oligos into a population of E. coli containing a genomic CRISPR array and expressing the Cas1-Cas2 integrase18. Cells were then recovered, passaged overnight, and the next day a sample of the genomic CRISPR arrays were sequenced. Newly-acquired spacers were bioinformatically extracted from the arrays, and those that were not derived from the plasmid/genome were analyzed. Pixel values were assigned based on the most numerous new spacer with a given pixet. Images reconstructed from the handR and handF images are shown in Extended Data Fig. 1e and Fig. 1d, respectively.
Using 655,360 reads, ~88% and ~96% of pixet sequences were accurately recalled from the handR and handF images, respectively. We found handF was more resistant to errors by under-sampling (Fig. 1e-f, Extended Data Fig. 1f-g). By electroporating subsets of the oligos, we found that the number of reads required to achieve similar levels of accuracy in recall is linearly related to the number of oligos electroporated (Fig. 1g, Extended Data Fig. 1h-i), and that it took far more reads per oligo protospacer to reach 80% accuracy from handR (~1,580 reads/protospacer) versus handF (~150 reads/protospacer).
We also sampled time-points of the bacterial culture following the electroporation of handF. Oligo-derived spacer acquisitions were detectable ten minutes following the electroporation, and peaked at 2h40min–at which point we could first accurately recall the entire image (Fig. 1h-i). From this peak to 24 hours post-electroporation, the percentage of oligo-expanded arrays declined slightly, then stabilized over the next six days (~48 bacterial generations). Presumably, some cells lose viability following the electroporation and do not contribute to the population after outgrowth (Extended Data Fig. 3, Supplementary Information includes information about the internal integrity of the arrays over time19–21).
The total acquisition frequency was higher for handF than handR, explaining the improvement in recall (Extended Data Fig. 4a). To test which of the parameters–GC%, absence of mononucleotide repeats, or lack of internal PAMs–accounted for this greater acquisition frequency, we designed new sets of oligo protospacers, systematically testing each parameter (Supplemental Information, Extended Data Fig. 4b-f). GC% had a clear effect on acquisition frequency, with reduced acquisition frequency at low GC%. This effect was most extreme when pools contained a wide range of GC%. In pools with homogeneous percentage, those over 50% were equally effective. Therefore, it is beneficial to limit the range of GC% and keep the percentage at 50% or higher. The protospacers encoding the handR image had, by chance, an overall lower GC% than those encoding the handF image (41.8 ± 0.6% vs. 50.6 ± 0.6%), which may account for the difference in acquisition frequency. For mononucleotide repeats and internal PAMs, we found that pools of protospacers with substantial numbers of either displayed reductions in total acquisitions.
Despite differences in acquisition frequency between handR/handF, a similar range of acquisition frequencies is apparent among individual protospacer sequences from each (Fig. 2a). We compared over-represented protospacers with all protospacers and found a significant motif present in the final two nucleotides in over-represented sequences (Fig. 2b). A similar motif has been previously reported and termed the acquisition affecting motif (AAM)22, however the reported sequence of this motif differs from what we find here. While we found the motif to be composed of slightly different bases, we believe that these differences likely to arise from the fact that we were able to synthetically control for the presence of the more dominant PAM motif in our sequences, and thus we adopt the previous term AAM. The PAM sequence has been shown to function not only in adaptation but also interference23 and, given that it lies outside of the acquired spacer, serves as a mechanism of self versus non-self discrimination14. Although the AAM lies within the acquired spacer (and thus could promote self-targeting) and additionally lies outside the seed region24, it would still be interesting to directly test whether the presence of an AAM similarly influences interference efficiency.
Figure 2.
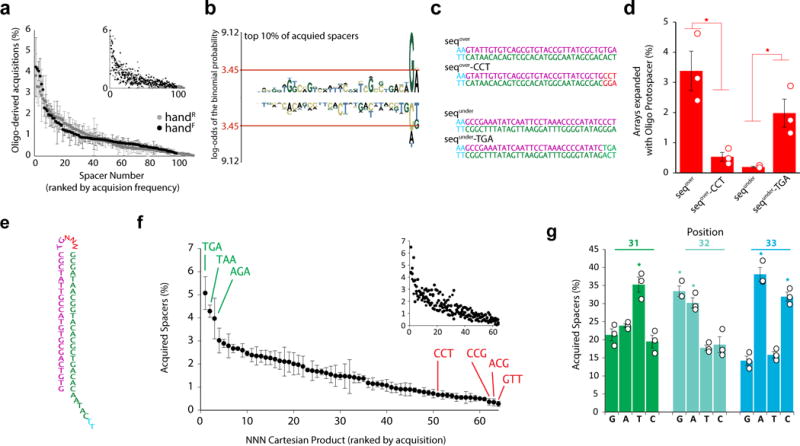
Sequence determinants of acquisition. a. Acquisition frequency for individual protospacers (of oligo-derived acquisitions) for both images, ranked by frequency. Main plot circles represent mean ± SEM. Smaller inset shows each replicate (n=3). b. pLogo30 of the top 10% of protospacers (all protospacers as background). Red line indicates p<0.05. Over-representation is positive, under-representation is negative. c. Sequences designed to test the motif. d. Arrays expanded with the sequences indicated in c. Unfilled circles represent individual replicates. Bars show mean ± SEM. *=p<0.05. e. NNN-containing oligo. f. Acquisition frequency of protospacers containing each NNN Cartesian product (of oligo-derived acquisitions), ranked by frequency. Plots as in a. g. Representation of nucleotides at positions 31-33 in acquired spacers from the NNN-containing oligo. Plot as in d. Statistical details in Supplementary Table 1.
To test whether the AAM motif we find is responsible for the difference in efficiency, we tested individual protospacers, using nucleotides from the over-represented motif, ending in ‘TGA’, to define one protospacer (seqover), and nucleotides drawn from the under-represented motif, ending in ‘CCT’, to define another (sequnder). We also swapped the final three nucleotides from these two sequences to create two more protospacers (seqover-CCT and sequnder-TGA) (Fig. 2c). We found that the final three nucleotides determined acquisition frequency, with ‘TGA’ yielding high- and ‘CCT’ yielding low-efficiency regardless of the rest of the sequence content (Fig. 2d). Because these nucleotides are in the loop region of the hairpin protospacer, we also tested these sequences as complementary single stranded oligos and found an identical dependence on the final three nucleotides (Extended Data Fig. 5).
Because we identified this motif using sequence-constrained protospacers, we tested a hairpin protospacer with random nucleotides (NNN) in the final three positions (Fig. 2e). While we observed acquisition events with every possible NNN Cartesian product in the three variable nucleotides, their efficiencies varied and allowed us to define the ideal AAM (Fig. 2f-g).
We next applied our better understanding of protospacer sequence determinants of acquisition to encode multiple images over time within a single population of bacteria, generating a short movie (GIF). We moved the pixet to the final nucleotides of the protospacer, where a reduced sequence space was employed, limited to the most efficient eight AAM triplets from Figure 2f (Fig. 3a). The flexible 21-color code from the handF image was again employed. We chose to encode five frames of Eadweard Muybridge’s Horse in Motion at 36×26 pixels. Frames were each represented by a unique oligo set of 104 protospacers, for an overall information content of ~2.6 kilobytes. Pixet codes were reused between frames, and no nucleotides were used to identify frame order. Rather, each frame was electroporated successively over five days into a single population (Fig. 3b). Because new spacers are almost always acquired adjacent to the leader sequence in the CRISPR array18, pushing previously acquired spacers away from the leader, the order of frames within the GIF can be reconstructed based on the pair-wise order of spacers among many individual arrays.
Figure 3.
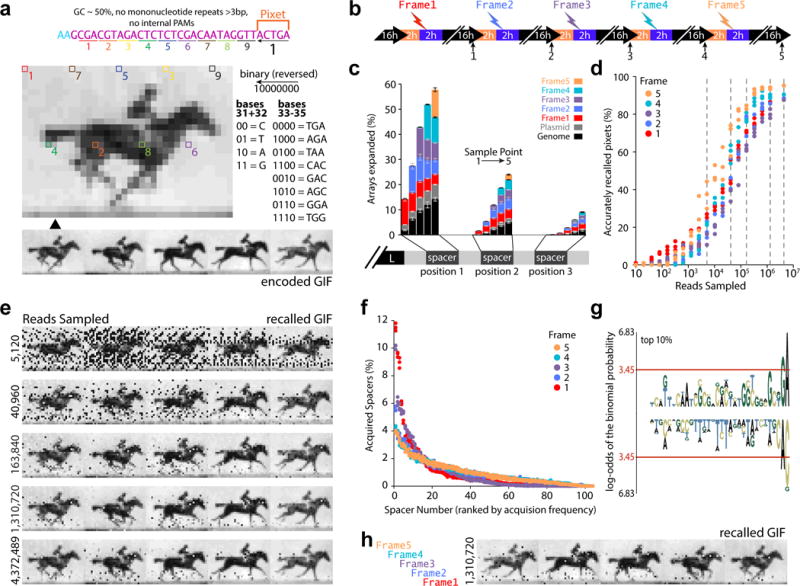
Encoding a GIF in bacteria. a. GIF to be encoded, along with an example of one pixet protospacer. b. Schematic of recording process. c. Percentage of arrays with expansions in the first three positions, by protospacer origin, at each sample point. Bars show mean ± SEM (n=3). d. Accurately recalled pixets as a function of reads (on the x axis) and frame (denoted by color). Points show individual biological replicates. e. Examples of the result at different sequence depths (see dotted gray lines in d). f. Protospacer acquisition frequency for individual protospacers (of oligo-derived acquisitions) by frame, ranked by acquisition frequency. Points show individual replicates. g. pLogo30 of the top 10% of protospacers (all protospacers as background). Red line indicates p<0.05. Over-represention is positive, under-represention is negative. h. Result of electroporating the same oligos in the reverse order. Statistical details in Supplementary Table 1.
Following electroporation, we found that the protospacers were efficiently acquired from each frame, and populated the first three sequenced positions of CRISPR arrays (Fig. 3c). We extracted all new spacers from the arrays, then analyzed the pixet nucleotides to recover the spacers assigned to each unique pixet, but in this case, captured the five most frequently acquired spacers with each pixet – one for each frame.
To order the frames over time, we used positioning within individual arrays to reconstruct the electroporation order of the protospacers. Ordering information can only be recovered from single cells, where spacers further from the leader within a single array must have been acquired earlier than spacers closer to the leader in that same array. However, the GIF information is widely distributed among a population of bacteria – no individual cell can be used to reconstruct the entire image series. Therefore, we leveraged many single-cell ordering comparisons among the population of bacteria to reconstruct the entire GIF (see Supplementary Information, Extended Data Fig. 6 for detail).
We found that we could reconstruct each frame and the order of frames (Fig. 3d), and that increasing read depth aided the accuracy of the reconstruction (to >90% overall accuracy) (Fig. 3e). Despite optimization of the protospacer sequence, we still found a range of efficiencies between the protospacers of any given frame (Fig. 3f). We again found a sequence motif at the AAM location, suggesting perhaps that we allowed for too large a range of nucleotide triplets in the final position (Fig. 3g) or this range may reflect an inherent competition among protospacers, either for Cas1-Cas2 or the genomic array. Since the protospacers themselves contain no code to specify frame position, we tested the robustness of our reconstruction strategy by delivering the oligo frame sets in reverse order. We were able to accurately reconstruct the reversed GIF, demonstrating reconstruction of an otherwise ambiguous signal based on time (Fig. 3h).
In summary, we found that not all protospacer sequences are equally effective at transferring data into the genome, and for this reason advocate for the use of a flexible encoding scheme to allow optimization of sequence content. We found that sequences with controlled GC content, a lack of mononucleotide repeats, and no internal PAMs outperformed those that lacked such optimization. Further, the inclusion of invariant nucleotides at both the leading (AAG…) and trailing (…GA) end of the protospacer has large effects on the frequency of acquisition. We were able to track the presence of 104 separately barcoded sequence elements over five timepoints (520 unique sequence elements), yielding confidence that this system will be capable of recording multidimensional biological information (see Supplementary Information, Extended Data Figures 7–8 for discussion into error-correction/compression, obstacles to single-cell storage, and a comparison of information storage in DNA versus silicon25–29).
Methods
Bacterial Strains and Culturing Conditions
All experiments were carried out in BL21-AI E. coli (Thermo Fisher), containing an integrated, arabinose-inducible T7 polymerase, an endogenous CRISPR array, but no endogenous Cas1+2. A plasmid encoding inducible (T7/lac) Cas1+2 (K-strain origin, pWUR1+2 a.k.a. pCas1+2) was transformed into cells prior to each experiment. Cells containing the plasmid were maintained in colonies on a plate at 4C for up to three weeks.
Oligo Protospacer Electroporation
Protospacer electroporations were performed as previously described8. Briefly, after overnight outgrowth from a single colony, Cas1+2 were induced in a 3 ml dilution of the culture (containing 80ul of the overnight), and grown at 37C for 2 hours (L-arabinose 0.2% w/w, Sigma-Aldrich; isopropyl-beta-D-thiogalactopyranoside 1mM, Sigma-Aldrich). For a given condition, 1 ml of the induced culture was spun down and washed with water three times at 4C, then resuspended in 50ul of a 6.25μM solution (unless other concentration is noted) of either a single protospacer or set of multiple protospacers and electroporated in a 1mm gap cuvette using a Bio-Rad gene pulser set to 1.8 kV and 25 μF. Only those conditions with an electroporation time constant > 4.0 ms were carried through to analysis. After electroporation, cells were recovered in 3ml LB at 37C for 2-3 hours, then diluted (50ul) into a fresh 3ml culture and grown overnight. Cells were collected for analysis the following morning (unless otherwise noted). For checking the maintenance of the 21 color image over time, cells were passaged daily (50ul into 3ml) after the first 24 hours and grown at 30C. To estimate the number of bacterial generations, we calculated the number of doublings required take the starting dilution (50/3000ul) to saturation at 1×10⁹ cell/ml (note that the first dilution was not from a saturated culture; in this case empirically determined cell numbers were taken from Extended Data Fig. 3). The oligo protospacers used can be found in Supplementary Table 3. To estimate the number of cells surviving electroporation, cells were serially diluted 1:300 (normalized to 1ml of starting culture), then 1:400 before plating on spectinomycin-containing plates. The resulting colonies were imaged using a commercial document scanner. To obtain colony counts blinded to experimental condition, partial or complete plate images were uploaded to Amazon’s Mechanical Turk workplace where remote workers were asked to count the number of “dots” per image. The answers provided by 10 workers were averaged for each plate image, from which the colony forming units per milliliter of starting volume were calculated.
Analysis of Spacer Acquisition
To analyze spacer acquisition, bacteria were lysed by heating to 95C for 5 minutes, then subjected to PCR of their genomic arrays using primers that flank the leader-repeat junction and additionally contain Illumina-compatible adapters. Libraries of up to 96 dual-indexed samples were sequenced on a MiSeq sequencer (Illumina) to read up to three spacer positions in from the leader on each array. Spacer sequences were extracted bioinformatically based on the presence of flanking repeat sequences, and compared against pre-existing spacer sequences to determine the percentage of expanded arrays and the position and sequence of newly acquired spacers. New spacers were blasted (NCBI) against the genome and plasmid sequences to determine the origin of the protospacer, with those sequences not derived from the genome or plasmid assumed to be oligo-derived. Since each cell contains a single array, the read depth is roughly equivalent to the number of cells analyzed (including both expanded and unexpanded arrays). This and all subsequent image analysis was performed using custom written scripts in Python.
Image coding and decoding
Image protospacer sets were created using a custom Python script to first open and read the pixel values of a previously created image. Each protospacer was given a pixet code by a binary-to-nucleotide conversion, and populated by nucleotides encoding the pixel values according to the scheme detailed in the text. For the single images, the pixet code was interleaved between ascending and descending numbers to introduce more sequence diversity in neighboring pixet protospacers. In the case of the flexible code employed in Figures 2 and 3, the protospacer was built sequentially. For each new pixel value the three possible nucleotide sequences were ranked according to which triplet would best push GC% of the resulting sequence toward 50%, then tested for whether the addition of the triplet would create either an internal PAM or a mononucleotide repeat >3. If such a situation was created, the next triplet in the list was tested until an acceptable triplet was identified (Extended Data Fig. 8a-d). For the handF image, the final base was assigned to the least numerous base in the rest of the spacer. We did not attempt to actively exclude sequences that matched the plasmid or genome, since this would be an exceedingly unlikely event given our library sizes. Finally, the sequences were re-formatted to match the minimal hairpin structure and written to a spreadsheet for synthesis by Integrated DNA Technologies. For the GIF, this process was repeated for each frame.
To reconstruct the single images, newly acquired oligo-derived spacers (plasmid- and genome-derived spacers were set aside before this analysis) were ranked according to frequency of acquisition, then the most frequent spacer sequences for each pixet (by the reversed nucleotide to binary conversion) were assigned to that pixet. Pixel values were extracted from the remaining spacer sequence according to the schemes outlined in the text, and figures and used to populate an image. The more complicated reconstruction of the GIF is described in detail in Supplementary Information as are the calculations of information content.
Statistics
A list of statistical tests can be found in Supplementary Tables 1 and 2.
The data that support the findings of this study are available from the corresponding author upon reasonable request.
Extended Data
Extended Data Figure 1.
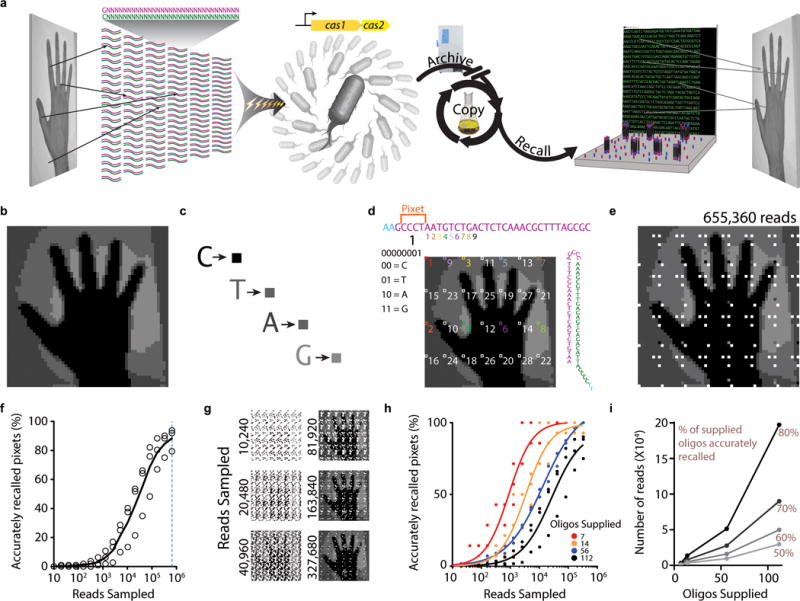
Recording images into the genome. a. Pixel values are encoded across many protospacers, which are electroporated into a population of bacteria that overexpress Cas1+2 to store the image data. These bacteria can be archived, propagated, and eventually sequenced to recall the image. b. Initial image to be encoded. c. Nucleotide-to-color encoding scheme. d. Example of the encoding scheme. Sequence at top shows the protospacer linear view with pixet code (specifying a pixel set) followed by pixel values, which are distributed across the image. Pixet number is shown under the pixet nucleotides, with the binary converted pixet and binary-to-nucleotide conversion reference below that. Small numbers (in color) below the protospacer indicate individual pixels, identified by boxes on the image. Protospacer in minimal hairpin format for electroporation is shown on the right. e. Results of one replicate at a depth of 655,360 reads. White is shown if no information was recovered about the pixel value (due to a pixet protospacer not being recovered after sequencing). f. Percentage of accurately recalled pixets as a function of read depth. Unfilled circles indicate points derived from individual replicates. The black line is an average of three replicates. g. Examples of the images that result from down-sampling the sequencing reads. h. Effect of supplying fewer oligos on recall accuracy as a function of reads sampled when smaller pools of oligos are supplied and recalled. i. Number of reads required to reach 50, 60, 70, and 80% accuracy on a given oligo set as a function of oligos supplied. Additional statistical details in Supplementary Table 2.
Extended Data Figure 2.
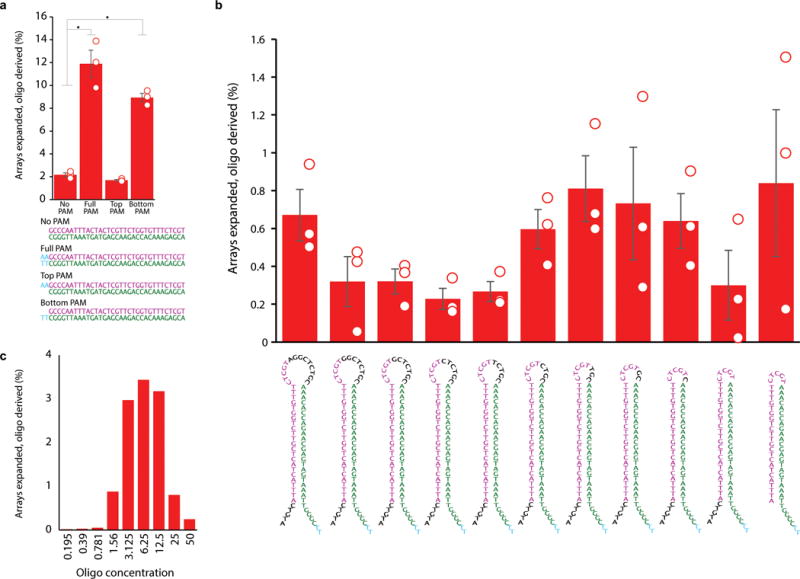
Testing a minimal hairpin protospacer. a. Percent of arrays expanded with oligo-supplied spacers following electroporation of the sequences indicated below, aimed at testing PAM inclusion on both the top and bottom strands. Unfilled circles indicate individual biological replicates, bars are mean ±SEM. * indicates p<0.05. Oligos supplied at 3.125 μM each. b. Percent of arrays expanded with oligo-supplied spacers following electroporation of the sequences indicated to the left, right, and below aimed at finding a minimal functional hairpin protospacer. Unfilled circles indicate individual biological replicates, bars are mean ±SEM. Oligos supplied at 3.125 μM. c. Percent of arrays expanded following electroporation of different concentrations of the minimal hairpin oligo protospacer. Additional statistical details in Supplementary Table 2.
Extended Data Figure 3.
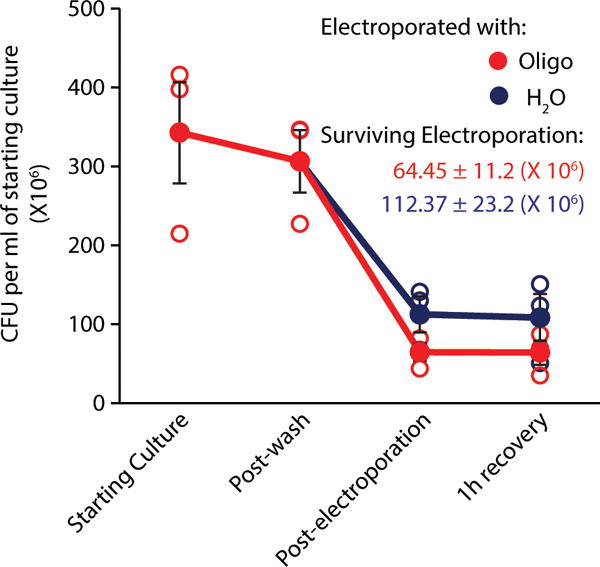
Cell surviving electroporation. Colony forming units per milliliter of starting culture prior to beginning electroporation, after pre-electroporation washes, immediately post-electroporation, and after 1 hour of recovery. Cells in red were electroporated with a minimal hairpin oligo, those in blue were electroporated in water alone. Unfilled circles represent individual biological replicates (n=3), filled circles are mean ± SEM.
Extended Data Figure 4.
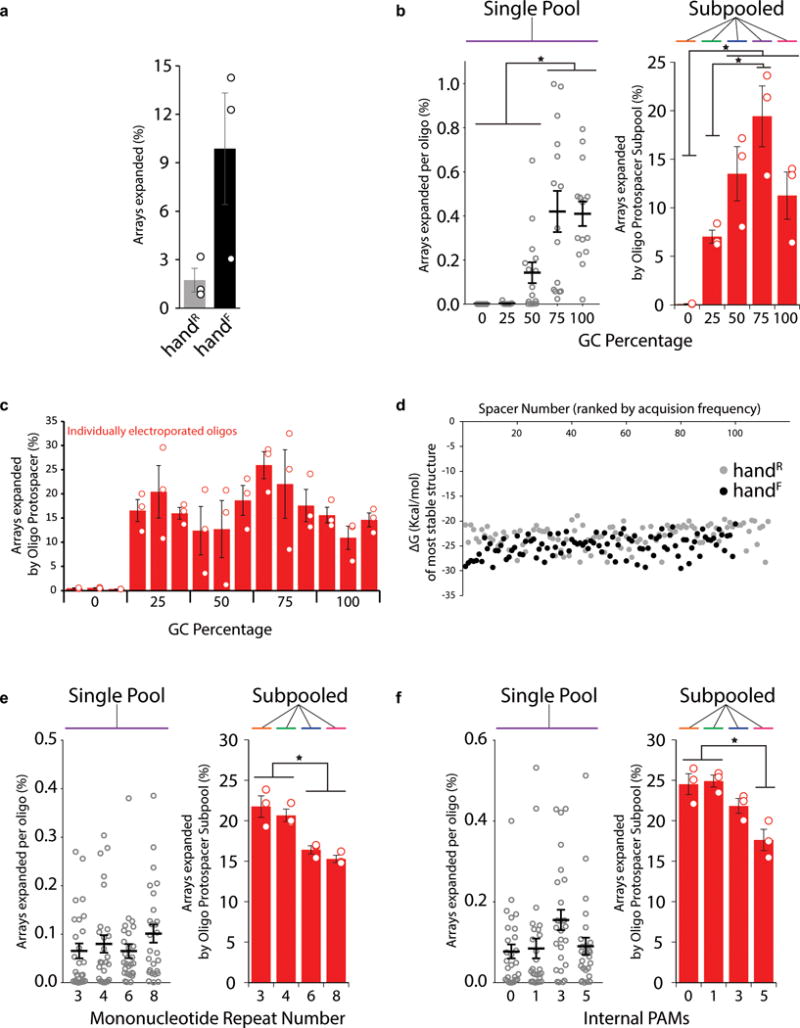
Optimization of protospacer sequence parameters. a. Comparison of the percentage of arrays that were expanded after encoding handR and handF images. b. Percentage of arrays expanded per oligo (single pool) or per subpool (subpooled) across a range of GC percentages. Unfilled black circles to the left represent individual oligo protospacer sequences (three biological replicates each), while black line shows mean ± SEM. Unfilled red circles to the right represent individual biological replicates. Bars are mean ± SEM. * indicates p<0.05. c. Percentage of arrays expanded per oligo electroporated individually across a range of GC percentages. Unfilled red circles are individual biological replicates. Bars show mean ± SEM. d. Gibbs free energy of minimal hairpin protospacers structures for each of the images, with protospacers ranked by overall acquisition frequency. e. Percentage of arrays expanded per oligo (single pool) or per subpool (subpooled) with different numbers of mononucleotide repeats. Panel attributes as in b. f. Percentage of arrays expanded per oligo (single pool) or per subpool (subpooled) with different numbers of internal PAMs. Panel attributes as in b. Additional statistical details in Supplementary Table 2.
Extended Data Figure 5.
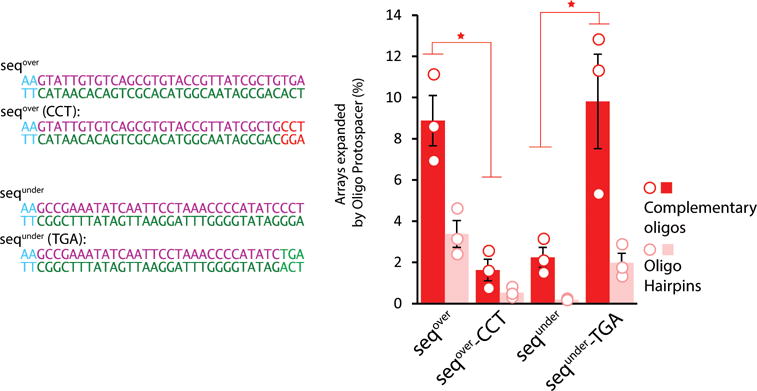
Effect of the 3’ motif on protospacer acquisition when supplied as two complementary oligos. Individual sequences designed to directly test the motif identified in Figure 2b shown to the left. To the right, percent of arrays expanded following electroporation of the sequences indicated as two complementary oligos (in dark red), rather than a minimal oligo hairpin (shown for comparison in pink). Unfilled circles indicate individual biological replicates. Bars show mean ± SEM. * indicates p<0.05. Additional statistical details in Supplementary Table 2.
Extended Data Figure 6.
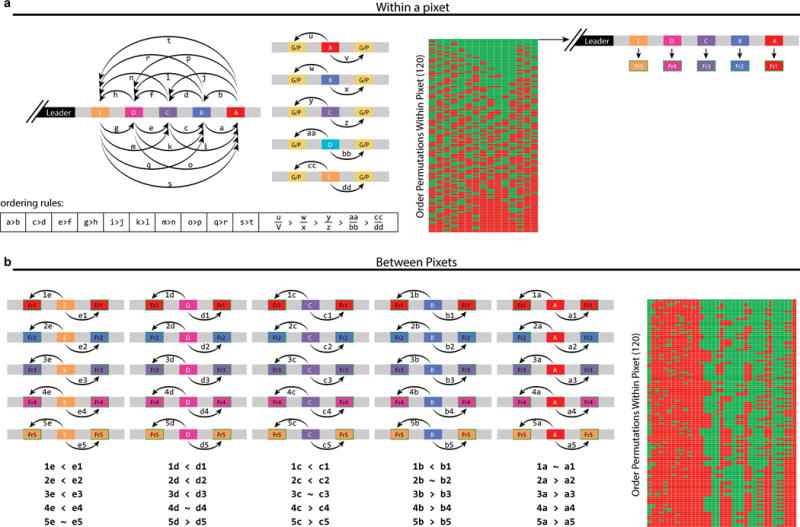
Recall of frame order over time based on position in the CRISPR array. a. Initial set of rules to test the order of spacers within a pixet. Every time two spacers from the same pixet are found in a single array, their relative physical location (with respect to the leader) is extracted. As is the location of each spacer relative to spacers drawn from the genome or plasmid (G/P). The actual sequence of electroporated protospacers should occupy arrays in a predictable physical arrangement, as described by these ordering rules. Every possible permutation of spacers within a pixet is tested against each of these rules and, if a permutation satisfies all the rules, spacers are assigned to frame. b. Second set of tests to compare between pixets. If no permutation satisfies all of the tests in a, spacers are compared to previously assigned spacers from other pixets pairwise when found in the same array. A larger set of rules will hold true for the actual sequence of electroporated protospacers when compared against previously assigned spacers. Again, all possible order permutations are tested, and order is assigned based on the best overall satisfaction of these ordering rules.
Extended Data Figure 7.

Quantification of errors by source. Includes any instance of a called spacer that does not match the supplied protospacer.
Extended Data Figure 8.
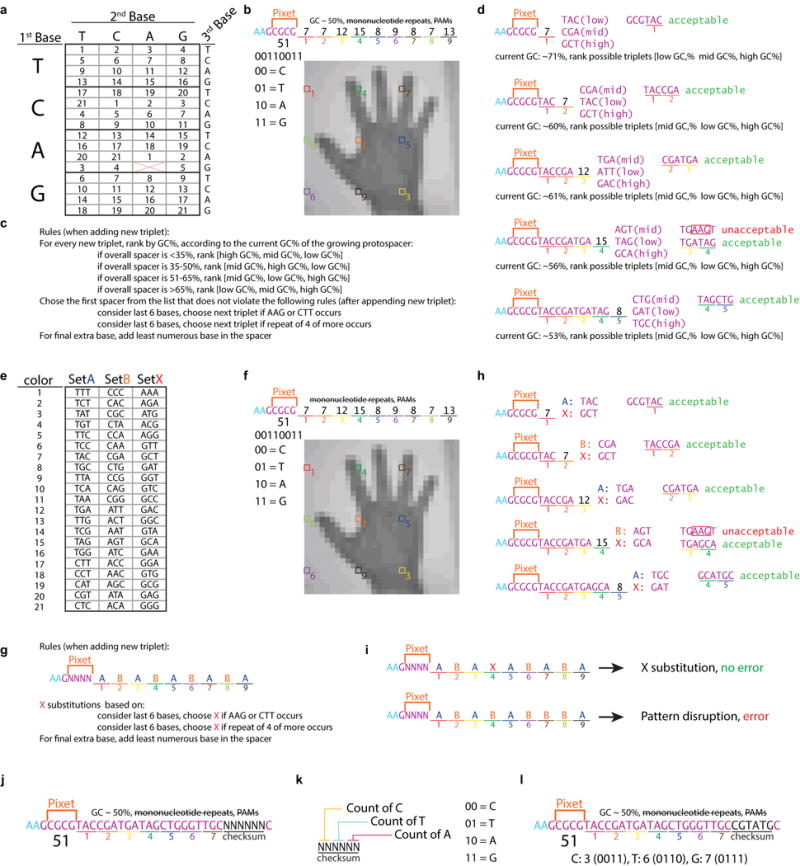
Methods of image encoding for error-correction. a-d. Method used in Figure 1. a. Triplet code to flexibly specify 21 colors. b. Example of a pixet to be encoded into nucleotide space with pixel values marked. c. Rules specifying how the protospacer will be built. d. Example of the build of the protospacer. The AAG introduced by the addition of pixel 4 is unacceptable and invokes the flexible switch to another triplet. In a test of the extendibility of this encoding scheme, we ran three random sets of 100 million different nine-color orderings through the sequence build and found that 99.86 ± 0.07 % of color orders were able to satisfy the requirements we set out without optimization by hand. e-i. Method of alternating clusters for error correction. e. Triplet assignment to clusters A, B, and X. f. Example of a pixet to be encoded into nucleotide space with pixel values marked. g. Rules for adding new triplets in this scheme. h. Example of the build of the protospacer. The AAG introduced by the addition of pixel 4 is unacceptable and invokes the flexible switch to cluster X. i. Example of an error signal. j-l. Method of checksum error correction. j. Annotation of protospacer with the addition of a checksum. k. Annotation of the checksum itself. l. Full protospacer with checksum implemented.
Supplementary Material
Acknowledgments
S.L.S. is a Shurl and Kay Curci Foundation Fellow of the Life Sciences Research Foundation. The project was supported by grants from the National Institute of Mental Health (5R01MH103910), National Human Genome Research Institute (5P50HG005550), and Simons Foundation Autism Research Initiative (368485) to G.M.C., the National Institute of Neurological Disorders and Stroke (5R01NS045523) to J.D.M and an Allen Distinguished Investigator Award from the Paul G. Allen Frontiers Group to J.D.M. We thank Gleb Kuznetsov for comments on the manuscript.
Footnotes
Supplementary Information is linked to the online version of the paper at www.nature.com/nature.
Author Contributions
S.L.S. performed experiments, analyzed data, and wrote the manuscript. S.L.S. designed the study with input from J.N, J.D.M. and G.M.C. S.L.S. wrote custom Python analysis software. J.N., J.D.M. and G.M.C. discussed results and commented on the manuscript.
Competing Financial Interests
S.L.S. J.N, J.D.M., and G.M.C. are inventors on a provisional patent (62/296,812) filed by the President and Fellows of Harvard College that covers the work in this manuscript. A complete accounting of the financial interests of G.M.C. is listed at: http://arep.med.harvard.edu/gmc/tech.html.
References
- 1.Church GM, Gao Y, Kosuri S. Next-generation digital information storage in DNA. Science. 2012;337:1628. doi: 10.1126/science.1226355. [DOI] [PubMed] [Google Scholar]
- 2.Goldman N, et al. Towards practical, high-capacity, low-maintenance information storage in synthesized DNA. Nature. 2013;494:77–80. doi: 10.1038/nature11875. [DOI] [PMC free article] [PubMed] [Google Scholar]
- 3.Gibson DG, et al. Creation of a bacterial cell controlled by a chemically synthesized genome. Science. 2010;329:52–56. doi: 10.1126/science.1190719. [DOI] [PubMed] [Google Scholar]
- 4.Clelland CT, Risca V, Bancroft C. Hiding messages in DNA microdots. Nature. 1999;399:533–534. doi: 10.1038/21092. [DOI] [PubMed] [Google Scholar]
- 5.Adleman LM. Molecular computation of solutions to combinatorial problems. Science. 1994;266:1021–1024. doi: 10.1126/science.7973651. [DOI] [PubMed] [Google Scholar]
- 6.Davis J. Microvenus. Art Journal. 1996;55:70–74. doi: 10.2307/777811. [DOI] [Google Scholar]
- 7.Barrangou R, et al. CRISPR provides acquired resistance against viruses in prokaryotes. Science. 2007;315:1709–1712. doi: 10.1126/science.1138140. [DOI] [PubMed] [Google Scholar]
- 8.Shipman SL, Nivala J, Macklis JD, Church GM. Molecular recordings by directed CRISPR spacer acquisition. Science. 2016 doi: 10.1126/science.aaf1175. [DOI] [PMC free article] [PubMed] [Google Scholar]
- 9.Amitai G, Sorek R. CRISPR-Cas adaptation: insights into the mechanism of action. Nature reviews Microbiology. 2016;14:67–76. doi: 10.1038/nrmicro.2015.14. [DOI] [PubMed] [Google Scholar]
- 10.Sternberg SH, Richter H, Charpentier E, Qimron U. Adaptation in CRISPR-Cas Systems. Molecular cell. 2016;61:797–808. doi: 10.1016/j.molcel.2016.01.030. [DOI] [PubMed] [Google Scholar]
- 11.van der Oost J, Jore MM, Westra ER, Lundgren M, Brouns SJ. CRISPR-based adaptive and heritable immunity in prokaryotes. Trends in biochemical sciences. 2009;34:401–407. doi: 10.1016/j.tibs.2009.05.002. [DOI] [PubMed] [Google Scholar]
- 12.Deveau H, et al. Phage response to CRISPR-encoded resistance in Streptococcus thermophilus. Journal of bacteriology. 2008;190:1390–1400. doi: 10.1128/jb.01412-07. [DOI] [PMC free article] [PubMed] [Google Scholar]
- 13.Paez-Espino D, et al. Strong bias in the bacterial CRISPR elements that confer immunity to phage. Nature communications. 2013;4:1430. doi: 10.1038/ncomms2440. [DOI] [PubMed] [Google Scholar]
- 14.Westra ER, et al. Type I-E CRISPR-cas systems discriminate target from non-target DNA through base pairing-independent PAM recognition. PLoS genetics. 2013;9:e1003742. doi: 10.1371/journal.pgen.1003742. [DOI] [PMC free article] [PubMed] [Google Scholar]
- 15.Shmakov S, et al. Pervasive generation of oppositely oriented spacers during CRISPR adaptation. Nucleic acids research. 2014;42:5907–5916. doi: 10.1093/nar/gku226. [DOI] [PMC free article] [PubMed] [Google Scholar]
- 16.Nunez JK, Harrington LB, Kranzusch PJ, Engelman AN, Doudna JA. Foreign DNA capture during CRISPR-Cas adaptive immunity. Nature. 2015;527:535–538. doi: 10.1038/nature15760. [DOI] [PMC free article] [PubMed] [Google Scholar]
- 17.Wang J, et al. Structural and Mechanistic Basis of PAM-Dependent Spacer Acquisition in CRISPR-Cas Systems. Cell. 2015;163:840–853. doi: 10.1016/j.cell.2015.10.008. [DOI] [PubMed] [Google Scholar]
- 18.Yosef I, Goren MG, Qimron U. Proteins and DNA elements essential for the CRISPR adaptation process in Escherichia coli. Nucleic acids research. 2012;40:5569–5576. doi: 10.1093/nar/gks216. [DOI] [PMC free article] [PubMed] [Google Scholar]
- 19.Diez-Villasenor C, Almendros C, Garcia-Martinez J, Mojica FJ. Diversity of CRISPR loci in Escherichia coli. Microbiology (Reading, England) 2010;156:1351–1361. doi: 10.1099/mic.0.036046-0. [DOI] [PubMed] [Google Scholar]
- 20.Weinberger AD, et al. Persisting viral sequences shape microbial CRISPR-based immunity. PLoS Comput Biol. 2012;8:e1002475. doi: 10.1371/journal.pcbi.1002475. [DOI] [PMC free article] [PubMed] [Google Scholar]
- 21.Held NL, Herrera A, Cadillo-Quiroz H, Whitaker RJ. CRISPR associated diversity within a population of Sulfolobus islandicus. PLoS One. 2010;5 doi: 10.1371/journal.pone.0012988. [DOI] [PMC free article] [PubMed] [Google Scholar]
- 22.Yosef I, et al. DNA motifs determining the efficiency of adaptation into the Escherichia coli CRISPR array. Proc Natl Acad Sci U S A. 2013;110:14396–14401. doi: 10.1073/pnas.1300108110. [DOI] [PMC free article] [PubMed] [Google Scholar]
- 23.Westra ER, et al. CRISPR immunity relies on the consecutive binding and degradation of negatively supercoiled invader DNA by Cascade and Cas3. Molecular cell. 2012;46:595–605. doi: 10.1016/j.molcel.2012.03.018. [DOI] [PMC free article] [PubMed] [Google Scholar]
- 24.Semenova E, et al. Interference by clustered regularly interspaced short palindromic repeat (CRISPR) RNA is governed by a seed sequence. Proc Natl Acad Sci U S A. 2011;108:10098–10103. doi: 10.1073/pnas.1104144108. [DOI] [PMC free article] [PubMed] [Google Scholar]
- 25.Zhirnov V, Zadegan RM, Sandhu GS, Church GM, Hughes WL. Nucleic acid memory. Nature materials. 2016;15:366–370. doi: 10.1038/nmat4594. [DOI] [PMC free article] [PubMed] [Google Scholar]
- 26.Hsiao V, Hori Y, Rothemund PW, Murray RM. A population-based temporal logic gate for timing and recording chemical events. Molecular systems biology. 2016;12:869. doi: 10.15252/msb.20156663. [DOI] [PMC free article] [PubMed] [Google Scholar]
- 27.McKenna A, et al. Whole-organism lineage tracing by combinatorial and cumulative genome editing. Science. 2016;353:aaf7907. doi: 10.1126/science.aaf7907. [DOI] [PMC free article] [PubMed] [Google Scholar]
- 28.Frieda KL, et al. Synthetic recording and in situ readout of lineage information in single cells. Nature. 2017;541:107–111. doi: 10.1038/nature20777. [DOI] [PMC free article] [PubMed] [Google Scholar]
- 29.Erlich Y, Zielinski D. DNA Fountain enables a robust and efficient storage architecture. Science. 2017;355:950–954. doi: 10.1126/science.aaj2038. [DOI] [PubMed] [Google Scholar]
- 30.O’Shea JP, et al. pLogo: a probabilistic approach to visualizing sequence motifs. Nat Methods. 2013;10:1211–1212. doi: 10.1038/nmeth.2646. [DOI] [PubMed] [Google Scholar]
Associated Data
This section collects any data citations, data availability statements, or supplementary materials included in this article.


