

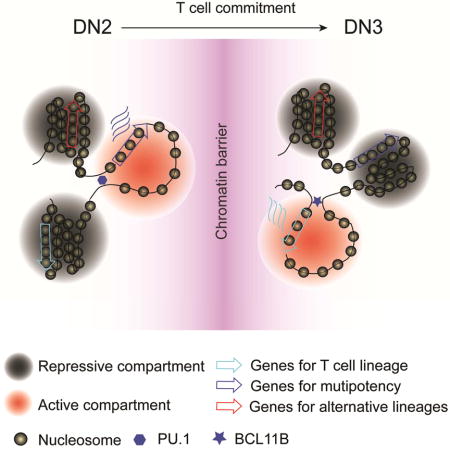
Summary
How chromatin reorganization coordinates differentiation and lineage commitment from hematopoietic stem/progenitor cells (HSPC) to mature immune cells has not been well understood. Here, we carried out an integrative analysis of chromatin accessibility, topologically associating domains, AB compartments, and gene expression from HSPC to CD4+CD8+ double positive T cells. We found that abrupt genome-wide changes at all three levels of chromatin organization occur during the transition from double negative stage 2 (DN2) to DN3, accompanying the T lineage commitment. The transcription factor BCL11B, a critical regulator of T cell commitment, is associated with increased chromatin interaction and Bcl11b deletion compromised chromatin interaction at its target genes. We propose that these large-scale and concerted changes in chromatin organization present an energy barrier for the cell to reverse its fate to earlier stages or to redirect to alternatives, thus locking the cell fate into the T lineages.
eTOC BLURB
Cellular differentiation and cell fate choice involve substantial chromatin reorganization. Through an integrative analysis of regulome, 3D nucleome and transcriptome, Hu and Cui et al. uncover abrupt global changes in regulome and 3D nucleome at the DN2-to-DN3 transition, establishing a chromatin barrier to lock cell fate into the T lineages.
Introduction
The chromatin of mammalian genome is organized into a highly ordered structure of different hierarchies including large-scale organizations such as “AB” compartments and topologically associating domains (TADs) (Dekker and Heard, 2015; Denker and de Laat, 2016; Dixon et al., 2016). The AB compartments are implied as transcriptionally active and repressive chromatin environments, respectively. While the two large-scale chromatin organization could be created through independent mechanisms (Flyamer et al., 2017), both AB compartments and TADs contribute to transcription regulation together with fine-scale chromatin looping between regulatory elements and gene promoters (Dekker and Heard, 2015; Denker and de Laat, 2016; Dixon et al., 2016; Rao et al., 2014).
The study of chromatin conformation in the immune system is an emerging field (Hu and Zhao, 2016). A pioneer study by Spilianakis and Flavell (2004) illustrated the 3D chromatin organization regulated by GATA3 at the locus control region of TH2 cells. We and others explored 3D chromatin organization and its potential regulatory roles in transcription in various cultured and primary cells of the hematopoietic systems (Bunting et al., 2016; Chepelev et al., 2012; Javierre et al., 2016; Kieffer-Kwon et al., 2013; Lin et al., 2012; Martin et al., 2015; Mumbach et al., 2017; Placek et al., 2017). Nevertheless, few have investigated the potential role of chromatin re-organization in cell fate decision in immune cells, especially under physiologic conditions.
The differentiation of hematopoietic stem/progenitor cells (HSPC) to the T cell lineages involves several phenotypically well-defined intermediate stages including multipotent progenitor (MPP), common lymphoid progenitor cells (CLP), early T precursor cells (ETP), CD4 and CD8 double negative 2 (DN2), DN3, DN4 and double positive (DP) cells before the mature CD4 or CD8 single positive T cells are generated (Yui and Rothenberg, 2014). Among these stages, the DN2-to-DN3 transition is associated with T lineage commitment and the DN4-to-DP transition represents a key step for β-selection to ensure in-frame TCRβ gene rearrangement for committed thymocytes (Carpenter and Bosselut, 2010). The choice of T cell fate is driven by Notch signaling and is controlled by the orchestration of key transcription factors (Mercer et al., 2011; Naito et al., 2011; Yui and Rothenberg, 2014). Explorations on the epigenetic landscape of early T cell precursors have uncovered critical roles of epigenetic marking in establishing T cell identity (Zhang et al., 2012). However, due to technical difficulties, how chromatin states and 3D chromatin interaction coordinate early T differentiation and commitment have not been examined.
In this study, we systematically investigated the dynamics of regulomes, 3D nucleomes and transcriptomes of eight developmental stages from HSPC to mature CD4+ T cells. Our results revealed abrupt genome-wide changes in chromatin accessibility, intra-TAD connectivity and AB compartment organization during the transition from DN2 to DN3, a trend further re-enforced at the DN4-to-DP transition. Our results suggested that a chromatin barrier was established during early T cell development to lock the cells into the T cell fate.
Results
Accessible chromatin at genes with critical functions in early T cells
To investigate the dynamics of regulomes during differentiation of HSPC to T cells, we isolated HSPC, MPP and CLP from mouse bone marrow, and ETP, DN2, DN3, DN4 and DP cells from thymus (Bhandoola and Sambandam, 2006) (Figures 1A and S1A). For each cell type, we profiled its genome-wide distribution of DHSs by applying scDNase-seq (Jin et al., 2015) to 1000 cells (Table S1). Examination of the DHS data revealed dynamic regulation of chromatin accessibility at regulatory regions of genes with critical functions in early T cell development. Spi1 encodes the ETS-domain transcription factor PU.1, required for multipotency of hematopoietic progenitors and the differentiation to myeloid and B-lymphoid cells (Yui and Rothenberg, 2014). The expression of Spi1 was high from HSPC to DN2, reduced in DN3, and reached basal level in DN4 and DP cells (Figure 1B, numbers in parentheses in left panel) (Zhang et al., 2012). The Spi1 promoter exhibited a substantial reduction in accessibility at the DN3 stage and then became largely inaccessible at the DP stage (Figure 1B, blue box in left panel). Even though the expression of Spi1 decreased by over 2-fold from ETP to DN2, there was no detectible change in chromatin accessibility at the promoter until the next transition, suggesting that the chromatin compaction at the Spi1 promoter lags behind expression change. In contrast, Bcl11b, which encodes a zinc finger transcription factor required for the differentiation and survival of αβ T lymphocytes (Ikawa et al., 2010; Li et al., 2010a; Li et al., 2010b), only started to express in precursors immediately before T cell commitment at the DN2 stage (Figure 1B, numbers in parentheses in middle panel). However, its promoter region and a part of a super-enhancer region located ~760K bp downstream (Li et al., 2013) appeared accessible as early as in HSPC. The Bcl11b expression was associated with a substantial increase in DHS both at the promoter and the super enhancer regions at DN2, further strengthened at the DN3 and DP stages (Figure 1B, solid red rectangles in middle panel). This increase in chromatin accessibility was also notable at several clusters of regulatory sites that were inaccessible in HSPCs, located between Bcl11b promoter and the super enhancer (Figure 1B, dashed red rectangles in middle panel). The dynamics of chromatin accessibility suggests that the activation and sustained expression of Bcl11b was accompanied by a step-wise activation of poised enhancer from progenitors and new enhancers acquired during development. Notch1, which encodes a transmembrane receptor of the Notch signaling pathway required for T cell commitment, also exhibited dynamic changes in expression and enhancer usage during development (Figure 1B and more details later). Together, these initial analyses indicate that the dynamics of chromatin accessibility at regulatory regions of critical regulators was characterized by a step-wise opening or closing preferentially occurring during the transitions of DN2-to-DN3 and or DN4-to-DP stages of development.
Figure 1. Transformation of chromatin accessibility landscape at DHSs.
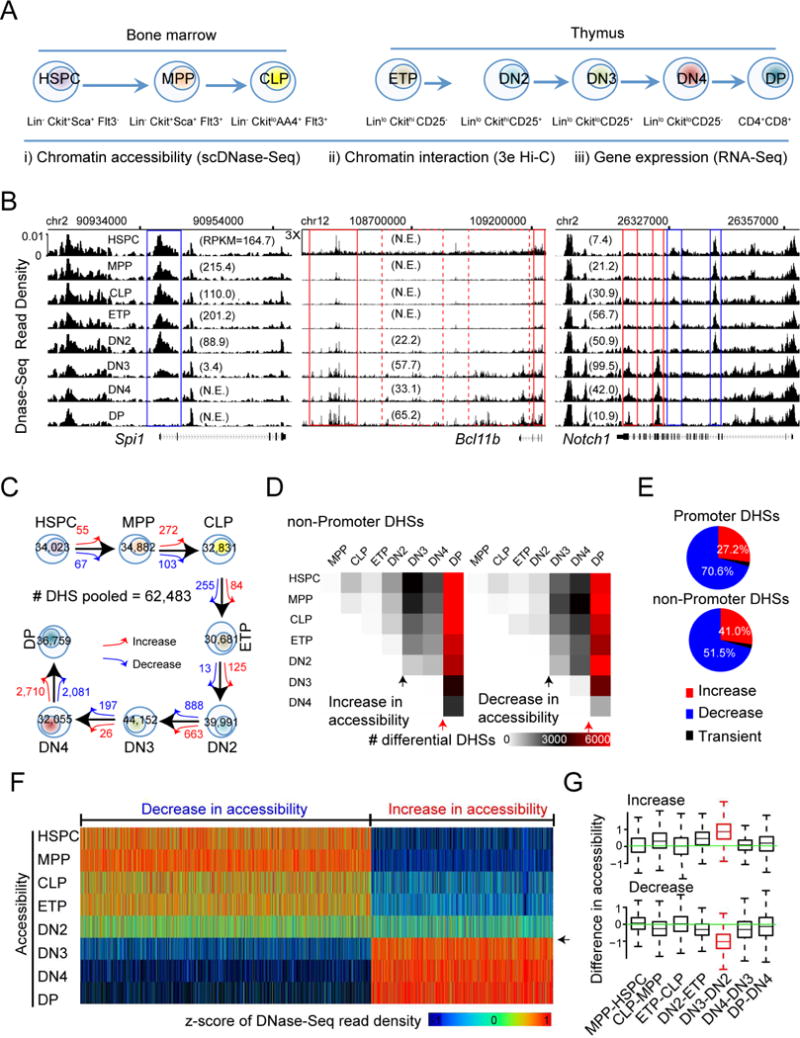
(A) The combination of cell surface markers used to purify HSPC, MPP and CLP cells from mouse bone marrow, and ETP, DN2, DN3, DN4 and DP cells from mouse thymus. Indicated at the bottom are the techniques for genome-wide profiles of chromatin accessibility, chromatin interaction and gene expression.
(B) UCSC genome browser images showing the distribution of normalized scDNase-Seq reads for all developmental stages from HSPC to DP for genomic regions harboring Spi1 (left panel), Bcl11b (middle panel) and Notch1 (right panel). Number of independent experiments = 2. Numbers in parenthesis: gene expression value by RPKM; N.E. not expressed (RPKM<1); 3X: zoom-in 3-folder on y-axis.
(C) Number of DHSs identified for each stage and numbers of differential DHSs, showing an increase (red arrow) or decrease (blue arrow) in chromatin accessibility between consecutive stages.
(D) Heat map showing the numbers of differential DHSs in non-promoter regions, increasing (left panel) or decreasing (right panel) in chromatin accessibility, between any two stages from HSPC to DP. Black and red arrow heads marked the DN2-to-DN3 transition and the DN4-to-DP transition, respectively.
(E) Distributions of concordant differential DHSs in promoter regions (upper panel) and in non-promoter regions (lower panel).
(F) Heat map visualization of scDNase-Seq read across all developmental stages for non-promoter DHSs showing concordant change in chromatin accessibility from HSPC to DP cells but no remarkable difference in chromatin accessibility at the DN4-to-DP transition. The read densities were transformed into z-scores per DHS (column). Arrowhead marks the DN2 to DN3 transition.
(G) Box plot for the distribution of the difference in the z-scored scDNase-seq read density between two neighboring stages for DHSs that exhibited a concordant increase (upper panel) or decrease (lower panel) in accessibility from HSPC to DP cells but not at the DN4-to-DP transition. Highlighted in red referred to the DN2-to-DN3 transition. The top and bottom of the box represent 25th and 75th percentile, respectively. The upper whisker represents the smaller of the maximum and upper quartile plus 1.5 IQR (interquartile range), while the lower whisker represents the larger of the minimum and lower quartile minus 1.5 IQR.
Regulome reorganization is associated to T cell commitment
To test the generality of the above observations, we identified a total of 62,483 DHSs from all developmental stages and identified differential DHSs between any two developmental stages. A substantial fraction of the DHSs displayed differential accessibility during the differentiation from HSPC to DP: ~24,000 (59%) in non-promoter regions and ~6000 (33%) in promoter regions (Figures S1B and S1C). The largest changes in accessibility at DHSs between neighboring stages were observed for the transition from DN2 to DN3 and for the transition from DN4 to DP, while only marginal changes were detected for all other combinations (Figure 1C). A heat map visualization of the number of increased and decreased DHSs for all pairs of stages for non-promoter regions (Figure 1D) and promoter regions (Figure S1D) revealed one abrupt global change at the DN2-to-DN3 transition and another at the DN4-to-DP transition.
To further characterize the dynamics of DHSs across the eight development stages, we defined a change in accessibility to be concordant for a DHS if an increase (or decrease) in accessibility was found between at least two stages, but a reversal of this change did not occur between any other two stages. Among all the differential DHSs, 93-98% exhibited concordant changes, while only 2-7% exhibited transient changes (Figure 1E). This result implies that the reorganization of chromatin accessibility landscape during early T cell development is characterized by a unidirectional opening at regulatory regions of target lineage and a unidirectional closing at regulatory regions of alternative lineages.
To examine the relationship of DHS dynamics between the DN2-to-DN3 transition and the DN4-to-DP transition, we separated all DHSs with concordant changes from HSPC to DP into two groups based on whether significant changes were observed at the DN4-to-DP transition or not. Of all the 24,000 differential DHSs in non-promoter regions, about ~13,000 changed accessibility during the DN4-to-DP transition (Figure S1E). Gene ontology analysis revealed that increased DHSs were linked to T cell differentiation, while decreased DHSs were associated with differentiation of alternative lineages (Figure S1E). DHSs with a concordant increase are generally enriched in RORγt, ETS, and TCF motifs (Figure S1E). DHSs with concordant decreases during the DN4-to-DP transition were not enriched in any specific transcription factor binding motifs. However, DHSs with concordant decreases in earlier stages other than the DN4-to-DP transition were specifically enriched with the binding motif of PU.1 (Figure S1E).
To examine the dynamic DHS changes during earlier differentiation, we utilized heat maps to visualize accessibility changes across all stages for the DHSs that changed significantly at stages other than the DN4-to-DP transition. This analysis uncovered a remarkable abrupt transformation of both accessibility increase and decrease at the DN2-to-DN3 transition, a check-point for T cell commitment (Figure 1F, arrow head), which was further confirmed by a quantitative comparison of the difference in DHSs between two neighboring stages (Figure 1G). Interestingly, the DHSs exhibiting significant changes at the DN4-to-DP transition also exhibited a global transformation at the DN2-to-DN3 transition (Figure S1F, black arrow head) and two transitions showed the same direction of change (Figure S1G). Together, these results indicated an abrupt global reorganization of accessibility of DHSs at the DN2-to-DN3 transition associated with T lineage commitment, which is further reinforced at the later transition from DN4 to DP cells.
Changes of intra-TAD connectivity coincide with T cell commitment
Topologically associated domains (TADs) are high-order chromatin organization that may impact gene expression and cell differentiation programs (Dixon et al., 2012; Nora et al., 2012; Sexton et al., 2012). We investigated if the re-organization of chromatin at of TAD level also occurs at key check-points of early T cells development by obtaining genome-wide chromatin interaction data using the 3e Hi-C protocol (Ren et al., 2017) (Table S2). A comparison of compartment organization across chromosomes between replicates, based on the principal component analysis (Lin et al., 2012), revealed that biological replicates were highly reproducible (Figures S2A and S2B).
To explore potential domain-wide changes in interaction frequency during differentiation, we identified a total of 4,176 TAD boundaries from the eight developmental stages (Figure S2C). We narrowed down to TADs with significant variation in domain scores (or intra-TAD connectivity), defined as the ratio of intra-TAD PETs to all its cis PETs (Chandra et al., 2015), across the eight developmental stages. Inspection of key regulator genes of hematopoiesis revealed certain discordance in gene silencing and reorganization of interaction frequency within TADs during the differentiation of HSPC to T cells. Meis1, encoding a transcription factor critical for self-renewal of HSPCs (Ariki et al., 2014), became silenced at the DN2 stage (Figure 2A, numbers in parentheses in left panel). However, the chromatin interaction frequency within the TAD enclosing the Meis1 locus and an adjacent TAD only started to decrease at DN3 or DN4 (Figures 2B, arrow heads in panels II & III), suggesting a delay in the loss of chromatin connectivity among regulatory sites following gene silencing. In contrast, a co-incidental increase in chromatin interaction frequency within the TAD containing the Bcl11b gene was observed as the gene was activated at the DN2 stage (Figures 2B, arrow heads in panels IV and V).
Figure 2. Dynamics of intra-TAD connectivity.
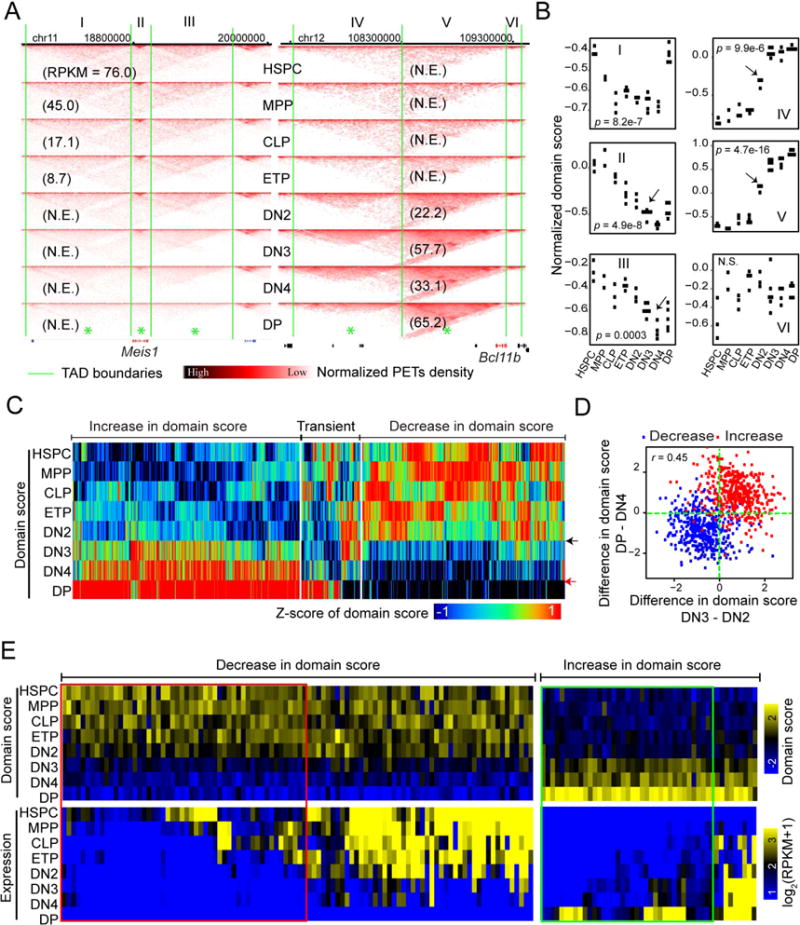
(A) Examples of interaction matrices for TADs enclosing genomic locus Meis1 (left panel) and Bcl11b (right panel), marked from I to VI. Asterisks denoted TADs showing substantial variation in domain score across all stages. Green lines: TAD boundaries; numbers in parentheses: gene expression values (RPKM). Pooled from 2-5 independent experiments.
(B) Dot plots showing the distribution of domain score of TAD across all developmental stages of all Hi-C libraries for TADs labeled in panel A. Adjusted P-value by ANOVA. Number of independent experiments represented by the number of dots; Arrow heads: stages where a substantial change in domain score was first observed during the development of early T cells.
(C) Heat map showing the distribution of domain score (transformed into z-score) across the eight stages from HSPC to DP cells for TADs (hierarchically clustered) showing substantial variation in intra-TAD connectivity across the stages (adjusted p-value < 0.05; ANOVA). Black and red arrowheads marked the DN2-to-DN3 transition and the DN4-to-DP transition, respectively.
(D) Scatter plot for the change in the z-score of domain score at the DN2-to-DN3 transition and at the DN4-to-DP transition for TAD showing a decrease (blue dots) or increase (red dots) in domain scores as defined in panel C. r: Pearson’s correlation coefficient.
(E) Heat map visualization of the average expression of differential genes (fold-change >2) within TADs that show decrease or increase in domain score from HSPC to DP and domain score of the TADs, hierarchically clustered based on the average expression. Left penal: TADs that show an average expression of differential genes higher than 1 in HSPC and less than 1 in DP; Right penal: TADs that show an average expression of the differential genes less than 1 in HSPC and higher than 1 in DP. Red rectangle: TADs with change in domain score falling behind change in expression; Green rectangle: TADs with change in domain score preceding change in expression.
To explore the global changes in chromatin interaction within TADs across the developmental process, we employed unsupervised hierarchical clustering analysis of TADs exhibiting significant variations in the domain score. As shown by the heat map, a sharp global change in domain scores of many TADs was observed from DN2 to DN3 (Figure 2C, black arrow). Additionally, another global change of domain scores occurred from DN4 to DP (Figure 2C, red arrow). These results were confirmed by a quantitative comparison of the domain score differences between two neighboring stages (Figure S2D, red and green lines). Further analysis revealed that the changes in domain scores between the two transitions were positively correlated (Figure 2D), suggesting that the changes in interaction within TADs during the earlier DN2-to-DN3 transition are reinforced by the changes during the later DN4-to-DP transition. Together, we discovered a global reorganization of chromatin structure at local DHSs as well as intra-TAD connectivity during the transition from DN2 to DN3, a check-point of T lineage commitment, which is reinforced at a later developmental transition from DN4 to DP stages.
Relationship between changes in intra-TAD connectivity and gene expression
The change in intra-TAD connectivity is correlated with the change in chromatin accessibility and the change in transcription of enclosing genes (Krijger et al., 2016). As expected, DHSs from TADs with increased connectivity tended to become more accessible, while those from TADs with decreased connectivity generally became less accessible during the developmental process (Figure S2E). As for expression change, genes from TADs with an increase in domain score generally increased in expression (Figure S2F; upper panel). In contrast, genes from TADs with a decrease in intra-TAD connectivity generally reduced their expression from HSC to DP (Figures S2F; lower panel).
To investigate the timing relationship between changes in intra-TAD connectivity and gene expression, we focused on TADs that showed a decrease in domain score and narrowed down to those that contained genes initially expressed in HSPCs but finally silenced in DPs. The analysis revealed that the decrease in domain score lagged behind the expression decrease for 50% of TADs (Figure 2E, red rectangle). As for TADs that showed an increase in domain score, we narrowed down to those that contained genes initially silenced in HSPCs but finally expressed in DPs. In about 75% of the TADs, the increase in intra-TAD connectivity preceded the expression onset of the enclosing genes (Figure 2E, green rectangle), suggesting that the chromatin interactions are pre-configured before actual gene activation.
Reorganization of 3D nucleome at key regulators underlies T cell commitment
The abrupt global changes of chromatin accessibility and TAD connectivity at the DN2-to-DN3 and the DN4-to-DP transitions led us to ask whether gene transcription program would follow the same trend. To this end, we identified differentially expressed genes during development and determined those with a concordant increase or decrease in expression by following the same rules introduced for DHS and interaction analyses (Table S3). Surprisingly, a large fraction (up to 46%) of the differentially expressed genes exhibited transient changes during the developmental process (Figure 3A). Nevertheless, for genes exhibiting concordant expression increases, we observed an apparent transition in expression from the DN4 to DP stage (Figure 3B, red arrow), while only a mild transition at the DN2 to DN3 transition; for the genes showing concordant expression decreases, an apparent transition occurred from the HSPC to the MPP or CLP stages (Figure 3B, blue arrow), corresponding to the loss of full-lineage potentials of HSPCs in hematopoiesis.
Figure 3. Key regulators of T cells exhibit a substantial increase in interaction.
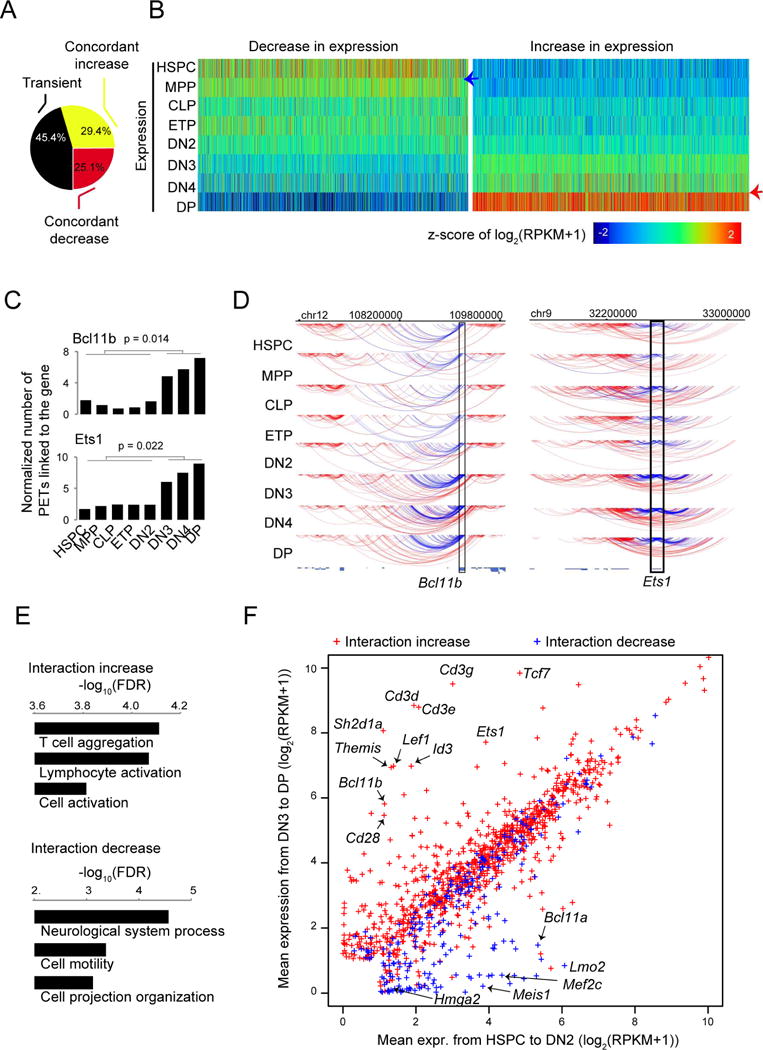
(A) Distribution of genes showing concordant increase, concordant decrease or transient changes in expression from HSPC to DP.
(B) Heatmap for the distribution of expression for genes showing concordant increase or decrease in expression from HSPC to DP cells.
(C) Bar graphs showing examples of genes with a substantial increase (Bc1llb and Ets1) in the number of gross interacting PETs linked to the gene pooled from 2 to 5 independent experiments before and after T cell commitment. P value by t-test.
(D) Arc plot from WashU epigenome browser showing the gross interacting PETs of Bcl11b (left panel) and Ets1 (right panel) from HSPC to DP cells, down-sampled to the limiting stage. Blue lines: PETs with at least one end linking to the target locus (rectangle); Red lines: other PETs in the region. Pooled from 2-5 independent experiments.
(E) Gene ontology enrichment analysis for genes exhibiting an increase (upper panel) or decrease (lower panel) in gross interaction before and after T cell commitment.
(F) Scatter plot of the averaged expression values from HSPC to DN2 and from DN3 to DP for genes that exhibit a significant change in gross interaction before and after T cell commitment. Arrows: examples of genes with coordinated change in gross interaction and expression.
We next investigated if the reorganization of chromatin interaction of genes underlies the known transcriptional reprogramming in T cell lineage commitment. To this end, we identified 1,236 and 1,016 genes displaying significant increases and decreases in long-range interactions from the uncommitted stages (HSPC to DN2) to the committed stages (DN3 to DP), respectively (Figures S3A and Table S4). As examples, Bcl11b and Ets1 exhibited increases in chromatin interaction (Figures 3C and 3D), while Hmga2 and Meis1 exhibited decreases in chromatin interaction following T lineage commitment (Figure S3B and S3C). Gene ontology analysis revealed that the genes with increased interaction are enriched in immune functions, while the genes with decreased interaction are enriched in function terms related to lineages other than T cells such as neurological system process (Figure 3E). The decrease in chromatin interaction of a gene, potentially with distal regulatory elements, was associated with a general decrease in expression, exemplified by Hmga2, Meis1, Mef2c, Lmo2 and Bcl11a, transcription factors important for multi-potency of HSPCs and differentiation of alternative lineages (Figure 3F, blue dots). The correlation between interaction increase and expression increase was overall not remarkable (Figure 3F, red dots). However, the positive correlation was observed for a subset of genes that carry critical functions of early T cell development such as Bcl11b, Ets1, Tcf7, Cd3d, Cd3e, Cd3g, Lef1 and Slc16a5, implying that the transformation of chromatin interaction underlies the transcription re-programming of critical regulators of T cells.
A global flipping of AB compartments occurs at the DN2-to-DN3 transition
Next, we investigated the changes of AB compartment organization during the developmental process from HSPC to DP. Examination of the compartment scores (see Methods) revealed apparent compartment flipping at genomic regions harboring key transcription regulators. For examples, the repressive B compartment at the Bcl11b and Ets1 loci in HSPCs flipped to active A compartment in DPs, while the active A compartment at the Hmga2 and Meis1 loci flipped to repressive B compartment (Figures 4A and S4A). Consistent with the directions of compartment flipping, DNA-FISH revealed that the Bcl11b locus moved away from the repressive nuclear periphery, while the Meis1 locus moved closer to the nuclear periphery from HSPC cells to DP cells (Figure S4B). At a global level, we identified 1,218 genomic regions that exhibited AB compartment flipping between at least two stages during the developmental process (Figure 4B), with a substantial portion of B-to-A compartment flip occurring at compartment boundaries (Figure S4C, arrow heads).
Figure 4. Transformation of compartment organization.
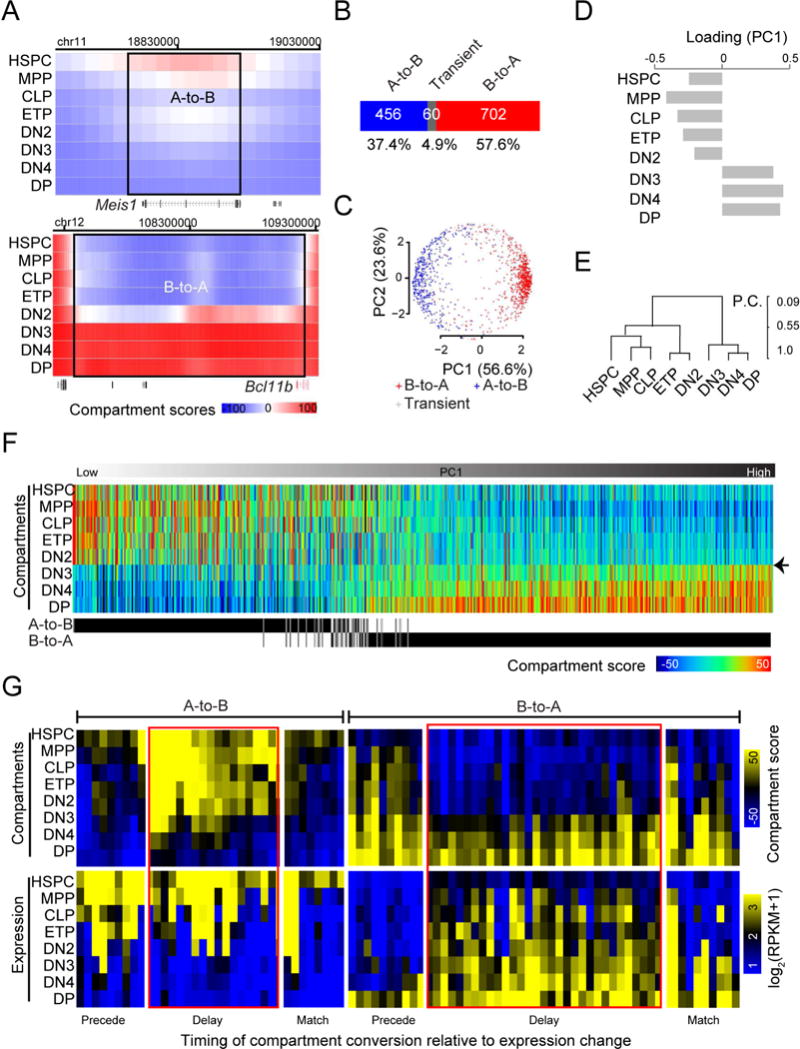
(A) Heat maps showing the distributions of compartment score across genomic regions encompassing Meis1 (upper panel) and Bcl11b for each developmental stage from HSPC to DP. Rectangles: genomic regions with compartment flip. Pooled from 2-5 independent experiments.
(B) Distribution of genomic regions showing concordant A-to-B compartment flips, concordant B-to-A flips or transient flips.
(C) Projection of genomic regions with compartment flips from a high dimensional space constituted by the compartment scores across all developmental stages onto a two-dimensional space by PCA analysis. In parenthesis is the portion of variance explained by each principal component.
(D) Bar graph showing the contribution (or loading) of each developmental stage to the first principal component from the PCA analysis in panel C.
(E) Hierarchical clustering analysis of development stages from HSPC to DP based on compartment scores of concordantly flipped genomic regions. P.C.: Pearson’s coefficient.
(F) Heat map visualization of compartment scores from HSPC to DP for genomic regions (columns) with concordant compartment flips, sorted based on the PC1 value from panel C. The A-to-B or B-to-A compartment flip of each genomic region is indicated at the bottom. Arrowhead: the DN2-to-DN3 transition.
(G) Heat map visualization of expression values and compartment scores across genes from HSPC to DP cells for genes located in A-to-B flipped compartments, expressed in HSPCs and silenced in DPs with a fold-change over 2 (left panel) and for genes located in B-to-A flipped compartments, silenced in HSPCs and expressed in DPs with a fold-change over 2 (right panel), sorted first based on a manual annotation on the timing of compartment conversion in relative to expression on or off (indicated in the bottom) and then hierarchically clustered based on compartment scores. Red rectangle: genes with a delay in compartment conversion.
By similarly defining concordant compartment flips (see Methods) as for concordant DHSs and TADs, we found that most of the compartment flips were concordant: 57.6% and 37.4% were from B-to-A and A-to-B, respectively, while only 4.9% of the flips were transient (Figure 4B). Principal component analysis on the AB compartment scores across all developmental stages for all flipped regions revealed that the two groups of concordant flipping events were clearly separated by the first component (Figure 4C), with a transformation from negatives in early stages (HSPC to DN2) to positives in later stages (DN3 to DP) (Figure 4D). Hierarchical clustering based on AB compartment scores of all flipped genomic regions separated the developmental stages into two groups, coincident with pre- and post-T lineage commitment (Figure 4E). Heat map visualization of the compartment scores for all genomic regions with concordant flipping events revealed an abrupt global flipping of AB compartment at the DN2-to-DN3 transition (Figure 4F, black arrow head), similar to the dramatic reorganization of accessibility of DHSs and intra-TAD connectivity. A comparison of the difference in AB compartment scores between neighboring stages revealed also the most difference at the DN2-to-DN3 transition (Figure S4D, red lines) and the second most difference at the DN4-to-DP transition (Figure S4D, pink line). Therefore, our data suggested that the global flipping of AB compartments together with the genome-wide reorganization of accessibility at DHSs and intra-TAD connectivity during the DN2-to-DN3 transition may establish a 3D chromatin barrier to lock the cells in the T lineage.
AB compartment conversion and change of gene expression
To test whether A and B compartments are associated with gene activation and repression, respectively, as previously suggested (Lieberman-Aiden et al., 2009), we identified 1,485 genes within the concordantly flipped compartments (Table S5). Interestingly, although the genes from the A-to-B flipped compartments were associated with the active A compartments in HSPCs, 86.1% of them were already silent in HSPCs (Figure S4E, red arrow head in left panel), suggesting again that the chromatin reorganization into a fully repressive status was delayed behind transcriptional silencing of target genes. A side-by-side comparison between the change in compartment score and the change in expression value for the genes that were initially expressed in HSPCs and finally silenced in DPs further showed that about half of the genes were silenced at an earlier stage before they were fully converted into the B compartment at a later stage (Figure 4G, red rectangle in left panel). Out of the 997 genes from the genomic regions with B-to-A compartment flip, 50% were already expressed in HSPCs (Figure S4E, red arrow head in right panel), suggesting that the B-to-A compartment conversion in the population occurs after detectable expression onset. To test this idea, we narrowed to genes that were initially silenced in HSPCs and finally expressed in DPs, and compared the timing of B-to-A compartment conversion and expression onset. The expression of about 60% preceded the B-to-A compartment conversion (Figure 4G, red rectangle in right panel). This result suggests that even within the globally repressive B compartment in HSPCs, the expression status of enclosing genes could be fine-tuned by local chromatin status. To test this possibility, we examined the histone modification patterns surrounding the promoters of target genes and noticed that 50-60% of the genes from B-to-A flipped compartments were already marked by active histone mark H3K4me3 in HSPCs (Figure S4F), an indication of a locally permissive chromatin status despite of a globally repressive environment at the compartment level in HSPCs.
We further examined the relationship of the B-to-A switch with changes in chromatin accessibility, and H3K4me3 and H3K27me3 modifications at the DN2 to DN3 transition. The analysis revealed that DHSs showing an increase in accessibility during the DN2-to-DN3 transition are enriched in compartment regions showing a B-to-A flip (Figure S4G). Similarly, DHSs showing a decrease in accessibility are enriched in compartment region showing A-to-B flip (Figure S4G). We found that compartment flip is only modestly correlated with H3K4me3 but not with H3K27me3 (data not shown). Together, the changes in chromatin accessibility are positively correlated with changes in AB compartment.
All three levels of chromatin reorganizations share the direction of change
To illustrate the concerted reorganization of chromatin, we presented an integrative view for concordant changes in AB compartments, intra-TAD connectivity and chromatin accessibility for a 9.5M genomic region in chr4 (Figure S5A). Genomic regions with B-to-A compartment flipping tended to contain a higher fraction of DHSs showing an increase in accessibility, while B-to-A compartment flipped regions contained a higher fraction of DHSs with decreased accessibility (Figure S5B). Similarly, TADs with an increase in domain scores were associated with B-to-A compartment flipping, while those with a decrease in domain scores tended to flip from A to B compartments (Figures S5C&D). Therefore, all the three levels of chromatin reorganizations, from the global AB compartments, to intra-TAD connectivity in TADs and to chromatin accessibility at the local DHSs, were generally consistent in the change of direction.
The B-to-A compartment conversion occurs at TAD boundaries
To investigate the relationship between AB compartment flipping and TADs, we mapped the AB compartment flipping events with respect to TADs from the eight developmental stages. The B-to-A compartment flipping events were significantly higher than random expectation at TAD boundaries, while the A-to-B compartment flips were significantly lower than expectation at the boundaries (Figures 5A,B). This feature was further confirmed when we visualized the position of TAD sub-regions that were covered by flipped compartments by using heat map analysis (Figure 5C), as exemplified by a B-to-A flipped region on chr1 (Figure 5D). In contrast, the A-to-B flipped compartment regions appeared to be enriched within the TADs (Figure 5E), as exemplified by an A-to-B flip within a TAD on chr9 (Figure 5F). Together, the results suggest that AB compartment organization and TAD structure are not disconnected structures of the genome organization.
Figure 5. Positional relationship between compartment flip and TAD boundary.
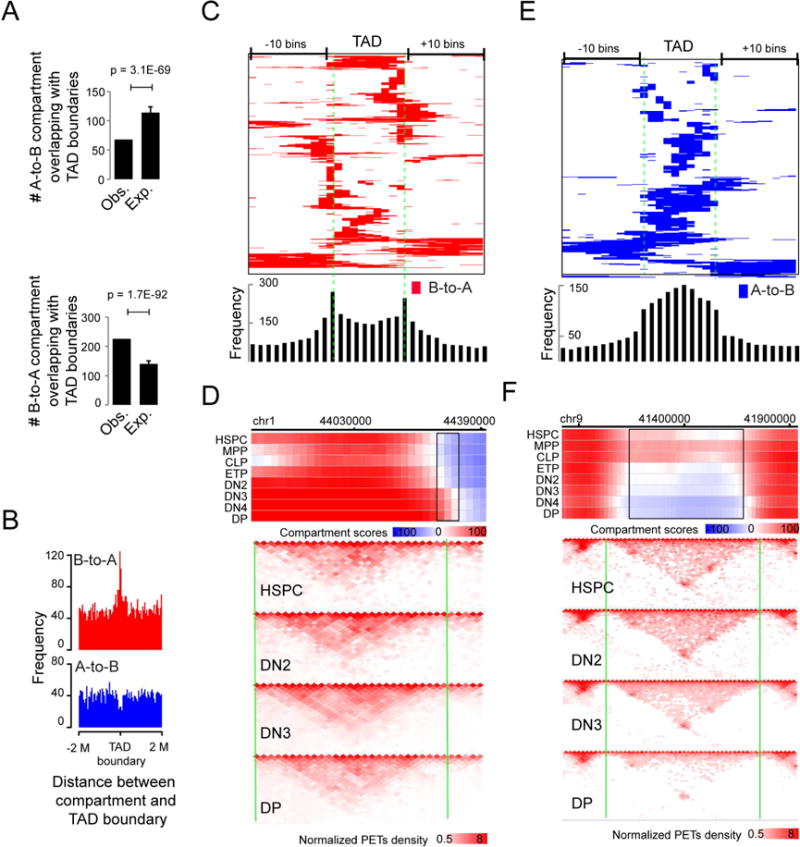
(A) Number of A-to B (upper panel) or B-to-A (lower panel) concordantly flipped compartment regions overlapping with TAD boundaries and expectations by assuming a random distribution of the flipped compartment regions across the genome. P-value by t-test. Mean ± standard deviation.
(B) Frequencies of the distance between the center of the B-to-A (upper panel) or A-to-B (lower panel) flipped compartment regions and TAD boundary.
(C) Heat map showing the distribution of B-to-A flipped genomic regions across TADs (>200K bps), equally divided into 10 portions and extended 10 bins on both sides. Bottom panel: the frequency of A-to-B compartment flips across TADs.
(D) Upper panel: heat map showing the distribution of compartment score across a genomic region including a B-to-A compartment flips (black rectangles) occurred at a TAD boundary (vertical green line). Lower panel: normalized interaction matrices (pooled from replicates) at a resolution of 20K bps across the same genomic regions as in the upper panel for HSPC, DN2, DN4 and DP cells. Pooled from 2-5 independent experiments (also applied to F).
(E) Heat map showing the distribution of A-to-B flipped genomic regions across TADs (>200K bps), equally divided into 10 portions and extended 10 bins on both sides. Bottom panel: the frequency of B-to-A compartment flips across TADs.
(F) Upper panel: heat map showing the distribution of compartment score across a genomic region including an A-to-B compartment flip (black rectangles) within a TAD. Vertical green lines: TAD boundaries; Lower panel: normalized interaction matrices (pooled from replicates) at a resolution of 20K bps for HSPC, DN2, DN4 and DP cells.
Data access and integration with public ChIP-Seq data
To facilitate data usage, we created an online WashU epigenome browser session including tracks of gene expression, chromatin accessibility, A/B compartment, and normalized interaction matrix for each developmental stage (see “Data and Software Availability” section for links). It also summarized genomic regions with changes in chromatin accessibility, in compartment status, and in intra-TAD connectivity during the developmental process and visualized promoter-enhancer interaction for developmental stages of pre-commitment and of post-commitment at a resolution of10K bps. The downstream regions of Bcl11b, containing a super-enhancer (Li et al., 2013) and the lincRNA ThymoD (Isoda et al., 2017), was shown as an example (Figure S5E), revealing an increased interaction with the Bcl11b promoter, confirming our earlier observation in DN3-like leukemic cell line P2C2 and in primary T cell precursors (Li et al., 2013) and others in in vitro cultured DN3 cells (Isoda et al., 2017).
To facilitate hypothesis generation, the session also included hundreds of ChIP-Seq data sets for histone modifications and transcription factors currently available for early T cells (Table S6). As an example, we explored the potential mechanism behind the enhancer switch in the gene body region of Notch1 during early T cell development. The four switched DHSs exhibited a typical feature of enhancer with the presence of H3K4me1 and absence of H3K4me3 at corresponding stages (Figure S5F, brown and gray tracks). Two of the enhancers were active pre-commitment, based on the presence of H3K27ac (Figure S5F, red arrow heads & red tracks). Interestingly, the decommission of the two enhancers was accompanied by the loss of PU.1 binding (Figure S5F, pink tracks), a transcription factor known to induce chromatin remodeling (Marecki et al., 2004). The other two enhancers were newly formed post-commitment (Figure S5F, blue arrow heads & red tracks). Remarkably in DPs the enhancers are bound by BCL11B and co-bound by a recruiter of chromatin-modulating complexes, SATB1 (Yasui et al., 2002) (Figure S5F, purple tracks). The interaction landscape anchored by the Notch1 promoter with DHSs showed no remarkable difference between pre- and post-commitment (Figure S5F, bottom two tracks). Together, the data integration indicated that the enhancer switch within the Notch1 locus involved gain and loss of TF binding specific to development stages on pre-existing chromatin structures.
BCL11B binding accompanies an increase in chromatin interaction
The commitment to T cell lineages at the DN2-to-DN3 transition is accompanied by the activation of Bcl11b (Figure 6A), which plays a key role for the lineage commitment (Ikawa et al., 2010; Li et al., 2010a; Li et al., 2010b). To explore the function of BCL11B during early T cell development, we determined the genome-wide binding profile of BCL11B in DP cells where sufficient number of cells were available for the ChIP-Seq assay. While BCL11B was highly enriched in regions associated with H3K27ac, it also bound to the H3K27ac-depleted and H3K27me3-enriched promoter region of transcription factor Id2 (Figure 6B), which is essential for NK and innate lymphoid cell development by antagonizing the basic helix-loop-helix E protein E2A and HEB (Yokota et al., 1999). The genes co-bound by BCL11B and H3K27me3 were enriched in Gene Ontology terms such as nervous system development and cell part morphogenesis (Figure 6C; Table S7), suggesting that when co-existing with H3K27me3, BCL11B serves to repress genes for other cell fates. Indeed, deletion of Bcl11b in DP cells resulted in expression increases for genes associated with both BCL11B and H3K27me3 but expression decreases for genes bound by BCL11B only (Figure 6D).
Figure 6. BCL11B binding is associated with an increase in chromatin interaction.
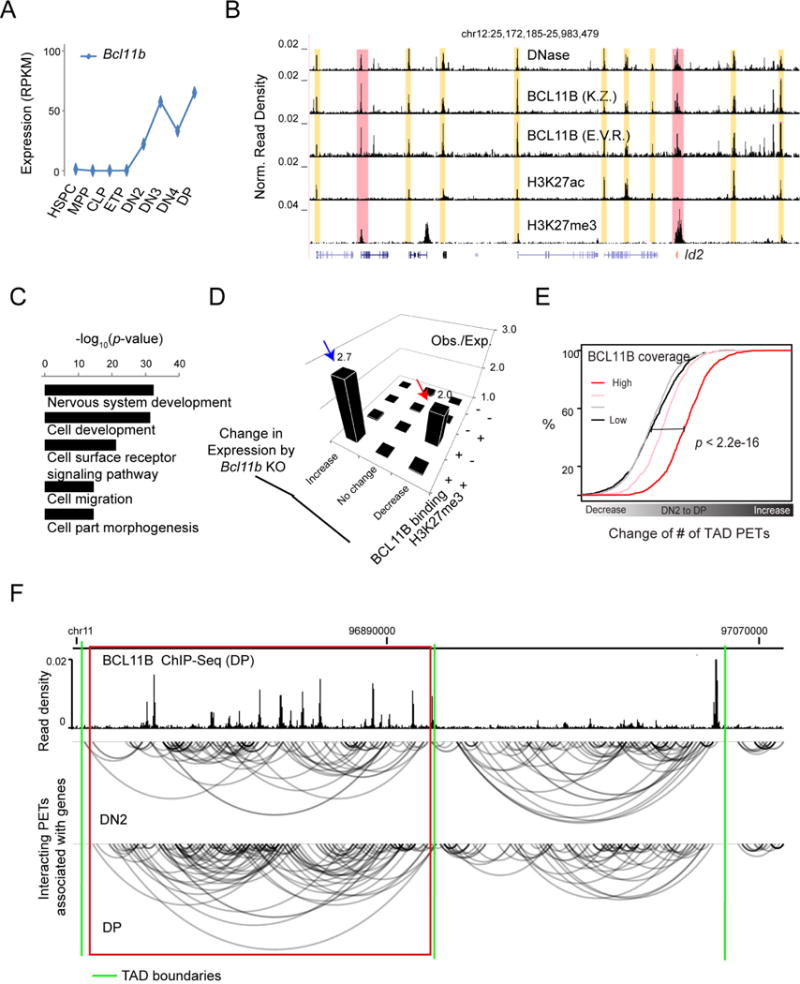
(A) Expression of Bcl11b from HSPC to DP from RNA-Seq analysis.
(B) UCSC genome browser image showing the distribution of ChIP-Seq read density across the genomic region enclosing the Id2 locus (in red) for BCL11B binding, an active histone modification H3K27ac (two independent experiments), and a repressive histone modification H3K27me3, all in DP cells. Top track: distribution of DNase-Seq read density; Yellow and pink rectangles: BCL11B binding sites enriched with H3K27ac and H3K27me3, respectively; K.Z.: a representative BCL11B Chip-Seq data from Dr. Zhao’s lab, NHLBI (two independent experiments); E.V.R.: a representative BCL11B ChIP-Seq data from Prof. Rothenberg’s lab, Cal Tech (two independent experiments).
(C) Gene Ontology enrichment analysis for genes with promoters bound by BCL11B and marked by repressive histone modification H3K27me3 in DP cells.
(D) Observed versus expected number of genes, sorted based on the status of BCL11B binding and H3K27me3 marker at promoters and expression change by Bcl11b deletion in DP cells. Blue and red arrow heads: gene set repressed and activated by BCL11B, respectively.
(E) Empirical cumulative distribution of the fold change of the number of TAD PETs from DN2 to DP cells for TADs sorted into four equal size groups based on the BCL11B coverage, defined by the percentage of genomic region bound by BCL11B in DP cells. P-value by K.-S. test.
(F) WashU genome browser showing the distribution of BCL11B ChIP-Seq reads in DPs and the distribution of intra-TAD PETs in DN2 and DP cells for a 360K bps genomic region in chromosome 11. Red rectangle: TAD enriched with BCL11B binding and showing an increase in intra-TAD PETs; Green lines: TAD boundaries.
To explore a possible role of BCL11B in the reorganization of chromatin interaction during early T cell development when it first expressed, we compared the chromatin interaction landscapes at BCL11B targets before and after T cell commitment. Significantly increased interactions were detected from DN2 to DP cells for TADs with elevated BCL11B binding in DP cells (Figure 6E), as exemplified by a TAD on chromosome 11 (Figure 6F). By integrating Hi-C data generated for bone marrow-derived DN2 and DN3 cells with public ChIP-Seq data for BCL11B binding in DN3 cells (Longabaugh et al., 2017), we found that the change of intra-TAD connectivity from primary cells during early T cell development is generally consistent with the change in interaction at the DN2-to-DN3 transition from in vitro cultured cells (Figure S6A). The analysis further revealed a remarkable increase in interactions at the DN2-to-DN3 transition for TADs that displayed more BCL11B binding in DN3s (Figure S6B), as exemplified by the TAD enclosing the Bcl11b locus itself (Figure S6C). Together, the results point to a potential role of BCL11B in regulating chromatin interaction landscape of T cells.
BCL11B facilitates chromatin interactions
Because deletion of Bcl11b in early progenitor cells results in a complete blockage of the DN2 to DN3 transition and an absence of late stage T cells (DN3, DN4, DP and single-positive T cells) (Ikawa et al., 2010; Li et al., 2010a; Li et al., 2010b), we tested the effects on chromatin accessibility and interaction by deleting Bcl11b in naïve CD4+ T cells (Figure S6D). Consistent with the observation that the regions bound by more BCL11B in naïve CD4+ T cells displayed higher chromatin interaction as compared to DN2 cells(Figure S6E), we detected more decreases in interaction induced by Bcl11b deletion in naïve CD4+ T cells for TADs with more BCL11B binding (Figure 7A), thus supporting the hypothesis that BCL11B facilitates chromatin interaction. We found no remarkable decrease in accessibility at DHSs bound by BCl11B in BCL11B-deficient cells (data not shown), suggesting that the BCL11B binding is not required for the maintenance of chromatin accessibility at regulatory sites after its establishment.
Figure 7. Bcl11b deletion induced a decrease in interaction at BCL11B targets.
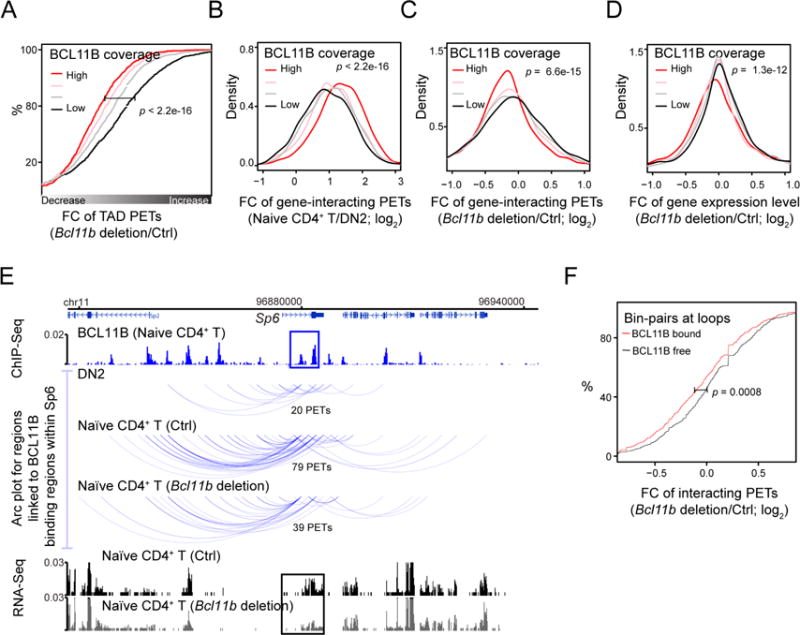
(A) Empirical cumulative distribution of the fold change of the number of all TAD PETs from control to Bcl11b deletion Naïve CD4+ T cells for TADs sorted into four equal size groups based on the BCL11B coverage, defined by the percentage of genomic region bound by BCL11B in Naïve CD4+ T cells. P-value by K.-S. test (also applied to panels B-D and F).
(B) Empirical cumulative distribution of the fold change of the number of PETs linked to BCL11B binding sites from DN2 to Naïve CD4+ T cells for genes sorted into four equal size groups based on BCL11B coverage across the gene.
(C) Empirical cumulative distribution of the fold change of the number of PETs linked to BCL11B binding regions of a gene from control to Bcl11b deletion Naïve CD4+ T for gene groups defined in panel B.
(D) Empirical cumulative distribution of the fold change of gene expression from control to Bcl11b deletion Naïve CD4+ T cells for gene groups defined in panel B.
(E) WashU genome browser image showing 1) the BCL11B ChIP-Seq read distribution across a genomic region encompassing Sp6, 2) the Hi-C PETs interacting with BCL11B binding regions within Sp6 for DN2, Naïve CD4+ T cells (control and Bcl11b deletion), and 3) the distribution of RNA-Seq read density in the control and Bcl11b deltion Naïve CD4+ T cells. Number of independent experiments: 2.
(F) Empirical cumulative distribution of the fold change of the number of interacting PETs for genomic bin-pairs at chromatin loops with both end bound by BCL11B and for genomic bin-pairs at chromatin loops with neither end bound by BCL11B.
We next examined the change in chromatin interaction at gene level induced by Bcl11b deletion and its consequence in gene expression. In naïve CD4+ T cells, the increase in the number of PETs associated with BCL11B binding sites within a gene, when compared to DN2 cells, was positively correlated to the BCL11B coverage across the gene (Figure 7B). The deletion of Bcl11b indeed induced more decrease in the interaction with genes showing higher BCL11B binding in the control cells (Figure 7C). Furthermore, the expression of genes with higher BCL11B binding exhibited more decrease in expression level upon deletion of Bcl11b (Figure 7D), as exemplified by the Sp6 gene (Figure 7E).
To test whether BCL11B facilitates formation of chromatin loops between CTCF sites, we performed a chromatin loop analysis at a 10kb-resolution for naïve CD4+ T cells using Fit-HiC (Ay et al., 2014). To increase confidence in prediction, we pooled the 3e Hi-C data from both the control and Bcl11b deleted cells and predicted 2,723 interacting pairs of 10Kb bins at putative chromatin loops by integrating interaction calls from our 3e Hi-C data, CTCF ChIP-Seq data and CTCF motif orientations. We separated the interacting pairs at chromatin loops into two groups, one with at least one end bound by BCL11B (over 50% of the region; BCL11B-bound) and the other not bound by BCL11B at either end (BCL11B-free). The analysis revealed that the BCL11B-bound group exhibited a significantly more decrease in interaction than did the BCL11B-free group in the naïve CD4+ T cells upon deletion of Bcl11b (Figure 7F). Together, the results support the hypothesis that BCL11B contributes to the maintenance of chromatin interaction within TADs at its genes and chromatin loops.
Discussion
Here, we have taken advantage of a well-defined developmental program from hematopoietic stem cells to early T cells to shed light on the order of changes in chromatin reorganization and transcriptional regulation. Firstly, we found that the conversion from an active A to a repressive B compartment status generally occurred after gene silencing, echoing our previous observation that repressive histone modification appears at promoters often after transcription silence during in vitro T cell differentiation (Zhang et al., 2012). It also suggested that the maintenance of an active compartment status does not require active transcription but may be more relevant to the underlying epigenetic status and chromatin accessibility. Unexpectedly, detectable transcription was frequently observed in HSPCs at genes that only later underwent B-to-A compartment conversion, which is in contrast to the previous thought that the chromatin environment is repressive in B compartment (Lieberman-Aiden et al., 2009; Rao et al., 2014). Thus our data suggest that the globally repressive B compartment can contain locally permissive chromatin environment marked by active histone marks in HSPC, which could further propagate into neighboring regions resulting in the global active compartment status at later development stages, perhaps through phase separation (Hnisz et al., 2017). Secondly, our analysis revealed that the changes of intra-TAD connectivity and gene transcription may also differ in timing: the delayed decrease in intra-TAD connectivity after gene silencing for a substantial fraction of genes was consistent with the delayed A-to-B compartment conversion. On the other hand, the increase in intra-TAD connectivity generally preceded transcription activation, suggesting that chromatin interaction landscape is pre-established before transcriptional outputs (Dixon et al., 2012; Spilianakis and Flavell, 2004; Stadhouders R. et al., 2017).
Our data suggest that BCL11B may contribute to the maintenance of the 3D nucleome in T cells. It could involve local chromatin remodeling as BCLL11B is a subunit of the ATP-dependent chromatin remodeling SWI/SNF complex in T cells (Kadoch et al., 2013) and/or cooperate with other transcriptional factors implied with architecture function in immune cells such as E2A (Lin et al., 2012), considering the surprising overlap in the responsive genes induced by Bcl11b deletion and by E2A deletion (Longabaugh et al., 2017). Since BCL11B is already modestly expressed by later DN2 stage (Kueh et al., 2016), further functional assays are required to examine whether it is involved in initiating the transformation of 3D nucleome, perhaps through a cooperative action with other factors such as E2A, PU.1 and TCF1 that are able to induce changes in chromatin structure (Heinz et al., 2010; Krysinska et al., 2007; Marecki et al., 2004; Xing et al., 2016).
In summary, our comprehensive analysis of chromatin organization for eight phenotypically distinctive developmental stages from HSPC to DP T cells uncovered a remarkable genome-wide reorganization of regulome and 3D nucleome at the DN2-to-DN3 transition, which was further re-enforced at the DN4-to-DP transition. We proposed that these concerted large-scale changes in chromatin organization served as an epigenetic barrier to lock the cell fate into the T lineages. We expect that our datasets of regulome and 3D nucleome of early T cells should fit broad interests to address fundamental questions regarding the regulation of transcriptional regulatory networks and their impact on lineage choice during cellular development and differentiation.
Star methods
Contact for Reagent and Resource Sharing
Further information and requests for reagents may be directed to, and will be fulfilled by the Lead Contact Keji Zhao (zhaok@nhlbi.nih.gov).
Experimental Model and Subject Details
Female C57BL/6J mice obtained from Jackson Laboratories (Bar Harbor, ME, USA) were used for this research. Mice were between 6 and 8 weeks of age at the time of experimentation. HSPC, MPP and CLP cells were isolated from bone marrow by staining with a combination of antibodies and sorting by FACS Aria II (BD Biosciences). ETP, DN2, DN3, and DN4 cells were isolated from thymus by staining with a combination of antibodies and sorting by FACS Aria II (BD Biosciences). All animals received humane treatment in accordance with National Institutes of Health guidelines and the “Guiding Principles for Research Involving Animals and Human Beings”. This study was reviewed and approved by the Institutional Animal Care and Use Committee of the National Heart Lung and Blood Institute.
Method Details
Collection of primary early T cells
HSPC, MPP and CLP cells were isolated from bone marrow as described previously (Bhandoola and Sambandam, 2006). Briefly, femurs from C57BL/6 mice were removed and the marrow flushed out with isolation buffer. The marrow was drawn through a syringe to make a single cell suspension, red blood cells were lysed, and the remaining white blood cells were pelleted. B cells and Granulocytes were depleted by adding 2.5μg of unlabeled anti-CD19 and 2.5μg of anti-GR1 per 1×10⁸ cells and incubating on ice for 30minutes. BioMag Goat anti-rat IgG beads from Qiagen (3 ml per 1×10⁸ cells) were washed and resuspended in half of the original volume with FACS buffer. The cells were washed, resuspended in 1.5ml per 1×10⁸ cells, and combined with beads. The cells/beads mixture was turned on a rotator at 4°C for 40 minutes, and then placed on a magnet to remove bead-bound cells and collect the suspension. Cells were then spun down and resuspended for staining. Surface marker antibodies used were: FITC-Lineage-(MAC1, GR1, Ter119, B220, CD3e), PE-AA4.1, PE-CF594-Flt3, PE-Cy5.5-Sca1, PE-Cy7-c-kit, APC-IL-7Rα. HSPC (Lin−c-kit+Sca1+Flt3−), MPP (Lin−c-kit+Sca1+Flt3+), and CLP (Lin−IL-7Rα+c-kitloAA4+Flt3+) were FACS-sorted. The expression of Il7ra in CLP is exceedingly high in CLP (RPKM = 154), compared to a basal level expression in HSPC and DP (RPKM ≈ 1), and a 6-44-fold lower expression from DN2 to DN4.
ETP, DN2, DN3, and DN4 cells were isolated from thymus. A single cell suspension from thymus was prepared, and stained for 30 min on ice with 2.5μg of unlabeled anti-CD8 and 1.25μg of anti-CD4 per 1×10⁸ cells. As for bone marrow suspensions, BioMag Goat anti-rat IgG beads from Qiagen (3 ml per 1×10⁸ cells) were washed and resuspended in half of the original volume with FACS buffer. To deplete CD4+ and CD8+ cells, the suspended cells were washed after staining, added to the beads, and rotated at 4°C for 40 minutes. Bead-bound cells were then removed by placing the mixture on a magnet and collecting the suspension. Cells were then spun down, resuspended, and stained with surface marker antibodies. Two Lin depletion cocktails were used to ensure purity of DN T-cell precursors: FITC-Lineage-(NK1.1, TCRβ, TCRγ, MAC1, B220, Ter119, CD3e, CD8β, CD19, GR1), and APC-Lineage-(CD8α, CD11c). DN subset marker antibodies were PE-Cy7-c-kit and PE-CD25. ETP (Linlowc-kithighCD25−), DN2 (Linlowc-kithighCD25+), DN3 (Linlowc-kitlowCD25+), and DN4 (Linlowc-kitlowCD25−) were FACS-sorted. Without CD44 marker, the cKit-CD44+ DN1s is expected in DN4s. However, the expression of Cd44 in DN4 is only about 5% of that in ETP, suggesting a minor effect imposed by the potential contamination of DN1s in DN4s on our analysis. Our sorting criteria for DN3s included also DN2bs. DP cells were isolated from the initial thymus single cell suspension by staining with anti-CD4 and anti-CD8 antibodies, followed by sorting the double positive cells (CD4+CD8+), which contained both pre-selection (TCRβ low to medium) and post-selection (TCRβ high) cells. DP cells from Bcl11bfl/fl-CreERT2 (Li et al., 2010b) male mice were isolated and treated with Tamoxifen for 3 days to delete Bcl11b. Naïve CD4+ T cells (CD4+CD44lowCD25−CD62Lhigh) with Bcl11b deletion were isolated by FACS soting from Bcl11bfl/fl-CreERT2 mice treated with Tamoxifen (i.p. 3mg in 150 ul corn oil) for 6 days.
Generation of bone marrow–derived DN cells
To generate Hi-C libraries for in vitro differentiated DN2 and DN3 cells, bone marrow (BM) was obtained from C57BL/6 mice. Hematopoietic stem cells were enriched by positive selection using a magnetic-bead-conjugated antibody specific for c-kit (Miltenyi Biotec) and a MACS LS column (Miltenyi Biotec). To generate BM–derived DN (BMDN) cells, enriched c-Kit+ BM cells were added to culture dishes with confluent OP9-DL1 stromal cells to provide a Notch pathwaey-stimulating environment, and the cells were co-cultured for 14 days as described elsewhere(Li et al., 2010a). From these pools, DN2 and DN3 BMDN cells were sorted with FACS Aria (BD Bioscience) based on expression of c-kit, CD25, and CD44 (Yui et al., 2010), with CD45 staining to exclude stromal cells and excluding Lin+ non-T and mature T cells with a Lin cocktail consisting of Abs against CD8α, CD11b, CD11c, CD19, Ly-6c, NK1.1, TER119, TCRγδ, and TCRβ.
scDNase-Seq
Detailed procedures for scDNase-Seq (in duplicates) were reported previously (Jin et al., 2015). Briefly, for scDNase-Seq, 1000 purified cells were lysed in 32μl of lysis buffer (10mM Tris-Cl, pH7.5, 10mM NaCl, 3mM MgCl2) and digested with 8μl of DNase I (0.3 units/ml) for 5 min at 37°C. The reaction was stopped by adding 40μl of stop buffer containing 10mM Tris-Cl, pH7.5, 10mM NaCl, 10mM EDTA, 2% SDS, 0.5mg/ml Proteinase K, and 1ng/μl of circular carrier DNA), followed by incubation at 65°C for 1 hour and DNA p urified by phenol-chloroform extraction, followed by precipitation with ethanol in the presence of 20μg glycogen. The DNA was end-repaired in 25 μl of reaction volume at 37°C for 20 minutes using End-It DNA-Repair kit (Epicentre, Cat#ER81050). Following phenol-chloroform extraction and ethanol precipitation, the DNA was treated with Klenow enzyme (3′-5′ exo minus) and dATP to yield a protruding 3′ ‘A’ base. The DNA was then ligated with the “Y”-shaped Illumina adaptor and amplified for 18 cycles using indexing primers as described. PCR products between 160-300bp were isolated on 2% E-gel for sequencing on Illumina Hiseq2500.
ChIP-Seq
ChIP-Seq analysis of BCL11B binding performed at the NIH was as described previously (Barski et al., 2007). Briefly, five millions of cells were fixed for 10 min with 1% formadehyde in complete medium, sonicated and chromatin immunoprecipitation was performed with antibodies against BCL11B (Bethyl (cat# A300-385A) and CST (cat#: 12120)) in DP cells. ChIP DNA was end-repaired using an End-It DNA End-Repair Kit (Epicentre, Cat# ER81050). The sequencing libraries were prepared as described for the scDNase-Seq libraries above.
H3K27ac and independent sets of BCL11B ChIP-Seq samples of total thymocytes (>80% DP cells; 10 million) were also generated using 7.5 g anti-H3K27ac (Abcam, ab4729) and anti-BCL11B (Bethyl #A300-383A) at Caltech. The ChIP procedure essentially followed previous description by Zhang et al., (2012), except that thymocytes were fixed with 1.5 mM ethylene glycol bis (succinimidyl succinate) (EGS, Thermo fisher, IL) in PBS for 30 minutes at room temperature, followed by addition of formaldehyde to 1% final concentration and incubation for 10 min at 37 °C for indicated samples. ChIP-seq libraries were constructed using NEBNext ChIP-Seq Library Preparation Kit (NEB #E6240) following manufacturer’s instructions. ChIP DNA was purified and end-repaired using a combination of T4 DNA polymerase, E. coli DNA Pol I large fragment (Klenow polymerase) and T4 polynucleotide kinase. The blunt, phosphorylated ends were treated with Klenow fragment (3′ to 5′ exo minus) and dATP to yield a protruding 3′ ‘A’ base for ligation of NEBNext Multiplex Oligos for Illumina (NEB #E7335) which have a single 3′ overhanging ‘T’ base and a hairpin structure. After ligation, adapters were converted to the ‘Y’ shape by treating with USER enzyme and DNA fragments were size selected using Agencourt AMPure XP beads (Beckman Coulter #A63880) to generate fragment sizes between 250 and 350 bp. Adaptor-ligated DNA was PCR amplified for 18 cycles followed by AMPure XP bead clean up. Libraries were quantified with Qubit dsDNA HS Kit (ThermoFisher Scientific #Q32854) and the size distribution was confirmed with High Sensitivity DNA Kit for Bioanalyzer (Agilent Technologies #5067).
RNA-Seq
Three thousand cells were sorted into 700μl of QIAzol Lysis Reagent (miRNAeasy Micro Kit (QIAGEN, Cat#217084). Total RNA was extracted and on-column digestion with DNase (QIAGEN, Cat#79254) was performed, followed by elution with 10μl of RNase-free water. Total RNA from 1K cells was reverse transcribed by SuperScript II (Invitrogen, Cat#18064-014) with oligo-dT and LNA-containing TSO primers in a final reaction volume of 10μl using the condition: 42°C for 90min, 10 cycles of 50°C 2min to 42°C 2min, 70°C for 15min and hold at 4°C. cDNA was pre-amplified by PCR using KAPA HiFi HotStart ReadyMix (KAPABIOSYSTEMS Cat#KK2602) with IS PCR for 12 cycles in 25μl. PCR products were purified by Ampure XP beads (Beckman Coulter, Cat#A63881) and eluted with 17.5μl Nuclease-free water as described for Smart-seq2 method (Picelli et al., 2014). PCR pre-amplified cDNA (40μl) was sonicated to 200~400bps by Bioruptor Pico (Diagenode) for 15 cycles (30″ on and 30″ off). Sonicted cDNA was blunt-ended by End-It DNA-Repair kit (Epicentre, Cat#ER81050), ligated to “Y” adaptor and PCR-amplified for 12 cycles and sequenced as described for the scDNase-seq libraries.
3e Hi-C applied to small number of cells
This multiple-enzyme Hi-C (3eHi-C) method (Ren et al., 2017) for small cell numbers was performed as following for multiple biology replicates (n=2 or more) for each developmental stage from HSC to DP. Five thousand to 1,000,000 cells were stained with Biotin anti-CD45.2 antibody, bound to biotin binder (Dynabeads Biotin Binder, Cat#11047, Invitrogen) and cross-linked with 1% formaldehyde. Biotin binders were blocked by 0.5mM biotin solution. Cells were lysed and subsequently digested with 20 Units CviQ I (NEB), and 20 Units CviA II (NEB) at 25°C for 20 minutes, then 20 Units Bfa I (NEB) at 37°C for 20 minutes. The reaction was stopped by washing the cells twice with 600 μl wash buffer (10mM NaCl, 1mM EDTA, 0.1% triton-100). The samples were processed following the Hi-C protocol (Lieberman-Aiden et al., 2009) with modifications briefly described as follows: DNA ends were marked by biotin-14-dATP with Klenow (large) for 1hr at 37°C. Blunt-end DNA fragm ents were ligated with T4 DNA Ligase overnight at 16°C. DNA was then reverse cross-linked and purified by phenol/chloroform extraction. Biotin was removed from unligated DNA-ends by T4 DNA polymerase for 2hrs at 12°C. DNA was puri fied by phenol/chloroform and sheared to 300-500bps by sonication followed by DNA-end repair and addition of “A” (Barski et al., 2007). Biotin labeled DNA was pull-downed by streptavidin beads followed by Illumina adapter ligation and PCR amplification. DNA fragments of 300 to 700bps were isolated 2% agarose gel and sequenced by paired-end sequencing on Illumina Hiseq 2500.
DNA-FISH
Gene specific probes were prepared from BAC clones for the specific area of interest. The BAC clones used were: Bcl11b – RP23-384C13; Meis1 – RP23-377H12. DNA extraction was performed using the Qiagen Maxi Kit (Qiagen, Hilden, Germany). Each probe was labeled via nick translation with Bcl11b in Spectrum Orange (Abbott) and Meis1 in Dy-505 (Dyomics, Jena, Germany). The locations of both BAC clones were confirmed by FISH on control metaphase chromosomes. Slides were prepared by washing cells in 1×PBS, then adhered to the slide using cell-tak™ (BD Sciences). The slides were then fixed for 10 minutes in 4% paraformaldehyde. Slide pretreatment was done using a previously published protocol(Cremer et al., 2008). The slides were left in 50% formamide in 2XSSC before hybridization. During hybridization, cells and probes were co-denatured at 72°C for five minutes then inc ubated at 37°C for 48 hours. Detection consisted of 3%NP40 in 2XSSC washes at 45°C followed by additional 2XSSC washes at room temperature. The slides were then mounted using prolong gold antifade mount with DAPI (Thermofisher, Waltham, MA). Images were acquired using the Delta Vision microscope with a 100× oil immersion objective. Images were taken in 640×640 using a 16-bit format. Image deconvolution was done using the Delta Vision software. 3D reconstruction and measurements were made using 3D-constructor and Image-Pro Plus 6.3 software packages (Media Cybernetics, Rockville, MD). The geometric centers of the DAPI stained nuclei and genes were determined and measured using the Image-Pro Plus software. 28-30 cells were analyzed.
Short read alignment
Sequence reads were mapped to the mouse genome (mm9) with bowtie2 (-p 24 –no-unal and others default) (Langmead and Salzberg, 2012). Only one read was retained for genomic site receiving multiple alignment hits, except for RNA-Seq data. Reads mapped to multiple positions (MAPQ < 10) were discarded.
Reference set of DHSs and differential DHSs
Potential DHSs for each library were predicted by SICER (Zang et al., 2009) from scDNase-Seq data (a window size = 100 bps, no gap, and E-value = 0.001). To minimize false positives, we considered only DHSs with predictions supported by both duplicates for each stage and created a reference set of DHSs by pooling predictions from all stages for downstream data analysis. We applied Edger 3 to call differential DHSs between any two stages from the reference set and turned on the option to consider replicate variation and batch effect (FDR < 0.001 & FC > 2) (Robinson et al., 2010). A differential DHS should overlap with DHS peak(s) from at least one stage of two stages of interest.
We defined a change in accessibility at a reference DHS from HSPC to DP be concordant if an increase (or decrease) in accessibility was found between at least two stages, but a reversal of this change was not found between any other two stages. To examine the change pattern in chromatin accessibility from HSPC to DP at the reference DHSs that exhibited concordant change in accessibility, we sorted the DHSs into two groups based on whether significant change in accessibility was observed at the DN4-to-DP transition or not.
ChIP-Seq data analysis
Public ChIP-Seq data included H3K4me3 (Zheng et al., 2015) and H3K27me3 (Zheng et al., 2015) for HSPC, and H3K27me3 (Wei et al., 2011), and H3K27ac (Ing-Simmons et al., 2015) for DP cells. ChIP-Seq read enriched regions (peaks) were called by SICER (Zang et al., 2009): window size = 200 bps, E-value = 1, and gap = 400 bps. A promoter of a gene (defined as TSS ± 2.5K bps) is enriched with a histone modification or is bound by a transcription factor, if the promoter overlaps with at least one peak is identified from the according ChIP-Seq data.
RNA-Seq data analysis
Gene expression from RNA-Seq was quantified by RPKM (Mortazavi et al., 2008) based on RefSeq gene annotation. Differentially expressed genes between two developmental stages were called by EdgeR 3 (Robinson et al., 2010) (FC>1.5 & FDR < 0.001). A gene is defined as being expressed if RPKM > 1, a threshold to separate actively transcribed genes from genes expressed at basal level or not expressed (Hebenstreit et al., 2011).
Prediction of AB Compartment
We adapted the method proposed by Lieberman-Aiden et al (Lieberman-Aiden et al., 2009) and used HOMER (Heinz et al., 2010) to call A and B compartments for each Hi-C library at a resolution of 20Kbp. It starts with a matrix that records the raw interaction PET counts between any two genomic bins from the same chromosome. The matrix is normalized by total library size and by distance between bins (Heinz et al., 2010). A correlation matrix is generated from the normalized matrix to record the correlation of contact profiles between any two genomic bins. Finally, HOMER (Heinz et al., 2010) applies principal component analysis to the correlation matrix to extract PC1 (compartment score), of which the positive values are arbitrarily defined to correspond to A compartment while the negative values correspond to B compartment (Heinz et al., 2010). We manually checked chromosome-by-chromosome the overlap between the initial compartment assignment and the accessible regions from our DNase-Seq data -“seed” regions called by HOMER (Lin et al., 2012) –to decide if the sign should be flipped by multiplying −1.
Prediction of differential compartment
We predicted compartment flip by combining the change in the sign of compartment scores, variation in compartment scores among replicates (Dixon et al., 2015) and dis-similarity of interaction profiles between genomic bins of 20kbp (Lin et al., 2012). We first identified genomic bins with significant variability in compartment scores across all stages by using ANOVA analysis (p<0.05). Then, we considered only bins where all replicates showed changes in compartment scores from positive to negative or vice versa as candidates of differential bins between any two stages (Dixon et al., 2015); in this analysis, we excluded genomic bins if any replicate-pair from the two stages exhibited similar interaction profiles as determined from their correlation matrices by HOMER (P.C. > 0.6, an indication of similar compartment status) (Lin et al., 2012). From the remaining candidates, we identified those that showed concordant A-to-B compartment flip, namely such a flip occurred between at least two stages, but a B-to-A flip was absent between any two stages, and similarly identified those that showed concordant B-to-A flip. Finally, we merged neighboring candidate bins that shared the same flipping direction to identify genomic regions with concordant A-to-B or B-to-A compartment flip from HSPC to DP cells.
Genes from flipped compartments
We defined that a gene is associated with a compartment flip event (B-to-A, A-to-B or transient) if the gene body is overlapped with or is located within a genomic region exhibiting such a compartment flip. Genes overlapping with multiple regions with opposite flipping events were excluded.
Distance estimation to periphery by DNA-FISH
We estimated the relative distance of the gene to the nuclear periphery from DNA-FISH data to indicate the direction of compartment transition (A-to-B or B-to-A). As a first order of approximation, we assume the nuclear as a sphere and estimated the relative distance to periphery using the equation: d = 1-c/(v/π+3/4)1/3, where c is the distance to the nuclear center and v is the nuclear volume obtained from DNA-FISH data.
Calculation of gross interaction of a gene
We analyzed the change in the gross interaction of a gene, defined by the number of informative Hi-C PETs (uniquely mapped, non-redundant, and over 2Kbps) originating from the genic region of the gene. Considering our modest sequencing depth, we introduced several strategies to increase the statistic power: 1) we pooled replicates to increase sequence coverage for each stage; 2) we considered the whole genic region, extending from 5Kbp upstream of TSS to 5Kbp downstream of TES when counting PETs; and 3) we counted the number of PETs linking the gene with other regions from the same chromosome and PETs within the gene region. To control for noise from background, we excluded PETs from genomic bins not implied as interacting at a resolution of 2Kbp under a p-value of 0.05 and a minimal of 2 PETs with FitHiC (Ay et al., 2014) and excluded PETs with two ends separated by less than 4Kbp or more than 2 million bps. For a fair comparison across stages, we down-sampled the pooled-library of each stage to the most limiting stage and normalized the interaction matrices by ICE (Imakaev et al., 2012) before supplying to FitHiC (Ay et al., 2014). The number of remaining informative PETs was summarized for each gene and for each stage and was normalized by the mean within stage. Two sides t-test without assuming equal variance was employed to examine the difference in gross interaction of genes between stages before and after T cell commitment, namely between stages from HSPC to DN2 and stages from DN3 to DP (FC > 1.5 and P-value < 0.05).
Visualization of chromatin interaction
The visualization of interaction matrix at a resolution of 20Kbp was achieved with a locally installed WashU epigenome browser (Zhou et al., 2013). For visualization purpose, the interaction matrices for each chromosome were generated by combining replicates from the same stage and were normalized by ICE (Imakaev et al., 2012), as implemented in the Hi-Corrector package (Li et al., 2015), and by library size before supplying to the browser. The visualization of the gross interactions of representative genes was done with arc plot from the WashU epigenome browser (Zhou et al., 2013) with libraries of each stage down-sampled to the most limiting stage. The change in the number of interacting PETs originated from BCL11B binding sites within a gene was also visualized with arc plot with down-sampling to the same size.
Reference set of TAD boundaries
To call TAD boundaries, we applied TopDom (Shin et al., 2016) to the ICE-normalized (Imakaev et al., 2012) interaction matrices of every library of each stage at a resolution of 20Kbp (P-value = 1E-6). We also applied it to the pooled-library from the same stage to increase sensitivities. Considering that TAD boundaries are invariant during differentiation or across diverse cell types (Dekker and Heard, 2015; Dixon et al., 2015; Dixon et al., 2012), we created a reference set of TAD boundaries for all stages by pooling their predictions and merged adjacent boundaries. We excluded boundaries supported by only one library to minimize false positives.
Domain score of TAD
We followed others (Chandra et al., 2015) to define the domain score of a TAD as the ratio of the number of intra-TAD PETs to the number of all TAD PETs. We observed that the domain score depends on TAD size, and therefore normalized the score by dividing against the average of domain scores from 1000 simulated TAD of the same size randomly distributed across the same chromosome. We further normalized the domain score of a TAD by subtracting the mean of all TADs, and applied quantile-normalization on domain scores to facilitate comparison among all Hi-C libraries. We used ANOVA analysis to identify TADs with significant variability in domain score across developmental stages from HSPC to DP cells (P-value with Bonferroni correction < 0.05).
Inference of potential chromatin loops
We identified putative interacting bin-pairs at chromatin loops by integrating interaction call for Hi-C data, CTCF ChIP-Seq data and CTCF motif orientations. Briefly, we generated ChIP-Seq data in Naïve CD4+ T cells for CTCF, a transcription factor that has been extensively demonstrated and validated by others to regulate chromatin looping (Phillips and Corces, 2009). We focused on interacting genomic bins of 10K bps that have both ends bound by CTCF (7,756 in total) and analyzed the CTCF motif orientations within CTCF binding sites, as it is known that CTCF motifs at loops adapt convergent orientation (Rao et al., 2014). We predicted CTCF motifs for each CTCF ChIP-Seq peak by using FIMO (Grant et al., 2011) (p<1e-4) and annotated the one with the highest score as the most likely motif. We excluded genomic bins where the enclosing CTCF motifs within peak(s) did not share the same orientation. Encouragingly, 64% of the genomic bin-pairs exhibited convergent orientation in CTCF motifs. We therefore defined interacting bin-pairs associated with loops as those with both end bound by CTCF and with convergent orientation in CTCF motifs (#2,723 bin-pairs). We found that 35% of the bin-pairs at loops in Naïve CD4+ from our studies were also found at loops in B-lymphoblasts (CH12-LX) predicted by others also at a resolution of 10K bps (Rao et al., 2014), consistent with the notion that chromatin loops are generally conserved across cell types (Rao et al., 2014). These results suggested that a straightforward combination of interaction call from Hi-C data with a decent sequence depth, CTCF ChIP-Seq data and motif orientation yield a reasonably good approximation of interacting bin-pairs at chromatin loops.
Counting interacting PETs at TF binding sites
We quantified the BCL11B binding level by counting the number of BCL11B ChIP-Seq reads at the binding site. We used the number of PETs with one end originated from the BCL11B binding site, which is extended by 5kbp on both ends, as a first order estimation of the interaction strength of the BCL11B binding site with other genomic regions. We pooled Hi-C replicates from the same stage to increase statistic power. To reduce noise from random ligation (Ay et al., 2014), we removed PETs separated by less than 4kbp and required a minimal of two PETs for each pair of interacting genomic bins of 2Kbp.
PCA data analysis
The principal component analysis (PCA) was adapted in two different ways to reduce the dimensionality of high dimensional data throughout the manuscript. First, it was used to infer the one-dimensional genomic AB compartment organization from interaction correlation matrix, as implemented in HOMER (Heinz et al., 2010). Second, it projected a genomic bin of 20K bps from a high dimensional space characterized by the compartment scores across all the eight developmental stages onto a two-dimensional space from the first two principal components (Figure 4C). Before the PCA dimensionality reduction, the compartment scores were first technically transformed into z-scores across all genomic bins independently for each developmental stage, and then across the eight stages independently for each genomic bin; the pre-processing step would confine the PCA-based projection of the genomic bins onto within a circle from the two-dimensional space. The “prcomp” function from the R package “stats” was used for PCA analysis with both the “scale” option and the “center” option turning on.
Miscellaneous data analysis
The heat-map visualizations of compartment scores for scDNase-Seq read densities for differential DHSs, domain scores for TADs, interaction matrices, and compartment scores for genomic regions with compartment flip were made with Mev (Saeed et al., 2003) or the WashU epigenome browser (Zhou et al., 2013). Mev was also used for the hierarchical clustering of the eight developmental stages based on compartment scores of all genomic bins. Gene ontology analysis was performed using DAVID(Huang et al., 2009) or GREAT(McLean et al., 2010). De novo motif finding applied to non-promoter DHSs were conducted with HOMER (Heinz et al., 2010).
Quantification and Statistical Analysis
ANOVA analysis tested the null hypothesis that the means of domain score of a TAD are equal among different early T cells with biology duplicates (Figure 2B). Kolmogorov-Smirnov (K.-S.) test (two-tailed) assessed the difference in the accumulated distribution of fold-change of interacting PETs within TAD (Figures 6E,7A,S6A,S6B&S6E), fold change of interacting PETs associated with gene (Figures 7B&7C), fold change of interacting PETs at chromatin loop (Figure 7D), or fold change of gene expression (Figure 7F) between groups of TADs, chromatin loops or genes. The K.-S. test also examined the difference in the accumulated distribution of distance to nuclear periphery of a gene between single cells of HSPCs and DPs (Figure S4B) and the distribution in the difference in the change of compartment scores between pairs of neighboring developmental stages (Figure S4D). The K.-S. test is a nonparametric method that assumes no prior knowledge about the distributions of the tested variable. Two-tailed t-test without assumption of equal variance tested the difference in interacting PETs of a target gene between developmental stages pre- and post-T cell commitment (Figures 3C&S3B). One sample t-test assessed the significance in the difference from an observed number of changing compartment at TAD boundaries to the mean of expectation (Figure 5A). Binomial test assessed the significance in the number of TAD that shows concerted change in compartment status and domain score from HSCs to DPs compared to the expectation by chance (Figure S5C&S5D).
Data and Software Availability
Software used in this study is listed in the Key Resources Table. The accession numbers of ChIP-Seq, DNase-Seq, Hi-C and RNA-Seq are GSE79422 (generated at the NIH) and GSE79874 (generated at Caltech).
Additional Resources
The online WashU epigenome browser session that visualizes the regulome (DNase-Seq), 4D nucleome (Hi-C), transcriptome (RNA-Seq), and 142 ChIP-Seq data sets (see also Table S6) of early T cells is available at http://epigenomegateway.wustl.edu/browser/?genome=mm9&session=bxT0F5m0YY. An instruction and examples for accessing the session is available at http://wangftp.wustl.edu/~dli/4DN_Tcells/readme.pdf.
KEY RESOURCES TABLE
| REAGENT or RESOURCE | SOURCE | IDENTIFIER |
|---|---|---|
| Antibodies | ||
| Anti-mouse CD19 | eBioscience | Cat#14-0193-85 |
| Anti-mouse GR1 | eBioscience | Cat#14-5931-85 |
| Anti-mouse CD93 | eBioscience | Cat#12-5892-82 |
| Anti-mouse PE-CF594-Flt3 | BD Biosciences | Cat#562537 |
| Anti-mouse PE-Cy5.5-Sca1 | eBioscience | Cat#35-5981-82 |
| Anti-mouse PE-Cy7-c-kit | eBioscience | Cat#25-1171-82 |
| Anti-mouse APC-IL-7Rα | eBioscience | Cat#17-1271-82 |
| Anti-mouse CD8 | eBioscience | Cat#16-0081-85 |
| Anti-mouse CD4 | eBioscience | Cat#16-0041-85 |
| Anti-rat IgG goat | QIAGEN | Cat#310107 |
| Anti-mouse PE-CD25 | eBioscience | Cat#12-0251-83 |
| Mouse eFluor450-CD44 IM7 | eBioscience | Cat#48-0441-82 |
| Mounse PE-CD45 30-F11 | eBioscience | Cat#12-0451-83 |
| Mouse APC-CD117 (c-Kit) 2B8 | eBioscience | Cat#17-1171-82 |
| Mouse APC-eFluor780-CD25(IL-2Rα) PC61.5 | eBioscience | Cat#47-0251-82 |
| Mouse anti-H3K27ac | Abcam | Cat# ab4729 |
| PerCPCy5.5-Sav | eBioscience | Cat#45-4317-82 |
| biotin-TCRγδ eBioGL3 | eBioscience | Cat#13-5711-85 |
| biotin-CD11b (Mac1A) M1/70 | Cat#13-0112-85 | |
| Anti-mouse BCL11B | Bethyl | Cat#A300-385A, A300-383A |
| Anti-mouse BCL11B | CST | Cat#12120 |
| Anti-mouse CD45.2 | BD Biosciences | Cat#553771 |
| Anti-mouse FITC-MAC1 | eBioscience | Cat#11-0112-85 |
| Anti-mouse FITC-GR1 | eBioscience | Cat#11-5931-82 |
| Anti-mouse FITC-Ter119 | eBioscience | Cat#11-5921-85 |
| Biotin-TER119 TER-119 | eBioscience | Cat#13-5921-85 |
| Anti-mouse FITC-B220 | eBioscience | Cat#11-0452-85 |
| Anti-mouse FITC-CD3e | eBioscience | Cat#11-0031-85 |
| Anti-mouse FITC-NK1.1 | eBioscience | Cat#11-5941-85 |
| Biotin-NK1.1 PK136 | eBioscience | Cat#13-5941-85 |
| Anti-mouse FITC-TCRb | eBioscience | Cat#11-5961-82 |
| Biotin-TCRβ H57-597 | eBioscience | Cat#13-5961-85 |
| Anti-mouse FITC-TCRr | BD Biosciences | Cat#553177 |
| Anti-mouse FITC-CD8b | BD Biosciences | Cat#553040 |
| Anti-mouse FITC-CD19 | eBioscience | Cat#11-0193-85 |
| Biotin-CD19 eBio1D3 | eBioscience | Cat#13-0193-85 |
| Anti-mouse APC-CD8a | eBioscience | Cat#47-0081-82 |
| Biotin-CD8α (Ly-2) 53-6.7 | eBioscience | Cat#13-0081-85 |
| Anti-mouse FAPC-CD11c | eBioscience | Cat#17-0114-82 |
| Biotin-CD11c(Integrin αX) N418 | BioLegend | Cat#117304 |
| Biotin-Ly-6G (Gr-1) RB6-8C5 | eBioscience | Cat#13-5931-86 |
| Chemicals, Peptides, and Recombinant Proteins | ||
| DNase I | Roche | Cat#04-716-728-001 |
| DNase | QIAGEN | Cat#79254 |
| Tamoxifen | Sigma | Cat#T5648 |
| Biotin binder | Invitrogen | Cat#11047 |
| Streptavidin | Invitrogen | Cat#11205D |
| Spectrum Orange | Abbott Molecular | Cat#02N33-050 |
| Dy-505 | Dyomics | Cat#Dy-505 |
| Critical Commercial Assays | ||
| Qiagen Maxi Kit (DNA extraction) | Qiagen | Cat#10063 |
| miRNAeasy Micro Kit | QIAGEN | Cat#217084 |
| Deposited Data | ||
| Raw sequence files for DNase-Seq, RNA-Seq, 3e Hi-C for primary cells from HSPCs to DPs | This paper | GEO: GSE79422 |
| Raw sequence files for ChIP-Seq of Bcl11b for DPs and Naïve CD4+ T cells | This paper | GEO: GSE79422 |
| Raw sequence files for DNase-Seq, RNA-Seq, 3e Hi-C for Bcl11b deleted Naïve CD4+ cells and control cells | This paper | GEO: GSE79422 |
| Raw sequence files for 3e Hi-C for bone-marrow derived DN2 and DN3 cells | This paper | GEO: GSE79422 |
| Raw sequence files for ChIP-Seq of Bcl11b for DPs (Caltech) | This paper | GEO: GSE79874 |
| H3K4me3 HSPCs | Zheng et al., 2015 | GEO: GSE70832 |
| H3K27me3 HSPCs | Zheng et al., 2015 | GEO: GSE70832 |
| H3K27me3 DPs | Wei et al., 2011 | GEO: GSE20898 |
| H3K27ac DPs | Ing-Simmons et al., 2015 | GEO: GSE61428 |
| H3K27me3 DN2s | Zhang et al., 2012 | GEO: GSE31235 |
| H3K27me3 DN3s | Zhang et al., 2012 | GEO: GSE31235 |
| H3K4me3 DN2s | Isoda et al., 2017 | GEO: GSE90958 |
| H3K4me3 DN3s | Oravecz et al., 2015 | GEO: GSE61149 |
| BCL11B DN3s | Longabaugh et al., 2017 | GEO: GSE93572 |
| Experimental Models: Organisms/Strains | ||
| Mouse: Bcl11bfl/fl-CreERT2 | This study | N/A |
| Mouse: C57BL/6 | Jackson Laboratory | Stock No: 000664 Black 6 |
| Oligonucleotides | ||
| DNA-FISH probe for Bcl11b | Bacpac CHORI | cat#RP23-384C13 |
| DNA-FISH probe for Meis1 | Bacpac CHORI | cat#RP23-377H12 |
| Software and Algorithms | ||
| Softworx | GE healthcare | http://incelldownload.gehealthcare.com/bin/download_data/SoftWoRx/6.5.2/SoftWoRx.htm |
| Image-Pro Plus 6.3 | Media Cybernetics | http://www.mediacy.com/imageproplus |
| FlowJo X software | FlowJo, LLC | https://www.flowjo.com/ |
| Bowtie 2 | Langmead and Salzberg, 2012 | http://bowtie-bio.sourceforge.net/bowtie2/index.shtml |
| SICER 1.1 | Zang et al., 2009 | https://home.gwu.edu/~wpeng/Software.htm |
| Edger 3.16.2 | Robinson et al., 2010 | http://bioconductor.org/packages/release/bioc/html/edgeR.html |
| HOMER 4.7 | Heinz et al., 2010 | http://homer.ucsd.edu/homer/interactions/ |
| WashU epigenome browser (local mirror) | Zhou et al., 2013 | http://wiki.wubrowse.org/Install_a_local_mirror |
| Hi-Corrector1.2 | Li et al., 2015 | http://zhoulab.usc.edu/Hi-Corrector/ |
| TopDom | Shin et al., 2016 | http://zhoulab.usc.edu/TopDom/ |
| Fit-HiC | Ay et al., 2014 | https://noble.gs.washington.edu/proj/fit-hi-c/ |
| FIMO | Grant et al., 2011 | http://meme-suite.org/doc/fimo.html |
| R | The R Foundation | https://www.r-project.org/ |
| Mev | Saeed et al., 2003 | http://mev.tm4.org/#/welcome |
| DAVID | Huang et al., 2009 | https://david.ncifcrf.gov/ |
| GREAT | McLean et al., 2010 | http://great.stanford.edu/public/html/ |
| Other | ||
| End-It DNA End-Repair Kit | Epicenter | Cat#ER81050 |
| 7-AAD Viability staining solution | eBioscience | Cat#00-6993 |
| MACS LS column | Miltenyi Biotec | Cat#130-042-401 |
| c-Kit Beads | Miltenyi Biotec | Cat#130-091-224 |
| ChIP-Seq Library Preparation Kit | NEBNext | Cat#E6240 |
| Ligation of Multiplex Oligos for Illumina | NEBNext | Cat#E7335 |
| Agencourt AMPure XP beads | Beckman Coulter | Cat#A63880 |
| Qubit dsDNA HS Kit | ThermoFisher Scientific | Cat#Q32854 |
| High Sensitivity DNA Kit for Bioanalyzer | Agilent Technologies | Cat#5067 |
| SuperScript II | Invitrogen | Cat#18064-014 |
| HiFi HotStart ReadyMix | KAPABIOSYSTEMS | Cat#KK2602 |
| Ampure XP beads | Beckman Coulter | Cat#A63881 |
Supplementary Material
Table S1: Statistics of scDNase-Seq libraries – related to Figure 1
Table S2: Statistics of Hi-C libraries – related to Figure 2
Table S3: Gene expression values and change of expression during early T cell development – related to Figure 3
Table S4: List of genes with significant change in gross interaction before and after T cell commitment – related to Figure 3
Table S5: List of genes extracted from B-to-A or A-to-B flipped compartment region – related to Figure 4
Table S6: List and statistics of public ChIP-Seq data for early T cells – related to Figure 5
Table S7: List of genes bound by BCL11B and marked by H3K27me3 at promoters in DP cells – related to Figure 6
HIGHLIGHTS.
Commitment to T lineages is paired with global changes in regulome and 3D nucleome
Transformation of these chromatin organizations is concerted for T cell commitment
Concerted changes of regulome and 3D nucleome underlies transcriptomic changes
BCL11B contributes to the maintenance of the 3D nucleome in T cells
Acknowledgments
We thank the NHLBI DNA Sequencing Core facility for sequencing; the NHLBI Systems Biology Core and the NIH Biowulf High Performance Computing Systems for computing service; the NHLBI Flow Cytometry Core facility for cell sorting; Dr. X. Zheng and Dr. B. Stanton for constructive comments; Dr. D. Northrup for assistance in cell sorting; Dr. G. Ren and Dr. K. Placek for assistance in cell isolation; Dr. H. Shin and Prof. X. J. Zhou (UCLA) for sharing the code of TopDOM; Mr. Timothy Zhou for setting-up a local WashU Genome Browser; Dr. D. Li and Prof. T. Wang (Washington University in St. Louis) for hosting the online WashU epigenome browser session. The work was supported by Division of Intramural Research of NHLBI, NIAID and NCI, NIH (KZ, JZ and TR), and NIH grant R01 AI083514 (EVR).
Footnotes
Publisher's Disclaimer: This is a PDF file of an unedited manuscript that has been accepted for publication. As a service to our customers we are providing this early version of the manuscript. The manuscript will undergo copyediting, typesetting, and review of the resulting proof before it is published in its final citable form. Please note that during the production process errors may be discovered which could affect the content, and all legal disclaimers that apply to the journal pertain.
Author contributions
G.H., E.V.R. and K.Z. designed the project and wrote the manuscript. K.C., S.H., and X.W. performed Hi-C, DNase-Seq, RNA-Seq and ChIP-Seq experiments. G.H., and W.J. performed computational analysis. D.W. did the DNA-FISH experiment. D.F. performed the Bcl11b deletion. T.R., P.L. and J.Z. contributed to data interpretation and manuscript editing.
Declaration of interests
The authors declare no competing interests.
References
- Ariki R, Morikawa S, Mabuchi Y, Suzuki S, Nakatake M, Yoshioka K, Hidano S, Nakauchi H, Matsuzaki Y, Nakamura T, et al. Homeodomain transcription factor Meis1 is a critical regulator of adult bone marrow hematopoiesis. PLoS One. 2014;9:e87646. doi: 10.1371/journal.pone.0087646. [DOI] [PMC free article] [PubMed] [Google Scholar]
- Ay F, Bailey TL, Noble WS. Statistical confidence estimation for Hi-C data reveals regulatory chromatin contacts. Genome Res. 2014;24:999–1011. doi: 10.1101/gr.160374.113. [DOI] [PMC free article] [PubMed] [Google Scholar]
- Barski A, Cuddapah S, Cui K, Roh TY, Schones DE, Wang Z, Wei G, Chepelev I, Zhao K. High-resolution profiling of histone methylations in the human genome. Cell. 2007;129:823–837. doi: 10.1016/j.cell.2007.05.009. [DOI] [PubMed] [Google Scholar]
- Bhandoola A, Sambandam A. From stem cell to T cell: one route or many? Nat Rev Immunol. 2006;6:117–126. doi: 10.1038/nri1778. [DOI] [PubMed] [Google Scholar]
- Bunting KL, Soong TD, Singh R, Jiang Y, Beguelin W, Poloway DW, Swed BL, Hatzi K, Reisacher W, Teater M, et al. Multi-tiered Reorganization of the Genome during B Cell Affinity Maturation Anchored by a Germinal Center-Specific Locus Control Region. Immunity. 2016;45:497–512. doi: 10.1016/j.immuni.2016.08.012. [DOI] [PMC free article] [PubMed] [Google Scholar]
- Carpenter AC, Bosselut R. Decision checkpoints in the thymus. Nat Immunol. 2010;11:666–673. doi: 10.1038/ni.1887. [DOI] [PMC free article] [PubMed] [Google Scholar]
- Chandra T, Ewels PA, Schoenfelder S, Furlan-Magaril M, Wingett SW, Kirschner K, Thuret JY, Andrews S, Fraser P, Reik W. Global reorganization of the nuclear landscape in senescent cells. Cell Rep. 2015;10:471–483. doi: 10.1016/j.celrep.2014.12.055. [DOI] [PMC free article] [PubMed] [Google Scholar]
- Chepelev I, Wei G, Wangsa D, Tang Q, Zhao K. Characterization of genome-wide enhancer-promoter interactions reveals co-expression of interacting genes and modes of higher order chromatin organization. Cell Res. 2012;22:490–503. doi: 10.1038/cr.2012.15. [DOI] [PMC free article] [PubMed] [Google Scholar]
- Cremer M, Grasser F, Lanctot C, Muller S, Neusser M, Zinner R, Solovei I, Cremer T. Multicolor 3D fluorescence in situ hybridization for imaging interphase chromosomes. Methods Mol Biol. 2008;463:205–239. doi: 10.1007/978-1-59745-406-3_15. [DOI] [PubMed] [Google Scholar]
- Dekker J, Heard E. Structural and functional diversity of Topologically Associating Domains. FEBS Lett. 2015;589:2877–2884. doi: 10.1016/j.febslet.2015.08.044. [DOI] [PMC free article] [PubMed] [Google Scholar]
- Denker A, de Laat W. The second decade of 3C technologies: detailed insights into nuclear organization. Genes Dev. 2016;30:1357–1382. doi: 10.1101/gad.281964.116. [DOI] [PMC free article] [PubMed] [Google Scholar]
- Dixon JR, Gorkin DU, Ren B. Chromatin Domains: The Unit of Chromosome Organization. Mol Cell. 2016;62:668–680. doi: 10.1016/j.molcel.2016.05.018. [DOI] [PMC free article] [PubMed] [Google Scholar]
- Dixon JR, Jung I, Selvaraj S, Shen Y, Antosiewicz-Bourget JE, Lee AY, Ye Z, Kim A, Rajagopal N, Xie W, et al. Chromatin architecture reorganization during stem cell differentiation. Nature. 2015;518:331–336. doi: 10.1038/nature14222. [DOI] [PMC free article] [PubMed] [Google Scholar]
- Dixon JR, Selvaraj S, Yue F, Kim A, Li Y, Shen Y, Hu M, Liu JS, Ren B. Topological domains in mammalian genomes identified by analysis of chromatin interactions. Nature. 2012;485:376–380. doi: 10.1038/nature11082. [DOI] [PMC free article] [PubMed] [Google Scholar]
- Flyamer IM, Gassler J, Imakaev M, Brandao HB, Ulianov SV, Abdennur N, Razin SV, Mirny LA, Tachibana-Konwalski K. Single-nucleus Hi-C reveals unique chromatin reorganization at oocyte-to-zygote transition. Nature. 2017;544:110–114. doi: 10.1038/nature21711. [DOI] [PMC free article] [PubMed] [Google Scholar]
- Grant CE, Bailey TL, Noble WS. FIMO: scanning for occurrences of a given motif. Bioinformatics. 2011;27:1017–1018. doi: 10.1093/bioinformatics/btr064. [DOI] [PMC free article] [PubMed] [Google Scholar]
- Hebenstreit D, Fang M, Gu M, Charoensawan V, van Oudenaarden A, Teichmann SA. RNA sequencing reveals two major classes of gene expression levels in metazoan cells. Mol Syst Biol. 2011;7:497. doi: 10.1038/msb.2011.28. [DOI] [PMC free article] [PubMed] [Google Scholar]
- Heinz S, Benner C, Spann N, Bertolino E, Lin YC, Laslo P, Cheng JX, Murre C, Singh H, Glass CK. Simple combinations of lineage-determining transcription factors prime cis-regulatory elements required for macrophage and B cell identities. Mol Cell. 2010;38:576–589. doi: 10.1016/j.molcel.2010.05.004. [DOI] [PMC free article] [PubMed] [Google Scholar]
- Hnisz D, Shrinivas K, Young RA, Chakraborty AK, Sharp PA. A Phase Separation Model for Transcriptional Control. Cell. 2017;169:13–23. doi: 10.1016/j.cell.2017.02.007. [DOI] [PMC free article] [PubMed] [Google Scholar]
- Hu G, Zhao K. Looping around Bcl6 in Germinal Center to Sharpen B Cell Immunity. Immunity. 2016;45:459–461. doi: 10.1016/j.immuni.2016.08.020. [DOI] [PMC free article] [PubMed] [Google Scholar]
- Huang DW, Sherman BT, Lempicki RA. Systematic and integrative analysis of large gene lists using DAVID bioinformatics resources. Nature Protocols. 2009;4:44–57. doi: 10.1038/nprot.2008.211. [DOI] [PubMed] [Google Scholar]
- Ikawa T, Hirose S, Masuda K, Kakugawa K, Satoh R, Shibano-Satoh A, Kominami R, Katsura Y, Kawamoto H. An essential developmental checkpoint for production of the T cell lineage. Science. 2010;329:93–96. doi: 10.1126/science.1188995. [DOI] [PubMed] [Google Scholar]
- Imakaev M, Fudenberg G, McCord RP, Naumova N, Goloborodko A, Lajoie BR, Dekker J, Mirny LA. Iterative correction of Hi-C data reveals hallmarks of chromosome organization. Nat Methods. 2012;9:999–1003. doi: 10.1038/nmeth.2148. [DOI] [PMC free article] [PubMed] [Google Scholar]
- Ing-Simmons E, Seitan VC, Faure AJ, Flicek P, Carroll T, Dekker J, Fisher AG, Lenhard B, Merkenschlager M. Spatial enhancer clustering and regulation of enhancer-proximal genes by cohesin. Genome Res. 2015;25:504–513. doi: 10.1101/gr.184986.114. [DOI] [PMC free article] [PubMed] [Google Scholar]
- Isoda T, Moore AJ, He Z, Chandra V, Aida M, Denholtz M, Piet van Hamburg J, Fisch KM, Chang AN, Fahl SP, et al. Non-coding Transcription Instructs Chromatin Folding and Compartmentalization to Dictate Enhancer-Promoter Communication and T Cell Fate. Cell. 2017;171:103–119 e118. doi: 10.1016/j.cell.2017.09.001. [DOI] [PMC free article] [PubMed] [Google Scholar]
- Javierre BM, Burren OS, Wilder SP, Kreuzhuber R, Hill SM, Sewitz S, Cairns J, Wingett SW, Varnai C, Thiecke MJ, et al. Lineage-Specific Genome Architecture Links Enhancers and Non-coding Disease Variants to Target Gene Promoters. Cell. 2016;167:1369–1384 e1319. doi: 10.1016/j.cell.2016.09.037. [DOI] [PMC free article] [PubMed] [Google Scholar]
- Jin W, Tang Q, Wan M, Cui K, Zhang Y, Ren G, Ni B, Sklar J, Przytycka TM, Childs R, et al. Genome-wide detection of DNase I hypersensitive sites in single cells and FFPE tissue samples. Nature. 2015;528:142–146. doi: 10.1038/nature15740. [DOI] [PMC free article] [PubMed] [Google Scholar]
- Kadoch C, Hargreaves DC, Hodges C, Elias L, Ho L, Ranish J, Crabtree GR. Proteomic and bioinformatic analysis of mammalian SWI/SNF complexes identifies extensive roles in human malignancy. Nat Genet. 2013;45:592–601. doi: 10.1038/ng.2628. [DOI] [PMC free article] [PubMed] [Google Scholar]
- Kieffer-Kwon KR, Tang Z, Mathe E, Qian J, Sung MH, Li G, Resch W, Baek S, Pruett N, Grontved L, et al. Interactome maps of mouse gene regulatory domains reveal basic principles of transcriptional regulation. Cell. 2013;155:1507–1520. doi: 10.1016/j.cell.2013.11.039. [DOI] [PMC free article] [PubMed] [Google Scholar]
- Krijger PH, Di Stefano B, de Wit E, Limone F, van Oevelen C, de Laat W, Graf T. Cell-of-Origin-Specific 3D Genome Structure Acquired during Somatic Cell Reprogramming. Cell Stem Cell. 2016;18:597–610. doi: 10.1016/j.stem.2016.01.007. [DOI] [PMC free article] [PubMed] [Google Scholar]
- Krysinska H, Hoogenkamp M, Ingram R, Wilson N, Tagoh H, Laslo P, Singh H, Bonifer C. A two-step, PU.1-dependent mechanism for developmentally regulated chromatin remodeling and transcription of the c-fms gene. Mol Cell Biol. 2007;27:878–887. doi: 10.1128/MCB.01915-06. [DOI] [PMC free article] [PubMed] [Google Scholar]
- Kueh HY, Yui MA, Ng KK, Pease SS, Zhang JA, Damle SS, Freedman G, Siu S, Bernstein ID, Elowitz MB, et al. Asynchronous combinatorial action of four regulatory factors activates Bcl11b for T cell commitment. Nat Immunol. 2016;17:956–965. doi: 10.1038/ni.3514. [DOI] [PMC free article] [PubMed] [Google Scholar]
- Langmead B, Salzberg SL. Fast gapped-read alignment with Bowtie Nat Methods. 2012;9:357–359. doi: 10.1038/nmeth.1923. [DOI] [PMC free article] [PubMed] [Google Scholar]
- Li L, Leid M, Rothenberg EV. An early T cell lineage commitment checkpoint dependent on the transcription factor Bcl11b. Science. 2010a;329:89–93. doi: 10.1126/science.1188989. [DOI] [PMC free article] [PubMed] [Google Scholar]
- Li L, Zhang JA, Dose M, Kueh HY, Mosadeghi R, Gounari F, Rothenberg EV. A far downstream enhancer for murine Bcl11b controls its T-cell specific expression. Blood. 2013;122:902–911. doi: 10.1182/blood-2012-08-447839. [DOI] [PMC free article] [PubMed] [Google Scholar]
- Li P, Burke S, Wang J, Chen X, Ortiz M, Lee SC, Lu D, Campos L, Goulding D, Ng BL, et al. Reprogramming of T cells to natural killer-like cells upon Bcl11b deletion. Science. 2010b;329:85–89. doi: 10.1126/science.1188063. [DOI] [PMC free article] [PubMed] [Google Scholar]
- Li W, Gong K, Li Q, Alber F, Zhou XJ. Hi-Corrector: a fast, scalable and memory-efficient package for normalizing large-scale Hi-C data. Bioinformatics. 2015;31:960–962. doi: 10.1093/bioinformatics/btu747. [DOI] [PMC free article] [PubMed] [Google Scholar]
- Lieberman-Aiden E, van Berkum NL, Williams L, Imakaev M, Ragoczy T, Telling A, Amit I, Lajoie BR, Sabo PJ, Dorschner MO, et al. Comprehensive mapping of long-range interactions reveals folding principles of the human genome. Science. 2009;326:289–293. doi: 10.1126/science.1181369. [DOI] [PMC free article] [PubMed] [Google Scholar]
- Lin YC, Benner C, Mansson R, Heinz S, Miyazaki K, Miyazaki M, Chandra V, Bossen C, Glass CK, Murre C. Global changes in the nuclear positioning of genes and intra- and interdomain genomic interactions that orchestrate B cell fate. Nat Immunol. 2012;13:1196–1204. doi: 10.1038/ni.2432. [DOI] [PMC free article] [PubMed] [Google Scholar]
- Longabaugh WJR, Zeng W, Zhang JA, Hosokawa H, Jansen CS, Li L, Romero-Wolf M, Liu P, Kueh HY, Mortazavi A, et al. Bcl11b and combinatorial resolution of cell fate in the T-cell gene regulatory network. Proc Natl Acad Sci U S A. 2017;114:5800–5807. doi: 10.1073/pnas.1610617114. [DOI] [PMC free article] [PubMed] [Google Scholar]
- Marecki S, McCarthy KM, Nikolajczyk BS. PU.1 as a chromatin accessibility factor for immunoglobulin genes. Mol Immunol. 2004;40:723–731. doi: 10.1016/j.molimm.2003.08.007. [DOI] [PubMed] [Google Scholar]
- Martin P, McGovern A, Orozco G, Duffus K, Yarwood A, Schoenfelder S, Cooper NJ, Barton A, Wallace C, Fraser P, et al. Capture Hi-C reveals novel candidate genes and complex long-range interactions with related autoimmune risk loci. Nat Commun. 2015;6:10069. doi: 10.1038/ncomms10069. [DOI] [PMC free article] [PubMed] [Google Scholar]
- McLean CY, Bristor D, Hiller M, Clarke SL, Schaar BT, Lowe CB, Wenger AM, Bejerano G. GREAT improves functional interpretation of cis-regulatory regions. Nat Biotechnol. 2010;28:495–501. doi: 10.1038/nbt.1630. [DOI] [PMC free article] [PubMed] [Google Scholar]
- Mercer EM, Lin YC, Murre C. Factors and networks that underpin early hematopoiesis. Semin Immunol. 2011;23:317–325. doi: 10.1016/j.smim.2011.08.004. [DOI] [PMC free article] [PubMed] [Google Scholar]
- Mortazavi A, Williams BA, McCue K, Schaeffer L, Wold B. Mapping and quantifying mammalian transcriptomes by RNA-Seq. Nat Methods. 2008;5:621–628. doi: 10.1038/nmeth.1226. [DOI] [PubMed] [Google Scholar]
- Mumbach MR, Satpathy AT, Boyle EA, Dai C, Gowen BG, Cho SW, Nguyen ML, Rubin AJ, Granja JM, Kazane KR, et al. Enhancer connectome primary human cells identifies target genes of disease-associated DNA elements. Nat Genet. 2017 doi: 10.1038/ng.3963. [DOI] [PMC free article] [PubMed] [Google Scholar]
- Naito T, Tanaka H, Naoe Y, Taniuchi I. Transcriptional control of T-cell development. Int Immunol. 2011;23:661–668. doi: 10.1093/intimm/dxr078. [DOI] [PubMed] [Google Scholar]
- Nora EP, Lajoie BR, Schulz EG, Giorgetti L, Okamoto I, Servant N, Piolot T, van Berkum NL, Meisig J, Sedat J, et al. Spatial partitioning of the regulatory landscape of the X-inactivation centre. Nature. 2012;485:381–385. doi: 10.1038/nature11049. [DOI] [PMC free article] [PubMed] [Google Scholar]
- Phillips JE, Corces VG. CTCF: master weaver of the genome. Cell. 2009;137:1194–1211. doi: 10.1016/j.cell.2009.06.001. [DOI] [PMC free article] [PubMed] [Google Scholar]
- Picelli S, Faridani OR, Bjorklund AK, Winberg G, Sagasser S, Sandberg R. Full-length RNA-seq from single cells using Smart-seq2. Nat Protoc. 2014;9:171–181. doi: 10.1038/nprot.2014.006. [DOI] [PubMed] [Google Scholar]
- Placek K, Hu G, Cui K, Zhang D, Ding Y, Lee JE, Jang Y, Wang C, Konkel JE, Song J, et al. MLL4 prepares the enhancer landscape for Foxp3 induction via chromatin looping. Nat Immunol. 2017;18:1035–1045. doi: 10.1038/ni.3812. [DOI] [PMC free article] [PubMed] [Google Scholar]
- Rao SS, Huntley MH, Durand NC, Stamenova EK, Bochkov ID, Robinson JT, Sanborn AL, Machol I, Omer AD, Lander ES, et al. A 3D map of the human genome at kilobase resolution reveals principles of chromatin looping. Cell. 2014;159:1665–1680. doi: 10.1016/j.cell.2014.11.021. [DOI] [PMC free article] [PubMed] [Google Scholar]
- Ren G, Jin W, Cui K, Rodrigez J, Hu G, Larson DR, Zhao K. CTCF-mediated enhancer-promoter interaction is a critical regulator of cell-to-cell variation of gene expression. Molecular Cell. 2017;67:1049–1058. doi: 10.1016/j.molcel.2017.08.026. [DOI] [PMC free article] [PubMed] [Google Scholar]
- Robinson MD, McCarthy DJ, Smyth GK. edgeR: a Bioconductor package for differential expression analysis of digital gene expression data. Bioinformatics. 2010;26:139–140. doi: 10.1093/bioinformatics/btp616. [DOI] [PMC free article] [PubMed] [Google Scholar]
- Saeed AI, Sharov V, White J, Li J, Liang W, Bhagabati N, Braisted J, Klapa M, Currier T, Thiagarajan M, et al. TM4: a free, open-source system for microarray data management and analysis. Biotechniques. 2003;34:374–378. doi: 10.2144/03342mt01. [DOI] [PubMed] [Google Scholar]
- Sexton T, Yaffe E, Kenigsberg E, Bantignies F, Leblanc B, Hoichman M, Parrinello H, Tanay A, Cavalli G. Three-dimensional folding and functional organization principles of the Drosophila genome. Cell. 2012;148:458–472. doi: 10.1016/j.cell.2012.01.010. [DOI] [PubMed] [Google Scholar]
- Shin H, Shi Y, Dai C, Tjong H, Gong K, Alber F, Zhou XJ. TopDom: an efficient and deterministic method for identifying topological domains in genomes. Nucleic Acids Res. 2016;44:e70. doi: 10.1093/nar/gkv1505. [DOI] [PMC free article] [PubMed] [Google Scholar]
- Spilianakis CG, Flavell RA. Long-range intrachromosomal interactions in the T helper type 2 cytokine locus. Nat Immunol. 2004;5:1017–1027. doi: 10.1038/ni1115. [DOI] [PubMed] [Google Scholar]
- Stadhouders R, Vidal E, Serra F, Stefano B, Dily F, Quilez J, Gomez A, Collombet S, Berenguer C, Cuartero Y, et al. Transcription factors orchestrate dynamic interplay between genome topology and gene regulation during cell reprogramming. bioRxiv. 2017 doi: 10.1038/s41588-017-0030-7. [DOI] [PMC free article] [PubMed] [Google Scholar]
- Wei G, Abraham BJ, Yagi R, Jothi R, Cui K, Sharma S, Narlikar L, Northrup DL, Tang Q, Paul WE, et al. Genome-wide analyses of transcription factor GATA3-mediated gene regulation in distinct T cell types. Immunity. 2011;35:299–311. doi: 10.1016/j.immuni.2011.08.007. [DOI] [PMC free article] [PubMed] [Google Scholar]
- Xing S, Li F, Zeng Z, Zhao Y, Yu S, Shan Q, Li Y, Phillips FC, Maina PK, Qi HH, et al. Tcf1 and Lef1 transcription factors establish CD8(+) T cell identity through intrinsic HDAC activity. Nat Immunol. 2016;17:695–703. doi: 10.1038/ni.3456. [DOI] [PMC free article] [PubMed] [Google Scholar]
- Yasui D, Miyano M, Cai S, Varga-Weisz P, Kohwi-Shigematsu T. SATB1 targets chromatin remodelling to regulate genes over long distances. Nature. 2002;419:641–645. doi: 10.1038/nature01084. [DOI] [PubMed] [Google Scholar]
- Yokota Y, Mansouri A, Mori S, Sugawara S, Adachi S, Nishikawa S, Gruss P. Development of peripheral lymphoid organs and natural killer cells depends on the helix-loop-helix inhibitor Id2. Nature. 1999;397:702–706. doi: 10.1038/17812. [DOI] [PubMed] [Google Scholar]
- Yui MA, Feng N, Rothenberg EV. Fine-scale staging of T cell lineage commitment in adult mouse thymus. J Immunol. 2010;185:284–293. doi: 10.4049/jimmunol.1000679. [DOI] [PMC free article] [PubMed] [Google Scholar]
- Yui MA, Rothenberg EV. Developmental gene networks: a triathlon on the course to T cell identity. Nat Rev Immunol. 2014;14:529–545. doi: 10.1038/nri3702. [DOI] [PMC free article] [PubMed] [Google Scholar]
- Zang C, Schones DE, Zeng C, Cui K, Zhao K, Peng W. A clustering approach for identification of enriched domains from histone modification ChIP-Seq data. Bioinformatics. 2009;25:1952–1958. doi: 10.1093/bioinformatics/btp340. [DOI] [PMC free article] [PubMed] [Google Scholar]
- Zhang JA, Mortazavi A, Williams BA, Wold BJ, Rothenberg EV. Dynamic transformations of genome-wide epigenetic marking and transcriptional control establish T cell identity. Cell. 2012;149:467–482. doi: 10.1016/j.cell.2012.01.056. [DOI] [PMC free article] [PubMed] [Google Scholar]
- Zheng X, Yue S, Chen H, Weber B, Jia J, Zheng Y. Low-Cell-Number Epigenome Profiling Aids the Study of Lens Aging and Hematopoiesis. Cell Rep. 2015;13:1505–1518. doi: 10.1016/j.celrep.2015.10.004. [DOI] [PMC free article] [PubMed] [Google Scholar]
- Zhou X, Lowdon RF, Li D, Lawson HA, Madden PA, Costello JF, Wang T. Exploring long-range genome interactions using the WashU Epigenome Browser. Nat Methods. 2013;10:375–376. doi: 10.1038/nmeth.2440. [DOI] [PMC free article] [PubMed] [Google Scholar]
Associated Data
This section collects any data citations, data availability statements, or supplementary materials included in this article.
Supplementary Materials
Table S1: Statistics of scDNase-Seq libraries – related to Figure 1
Table S2: Statistics of Hi-C libraries – related to Figure 2
Table S3: Gene expression values and change of expression during early T cell development – related to Figure 3
Table S4: List of genes with significant change in gross interaction before and after T cell commitment – related to Figure 3
Table S5: List of genes extracted from B-to-A or A-to-B flipped compartment region – related to Figure 4
Table S6: List and statistics of public ChIP-Seq data for early T cells – related to Figure 5
Table S7: List of genes bound by BCL11B and marked by H3K27me3 at promoters in DP cells – related to Figure 6