Abstract
A better understanding of how anode surface properties affect growth, development, and activity of electrogenic biofilms has great potential to improve the performance of bioelectrochemical systems such as microbial fuel cells. The aim of this paper was to determine how anodes with specific exposed functional groups (–N(CH3)3+, –COOH, –OH, and –CH3), created using ω-substituted alkanethiolates self-assembled monolayers attached to gold, affect the surface properties and functional performance of electrogenic Shewanella oneidensis MR-1 biofilms. A combination of spectroscopic, microscopic, and electrochemical techniques was used to evaluate how electrode surface chemistry influences morphological, chemical, and functional properties of S. oneidensis MR-1 biofilms, in an effort to develop improved electrode materials and structures. Positively charged, highly functionalized, hydrophilic surfaces were beneficial for growth of uniform biofilms with the smallest cluster sizes and intercluster diffusion distances, and yielding the most efficient electron transfer. The authors derived these parameters based on 3D morphological features of biofilms that were directly linked to functional properties of the biofilm during growth and that, during polarization, were directly connected to the efficiency of electron transfer to the anode. Our results indicate that substratum chemistry affects not only primary attachment, but subsequent biofilm development and bacterial physiology.
I. INTRODUCTION
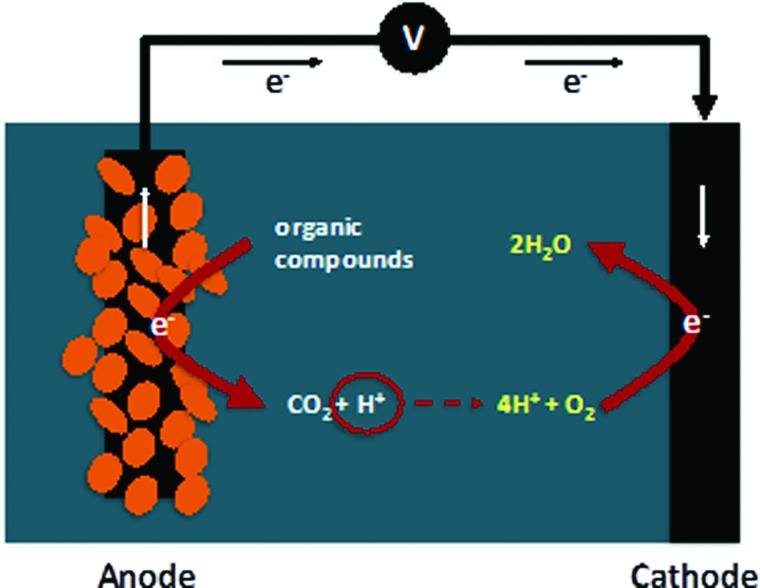
Microbial fuel cells (MFC) are bioelectrochemical systems (BES) in which electrogenically active bacteria oxidize organic compounds using an anode as a terminal electron acceptor and deliver protons and CO2 to solution.1 The transferred electrons generate an electric current as they travel through an external circuit to a cathode, where oxygen is reduced, protons are consumed, and water is produced (Scheme 1).
Scheme 1.
Microbial fuel cell.
Because MFCs combine bacterial metabolic processes with electricity production, they are promising candidates to produce energy during wastewater treatment. Optimization of underlying MFC processes is critical for efficient and cost-effective BES operation and practical commercialization, particularly with respect to improving biofilm development and the rate of electron transfer from bacteria to the electrode.2,3 Both biofilm formation and electron transfer rates are strongly dependent on electrode material properties, including surface chemistry and morphology, surface area, and conductivity.1–3 A better understanding how electrode properties affect biofilm performance is, therefore, likely to guide development of improved BES designs.
Carbon-based materials are widely used for electrode materials and can vary in surface properties such as morphology, chemistry, available surface area, and wettability. Several surface modification techniques have been explored to enhance bacterial adhesion and increase biofilm formation, including physical (thermal) and chemical treatments, immobilization of conductive and electroactive polymers, and deposition of various metals or metal seeds.1,4–8 Attachment surface charge and wettability (hydrophilicity/hydrophobicity) may be particularly important to the growth, development, and properties of bacterial biofilm and optimization of BES performance.9 Positively charged and hydrophilic surfaces were shown to improve attachment of the electrogen Geobacter, and therefore improved electroactive biofilm growth and development.9 We previously reported the importance of hydrophilic moieties and surface morphology on bacterial attachment, dynamics of biofilm formation, and MFC performance.10
While previous studies have significantly expanded our understanding on how anode surface modifications affect power output, the influence of different functional groups on biofilm properties, and, therefore, subsequent MFC performance is still not well understood.1,7,11–13 We used self-assembled monolayers (SAMs) as electrodes to systematically evaluate well-defined surface chemistries' influence on MFC performance.9 SAM-modified gold electrodes were used to eliminate the morphology effects associated with conventional 3D structured carbonaceous electrodes. We previously applied SAMs to study how surface chemistry facilitates and modulates mixed culture bacterial attachment and early biofilm formation.14–16
Angle-resolved XPS (ARXPS) can be utilized for collecting information from different depths of biofilms grown on solid supports without removing the top surface layers.17 Biofilm chemical composition and its overall thickness can be discerned from ARXPS analyses. ARXPS has been also widely used to study SAMs and biomaterials.18–23 ARXPS was applied in the current research to study substratum surface chemistry before, after, and during biofilm development.
Biofilm thickness and heterogeneity, as determined by confocal laser scanning microscopy (CLSM), have also been shown to vary with electrode surface chemistry.9 Unfortunately, the data provided by CLSM and similar techniques are usually presented qualitatively. Quantitative analysis of the relationships between morphological and performance parameters requires quantification of microscopic images.24–26 Previously, we demonstrated a methodology for extracting quantitative morphological information from microscopic images by digital image processing and correlating this information with the activity of electrodes in MFCs.8,10,11
To compare biofilm structures, researchers have used different parameters, such as biovolume, thickness, volume to surface ratio, and roughness. A set of more comprehensive parameters that describe heterogeneous biofilm morphology in three dimensions was recently recommended.24–26 CLSM is suitable calculating parameters related to three-dimensional morphology and other critical dimensions of biomass, as it allows acquisition of images of fully hydrated biofilms at high spatial resolution in lateral and vertical directions.
This study relates biofilm areal, volumetric, and textural parameters properties to electron transfer rates and efficiency. Areal metrics, such as cluster size, intercell distances, and orientation of cell clusters, may be responsible for transport properties. The variability of biofilm clusters as captured by fractal dimension (FD) might be associated with hydrodynamics. Volumetric parameters include biofilm volume, i.e., a total volume of biomass in the biofilm, and biomass roughness describing thickness variation in biomass. Textural parameters show variations in image gray level, which can be caused by local biofilm density, thickness, and color variations. Textural parameters measure the properties of the cell clusters and intercluster spaces based on the likelihood that pixels of similar or dissimilar types are neighbors.
The majority of reported studies performed so far have been done using mixed culture bacteria, in which case correlation of bacterial attachment and biofilm development with the current produced is potentially complicated by changes in bacterial populations. Consequently, the study of a single species of bacteria may provide a clearer understanding the attachment processes and current generation as a function of biofilm development. Shewanella oneidensis is a model organism in MFCs due its capability to transfer an electron through proteins across the outer cell membrane and reduce metal oxides. Using this ability, S. oneidensis MR-1 can transfer electrons to electrodes via extracellular electron transfer (EET).9 To the best of our knowledge, no studies on Shewanella attachment on polarized electrodes have related biofilm morphological parameters to current production.
In this study, SAMs of ω-substituted alkanethiolates on gold, terminated with the functional groups (–N(CH3)3+, –COOH, –OH, and –CH3) were used as anodes. We previously observed that NMe3+ terminated SAMs have a positive effect on MFC start up time and its overall electrochemical performance from biofilms formed from natural mixed cultures bacterial populations.6 In this study, we concentrated on the effects on S. oneidensis, to simplify the system and provide direct correlation between biofilm structure and physiology with energy production.
The aim of this research was to derive guidelines for the development of better electrode materials and structures by characterizing the surface properties of an anode and resulting S. oneidensis MR-1 biofilms, along with MFC performance, by a combination of analytical spectroscopic, microscopic, and electrochemical techniques. The interplay between electrode surface chemistry, the resulting morphological and chemical properties of S. oneidensis MR-1 biofilms, and biofilm electrochemical properties were the main focus of this study.
This multianalytical study provides a large set of data describing properties of biofilms—chemical composition and 3D morphological parameters—which can be related to anode electrochemical performance. Dealing with this large number of variables (parameters), finding correlations between them and classifying samples (in this case different types of biofilms grown on different SAMs) was addressed using principal component analysis (PCA). We showed that positively charged, highly functionalized hydrophilic surfaces are optimal for growth of a uniform biofilm with the smallest cluster size and intercluster diffusion distance correlating to the most efficient electron transfer. Moreover, we followed the evolution of biofilm morphology during its growth and after electrode polarization. It was found that biofilm thickness was not as important as biofilm heterogeneity. Finally, we propose metrics describing the loss of biomass, change in intercell properties and overall biofilm morphology, based on quantifying biofilm properties from 3D CLSM images directly related to biofilm electron transfer efficiency and stability.
II. EXPERIMENT
A. Materials
1. Making self-assembled monolayers
Microscope glass coverslips (24 × 60 mm, #1, VWR, USA) were used as mechanical support for sample preparation. The coverslips were first cleaned using 1 h UV ozone treatment and then placed into the chamber of a VE-90 electroevaporator (Thermionics, Hayward, CA, USA), and evacuated to ∼10−6 mTorr. An initial layer of 15 Å Cr was deposited on the glass face followed by 30 nm gold. After gold deposition, samples were immediately submerged in 1 mM ethanolic solutions of 1-mercaptoundecyl trimethylamine (NMe3+ SAM; Prochimia, Poland), 1-mercaptoundecanol (OH SAM; Aldrich, St. Louis, MO, USA), 1-undecanethiol (CH3 SAM; Aldrich, St. Louis, MO, USA), and 1-mercaptoundecanoic acid (COOH SAM, Aldrich, St. Louis, MO, USA).
2. Bacterial culturing conditions and biofilm growth
S. oneidensis MR-1, stored as 40% glycerol stocks at −80 °C, were transferred to Tryptic Soy Broth (TSB; Becton Dickinson, Franklin Lakes, NJ, USA) with 1.5% agar plates and incubated for 24 h at 30 °C. Single colonies were then subcultured in 50 ml of 30 g/ml TSB media and incubated aerobically for 18 h on a shaker table at 150 rpm and 30 °C. The cultures were collected by centrifugation and washed three times with 50 mM phosphate buffer at a pH of 7.4 and resuspended at 7 × 10⁷ cells/ml. 80 mM sodium lactate (Sigma Aldrich) was added to the final resuspending buffer, which acted as the metabolic electron donor for electrochemical studies. Sodium fumarate of 30 mM (Sigma Aldrich) was added as the electron acceptor. Biofilm growth was analyzed prior to SAM anode polarization. The SAM surfaces were submerged in Petri dishes containing phosphate buffer with S. oneidensis and biofilm coverage was monitored using CSLM (LSM 510-Meta, Zeiss, Jena) at 2, 24, and 48 h.
B. Characterization
1. MFC configuration and electrochemical testing
The electrochemical experiments were carried out in membraneless single chamber MFCs (Ref. 12) and were modified to incorporate three electrodes. These consisted of a reference electrode (saturated Ag/AgCl), a platinum wire counter electrode, and the working electrode, which included two SAM gold coverslips clipped together with nickel wire, with the functionalized sides facing the buffer solution. All four SAM types were tested separately as described previously.27 All electrochemical tests were performed using a Gamry Reference 600 potentiostat (Gamry Instruments, Warminster, PA, USA). Chronoamperometric tests were done at a constant potential of −0.30 V versus Ag/AgCl over a period of 24 h. Cyclic voltammetry was performed at a scan rate of 10 mV/s varying the potential from −0.8 to 0.9 V in order to examine distinctive peaks related to the metabolic activity of S. oneidensis.28 The electrochemical cells were purged by nitrogen in order to maintain a microaerobic environment.
2. Angle resolved XPS
XPS measurements were performed with a Kratos Axis Ultra DLD x-ray photoelectron spectrometer using a monochromatic Al Kα source operating at 225 W. Survey and high resolution C1s, O1s, N1s, and Au 4f were acquired at 80 and 20 eV pass energy, respectively. Three take-off angles (TOAs) were used for angle resolved studies: 90°, 60°, and 30° with respect to the surface. Times of acquisition were: 3 min for O, C, and Au and 6 min for N at 90° TOA; 6 min for O, C, and Au and 12 min for N at 60° TOA; and 10 min for O, C and Au and 20 min for N at 30° TOA charge compensation was accomplished using low energy electrons. As we have shown before, minimal x-ray degradation occurs when analysis is performed for 1–2 h per sample.19,29 Standard operating conditions for good charge compensation were −3.1 V bias voltage, −1.0 V filament voltage, and filament current of 2.1 A. The data presented are averages of three different areas per sample. SAMs grown on gold and biofilms grown on SAMs for 2, 24, and 48 h were analyzed at the same time.
Data analysis and quantification were performed using the casaxps software. A linear background was used for quantification. Quantification utilized sensitivity factors that were provided by the manufacturer. A 70% Gaussian/30% Lorentzian [GL (30)] line shape was used for the curve-fits. All the spectra were charge referenced to the Au 4f at 84 eV. Full width at half maximums used for curve fits of C 1s spectra was constrained to 1.0 ± 0.2 eV. The thicknesses of SAMs on the gold substrate and of biofilms on SAM were calculated using the substrate/overlayer model in Arctick. For SAMs thicknesses, area under the C peak was used as signal from overlayer, while for biofilms thicknesses, area under the peaks for N was used to represent overlayer, and, in both cases, area under the Au peak was used to represent substrate.18
3. Confocal laser scanning microscopy and image acquisition
Upon completion of the electrochemical measurements, microscopic observations on the SAM surfaces were done using a Zeiss LSM-510 meta confocal fluorescence microscope (Carl Zeiss Microscopy, Jena). Prior to microscopy, SAM samples with biofilms were fixed using 2.5% v/v glutaraldehyde in phosphate buffer for a minimum of 8 h. Samples were then rinsed with water and placed in a solution of 5 μM Syto 21 green fluorescent nucleic acid stain (Life Technologies, Grand Island, NY, USA) for 15 min. The stained samples were viewed using a 63X/0.95W Achroplan water immersion objective and a 505–530 nm band pass filter. A compatible Argon/2 laser, 488 nm, was used to excite the green Syto 21 stain. Z stacks were acquired with a slice separation of 0.72 μm for all samples. The resulting slices were processed using zen software (Carl Zeiss Microscopy) and further analyzed using matlab.
C. Data analysis
1. Quantifying biofilm structure
Digital image processing was done using the graphical user interface (GUI) in matlab (Ref. 30) based on the algorithm introduced by Beyenal et al.24,25 An in-house written GUI for thresholding of image stacks was used. The GUI is available at the Mathworks File exchange website.30
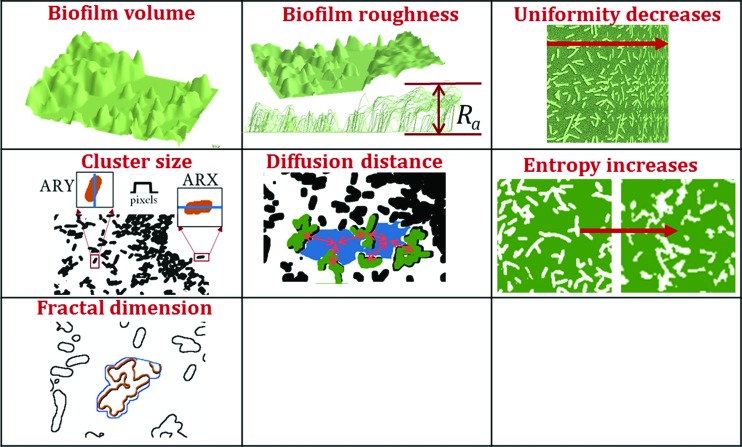
Areal and volumetric parameters describe the morphology of biofilms, i.e., they describe size and shape/orientation of the constituent parts. Each parameter measures a unique characteristic feature of the biomass cluster and intercluster space in the biofilm. First, the images were thresholded, which separated cell clusters from intercluster voids. The following volumetric parameters (Fig. 1) were then calculated:
-
(1)
Biofilm volume is the total volume of biomass in the biofilm measured as the total number of pixels where biomass present (value of 1 in the thresholded image).
-
(2)
Biomass roughness Ra is variation in biomass thickness.
-
(3)
Cluster size measured as average run (AR) length, which is the number of consecutive biomass pixels representing cell clusters in a given directions. AR in both X and Y directions was very similar, so cluster size in a horizontal direction (ARX) was used to represent the average cluster size.
-
(4)
Average diffusion distance is the average distance from a cluster pixel to the nearest void pixel in the image. This is a measure of closeness of individual cell clusters to each other.
-
(5)
FD is a measure of the roughness of the boundaries of cell clusters or irregularity of cell cluster surface.
Fig. 1.
3D metrics extracted from CLSM 3D stacks. Definitions of volumetric and textural metric are presented in text.
Texture provides information about the spatial distribution of intensity levels. Textural features, based on gray scale co-occurrence matrices (GLCM), provide measures of homogeneity, randomness, or directionality.31–35 The GLCM is a tabulation of how often different combinations of pixel intensity values (gray levels) occur in an image. Uniformity and entropy were calculated from GLCM texture. Uniformity, also called energy, represents the homogeneity or orderliness of image. Smaller uniformity values are observed for frequent and repeated patterns of pixel clusters while more homogeneous image structure with fewer repeated patterns has higher uniformity. Entropy measures degree of randomness. Complex textures and more heterogeneous images have higher entropy, which increases with the number of cell clusters.
2. Multivariate analysis
Multivariate analysis was done using PLS_Toolbox 7.9 for matlab.36 Principal component analysis, using an autoscaling as a preprocessing option (mean centering and scaling to unit variance), was the default method of data analysis. PCA transforms original variables into new uncorrelated variables called principal components. Autoscaling ensures that parameters having very different magnitudes have the same statistical contribution in the model. The first principal component (PC1) contains the maximum variance. The second principal component (PC2) is calculated to have the second most variance, and, importantly, is uncorrelated with the PC1 and so on. The first output from PCA is loadings, which are the coefficients of the linear combinations of the original variables that generate the principal components. The second output, scores, shows the relationship between samples. Biplots displaying both loadings for each variable and scores for each sample in a single plot for the PC1 and PC2 were produced to visualize the clustering of samples with respect to parameters that were the most or least important for separating samples based on their activity. Correlated variables and samples are located in the same quadrant on a biplot.
III. RESULTS AND DISCUSSION
A. Electrochemical testing
S. oneidensis MR-1 has been commonly used as a model organism in the study of BES. This bacterium can utilize Mn (IV) and Fe (III) oxides as terminal electron acceptors existing in nature, and it can also deliver electrons to BES anodes.37–39 In this study, electrodes covered comprising gold-thiolate SAMs were utilized as anodes for the development of S. oneidensis based MFCs. Four types of SAMs expressing different terminal groups (NMe3+, CH3, OH, and COOH) were explored to study the effect of the electrode surface chemistry on the properties of the biofilm. In order to mimic real MFC operation, the anode was polarized at a constant potential of −0.3 V versus Ag/AgCl for 24 h, following a procedure previously developed in our group to enhance S. oneidensis biofilm formation of on carbonaceous electrodes.28
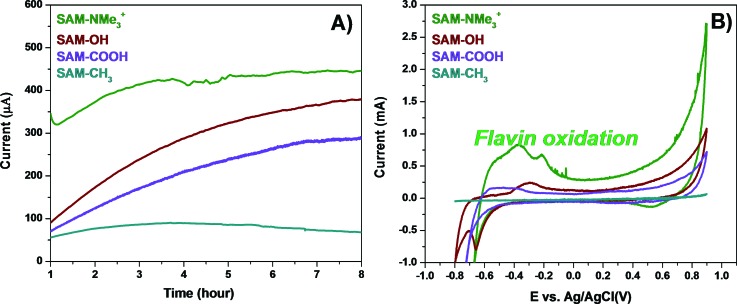
A three-electrode setup implemented as a single chamber MFC was used for the electrochemical studies composed of SAMs-modified gold electrodes utilized as working electrode and Ag/AgCl, and Pt-wire employed as reference and counter electrodes, respectively. The cell was inoculated with a suspension of S. oneidensis in buffer with lactate as the electron donor. The SAM-modified gold electrodes were exposed to the conditions mentioned above, during which the current generated as a result of lactate oxidation by S. oneidensis was recorded via chronoamperometry [Fig. 2(a)]. The NMe3+-terminated SAM electrode generated the highest current reaching 442 μA during the initial 7–8 h of polarization, while the CH3-SAM electrode exhibited the lowest current, reaching only 67 μA at the same time point. These observations were in agreement with previous results, indicating that NMe3+ moieties are related to higher current generation than are CH3.6 This can be explained by the hydrophobicity of the CH3-SAM surfaces having a negative impact on biofilm development and thus on the current generation.40 Upon completing the chronoamperometry experiments, the SAM-modified bioanodes were analyzed by cyclic voltammetry (CV) [Fig. 2(b)]. The CV of the NMe3-terminated SAM demonstrated oxidation peaks usually assigned to flavin oxidation, where the more negative peak at potential lower than −0.3 V was due to oxidation of riboflavin dissolved in the electrolyte and the second, more positive peak at potential between −0.3 and −0.2, was a result of riboflavin oxidation when riboflavin is bound to bacteria outer membrane cytochromes.41 These results demonstrated favorable conditions for biofilm development and electron transfer on NMe3+-SAMs surfaces. Based on previous electrochemical studies, Fig. 2(b) shows that the cyclic voltammogram from NMe3+-SAMs also have maximum capacitance and electron transfer peaks.28
Fig. 2.
(a) Chronoamperometry of the different SAM-modified anodes performed at a constant potential of −0.30 V vs Ag/AgCl. (b) Cyclic voltammograms of the SAM anodes at a scan rate of 10 mV/s. Highest current and largest oxidation peak are observed for biofilm grown on SAM-NMe3+ surface.
B. XPS results
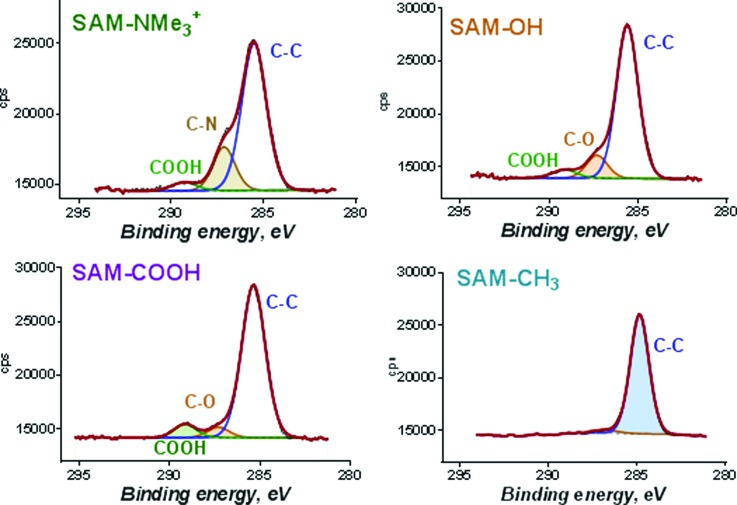
ARXPS was used to analyze both SAMs on gold and biofilm samples grown at different times. Figure 3 shows high-resolution C 1s spectra representative of four SAM samples at 90° TOA. Three areas per sample were analyzed at three take-off-angles, and substrate-overlayer model was used to calculate the thickness of SAM overlayer on the gold substrate. In the substrate-overlayer model, the intensities of two peaks, one coming from the substrate and another from the overlayer, as a function of take-of-angle, were used to calculate thickness at known inelastic mean free path (IMFP) of photoelectrons. This model assumes that IMFP of the electrons in the substrate and overlayer are identical and that the overlayer is homogeneous and continuous.42,43 This assumption is valid for the system of SAMs on gold, in which intensities of Au and C are used to calculate the SAM thickness. IMFP were obtained from Penn.44
Fig. 3.
High resolution C 1s spectra from SAM on Au. All peaks used to curve-fit spectra are labeled.
The range of SAM thicknesses between 1.3 and 1.7 nm was in good correspondence with reported values.45–47 Peaks in C 1s spectra were representative of chemistries expected from the termination groups, including a peak due to C–N at 287 eV in SAM-NMe3+, a peak at 287.2 eV due to C–OH and some amount of higher oxidation state was detected for SAM-OH at 289 eV, peaks due to C–O (287.2 eV) and C=O (289 eV) from carboxyl group were detected for SAM-COOH, and finally, SAM-CH3 had a C spectrum consisting of single symmetrical peak at 285 eV with negligible amount of C–O (286.8 eV) contamination from adventitious carbon.
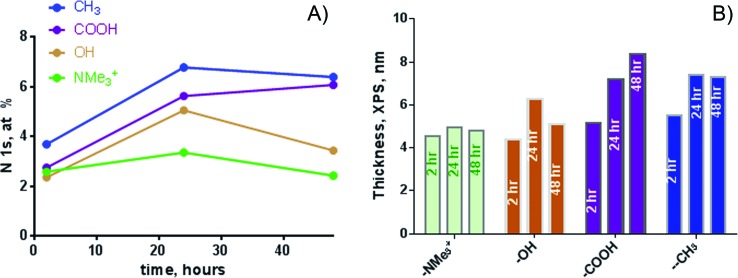
For the biofilm thickness calculations, we have used signal from N 1s from biofilm versus gold substrate in the ARCTICK overlayer-substrate model. The assumption of a homogeneous and continuous overlayer may not be valid for biofilm samples. For SAM-NMe3+, the signal was adjusted by the N amount that was present in the NMe3+ SAM itself, and the thickness was adjusted by the thickness of underlying SAM layer. Figure 4 shows N at. % and thickness calculated as a function of time of biofilm growth. For films grown for 2 h, the SAM-CH3 and SAM-COOH have largest amount of N while NMe3+ has the smallest amount of N from the biofilm detected.
Fig. 4.
(a) Atomic percent of N and (b) thickness (in nm) for biofilms growth at SAMs at three different times. Largest N amount and thickest film is observed for biofilms grown on SAM-COOH and SAM-CH3.
The thickness of the biofilm grown on SAM-NMe3+ was relatively constant, and it was the smallest among all the samples. The largest continuous growth occurred on the SAM-COOH, which corresponded to increased N with time. For SAM-CH3, the biofilm increased by ∼25% from 2 to 24 h, and then plateaued. The SAM-OH biofilm increased and then decreased, suggesting that some biomass detachment occurred. Interestingly, the hydrophilic, positively charged surface (NMe3+) yielded the highest current and also had the least biomass, and there was no increase in biomass thickness. ARXPS provided an integrated composition and thickness from a large area of 300 × 700 μm, so heterogeneities smaller than this area of analysis were overlooked. Also, the overlayer-substrate model did not take into account that the overlayer may be porous and rough, and so the biofilm thicknesses provided by ARXPS may not represent total biomass or reflect surface heterogeneity.48
C. Confocal microscopy results
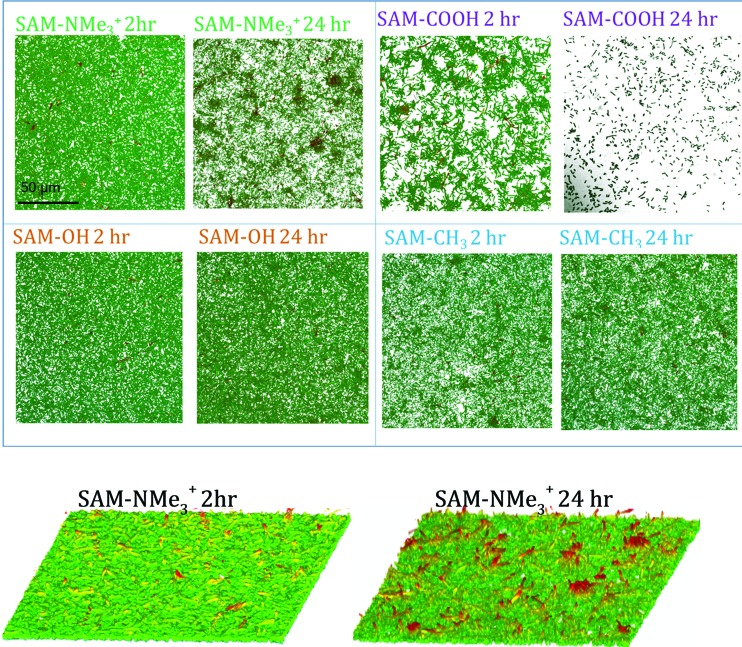
Figure 5 shows CLSM 3D image stacks displayed in the orthogonal view for all biofilms and as volumes for biofilms grown on SAM-NMe3+ for 2 and 24 h. At 2 h, SAM-NMe3+ and SAM-OH exhibited the most homogeneous morphology of the four electrodes, with the smallest spacing between biofilm clusters. Biofilms grown on SAM-COOH for 2 h had the highest heterogeneity with the largest number of pores visible. At 2 h, the SAM-CH3 biofilm was less homogeneous with less uniformity and more pores visible than for SAM-NMe3+.
Fig. 5.
Confocal images of biofilms grown at SAMs at 2 and 24 h. Biofilms on SAM-NMe3+ become clustered with growth. Biofilms on SAM-COOH deteriorate. Biofilms on SAM-OH and SAM-CH3 show largest stability in the appearance.
The morphologies changed during biofilm growth from 2 to 24 h on some SAMs. Increased contrast, clustering of cells, and growth of pores was visible in SAM-NMe3+ at 24 h, while the SAM-OH and SAM-CH3 biofilms did not demonstrate obvious loss of structure according to the CLSM images. On SAM-COOH substrata, the biofilm was highly deteriorated by 24 h. This observation contradicts the information obtained from ARXPS, indicating than some N deposited on the electrode transferred from the film that was not present anymore. This highlights the limitations of XPS for studying systems that undergo changes upon transfer from humidified to the dry environment. The nitrogen signal that was used in XPS analyses as a metric of the biofilm presence may not accurately represent the live biofilm on the surface. This demonstrates the utility of multianalytical studies, such as presented here, to provide a more complete picture of biofilm structures.
D. Structure-to-property correlations
This multianalytical approach provides a large set of parameters. In order to develop correlations between results of microscopic and spectroscopic methods and performance characteristics of the engineered material, we need to correlate information from multiple analytical methods. Dealing with the large number of variables (parameters) and finding correlations between them and classification of samples is an important challenge. Application of multivariate analysis methods such as PCA allows for fast and efficient way to find correlations between samples and parameters from large datasets combining information from multiple analytical methods.
Structural biofilm parameters were extracted from the confocal 3D stack images representing total biofilm volume, biofilm roughness, cluster size, the diffusion distance, fractal dimension, entropy, and uniformity as described in Sec. II. These morphological parameters were then combined with parameters of electrochemical performance, XPS composition, and XPS thickness of the film into one dataset, as shown in Table I.
Table I.
Morphological parameters, XPS surface chemical composition, and performance parameters combined in one dataset for principal component analysis.
| Entropy | Uniformity | Biomass roughness | Cluster size | Diffusion distance | Fractal dimension | Biomass volume | |
|---|---|---|---|---|---|---|---|
| SAM-CH3 | 5.71 | 0.019 | 0.042 | 11.3 | 2.05 | 2.57 | 23 957 000 |
| SAM-COOH | 5.50 | 0.023 | 0.077 | 9.5 | 2.01 | 2.52 | 20 514 322 |
| SAM-NMe3+ | 7.07 | 0.005 | 0.045 | 9.7 | 1.94 | 2.65 | 23 876 871 |
| SAM-OH | 6.48 | 0.009 | 0.042 | 11.1 | 2.06 | 2.64 | 27 016 639 |
| XPS thickness (nm) | C 1s (%) | O 1s (%) | N 1s (%) | C–C (%) | C–N/C–O (%) | COOH (%) | |
| SAM-CH3 | 5.5 | 95.4 | 4.4 | 0.1 | 93.6 | 6.4 | 0.0 |
| SAM-COOH | 5.1 | 85.0 | 14.8 | 0.2 | 88.3 | 5.1 | 6.6 |
| SAM-NMe3+ | 5.9 | 83.2 | 12.2 | 4.7 | 78.8 | 16.5 | 4.7 |
| SAM-OH | 4.4 | 82.7 | 17.2 | 0.1 | 83.2 | 12.7 | 4.1 |
| I at 5 h (μA) | I (oxidation peak) (μA) | ||||||
| SAM-CH3 | 85.4 | −13.7 | |||||
| SAM-COOH | 238.5 | 53.5 | |||||
| SAM-NMe3+ | 433.7 | 298.9 | |||||
| SAM-OH | 323.4 | 77.0 |
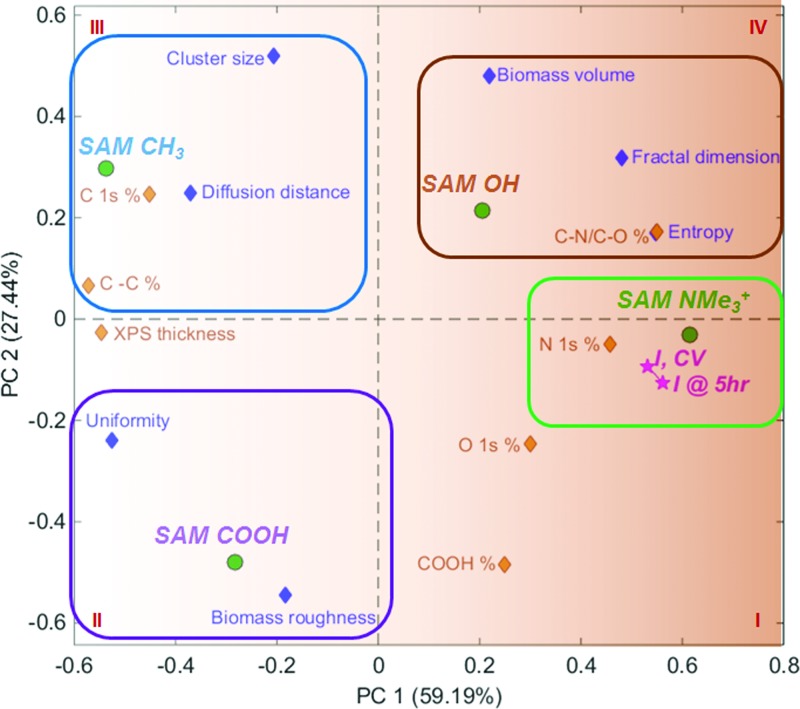
Figure 6 shows a PCA biplot obtained from this multivariate dataset. PC1 separates samples by their electrochemical performance, with better performing samples contributing positively to PC1, and worse performing samples contributing negatively to PC1. PC2 separated samples by the amount of the biofilm grown. Quadrant I contains the SAM-NMe3+ sample, with the best electrochemical performance, and highest amount of N and O. The SAM-NMe3+ sample was positively charged and hydrophilic surface, and produced the most uniform biofilm with the smallest cluster size and diffusion distance between clusters. This morphology apparently enabled the most efficient electron transfer to the electrode surface. Overall thickness of the biofilm was not as important as biofilm heterogeneity.
Fig. 6.
PCA biplot for data set combining 3D metrics from CLSM, XPS composition, XPS thickness, and electrochemical performance. PC1 separates samples by active (positive PC1) and nonactive (negative PC1). PC2 separates samples by the amount of biofilm grown.
Quadrant II includes the SAM-COOH biofilm, which exhibited good electrochemical performance, and had high roughness but at the same time high uniformity of the cell clusters. Uniformity decreases with more frequently repeated patterns of pixel clusters, and so structures that have fewer repeated cell clusters may result in higher biomass roughness. SAM-CH3, the worst performing sample, is located in Quadrant III. This sample has the largest amount of carbon, the smallest amount of functionalization, the largest cluster size, and the largest diffusion distance between cell clusters.
Figure 7 shows representative SEM images from polarized SAM-CH3 and SAM-NMe3+ illustrating the different morphologies with SAM-CH3 sample having larger cells cluster size than SAM-NMe3+. This difference in morphology was captured by the metrics obtained from confocal microscopy. As a result of the higher surface tension observed in SAM-CH3, there can be conglomeration of dead bacterial cells at the surface. Further verification of this phenomenon can be observed in the electrochemical results where the cyclic voltammetry peaks corresponding to the SAM-CH3 are negligible, suggesting poor electron transfer, which is attributed to abiotic components at the anode surface. The hydrophobic SAM-CH3 chemistry apparently resulted in a thick biofilm with high volume, but the poorest morphological aerial properties for electron transfer.
Fig. 7.
SEM images from biofilm on (a) SAM-NMe3+ and (b) SAM-CH3. Inset shows higher magnification SEM images. Agglomeration of bacteria on hydrophobic SAM-CH3 is evident.
Quadrant IV includes the SAM-OH biofilm, which had largest biofilm volume, but poor performance that may be related to its relatively large cell cluster size and higher diffusion distance than the SAM-NMe3+ biofilm. This biofilm also had the highest degree of irregularity in the cluster structure and entropy.
E. Quantifying biofilm structure
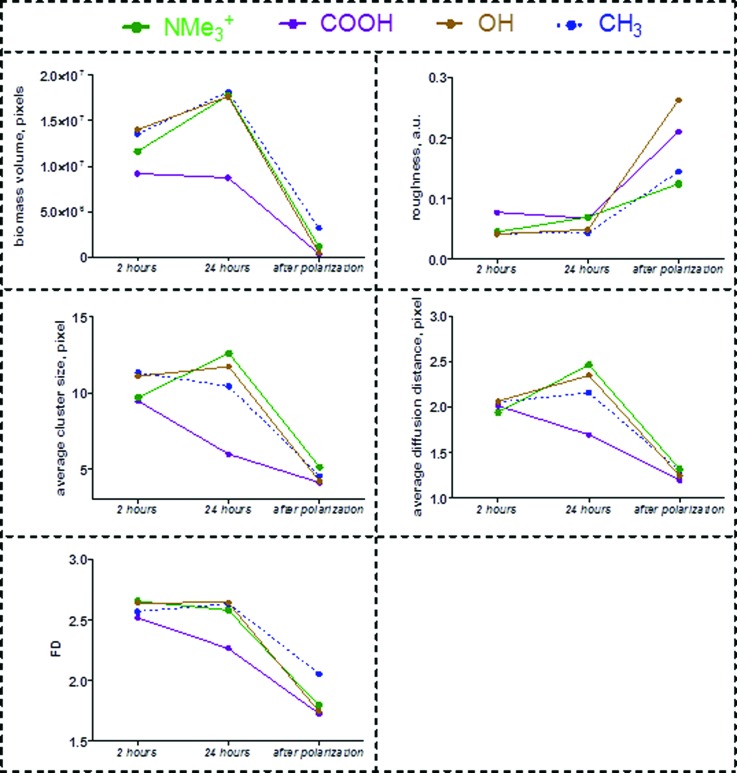
The parameters biofilm volume, biofilm roughness, cluster size, the diffusion distance, and fractal dimension can be important for stability and performance of the bacterial biofilms. The evolution of biofilm morphologies were analyzed by image analysis of 3D confocal depth stacks acquired for biofilms grown at 2 and 24 h, as well as after electrochemical polarization for 24 h (Fig. 8). For all but SAM-COOH, the biofilms grew continuously without changes in overall roughness. This was not true after samples were subjected to electrochemical polarization, when a significant loss of biofilm was observed, accompanied by a notable increase in biofilm roughness. This may be attributed to the fact that the development of thick biofilms hinders the electron transfer from bacteria toward the electrode surface and creates diffusional limitations for the bacteria electron donor. Although it was suggested that Shewanella cells are capable of external cell-to-cell electron transfer,49 the growth of thicker biofilms may impose resistance that decreases the efficiency of the electron transfer and, consequently, the generated current. At the same time, thicker biofilms create diffusional resistance to electron donor transport (lactate in this case), so it cannot access the deeper layers of the biofilm, and therefore, bacteria located farther away from the solution and closer to the solid surface die and get separated from the surface. Since the development of thick biofilms is not beneficial for MFCs operation, the polarized samples with thick biofilms do not allow for development of cellular communication with the surface as reflected by the diffusion distance and clustering as reflected by the cluster size. The best electrochemically performing sample had the smallest roughness after polarization, indicating higher uniformity of the biofilm. This may explain its higher electrochemical response since the bacterial cells communicating directly with the electrode surface were the ones participating effectively in the current generation.
Fig. 8.
Evolution in 3D biofilm parameters from biofilms grown for 2–24 h and after applied polarization. The trends are discussed in detail in text.
The changes in cell cluster dimensions and intercluster diffusion distances over time are also shown in Fig. 8.
The SAM-COOH biofilm demonstrated very different behaviors from the other biofilms. The cluster size and diffusion distance decreased, which was consistent with the overall loss of biomass (Fig. 5). Under the nearly neutral pH of biofilm growth, the acidic groups of SAM-COOH (pKa = 6.5) are only partially deprotonated, so there is no strong repulsion between COO− and bacteria.50 Interactions between carboxylic groups and (currently unidentified) components on the bacterial surfaces drive attachment of bacteria and growth of biofilm is observed at initial times of growth. However, with further growth time, and in the polarization test, the biofilm morphology changes profoundly, due to cell detachment cells or increased clustering. This may be the result of chemical changes at the cell–substratum interface, such as weak strength of the hydrogen bonding, possible effects of H-bonding on local pH creating zones of negatively charged COO− bonds repelling bacteria50 and steric effects due to hydrogen bonding between carboxylic groups of SAM.51 Alternatively, the SAM surface could have triggered phenotypic changes in attached bacteria, leading to detachment or surface motility processes known to occur during biofilm development.52
The most significant change in cell-to-cell morphology was evident for the best performing biofilm on SAM-NMe3+ under both polarized and nonpolarized conditions. During biofilm growth from 2 to 24 h, cells become larger and farther apart. There was a smaller increase in cell clusters in both SAM-CH3 and SAM-OH samples, but there was also an increase in diffusion distance for both of them. After polarization, all biofilms become very similar to each other in terms of areal properties. The decrease in cluster size and diffusion distance was accompanied by the overall loss of biomass. Irregularity of the cell structure expressed as a fractal dimension did not change during film growth for any of the biofilms. However, it decreased after polarization, suggesting that major loss of biomass occurs from peaks protruding from the outer part of the cell cluster, resulting in a smoother surface after the polarization. The SAM-CH3 had the lowest biomass loss as expressed in the largest preserved biovolume and the lowest loss of fractality of the cell structure, supporting this hypothesis.
Texture parameters, entropy, and uniformity were used to evaluate changes in biofilm morphological properties. The smallest change in these properties with growth and after polarization was observed for the worst performing biofilm grown on SAM-CH3. The most unstable biofilm that formed on SAM-COOH had the highest increase in uniformity, due to the loss of cells during development. Biofilm grown on SAM-OH had relatively stable morphology, as manifested by little change in entropy and uniformity, but after polarization the loss of cell clusters resulting in lower entropy and higher uniformity exceeded that for biofilm grown on SAM-COOH. For SAM-NMe3+, best performing biofilm, biofilm morphology changed during growth, but the resultant morphology after polarization was more preserved than for the other two biofilms grown on hydrophilic SAMs.
The two ratios the distance between cell clusters to the size of the cluster, which serves as a measure of connectivity between cells facilitating electron transfer, and the ratio of uniformity to entropy, which is a measure of overall loss of biomass are shown in Fig. 9. For NMe3+-SAM, there is a little change in the diffusion distance/cluster size ratio during biofilm growth. As the biofilm grows, the distance between cell clusters increases proportionally to the cell cluster size, potentially resulting in more efficient electron transfer in comparison with biofilms grown on other SAMs, in which this ratio increased, potentially resulting in less efficient electron transfer. The highest instability of the SAM-COOH biofilm was evident from the largest change in both ratios during biofilm growth on this SAM. The highest loss of biomass after polarization occurred on SAM-OH, corresponding highest values of both ratios. Biofilms grown on the best performing (SAM-NMe3+) and worst performing (SAM-CH3) surfaces were the most stable, with the smallest loss of biomass for SAM-CH3 and the smallest change in cell-to-cell properties for SAM-NMe3+.
Fig. 9.
Ratio of (a) diffusion distance/cluster size and (b) uniformity to entropy for biofilms grown at 2h, 24 h, and after polarization. The loss of biomass and loss of connectivity is lowest for biofilms on NMe3+-SAM.
The effects of surface chemistry on biofilm structure are an important subject of study. Isolated observations suggest that attachment substratum chemistry can affect subsequent cell–cell interactions,53 exopolymer production,54 and ultimately adhesion properties of biofilms.56 The conventional wisdom, however, is that substratum properties affect on the initial attachment phase of biofilm formation, with little effect on subsequent biofilm development or morphology, e.g., Refs. 55 and 56. Biofilm development57 ultimately involves many interactions between the bacteria and attachment substratum; these include the ability of exopolymers to expand and adhere on surfaces,58 bacterial surface motility,59 persistence,60 and detachment. Our results indicate that the substratum chemistry affects not only primary attachment but potentially other processes: surface motility is known to be required to form the structures seen on SAM-N(CH3)3+ (Ref. 59) in Pseudomonas aeruginosa. For static immersion systems (without mixing), like the one used in this study, the decrease in biofilm observed on SAM-COOH is likely driven by biological processes within the biofilm (leading to bacterial detachment or programmed cell death, for example).61 Such processes may be promoted by changes in the cells morphology as a result of the attachment.62 Our results indicate that surface chemistry can be used to modulate subsequent biofilm processes, including EET, establishing a new paradigm in biointerface design.63
IV. SUMMARY AND CONCLUSIONS
The multianalytical approach used in this study allowed the monitoring the perturbations in biofilm structure and development in different environments (surface chemistry) and in response to environmental changes (electrical potential). Surface chemistry can be used to modulate subsequent biofilm processes, including EET, enabling a new paradigm in biointerface design. This study provided the first demonstration of differences in biofilm responses when subjected to external polarization, which previously was hypothesized but never clearly demonstrated. The present study is a significant contribution toward further understanding and optimization of MFCs systems as it addresses the effect of biofilm growth and development, as well as its structure and morphology on MFC operation.
ACKNOWLEDGMENTS
This project was funded by the Bill & Melinda Gates Foundation under initiative: “Applying Electrochemistry to Complex Global Challenges,” Army Research Office Grant No. W911NF1210208 and Center for Emerging Energy Technologies.
References
- 1. Wei J., Liang P., and Huang X., Bioresour. Technol. 102, 9335 (2011). 10.1016/j.biortech.2011.07.019 [DOI] [PubMed] [Google Scholar]
- 2. Nevin K. P. et al. , PLoS One 4, e5628 (2009). 10.1371/journal.pone.0005628 [DOI] [PMC free article] [PubMed] [Google Scholar]
- 3. Marsili E., Baron D. B., Shikhare I. D., Coursolle D., Gralnick J. A., and Bond D. R., Proc. Natl. Acad. Sci. 105, 3968 (2008). [DOI] [PMC free article] [PubMed] [Google Scholar]
- 4. Wang X., Cheng S., Feng Y., Merrill M. D., Saito T., and Logan B. E., Environ. Sci. Technol. 43, 6870 (2009). 10.1021/es900997w [DOI] [PubMed] [Google Scholar]
- 5. Manickam S. S., Karra U., Huang L., Bui N.-N., Li B., and McCutcheon J. R., Carbon 53, 19 (2013). 10.1016/j.carbon.2012.10.009 [DOI] [Google Scholar]
- 6. Cheng S. and Logan B. E., Electrochem. Commun. 9, 492 (2007). 10.1016/j.elecom.2006.10.023 [DOI] [Google Scholar]
- 7. Zhou M., Chi M., Wang H., and Jin T., Biochem. Eng. J. 60, 151 (2012). 10.1016/j.bej.2011.10.014 [DOI] [Google Scholar]
- 8. Li B. et al. , Electrochim. Acta 134, 116 (2014). 10.1016/j.electacta.2014.04.136 [DOI] [Google Scholar]
- 9. Guo K., Freguia S., Dennis P. G., Chen X., Donose B. C., Keller J., Gooding J. J., and Rabaey K., Environ. Sci. Technol. 47, 7563 (2013) 10.1021/es400901u. [DOI] [PubMed] [Google Scholar]
- 10. Santoro C., Guilizzoni M., Correa Baena J. P., Pasaogullari U., Casalegno A., Li B., Babanova S., Artyushkova K., and Atanassov P., Carbon 67, 128 (2014). 10.1016/j.carbon.2013.09.071 [DOI] [Google Scholar]
- 11. Santoro C. et al. , Bioresour. Technol. 163, 54 (2014). 10.1016/j.biortech.2014.03.091 [DOI] [PubMed] [Google Scholar]
- 12. Santoro C., Ieropoulos I., Greenman J., Cristiani P., Vadas T., Mackay A., and Li B., Int. J. Hydrogen Energy 38, 11543 (2013). 10.1016/j.ijhydene.2013.02.070 [DOI] [Google Scholar]
- 13. Logan B. E., Nat. Rev. Microbiol. 7, 375 (2009). 10.1038/nrmicro2113 [DOI] [PubMed] [Google Scholar]
- 14. Finlay J. A., Callow M. E., Ista L. K., Lopez G. P., and Callow J. A., Integr. Comp. Biol. 42, 1116 (2002). 10.1093/icb/42.6.1116 [DOI] [PubMed] [Google Scholar]
- 15. Ista L., Callow M., Finlay J., Coleman S., Nolasco A., Callow J., and Lopez G., Appl. Environ. Microbiol. 70, 4151 (2004). 10.1128/AEM.70.7.4151-4157.2004 [DOI] [PMC free article] [PubMed] [Google Scholar]
- 16. Ista L. and Lopez G., Biointerphases 8, 24 (2013). 10.1186/1559-4106-8-24 [DOI] [PubMed] [Google Scholar]
- 17. Cumpson P. J., “ Angle-resolved x-ray photoelectron spectroscopy,” in Surface Analysis by Auger and X-ray Photoelectron Spectroscopy, edited by Briggs D. and Grant J. T. ( IM Publications and Surface Spectra Limited, Chichester, Manchester, 2003). [Google Scholar]
- 18. Artyushkova K., Fulghum J. E., and Reznikov Y., Mol. Cryst. Liq. Cryst. 438, 1769 (2005) 10.1080/15421400590954470. [DOI] [Google Scholar]
- 19. Baer D. R. and Engelhard M. H., J. Electron Spectrosc. 178, 415 (2010). 10.1016/j.elspec.2009.09.003 [DOI] [Google Scholar]
- 20. Eby D. M., Artyushkova K., Paravastu A. K., and Johnson G. R., J. Mater. Chem. 22, 9875 (2012). 10.1039/c2jm30837a [DOI] [Google Scholar]
- 21. Ivnitski D., Artyushkova K., and Atanassov P., Bioelectrochemistry 74, 101 (2008). 10.1016/j.bioelechem.2008.05.003 [DOI] [PubMed] [Google Scholar]
- 22. Nelson K. E. et al. , Langmuir 17, 2807 (2001). 10.1021/la001111e [DOI] [Google Scholar]
- 23. Vericat C., Vela M. E., Benitez G. A., Gago J. A. M., Torrelles X., and Salvarezza R. C., J. Phys.: Condens. Matter 18, R867 (2006). 10.1088/0953-8984/18/48/R01 [DOI] [Google Scholar]
- 24. Beyenal H., Donovan C., Lewandowski Z., and Harkin G., J. Microbiol. Methods 59, 395 (2004). 10.1016/j.mimet.2004.08.003 [DOI] [PubMed] [Google Scholar]
- 25. Beyenal H., Lewandowski Z., and Harkin G., Biofouling 20, 1 (2004). 10.1080/0892701042000191628 [DOI] [PubMed] [Google Scholar]
- 26. Yang X., Beyenal H., Harkin G., and Lewandowski Z., J. Microbiol. Methods 39, 109 (2000). 10.1016/S0167-7012(99)00097-4 [DOI] [PubMed] [Google Scholar]
- 27. Santoro C., Babanova S., Artyushkova K., Cornejo J., Ista L. K., Bretschger O., Marsili E., Atanassov P., and Schuler A. J., “ Influence of anodes surface chemistry on microbial fuel cells operation,” Bioelectrochemistry (submitted). [DOI] [PMC free article] [PubMed] [Google Scholar]
- 28. Roy J. N., Babanova S., Garcia K. E., Cornejo J., Ista L. K., and Atanassov P., Electrochim. Acta 126, 3 (2014). 10.1016/j.electacta.2013.07.075 [DOI] [Google Scholar]
- 29. Artyushkova K. and Atanassov P., Chemphyschem 14, 2071 (2013). 10.1002/cphc.201300037 [DOI] [PubMed] [Google Scholar]
- 30. Artyushkova K., “GUI,” http://goo.gl/IHavd6.
- 31. Artyushkova K., Pylypenko S., Dowlapalli M., and Atanassov P., J. Power Sources 214, 303 (2012). 10.1016/j.jpowsour.2012.04.095 [DOI] [Google Scholar]
- 32. Artyushkova K., Pylypenko S., Dowlapalli M., and Atanassov P., RSC Adv. 2, 4304 (2012). 10.1039/c2ra00574c [DOI] [Google Scholar]
- 33. Cheng-Ting S., Yuan-Jen C., Bor-Tsung H., and Wu J., IEEE Trans. Nucl. Sci. 60, 2155 (2013). 10.1109/TNS.2013.2258038 [DOI] [Google Scholar]
- 34. Popa N. C., “ Microstructural properties: Texture and macrostress effects,” in Powder Diffraction, Theory and Practice, edited by Dinnebier R. E. and Billinge S. J. L. ( RSC Publishing, Cambridge, 2008). [Google Scholar]
- 35. Sastry S. S., Rao B. G. S., Mahalakshmi K. B., Mallika K., Rao C. N., and Tiong H. S., ISRN Condens. Matter Phys. 2012, 423650 (2012) 10.5402/2012/423650. [DOI] [Google Scholar]
- 36.I.W.E.D. Eigenvector Research, PLS_Toolbox 7.9, Eigenvector Research, Inc., Wenatchee, WA.
- 37. Bretschger O., Cheung A., Mansfeld F., and Nealson K., Electroanalysis 22, 883 (2010). 10.1002/elan.200800016 [DOI] [Google Scholar]
- 38. Hsu L., Masuda S., Nealson K., and Pirbazari M., RSC Adv. 2, 5844 (2012). 10.1039/C2RA20478A [DOI] [Google Scholar]
- 39. Higgins S., Lau C., Atanassov P., Minteer S., and Cooney M., ACS Catal. 1, 994 (2011). 10.1021/cs2003142 [DOI] [Google Scholar]
- 40. Khan M., Ista L., Lopez G., and Schuler A., Environ. Sci. Technol. 45, 1055 (2011). 10.1021/es101389u [DOI] [PubMed] [Google Scholar]
- 41. Okamoto A., Hashimoto K., Nealson K. H., and Nakamura R., Proc. Natl. Acad. Sci. U. S. A. 110, 7856 (2013). 10.1073/pnas.1220823110 [DOI] [PMC free article] [PubMed] [Google Scholar]
- 42. Cumpson P. J., Appl. Surf. Sci. 144–145, 16 (1999). 10.1016/S0169-4332(98)00752-1 [DOI] [Google Scholar]
- 43. Cumpson P. J. and Seah M. P., Surf. Interface Anal. 25, 430 (1997). [DOI] [Google Scholar]
- 44. Penn D. R., J. Electron Spectrosc. 9, 29 (1976). 10.1016/0368-2048(76)85004-9 [DOI] [Google Scholar]
- 45. Biebuyck H. A., Bain C. D., and Whitesides G. M., Langmuir 10, 1825 (1994). 10.1021/la00018a034 [DOI] [Google Scholar]
- 46. Holmlin R. E., Chen X., Chapman R. G., Takayama S., and Whitesides G. M., Langmuir 17, 2841 (2001). 10.1021/la0015258 [DOI] [PubMed] [Google Scholar]
- 47. Bain C. D., Troughton E. B., Tao Y. T., Evall J., Whitesides G. M., and Nuzzo R. G., J. Am. Chem. Soc. 111, 321 (1989). 10.1021/ja00183a049 [DOI] [Google Scholar]
- 48. Gunter P. L. J. and Niemantsverdriet J. W., Appl. Surf. Sci. 89, 69 (1995). 10.1016/0169-4332(95)00014-3 [DOI] [Google Scholar]
- 49. Pirbadian S. et al. , Proc. Natl. Acad. Sci. U. S. A. 111, 12883 (2014). 10.1073/pnas.1410551111 [DOI] [PMC free article] [PubMed] [Google Scholar]
- 50. Aureau D., Ozanam F., Allongue P., and Chazalviel J. N., Langmuir 24, 9440 (2008). 10.1021/la801219u [DOI] [PubMed] [Google Scholar]
- 51. Bain C. D. and Whitesides G. M., Langmuir 5, 1370 (1989). 10.1021/la00090a019 [DOI] [Google Scholar]
- 52. Carnazza S., Marletta G., Frasca M., Fortuna L., and Guglielmino S., J. Adhes. Sci. Technol. 25, 2255 (2011). 10.1163/016942411X574943 [DOI] [Google Scholar]
- 53. Dalton H., Stein J., and March P., Biofouling 15, 83 (2000). 10.1080/08927010009386300 [DOI] [PubMed] [Google Scholar]
- 54. Carnazza S., Satriano C., Guglielmino S., and Marletta G., J. Colloid Interface Sci. 289, 386 (2005). 10.1016/j.jcis.2005.03.089 [DOI] [PubMed] [Google Scholar]
- 55. Busscher H. J. and Van der Mei H. C., FEMS Microbiol. Lett. 128, 229 (1995). 10.1111/j.1574-6968.1995.tb07529.x [DOI] [PubMed] [Google Scholar]
- 56. Miller D. J. et al. , Water Res. 46, 3737 (2012). 10.1016/j.watres.2012.03.058 [DOI] [PubMed] [Google Scholar]
- 57. O'Toole G., Kaplan H. B., and Kolter R., Annu. Rev. Microbiol. 54, 49 (2000). 10.1146/annurev.micro.54.1.49 [DOI] [PubMed] [Google Scholar]
- 58. Callow J. A., Callow M. E., Ista L. K., Lopez G., and Chaudhury M. K., J. R. Soc. Interface 2, 319 (2005). 10.1098/rsif.2005.0041 [DOI] [PMC free article] [PubMed] [Google Scholar]
- 59. Barken K. B. et al. , Environ. Microbiol. 10, 2331 (2008). 10.1111/j.1462-2920.2008.01658.x [DOI] [PubMed] [Google Scholar]
- 60. Bos R., van der Mei H. C., Gold J., and Busscher H. J., FEMS Microbiol. Lett. 189, 311 (2000). 10.1111/j.1574-6968.2000.tb09249.x [DOI] [PubMed] [Google Scholar]
- 61. Hall-Stoodley L., Costerton W. J., and Stoodley P., Nat. Rev. Microbio. 2, 95 (2004) 10.1038/nrmicro821. [DOI] [PubMed] [Google Scholar]
- 62. Mukherjee J., Karunakaran E., and Biggs C. A., Biofouling 28, 1 (2012). 10.1080/08927014.2011.639067 [DOI] [PubMed] [Google Scholar]
- 63. Roy J. et al. , RSC Adv. 2, 10020 (2012). 10.1039/c2ra21727a [DOI] [Google Scholar]


