

Abstract
The thymus provides a unique microenvironment enabling development and selection of T lymphocytes. Medullary thymic epithelial cells (mTECs) play a pivotal role in this process by facilitating negative selection of self-reactive thymocytes and the generation of Foxp3+ regulatory T cells. Although studies highlighted the non-canonical NFκB pathway as the key regulator of mTEC development, comprehensive understanding of the molecular pathways regulating this process still remains incomplete. Here we demonstrate that the development of functionally competent mTECs is regulated by the histone deacetylase 3 (Hdac3). Although histone deacetylases are global transcriptional regulators this effect is highly specific only to Hdac3, as neither Hdac1 nor Hdac2 inactivation caused mTEC ablation. Interestingly, Hdac3 induces an mTEC-specific transcriptional program independently of the previously recognized RANK-NFκB signaling pathway. Thus, our findings uncover yet another layer of complexity of TEC lineage divergence and highlight Hdac3 as a major and specific molecular switch crucial for mTEC differentiation.
eTOC blurb
Goldfarb et al. show that Hdac3 is essential for normal development and function of medullary thymic epithelial cells (mTECs) independently of non-canonical NFκB signaling. Their findings highlight Hdac3 as a master switch inducing the mTEC transcriptional program in immature TECs.
Introduction
The thymus provides a specialized microenvironment for the development and selection of T lymphocytes, which can subsequently recognize and eliminate deleterious environmental pathogens, while tolerating harmless self-antigens. The T cell developmental program is driven mainly by two separate lineages of thymic epithelial cells (TECs), the cortical (cTEC) and the medullary (mTEC), which differ in their anatomical localization and their specific molecular, structural and functional characteristics (Rodewald, 2008).
Specifically, cTECs induce commitment of common lymphoid progenitors (CLP) to a T cell fate, and control their ensuing expansion and maturation via the expression of Notch ligands (Anderson and Takahama, 2012). cTECs also mediate the selection of double positive (DP) thymocytes carrying immuno-competent T cell receptors (TCRs), capable of recognizing MHC-bound peptide complexes (Klein et al., 2014). Subsequently, mTECs play a primary role in later stages of T cell development, including negative selection of self-reactive T cells and/or generation of thymic regulatory T cells (tTregs) (Aschenbrenner et al., 2007; Cowan et al., 2013). Crucial to the key role of mTECs in the screening of self-reactive T cells, is their unique capacity to promiscuously express and present almost all self-antigens, including thousands of tissue-restricted antigen (TRA) genes, such as insulin (Derbinski et al., 2001; Klein et al., 2014). A large fraction of this TRA repertoire is controlled by a single protein named the Autoimmune regulator (Aire) (Anderson et al., 2002). The physiological significance of the Aire-dependent “promiscuous” gene expression in the thymus is best illustrated by mice and/or humans with a dysfunctional Aire gene, which consequently develop a multi-organ autoimmune syndrome characterized by autoantibodies and immune infiltrates directed at multiple peripheral tissues (Anderson et al., 2002). Therefore, the Aire-/mTEC-mediated induction of central immune tolerance is absolutely essential for effective protection against devastating autoimmune disorders (Nagamine et al., 1997).
It is assumed that both mTECs and cTECs develop from common bi-potent thymic epithelial progenitors (TEPs) (Rossi et al., 2006), which remain incompletely characterized, particularly in the adult thymus (Ucar et al., 2014; Wong et al., 2014). However, more recent studies have also suggested the existence of mTEC lineage-specific progenitors/stem cells in both embryonic (Sekai et al., 2014) and adult thymus (Ohigashi et al., 2015). In either case, the development of both thymic epithelial lineages depends on various developmental cues, which are provided by other thymic populations, such as fibroblasts and developing thymocytes (Balciunaite et al., 2002; Bleul and Boehm, 2005; Parent et al., 2013). Some of these signals are required for the expression of Foxn1, the key transcription factor orchestrating thymus organogenesis and thymic epithelium development (Su et al., 2003). Although bi-potent TEPs are maintained in Foxn1-deficient mice (Bleul et al., 2006), Foxn1 is required for the initiation of transcriptional programs driving the differentiation of TEPs into cTEC or mTEC lineages (Bleul et al., 2006; Nowell et al., 2011). While the signals controlling the development of cTEC lineage remain elusive, the mTEC developmental program primarily depends on the non-canonical NFκB pathway, induced via several members of the TNF receptor family, including RANK, CD40 and LTβR (Akiyama et al., 2008; Boehm et al., 2003). Indeed, disruption of these receptors or their downstream signaling components, such as NIK, IKKa, RelB and TRAF6, results in the absence of mature mTECs and the development of organ-specific autoimmunity (Akiyama et al., 2005; Burkly et al., 1995; Kinoshita et al., 2006).
Although various studies provided very important insights into how mTECs regulate the induction of central immune tolerance, the exact transcriptional programs governing mTEC function and/or development beyond the involvement of the NFκB pathway, still remain largely elusive. As the class I histone deacetylases (i.e. HDACs -1, 2, 3 and 8) have been shown to play critical roles in shaping and controlling chromatin structure and gene expression programs, and thus determining the outputs of various biological processes (Reichert et al., 2012), we hypothesized that some of these enzymes might be critical for mTEC-mediated induction of immune tolerance. Indeed, here, we provide experimental evidence showing that Hdac3 is required for induction of the mTEC-specific transcriptional program and thereby for the subsequent development of functionally competent mTECs. Our study also demonstrates that among the key targets of Hdac3 in TECs are components of the Notch signaling pathway, which are activated during early stages of TEC development, but become repressed in mature mTECs. Our results highlight additional and previously unrecognized factors, which control commitment to the mTEC lineage and are required for the development of functional mTECs.
Results
1. Hdac3, but not Hdac1 or Hdac2, is essential for mTEC development
Histone deacetylases play a critical role in shaping and controlling chromatin structure and gene expression profiles, which subsequently determine the outputs of various biological processes. In this study we sought to delineate the physiological role of several members of the histone deacetylase family in the function and/or development of mTECs. First, we examined the expression pattern of different members of the HDAC family in different TEC populations, based on available RNA-Seq datasets (accession number GSE53111). Indeed, this analysis demonstrated that all three major TEC populations (i.e. mTEChi, mTEClo and cTECs) express relatively high mRNA levels of the three core members of the class-I histone deacetylase family (i.e. Hdac1, Hdac2 and Hdac3) (Suppl. Fig. 1A). Based on these data, we next inactivated the corresponding genes in the thymic epithelium by crossing Hdac1flox, Hdac2flox (Montgomery et al., 2007) or Hdac3flox (Montgomery et al., 2008) mice with Foxn1.Cre mice (Gordon et al., 2007). Following successful and efficient deletion of the aforementioned loci by Foxn1.Cre (Suppl. Fig. 1B) the resultant Hdac1fl/flFoxn1.Cre+, Hdac2fl/flFoxn1.Cre+, and Hdac3fl/flFoxn1.Cre+ conditional knockout (cKO) mice (hereinafter referred to as Hdac1-cKO, Hdac2-cKO and Hdac3-cKO, respectively, whereas their Cre− controls are hereinafter referred to as WT), were each analyzed for the impact of the deletion on thymic function and/or development.
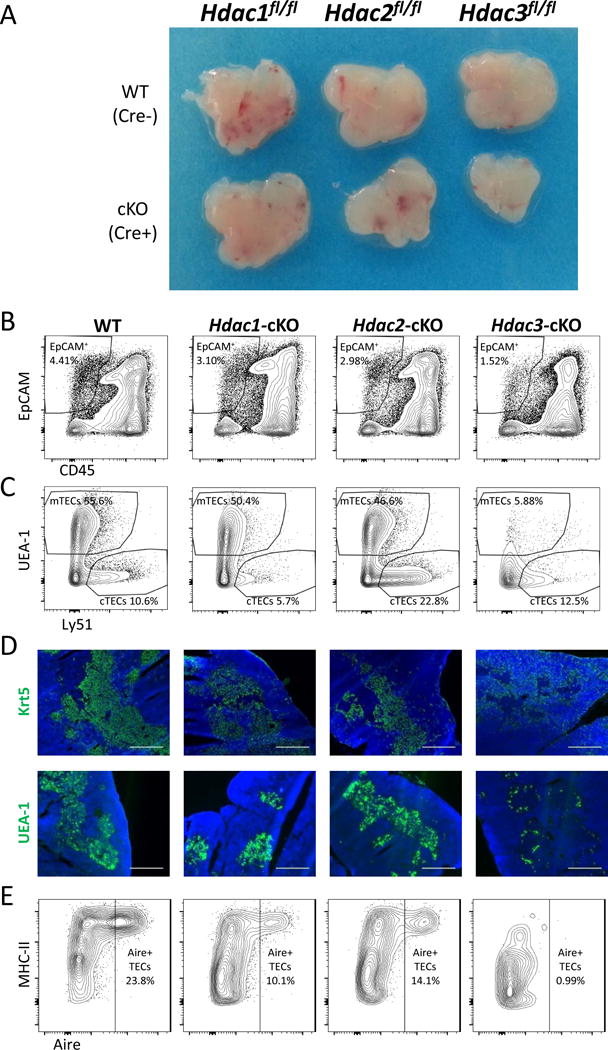
Interestingly, while the conditional inactivation of either Hdac1 or Hdac2 had a minor effect on thymic size and TEC cellularity (Fig. 1A, B, Suppl. Fig. 1C), inactivation of Hdac3 caused apparent thymic hypoplasia (Fig. 1A), with reduced frequencies and numbers of CD45−EpCAM+ cells (i.e. TECs) (Fig. 1B, Suppl. Fig. 1C). It is also worth mentioning that none of these mice displayed any obvious skin and/or hair phenotype (data not shown), which could have been linked to Foxn1-mediated deletion of the corresponding loci in keratinocytes and/or hair follicles. More detailed analysis of the thymic epithelial populations (using the two key lineage-specific markers, UEA1 and Ly51), revealed clear and significant diminution in the number and frequency of the mTEC compartment, but not of the cTEC compartment (Fig. 1C, Suppl. Fig. 1C). The expression of the TEC maturation markers - MHC-II and CD80 (which discriminate between the immature TEClo and the mature TEChi populations) was also significantly reduced in the Hdac3-cKO thymi (Suppl. Fig. 1D,E). The loss of mature mTECs in Hdac3-cKO mice was further highlighted by immunofluorescence microscopy of thymic sections stained with the medulla-specific markers Cytokeratin 5 (Krt5) or UEA-1. Both markers were most prominently detectable at cortico-medullary junctions, but absent in the medullary regions (Fig. 1D). In contrast, the expression of a cTEC-specific marker, β5t, displayed normal distribution in the thymic cortex (Suppl. Fig 1F). Notably, Aire+ cells were almost undetectable in the Hdac3-deficient thymic epithelium, in comparison to either WT or Hdac1- or Hdac2- deficient counterparts (Fig. 1E). Finally, staining of thymic populations with a viability dye validated that the observed loss of mTECs in Hdac3-cKO mice is not due to their enhanced cell death (Suppl. Fig. 1G).
Figure 1.
Hdac3, but not Hdac1 or Hdac2, is essential for mTEC development.
(a) Representative figure of thymi isolated from 6-week-old Foxn1.Cre+ Hdac1fl/fl, Hdac2 fl/fl, Hdac3 fl/fl (cKO) mice and their Foxn1.Cre− (WT) littermates. (b) Representative flow cytometric profiles of CD45 and EpCAM expression in thymic populations obtained from 6 week-old WT, Hdac1-cKO, Hdac2-cKO and Hdac3-cKO mice. (c) Representative flow cytometric profile showing frequencies of individual TEC populations from (b). The displayed cells were gated first on CD45− EpCAM+ cells (b) and then analyzed according to UEA-1 and Ly51 expression to depict medullary (mTEC) and cortical (cTEC) populations. (d) Representative staining of frozen thymic sections (scale bars represent 0.5mm) from WT, Hdac1-, Hdac2- and Hdac3-cKO mice. Cytokeratin-5 (Krt5) and UEA-1 staining (green) highlights medullary regions. DAPI staining (blue) highlights cell nuclei and is typically more intense in the cortex. (e) Representative flow cytometric profile showing Aire+ MHC-IIhi mTEC frequencies from 6-week-old WT, Hdac1-, Hdac2-and Hdac3-cKO mice. Cells were first gated on the CD45−EpCAM+ population and then analyzed for Aire and MHC-II expression.
See also Suppl. Fig. 1.
These results therefore suggest that Hdac3 plays an indispensable role in TEC development in general and in mTEC development in particular. Moreover, such a role seems to be exclusive for Hdac3, as deletion of either Hdac1 or Hdac2 resulted in only in minor changes in cTEC or mTEC compartments, respectively.
2. Hdac3-deficient residual mTECs have impaired expression of TRA genes and fail to induce immunological tolerance
Based on the above data, we next sought to further elucidate the functional role of Hdac3 in mTEC commitment, development and/or function, as well as to better delineate the molecular mechanisms underlying its mode of action.
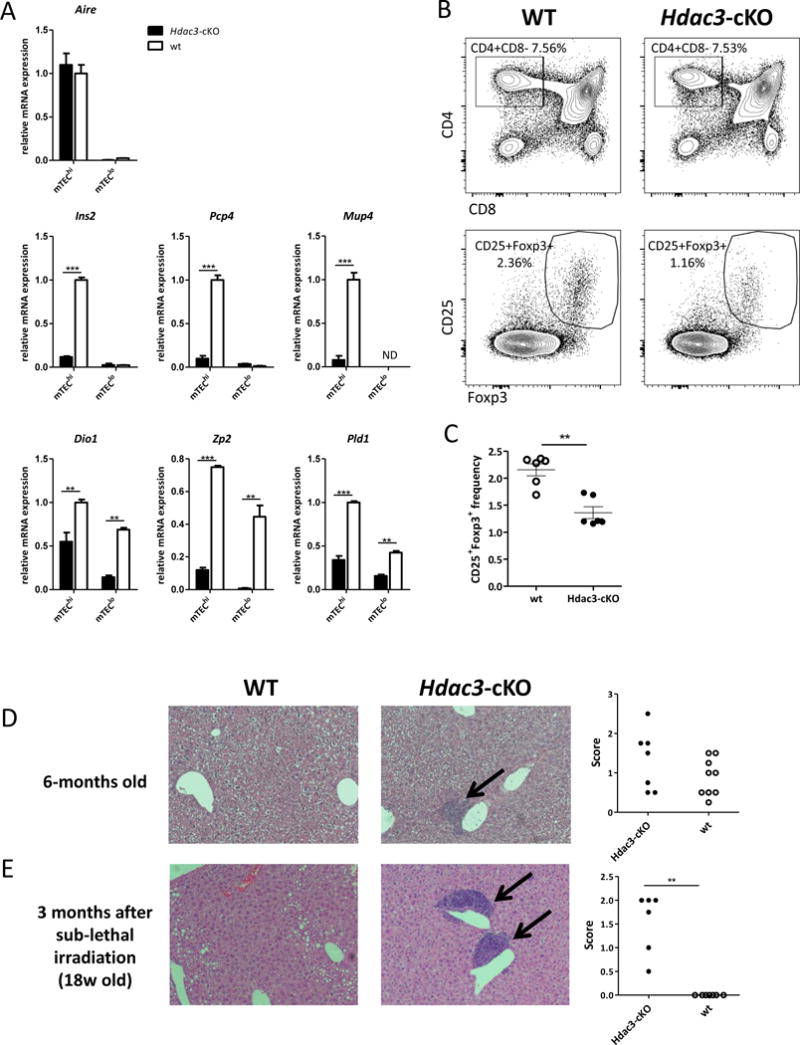
Although Foxn1-driven deletion of the Hdac3 locus demonstrated very high efficacy (Suppl. Fig. 1B), a small residual fraction of mTEChi cells still remained (Suppl. Fig 1D,E). Therefore, we next wondered whether these residual mTEChi cells are functional and sufficient to induce immunological tolerance. First, we analyzed whether these cells express Aire, as well as various Aire-dependent and –independent TRA genes. To this end, we sorted residual mTEChi and mTEClo cells from Hdac3-cKO mice and their WT littermates, and performed qPCR analysis. Interestingly, while Hdac3 deficiency did not impact on the expression of Aire itself in the residual mTEChi population (Fig. 2A), it dramatically impaired the expression of a panel of Aire-dependent TRA genes, including Ins2, Pcp4, Mup4, (Fig 2A). Expression of a number of Aire-independent tissue-restricted genes, such as Dio1, Pld1, Zp2 was also significantly reduced, suggesting that the residual mTEChi cells are dramatically impaired in their intrinsic capacity to promiscuously express tissue-restricted genes whether Aire-dependent or independent (Fig 2A).
Figure 2.
Hdac3-deficient residual mTECs have impaired expression of TRA genes and fail to induce immune tolerance
(a) Quantitative Real-Time PCR analysis assessing the gene expression of Aire, representative Aire-dependent genes (Ins2, Pcp4, Mup4) and representative Aire-independent genes (Dio1, Zp2, Pld1) in sorted mTEChi and mTEClo cells isolated from WT (white) or Hdac3-cKO mice (black); data were normalized to Hprt/Rpl32 mRNA levels and presented as percent of expression in WT mTEChi; Asterisks indicate significant differences (*p < 0.05, **p < 0.001 and ***p < 0.0001). (b) Representative flow cytometric profile showing frequencies of CD4/CD8 thymocytes (upper panel) and CD4+CD25+Foxp3+ tTreg cells (lower panel) obtained from 5-week-old WT and Hdac3-cKO thymi (c) Representative graph showing average frequencies + SEM of CD4+CD25+Foxp3+ tTreg cells isolated from WT (white) and Hdac3-cKO mice (black); Average values are calculated from three WT and three Hdac3-cKO animals, asterisks indicate significant differences (**p < 0.001). (d) Hematoxylin and eosin (H&E) staining of paraffin embedded sections of livers from age-matched (38-week-old) WT and Hdac3-cKO mice assessing immune cell infiltration. (e) H&E staining of paraffin embedded sections of livers from age-matched (18-week-old) WT and Hdac3-cKO mice harvested 3-months following sub-lethal irradiation (~300 rad). Graphs show relative scores of immune cell infiltration severity according to infiltrate size and frequencies. Asterisks indicate significant differences (**p < 0.001) calculated by Mann Whitney nonparametric test.
See also Suppl. Fig. 2.
Next, we analyzed the frequency of CD4+CD25+Foxp3+ tTregs in thymi isolated from Hdac3-cKO and WT animals. In line with previous reports demonstrating that mTECs are critical for generation of tTregs (Aschenbrenner et al., 2007; Cowan et al., 2013), we observed a ~50% reduction in the frequencies of tTregs in the Hdac3-cKO animals compared to their WT littermates (Fig. 2B, C). The frequencies of splenic Tregs were also significantly reduced in two out of three independent experiments (Suppl. Fig. 2A), suggesting a more variable and less severe phenotype, likely due to compensatory mechanisms in the periphery. Correspondingly no clear signs of splenomegaly/lymphadenopathy were observed.
Finally, to test whether the defective mTEC development, impaired TRA expression and reduced tTreg frequency in the Hdac3-cKO mice provoked a failure in central tolerance induction, we looked for signs of autoimmunity in aged (20–30 weeks) Hdac3-cKO mice compared to their WT littermates. It should be stressed, however, that our Hdac3 cKO mice were on a C57Bl/6 genetic background, which (unlike other genetic backgrounds) is known to be very resistant to autoimmunity caused by defective function of Aire and/or mTECs. Nevertheless, histological analysis of various organs isolated from these aged Hdac3-cKO animals revealed increased lymphocytic infiltration in the liver of cKO animals, in comparison to their WT controls (Fig. 2D; Suppl. Fig. 2B). Moreover, the liver infiltrates were strongly aggravated under lymphopenic conditions induced by sub-lethal irradiation (~300 rad) (Fig 2E). Interestingly, analysis of other organs, including salivary gland, pancreas, and intestine showed no apparent differences compared to their WT counterparts, suggesting that autoimmune hepatitis is the predominant form of autoimmunity in Hdac3-deficient mice on B6 background. These results are well in line with previous findings from an NFκB mutant (Traf6) demonstrating that mTEC deficiency caused by such inactivation is primarily linked to autoimmune hepatitis in B6 mice (Bonito et al., 2013).
3. Hdac3 operates independently of NFκB
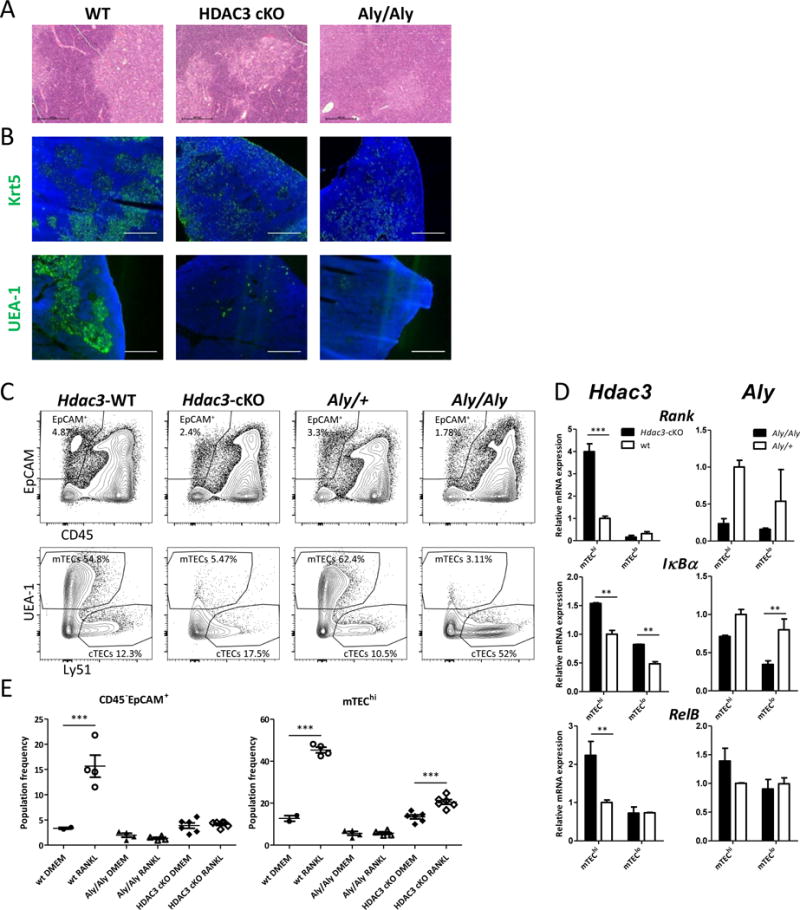
As mentioned above, the dramatic loss of the mTEC compartment and the subsequent autoimmune phenotype caused by the loss of Hdac3 expression in TECs was somewhat reminiscent of the phenotype caused by defects in the NFκB signaling pathway (Akiyama et al., 2005; Bonito et al., 2013; Burkly et al., 1995). Such similarity was, however, surprising, as Hdac3 was not previously reported to be an integral part of this pathway. Although a number of studies demonstrated that HDAC3 could de-acetylate RelA, such modification was shown to inhibit, rather than activate, NFκB signaling (Chen et al., 2001; Hoberg et al., 2006). Therefore, in order to better delineate the molecular mechanisms by which Hdac3 regulates mTEC development, we sought to further compare the phenotypes caused by the loss of function of either Hdac3 or non-canonical NFκB signaling in the thymic epithelium. To this end, we employed Alymphoplasia (Aly) mice, which carry a point mutation in the NFκB–inducing kinase (NIK) gene, and are characterized by impaired mTEC development (Miyawaki et al., 1994). First, we compared the overall thymic architecture of age-matched WT, Hdac3-cKO and Aly mice. Consistent with previous reports (Burkly et al., 1995), the analysis based on either hematoxylin and eosin (H&E) or staining of Krt5 or UEA-1 in thymic sections confirmed virtually complete loss of medullary regions in the Aly mice (Fig. 3A, B). In contrast, Hdac3-cKO thymic sections still contained distinct medullary regions, which were clearly highlighted by either H&E staining (Fig. 3A), or Krt5 or UEA-1 staining (Fig. 3B). Although these medullary regions were mostly devoid of any Krt5+ or UEA-1+ cells, representing mTECs, Krt5+ or UEA-1+ cells were found to be enriched at cortico-medullary junctions (Fig. 3B). Moreover, FACS analysis further underlined additional phenotypical differences between the NFκB- and the Hdac3-deficient TECs (Fig 3C, Suppl. Fig 3A, B). Specifically, while both strains showed significant loss of mTEC populations, only in the case of the NFκB deficiency this loss was partially compensated by a relative increase in the cTEC population, showing that in spite of resulting in a similarly reduced TEC compartment, the composition of the individual TEC populations was dramatically different.
Figure 3.
Hdac3 operates independently of NFκB
(a) Hematoxylin and eosin (H&E) staining of adult thymi from age-matched WT, Hdac3-cKO and Aly/Aly mice (scale bars represent 0.5mm). Dark regions represent cortical, while bright regions represent medullary compartments of the respective thymi. (b) Representative staining of frozen thymic sections (scale bars represent 0.5mm) from WT, Hdac3-cKO and Aly/Aly mice. Cytokeratin-5 (Krt5) and UEA-1 staining (green) highlights medullary regions. DAPI staining (blue) highlights cell nuclei and is typically more intense in the cortex. (c) Representative flow cytometric profiles of dispersed thymic epithelial cell populations from 6-week-old WT, Hdac3-cKO and Aly/Aly mice. Cells were first gated on CD45−EpCAM+ cells (upper panel) and were then gated according to Ly51 and UEA-1 expression (lower panel). Individual gates indicate cortical (cTECs) and medullary (mTECs) epithelial cells (d) Quantitative Real-Time PCR analysis assessing expression of a number of NFκB pathway related genes in sorted mTEChi and mTEClo cells isolated from WT (white) or Hdac3-cKO or Aly/Aly (both black) mice; data were normalized to Hprt mRNA levels and presented as percent of expression in WT mTEChi; Asterisks indicate significant differences (*p < 0.05, **p < 0.001 and ***p < 0.0001). (e) Graphs summarizing changes in flow cytometric profiles of TEC and mTEChi population frequencies in Fetal Thymic Organ Cultures (FTOCs) prepared from thymi isolated from E16.5-old WT, Hdac3-cKO and Aly/Aly embryos. The FTOCs were cultured for 7 days either in the absence (DMEM) or presence of soluble recombinant RANKL (1250ng/ml). Total TECs were first gated on CD45−EpCAM+ cells (Suppl. Fig. 3C upper panel) and mTEChi cells were then gated according to Ly51lo-mid and MHC-IIhi (IA-IE) expression (Suppl. Fig. 3C lower panels). Asterisks indicate significant differences (*p < 0.05 and ***p < 0.0001).
See also Suppl. Fig. 3.
In order to further examine whether Hdac3 regulates mTEC development via regulation of NFκB signals, we next analyzed expression levels of various NFκB targets/components (RANK, IκBα and RelB) in residual mTECs sorted from age-matched Hdac3-cKO, Aly and their WT littermates. Indeed, mTECs isolated from Hdac3-cKO and Aly mice exhibited different expression patterns of the analyzed genes (Fig 3D). Surprisingly, while the targets were generally reduced or unchanged in mTECs isolated from the Aly mice, they were markedly upregulated in the Hdac3-deficient mTECs. Therefore, these data suggested that Hdac3 controls mTEC development through a mechanism other than NFκB signaling.
The increased expression of NFκB targets and/or components in the residual Hdac3-deficient mTEChi population brought us to consider that these cells may have overcome their developmental defect in part due to enhanced NFκB signaling. To validate this hypothesis, we tested whether increased RANK signaling could potentially rescue the development of Hdac3-deficient mTECs. To this end, we established fetal thymic organ cultures (FTOCs) from Hdac3-cKO, Aly and WT embryonic (E16.5) thymi, and either stimulated them with soluble RANKL or left them untreated as controls (DMEM). Indeed, addition of RANKL resulted in significant increase in the frequency of Hdac3-deficient, but not of NFκB signaling-impaired, mTEChi cells, demonstrating that Hdac3 deficiency can, to some extent, be rescued by enhanced NFκB signaling (Fig 3E, Suppl. Fig. 3C). These data therefore suggest that Hdac3 is not an integral component of the RANK-NFκB signaling pathway, however the latter can partially compensate for the lack of Hdac3 during mTEC development.
4. Hdac3 regulates mTEC development independently of the Nuclear Corepressor complex
It is well established that Hdac3 regulates gene expression (and consequently biological responses) primarily through formation of multiprotein repressor complexes with nuclear receptor corepressor (N-CoR) and silencing mediator of retinoic and thyroid receptors (SMRT), which potentiate its enzymatic activity and help in recruiting it to its target loci (Karagianni and Wong, 2007). Therefore, we next sought to examine whether mTEC development also requires the activity of either Hdac3/N-CoR and/or Hdac3/SMRT complexes. To this end, we generated mouse mutants with Foxn1.Cre-driven conditional inactivation of either N-CoR or SMRT genes in the thymic epithelium (the resultant N-CoRΔIDfl/flFoxn1.Cre+ and SMRTfl/flFoxn1.Cre+ are hereinafter referred to as N-CoR-cKO and SMRT-cKO, respectively, whereas their N-CoRΔIDfl/flFoxn1.Cre− and SMRTfl/flFoxn1.Cre− littermates are hereinafter referred to as WT). Interestingly, while both genes were effectively inactivated in all thymic epithelial populations (Suppl. Fig. 4A), their loss of expression did not mimic the Hdac3-cKO phenotype, as the animals displayed normal thymus size, as well as normal TEC and mTEC frequencies (Suppl. Fig 4B). Since both N-CoR and SMRT can compensate for each other’s functional roles, we next inactivated both genes using Foxn1.Cre-mediated recombination. Surprisingly, double conditional knockout of N-CoR/SMRT (hereinafter referred to as N-CoR/SMRT-cKO) in the thymic epithelium displayed no apparent differences compared to their WT counterparts in thymic size, TEC/mTEC frequencies (Fig. 4A) or the capacity of mTECs to express both Aire-dependent and Aire-independent TRA genes (Fig. 4B). Additionally, no differences were seen in the expression of various NFκB components tested (Fig 4B). These data therefore indicated that the regulatory function of Hdac3 in TEC development does not require the formation of the N-CoR/SMRT repression complex.
Figure 4.
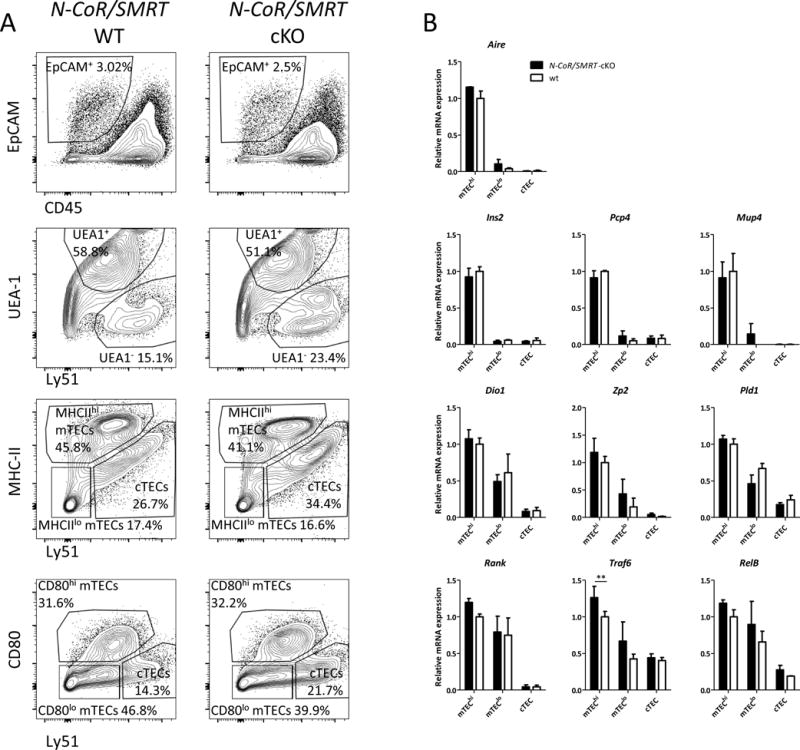
Hdac3 regulates mTEC development independently of the Nuclear Corepressor complex
(a) Representative flow cytometric profiles of dispersed thymic epithelial cell populations from 6-week-old WT and N-CoR/SMRT double cKO mice. Cells were first gated on CD45−EpCAM+ cells (top panel) and were then gated according to Ly51 against UEA-1, MHC-II (IA-IE) or CD80 expression (lower panels). Individual gates indicate cortical (cTECs) and medullary (mTECs) epithelial cells either high (mTEChi) or dim (mTEClo) for MHC-II and CD80 molecule expression or total mTECs (UEA1+). (b) Quantitative Real-Time PCR analysis assessing expression of Aire and a number of Aire-dependent and independent TRAs, and of NFκB pathway related genes in sorted mTEChi, mTEClo and cTEC cells isolated from WT (white) or N-CoR/SMRT double cKO mice (black); data were normalized to Hprt mRNA levels and presented as percent of expression in WT mTEChi; Asterisks indicate significant differences **p < 0.001).
See also Suppl. Fig. 4.
5. Hdac3 is a master regulator switch of the mTEC-specific transcriptional program
Since Hdac3 does not seem to work together with the NFκB pathway or as a part of its known co-repressor complex, we aimed to better understand the mechanism of action underlying its functional role in mTEC development. To this end, we performed Affymetrix gene expression profiling of Hdac3-deficient mTECs and compared them to their WT counterparts. Since Hdac3-cKO mice had insufficient numbers of mTEChi cells for such an analysis, we sorted the residual Hdac3-deficient mTEClo and the corresponding WT mTEClo populations. Strikingly, gene expression profiling of these cells revealed that HDAC3 upregulates the expression of over 1,500 genes (cut off: 2-fold), while it represses ~1,000 different genes (Fig. 5A). Thus, Hdac3 has a very broad and dramatic impact on the global gene expression profile of mTECs. Moreover, although it is generally considered a transcriptional repressor, in the mTEC context, Hdac3 is, in fact, capable of inducing expression of several hundred genes as well.
Figure 5.
Hdac3 is a master regulator switch of the mTEC-specific transcriptional program
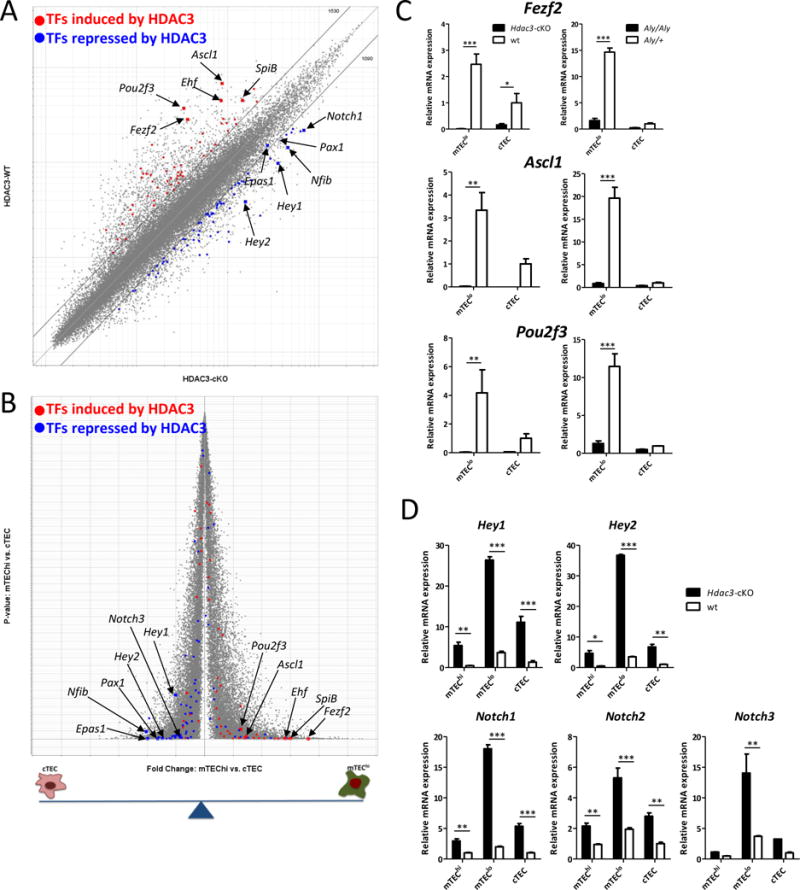
(a) A scatterplot of Affymetrix Mouse Gene 1-ST arrays comparing expression values in residual Hdac3-deficient (x-axis) and WT (y-axis) mTEClo cells. Grey diagonals indicate a 2-fold change cut-off. Highlighted are signatures of the top 50 transcription factors induced by HDAC3 (red) or the top 50 transcription factors repressed by HDAC3 (blue) in TECs. Arrows and gene symbols indicate some of the most Hdac3-dependent transcription factors. (b) A volcano plot of Affymetrix Mouse Gene 1-ST arrays comparing expression profiles of WT mTEChi and WT cTEC populations. Highlighted are signatures of the top 50 transcription factors induced by HDAC3 (red) or the top 50 transcription factors repressed by HDAC3 (blue) in TECs. Arrows and gene symbols indicate some of the most HDAC3-dependent transcription factors (c) Quantitative Real-Time PCR analysis assessing expression of a number of mTEC specific transcription factors genes in sorted mTEClo and cTEC cells isolated from WT (white) or Hdac3-cKO or Aly/Aly mice (both black); Asterisks indicate significant differences (*p < 0.05, **p < 0.001 and ***p < 0.0001). (d) Quantitative Real-Time PCR analysis assessing expression of a number of Notch pathway related genes in sorted mTEChi, mTEClo and cTEC cells isolated from WT (white) or Hdac3-cKO mice (black); data were normalized to Hprt mRNA levels and presented as percent of expression in WT cTEC; Asterisks indicate significant differences (*p < 0.05, **p < 0.001 and ***p < 0.0001).
See also Suppl. Fig. 5.
Next, to better understand which transcriptional programs are regulated by Hdac3 in mTECs, we sought to determine the transcription factor signature affected by Hdac3 deficiency. To this end, we highlighted the top 50 transcriptional regulators that are either induced or repressed by HDAC3 (Fig 5A; Suppl Table 1) and compared their expression between mTECs and cTECs. Interestingly, the vast majority of HDAC3-induced transcription factors (TFs) were mTEC-specific, while those that where repressed by HDAC3 were preferentially enriched in cTECs (Fig. 5B), suggesting that HDAC3 functions as a master regulator switch of the mTEC-specific transcriptional program. The top Hdac3-dependent mTEC-specific transcriptional regulators included factors such as Pou2f3, Ascl1, Fezf2, Ehf, and SpiB (Fig 5B; Suppl. Fig. 5A). Subsequent qPCR analysis validated that these transcription factors are indeed mTEC-specific and that their expression is abrogated in the absence of either Hdac3 or NFκB signaling (Fig. 5C).
The gene chip analysis also highlighted that in mTECs, HDAC3 represses numerous transcriptional regulators, such as Pax1, Nfib, Irf1 (which are relatively enriched in the cTEC compartment), as well as several members of the Notch signaling pathway (Fig 5B; Suppl. Fig. 5A; Suppl Table 1). Indeed, qPCR analysis confirmed dramatic upregulation of various Notch signaling components, such as Hey1, Hey2, Notch1, and more in the Hdac3-deficient mTECs (Fig 5D). Interestingly, the expression of these factors in mTECs remained largely unaffected by defective NFκB signaling (Aly mice) (Suppl. Fig 5B), further highlighting molecular differences between the role of Hdac3 and NFκB signaling in mTEC development.
Taken together, the above data demonstrated that Hdac3 functions as a master regulator switch that initiates the mTEC-specific transcriptional program, which is critical for mTEC lineage specification and subsequent development.
6. Hdac3-mediated repression of Notch signaling is critical for mTEC development
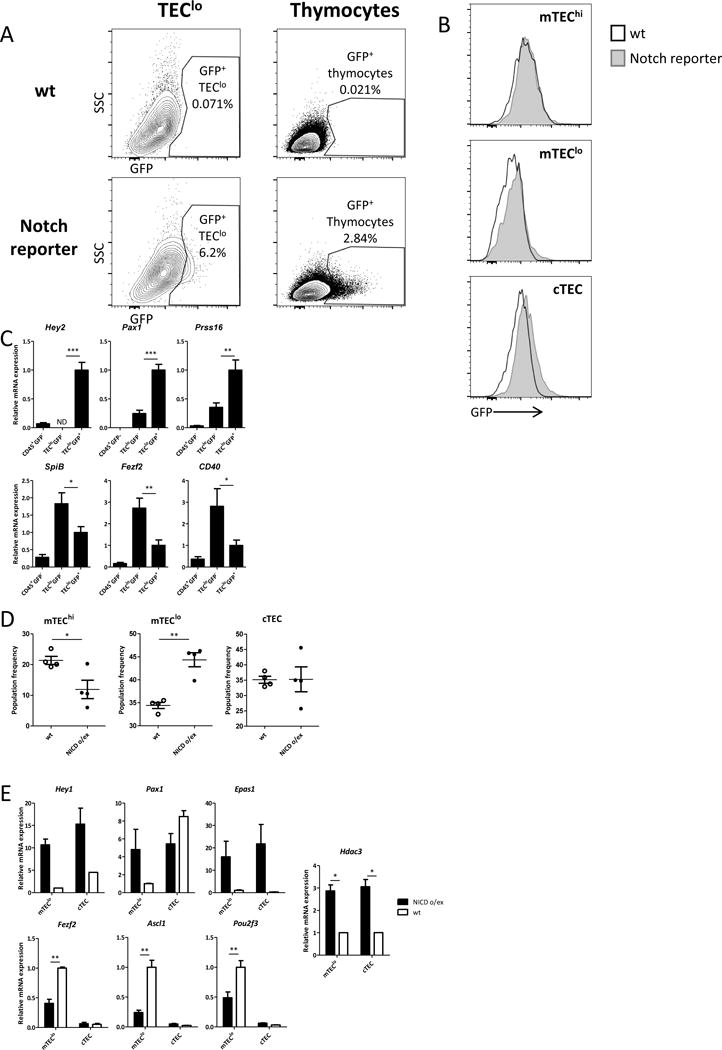
The above data suggested that Hdac3-mediated repression of Notch signals/targets may be one of the mechanisms by which Hdac3 controls the mTEC developmental program. Since Notch signaling has not been reported to be involved in TEC development, we first sought to validate whether bona-fide Notch activity is detectable in these cells. To test this, we utilized a well-established transgenic Notch reporter mouse model (Duncan et al., 2005), expressing an EGFP reporter under the control of 4 tandem copies of the RBPJ consensus binding site sequence upstream of the SV40 basal promoter. Expression of the EGFP reporter in these mice reflects the activation of the canonical Notch signaling pathway. Indeed, flow cytometric analysis validated the presence of a small Notch-EGFP+ TEC sub-population, which constituted ~6% of the entire TEClo (CD45−EpCAM+CD80lo) population (Fig 6A). As expected, the EGFP signal was undetectable in the mTEChi population, but was clearly evident in the cTEC and, to a smaller extent, also in the mTEClo populations. (Fig 6B). Correspondingly, the Notch/EGFP+ TECs expressed high levels of various cTEC (or early TEC) markers such as Pax1, Prss16 or Hey2. In contrast, the expression of mTEC-specific genes, such as Fezf2, SpiB or CD40 was significantly lower in the Notch/EGFP+ TECs (Fig. 6C). These results collectively suggested that the canonical Notch signaling pathway is active in a rare cTEC and/or early mTEC sub-population with some cTEC characteristics and becomes repressed by Hdac3, probably allowing mTEC progression to the mTEChi stage.
Figure 6.
Hdac3-mediated repression of Notch signaling is critical for mTEC development
(a) Representative flow cytometric profiles showing Notch/EGFP+ CD45− EpCAM+CD80lo TECs (left panel) and CD45+ EpCAM− thymocytes (right panel) in Notch/EGFP reporter mice, versus WT controls; (b) Histograms showing EGFP in specific TEC subpopulations gated according to Ly51 and CD80 markers; (c) Quantitative Real-Time PCR analysis assessing expression of a number of Hdac3 repressed genes (upper panel) or induced genes (lower panel) in sorted Notch/EGFP+ and Notch/EGFP− TEC populations isolated from Notch/EGFP reporter mice; data were normalized to Hprt mRNA levels and presented as percent of expression in Notch/EGFP+; Asterisks indicate significant differences (*p < 0.05, **p < 0.001 and ***p < 0.0001). (d) Graphs summarizing changes in flow cytometric profiles of thymic epithelial cell populations from 6-week-old Rosa.flox-STOP-flox–NICDFoxn1.Cre− (WT) and Rosa.flox-STOP-flox–NICDFoxn1.Cre+ (NICD o/ex). Cells were first gated on CD45−EpCAM+ cells and then were analyzed according to Ly51 and MHC-II (IA-IE) expression to depict cortical (cTECs) and medullary (mTECs) epithelial cells either high (mTEChi) or dim (mTEClo) for MHC-II molecule expression (Suppl. Fig. 6D); Asterisks indicate significant differences (*p < 0.05 and **p < 0.001). (e) Quantitative Real-Time PCR analysis assessing expression of a number of Hdac3 repressed genes (upper panel) or induced genes (lower panel) genes and of Hdac3 itself in sorted mTEClo and cTEC cells isolated from WT and NICD o/ex mice; data were normalized to Hprt mRNA levels and presented as percent of expression in WT mTEClo. Asterisks indicate significant differences (**p < 0.001).
See also Suppl. Fig. 6.
To further validate this hypothesis, we next explored the impact of Notch over-activation on the TEC/mTEC developmental program in transgenic mice expressing a constitutively active form of Notch1 in their thymic epithelium, which we generated by crossing Foxn1.Cre mice with Rosa26stop-NICD transgenic mice (Murtaugh et al., 2003). Strikingly, the Foxn1-driven overexpression of Notch1 in TECs resulted in apparent thymic dysplasia, characterized by cyst formation, as well as in a clear skin phenotype in young animals (Suppl Fig. 6A, B). Furthermore, flow cytometric analysis revealed dramatic changes in the TEC compartment, characterized by a dramatic decrease in overall TEC and mTEC cellularity (Suppl. Fig. 6C), as well as by impairment of mTEC maturation (Fig 6D; Suppl. Fig. 6D). Specifically, residual mTECs displayed low expression of both maturation markers - MHC-II (Fig 6D) and CD80 (Suppl. Fig. 6D). An accompanying impairment in thymocyte development was also apparent (Suppl. Fig. 6E). Moreover, despite the apparent differences between Hdac3-cKO and Notch over-activation, qPCR analysis demonstrated that Notch over-activation in TECs enhanced expression of several transcription factors (e.g. Hey1, Pax1, EPAS1), which were found to be negatively regulated by Hdac3. In contrast, this over-activation repressed various factors (Ascl1, Fezf2, Pou2f3) (Fig. 6E), which were positively regulated by Hdac3 (Fig 5). Interestingly, Notch over-activation potentiated expression of Hdac3 itself (Fig 6E), suggesting that both genes are mutually regulated via a negative feedback loop mechanism.
Collectively, the above data suggest that Hdac3-mediated repression of Notch in TECs is required for efficient TEC/mTEC development, as Foxn1-mediated over-expression of Notch1 dramatically impairs such developmental program.
Discussion
Our results demonstrate that specific inactivation of Hdac3, but not of Hdac1 or Hdac2, in the thymic epithelium dramatically impairs mTEC, but not cTEC developmental programs. These data, along with our recent study identifying a pivotal role for the protein deacetylase sirtuin1 (Sirt1) in Aire-dependent promiscuous gene expression (Chuprin et al., 2015), highlight the unique and non-redundant roles of varying protein deacetylases in discrete stages of central tolerance establishment.
Although the Hdac3-linked phenotype is very reminiscent of the manifestations caused by defects in the non-canonical NFκB pathway (Akiyama et al., 2005; Burkly et al., 1995), a number of clear differences exist between the two. Notably, while the loss of NFκB signals in TECs results in virtually complete failure of medulla formation (demonstrated by H&E, Krt5 and UEA-1 staining), the loss of Hdac3 results only in a partial defect, characterized by the presence of cortico-medullary junctions demarcating visible medullary regions, which are, however, devoid of mature Krt5+, UEA-1+ mTECs. Although both Aly and Hdac3-cKO mice show significant reduction in the frequencies of EpCAM+ cells, inactivation of NFκB causes a more severe reduction in residual mTECs, and a more pronounced (relative) increase in the cTEC compartment, compared to Hdac3 inactivation. More importantly, however, the residual Hdac3- and NFκB-deficient mTECs are characterized by distinct gene expression profiles. For instance, expression of several NFκB targets (e.g. Rank, IκBα, etc.) is, as expected, reduced in the NFκB mutants, but increased in the Hdac3 mutants, suggesting a possible compensatory mechanism. Similarly, the expression of several Notch targets (Hey1, Hey2, Notch1, etc.) is significantly upregulated in the absence of Hdac3, but unchanged by the loss of NFκB signaling. Finally, development of Hdac3-deficient (but not of NFκB-deficient) mTEChi cells could be partially rescued by activation of RANK signaling, further highlighting the apparent disparity between the two mechanisms. We therefore propose that Hdac3 controls mTEC development via a parallel mechanism, through induction of mTEC specific transcription factors and repression of cTEC specific transcription factors, and that it operates in concert with NFκB signaling (Fig. 7).
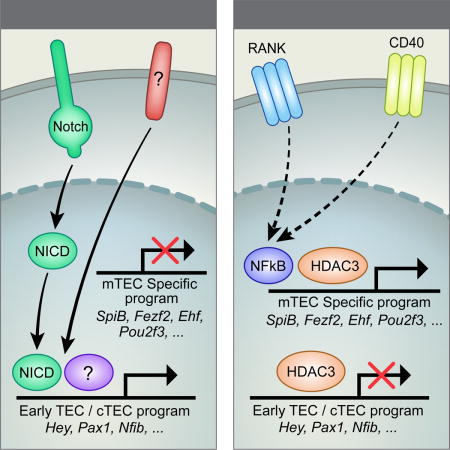
Figure 7.
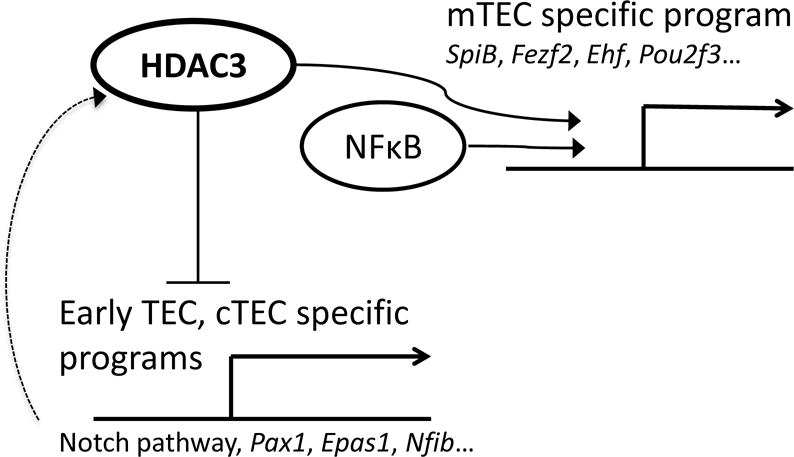
Putative model illustrating the interplay between RANK/NFκB-dependent and Hdac3-dependent control of mTEC development. Hdac3 and NFκB together are necessary for induction of the mTEC-specific transcriptional program; however, Hdac3 is also needed for the repression of the early TEC and cTEC programs, including the Notch signaling pathway. Upregulation of Hdac3 by the Notch pathway serves as a negative feedback loop likely controlling the duration and the intensity of Notch signaling in TEC progenitors.
Given that several previous studies suggested that Hdac3 is a repressor of NFκB (Chen et al., 2001; Hoberg et al., 2006), the above results may seem somewhat contra-intuitive, as loss of Hdac3 would be expected to potentiate, rather than impair mTEC development. It should, however, be stressed that such a “simplistic” model has been challenged by several recent reports, demonstrating that Hdac3 can operate in concert with NFκB and potentiate, rather than repress NFκB-dependent responses in-vivo. Specifically, Chen et al demonstrated that Hdac3 is essential for LPS/NFκB-mediated activation of macrophages and dendritic cells, and that a conditional knockout of Hdac3 in these cells impairs the LPS/NFκB-induced inflammatory gene expression program (Chen et al., 2012). Similarly, Hdac3 was found to be critical for NFκB-induced gene expression in IL-1-stimulated cells (Ziesché et al., 2013). Moreover, Hdac3 was shown to play a critical role in RANKL/NFκB-mediated osteoclast differentiation (Pham et al., 2011). Therefore, our results, together with the above reports, clearly indicate that the interplay between Hdac3 and NFκB is far more complex than previously assumed, and propose that both factors control mTEC development via autonomous, but parallel mechanisms operating in concert (Fig. 7).
Although Hdac3 typically operates by binding to the N-CoR/SMRT repression complexes, which potentiate its enzymatic activity and help in recruiting it to its target loci (Karagianni and Wong, 2007), our data demonstrated that the expression of N-CoR/SMRT is completely dispensable for the critical role of Hdac3 in controlling the mTEC developmental program. These rather unexpected findings suggest that Hdac3 biological activities are not exclusively mediated through the action of N-CoR/SMRT and that alternative, perhaps deacetylase-independent mechanisms may exist. Interestingly, the notion of deacetylase-independence of HDACs in general is exemplified by class IIa HDACs, which are known psuedoenzymes lacking enzymatic activity (Lahm et al., 2007), and previous studies have delineated deacetylase-independent roles for class I HDACs, including Hdac3 (Lewandowski et al., 2015; You et al., 2013). Specifically, mice mutated in both N-CoR1 and SMRT deacetylation binding domains, which lack the functional capability of activating the catalytic activity of Hadc3, survive into adulthood and therefore do not phenocopy the embryonic lethal Hdac3 knockouts (You et al., 2013). This indicates that in addition to its enzymatic activity, Hdac3 has also an important deacetylase-independent role. Therefore, our data suggest that, in mTECs, Hdac3 activity is N-CoR1/SMRT-ndependent (and possibly also deacetylase-independent) and that it may require a yet unidentified co-factor to exert its biological activity.
The gene expression profiling of Hdac3-deficient mTECs highlighted that in mTECs, Hdac3 operates as a very potent transcriptional activator, capable of inducing the expression of hundreds of different genes. Importantly, closer analysis revealed that Hdac3 primarily activates mTEC-specific genes and transcriptional regulators, suggesting that Hdac3 operates as a master regulator switch, turning on an mTEC specific transcriptional program, critical for mTEC lineage specification and subsequent developmental progression. Interestingly, several of these mTEC-specific Hdac3-induced transcription factors, including Fezf2, SpiB and Irf7 have recently been shown to influence mTEC development/maturation and/or cellularity (Akiyama et al., 2014; Otero et al., 2013; Takaba et al., 2015), thus, likely contributing to the Hdac3 phenotype described herein.
Hdac3 was also found to repress hundreds of genes in mTECs, including several members of the Notch signaling pathway among the most affected targets. This result was rather surprising, as Notch signaling was not previously implicated in the regulation of TEC development and/or function, and, in the thymic context, was almost exclusively studied in developing thymocytes (Tanigaki and Honjo, 2007), where it was shown to be negatively regulated by the Hdac3/NKAP repression complex (Pajerowski et al., 2009). Importantly, our data demonstrated that Notch activity is also clearly evident in a rare TEC population that bears features of an early TEC/cTEC population, characterized by high expression of Hey2, Pax1, Prss16 and low expression of mTEC-specific factors, e.g. Fezf2, SpiB and CD40, and differentiation markers such as MHC-II. Notch activity is almost completely diminished in the mTEChi population, suggesting that Hdac3-mediated repression of Notch is critical for accurate control of the mTEC developmental program. This notion is further supported by our experimental data showing that TEC-specific over-activation of Notch1 in-vivo inhibits the mTEC-specific transcriptional program and leads to dramatically reduced numbers of mTEChi cells and increased numbers of MHC-IIlo TECs. Although Notch1 over-expression in TECs shares certain similarities with TEC-specific inactivation of Hdac3 (e.g. significant decrease in mTEChi numbers/frequencies or similar impact on the expression of certain mTEC- or cTEC-specific genes), it is important to stress that they are far from being a phenocopy of each other (as illustrated by clear differences in their respective thymus morphologies). Such results are, however, not surprising. First, it is expected that permanent over-expression of Notch1 in the entire TEC compartment will have a more severe phenotype than increased Notch activity due to the loss of Hdac3, which is restricted only to a specific TEC subpopulation in a specific time point of development. Moreover, the action of Hdac3 is likely to be more complex, as suggested by its critical role in positively regulating expression of several known mTEC-specific transcription factors which are required for proper mTEC development, such as Fezf2, SpiB and Irf7 (Akiyama et al., 2014; Otero et al., 2013; Takaba et al., 2015). Thus, the critical role of Hdac3 in mTEC development seems to involve activation of an mTEC-specific transcriptional program along with parallel repression of cTEC- or progenitor-specific transcriptional programs (Fig. 7).
Both mTECs and cTECs originate from bi-potent epithelial progenitors (TEPs) present within the embryonic and post-natal thymus. However, the precise developmental window at which cTECs and mTECs diverge remains poorly characterized. Two putative models have been proposed to explain the development of the cTEC and mTEC lineages from the uncommitted TEPs. Specifically, according to the first “synchronous” model, uncommitted TEPs diverge simultaneously to lineage-restricted cortical (cTEPs) and medullary (mTEPs) progenitors, which then progress into mature cTECs and mTECs (Alves et al., 2014). Several recent studies, however, challenged this model, as they demonstrated that cells characterized by typical cTEC markers (e.g. β5t, CD205) comprise a source of progenitors that can give rise to both cortical as well as Aire-expressing medullary epithelial microenvironments in mouse models (Alves et al., 2014). Based on these findings, an alternative “serial progression” model has been proposed, in which TEPs transverse through a “transitional” TEC progenitor stage characterized by several phenotypic and molecular traits associated with cTECs. Based on the environmental cues, these “cTEC-like” progenitors can either progress “by default” to mature cTECs or acquire an mTEC fate in response to outside stimuli. Indeed, recent data suggest that the majority of mature mTECs in the adult thymus arise from embryonic or neonatal β5t+ mTEC-lineage-restricted progenitors (Ohigashi et al., 2015), which seem to be also characterized by relatively high expression of SSEA1 and Cld3,4 (Sekai et al., 2014). Taken together, our findings, described herein, uncover yet another layer of complexity of TEC lineage divergence, commitment and differentiation. These findings highlight a unique interplay between the NFκB- and Hdac3-dependent transcription regulatory activities, and identify Hdac3 as a major molecular switch crucial for mTEC differentiation.
Methods
Mice
All mice were maintained under specific-pathogen-free conditions at the Weizmann Institute’s (WIS) animal facility and were handled in accordance to the guidelines of the Institutional Animal Care and Use Committee (#01360311-1). Hdac1-, Hdac2-and Hdac3-floxed mice were kindly provided by Prof. Eric Olson (UT Southwestern); B6.Foxn1.Cre mice were obtained from Dr. Daniel Graf (University of Zurich) with the kind consent of Prof. Nancy Manley (University of Georgia), Aly/Aly mice were obtained from the FGMA repository (WIS); Notch/EGFP reporter mice (#018322) and RosaNotch mice (#008159) were purchased from Jackson Laboratories. N-CoR-flox and SMRT-flox mice were generated and described previously (Astapova et al., 2008; Shimizu et al., 2015). Excision of the floxed N-CoR locus leads to expression of a hypomorphic N-CoRΔID variant, lacking the key nuclear receptor interacting domains.
Antibodies and reagents
The complete list of antibodies and reagents used in this study is provided in the Supplementary section.
Flow cytometry and sorting
A detailed protocol is provided in the Supplementary section. Briefly, thymi were disintegrated by Collagenase D and Dispase cocktail to obtain single cell suspension, TECs were enriched on a Percoll gradient. Following staining, cells were analyzed either on the BD FACS Canto II analyzer or sorted in BD FACS Aria III cell sorter.
Immunofluorescence microscopy
Thymi were embedded in OCT compound (Tissue-Tek, Sakura) and frozen on dry ice. Cryostat sections (10μm) were fixed with ice-cold acetone for 10 mins and incubated with primary antibody for 60 mins at RT. Sections were washed 3 times with PBS and incubated with secondary antibody for 60 mins at RT. DAPI staining was performed following secondary staining for 10 mins at RT and followed by 3 washes with PBS. All antibodies were diluted in 0.5% BSA in PBS according to manufacturer’s recommendations. Color images were taken on a fluorescence Nikon Eclipse TI-S microscope.
Real-Time PCR analysis
A detailed protocol, including specific primers is provided in the Supplementary section. Briefly, total RNA was extracted from sorted cells using Trizol reagent and used for cDNA synthesis using Reverse-Transcription kit and random primers. The subsequent qPCR analysis was performed using the Fast SYBR Green Master Mix or TaqMan Fast advanced master mix (Life technologies). Differential expression was calculated according to the ΔΔCT method and statistically evaluated using StatView software (SAS Institute Inc.).
Histology and histopathology
Organs were harvested from mice of the specified strain, age and sex. All organs were fixed in 4% PFA (for at least 2 days), washed in 70% ethanol and embedded in paraffin. Organs were sectioned and stained for H&E by the histology lab at WIS. Histopathology, including analysis and scoring of immune infiltrates in various peripheral tissues, was performed under supervision of a certified animal pathologist (as described in detail in Suppl.info).
Fetal Thymic Organ Cultures (FTOCs)
Thymic lobes were isolated from embryos at E16.5 day of gestation and placed at the air-medium interface on top of a 0.8μm Isopore membrane filter (Millipore). The thymi-supporting filters were then placed on an Artiwrap gelatin sponge, submerged in Dulbecco’s modified Eagle’s Medium (DMEM) with 4.5g/L glucose, L-Glutamate (Life Technologies, Gibco), 10% fetal bovine serum (FBS, Invitrogen), Pen/Strep antibiotics and non-essential amino acids. The cultures were incubated in 5% CO2 at 37°C in the presence or absence of RANKL (1250ng/ml). After 8 days, cultures were analyzed by flow cytometry as described above.
Gene expression profiling
Residual MHC-II low mTECs were isolated from Hdac3-cKO or WT mice using a BD FACS Aria III cell sorter as detailed above. Total RNA was extracted from ~30,000 pooled sorted cells using Trizol. Purified total RNA was then amplified using the MessageAmp RNA kit (Ambion). Biotinylated cRNA was then hybridized to Affymetrix Mouse Gene 1-ST arrays by the WIS genomics core. Raw data were processed with the RMA algorithm for probe-level normalization and analyzed using GenePattern software.
Data is available at the GEO database (accession code GSE78283)
Supplementary Material
Highlights.
Hdac3 uniquely regulates mTEC development independently of NFκB or the NCoR complex
Hdac3 induces the mTEC transcriptional program while repressing that of cTECs
Repression of Notch signaling by Hdac3 is crucial for mTEC development
Acknowledgments
This work was supported by grants from the Binational Science Foundation (BSF-2013139 to JA and AH); the Maurice and Vivienne Wohl Charitable Foundation; the Israel Science Foundation (1825/10), the Sy Syms Foundation; the Minerva Foundation; the Abisch-Frenkel Foundation; the FP7 - Marie Curie International Reintegration Grant (276751) and by the Dr. Celia Zwillenberg-Fridman and Dr. Lutz Fridman Career Development Chair (to JA); and by the Helmholtz DKFZ-WIS PhD fellowship program (to NK).
Footnotes
Publisher's Disclaimer: This is a PDF file of an unedited manuscript that has been accepted for publication. As a service to our customers we are providing this early version of the manuscript. The manuscript will undergo copyediting, typesetting, and review of the resulting proof before it is published in its final citable form. Please note that during the production process errors may be discovered which could affect the content, and all legal disclaimers that apply to the journal pertain.
Contributions: JA, YG and NK designed the study and wrote the manuscript; YG and NK performed the experiments; BL, AS, YH, AH and JA helped in designing and/or performing and/or analyzing some of the experiments.
References
- Akiyama N, Shinzawa M, Miyauchi M, Yanai H, Tateishi R, Shimo Y, Ohshima D, Matsuo K, Sasaki I, Hoshino K, Wu G, Yagi S, Inoue JI, Kaisho T, Akiyama T. Limitation of immune tolerance-inducing thymic epithelial cell development by Spi-B-mediated negative feedback regulation. J Exp Med. 2014;211:2425–38. doi: 10.1084/jem.20141207. [DOI] [PMC free article] [PubMed] [Google Scholar]
- Akiyama T, Maeda S, Yamane S, Ogino K, Kasai M, Kajiura F, Matsumoto M, Inoue J. Dependence of self-tolerance on TRAF6-directed development of thymic stroma. Science. 2005;308:248–51. doi: 10.1126/science.1105677. [DOI] [PubMed] [Google Scholar]
- Akiyama T, Shimo Y, Yanai H, Qin J, Ohshima D, Maruyama Y, Asaumi Y, Kitazawa J, Takayanagi H, Penninger JM, Matsumoto M, Nitta T, Takahama Y, Inoue JI. The tumor necrosis factor family receptors RANK and CD40 cooperatively establish the thymic medullary microenvironment and self-tolerance. Immunity. 2008;29:423–37. doi: 10.1016/j.immuni.2008.06.015. [DOI] [PubMed] [Google Scholar]
- Alves NL, Takahama Y, Ohigashi I, Ribeiro AR, Baik S, Anderson G, Jenkinson WE. Serial progression of cortical and medullary thymic epithelial microenvironments. Eur J Immunol. 2014;44:16–22. doi: 10.1002/eji.201344110. [DOI] [PMC free article] [PubMed] [Google Scholar]
- Anderson G, Takahama Y. Thymic epithelial cells: working class heroes for T cell development and repertoire selection. Trends Immunol. 2012;33:256–63. doi: 10.1016/j.it.2012.03.005. [DOI] [PubMed] [Google Scholar]
- Anderson MS, Venanzi ES, Klein L, Chen Z, Berzins SP, Turley SJ, von Boehmer H, Bronson R, Dierich A, Benoist C, Mathis D. Projection of an immunological self shadow within the thymus by the aire protein. Science. 2002;298:1395–401. doi: 10.1126/science.1075958. [DOI] [PubMed] [Google Scholar]
- Aschenbrenner K, D’Cruz LM, Vollmann EH, Hinterberger M, Emmerich J, Swee LK, Rolink A, Klein L. Selection of Foxp3+ regulatory T cells specific for self antigen expressed and presented by Aire+ medullary thymic epithelial cells. Nat Immunol. 2007;8:351–8. doi: 10.1038/ni1444. [DOI] [PubMed] [Google Scholar]
- Astapova I, Lee LJ, Morales C, Tauber S, Bilban M, Hollenberg AN. The nuclear corepressor, NCoR, regulates thyroid hormone action in vivo. Proc Natl Acad Sci. 2008;105:19544–19549. doi: 10.1073/pnas.0804604105. [DOI] [PMC free article] [PubMed] [Google Scholar]
- Balciunaite G, Keller MP, Balciunaite E, Piali L, Zuklys S, Mathieu YD, Gill J, Boyd R, Sussman DJ, Holländer GA. Wnt glycoproteins regulate the expression of FoxN1, the gene defective in nude mice. Nat Immunol. 2002;3:1102–8. doi: 10.1038/ni850. [DOI] [PubMed] [Google Scholar]
- Bleul CC, Boehm T. BMP signaling is required for normal thymus development. J Immunol. 2005;175:5213–21. doi: 10.4049/jimmunol.175.8.5213. [DOI] [PubMed] [Google Scholar]
- Bleul CC, Corbeaux T, Reuter A, Fisch P, Mönting JS, Boehm T. Formation of a functional thymus initiated by a postnatal epithelial progenitor cell. Nature. 2006;441:992–6. doi: 10.1038/nature04850. [DOI] [PubMed] [Google Scholar]
- Boehm T, Scheu S, Pfeffer K, Bleul CC. Thymic medullary epithelial cell differentiation, thymocyte emigration, and the control of autoimmunity require lympho-epithelial cross talk via LTbetaR. J Exp Med. 2003;198:757–69. doi: 10.1084/jem.20030794. [DOI] [PMC free article] [PubMed] [Google Scholar]
- Bonito AJ, Aloman C, Fiel MI, Danzl NM, Cha S, Weinstein EG, Jeong S, Choi Y, Walsh MC, Alexandropoulos K. Medullary thymic epithelial cell depletion leads to autoimmune hepatitis. 2013;123 doi: 10.1172/JCI65414DS1. [DOI] [PMC free article] [PubMed] [Google Scholar]
- Burkly L, Hession C, Ogata L, Reilly C, Marconi LA, Olson D, Tizard R, Cate R, Lo D. Expression of relB is required for the development of thymic medulla and dendritic cells. Nature. 1995 doi: 10.1038/373531a0. [DOI] [PubMed] [Google Scholar]
- Chen LF, Fischle W, Verdin E, Greene WC. Duration of nuclear NF-kappa B action regulated by reversible acetylation. Science (80-) 2001;293:1653–1657. doi: 10.1126/science.1062374. [DOI] [PubMed] [Google Scholar]
- Chen X, Barozzi I, Termanini A, Prosperini E, Recchiuti A, Dalli J, Mietton F, Matteoli G, Hiebert S, Natoli G. Requirement for the histone deacetylase Hdac3 for the inflammatory gene expression program in macrophages. Proc Natl Acad Sci U S A. 2012;109:E2865–74. doi: 10.1073/pnas.1121131109. [DOI] [PMC free article] [PubMed] [Google Scholar]
- Chuprin A, Avin A, Goldfarb Y, Herzig Y, Levi B, Jacob A, Sela A, Katz S, Grossman M, Guyon C, Rathaus M, Cohen HY, Sagi I, Giraud M, McBurney MW, Husebye ES, Abramson J. The deacetylase Sirt1 is an essential regulator of Aire-mediated induction of central immunological tolerance. Nat Immunol. 2015;16:737–45. doi: 10.1038/ni.3194. [DOI] [PubMed] [Google Scholar]
- Cowan JE, Parnell SM, Nakamura K, Caamano JH, Lane PJL, Jenkinson EJ, Jenkinson WE, Anderson G. The thymic medulla is required for Foxp3+ regulatory but not conventional CD4+ thymocyte development. J Exp Med. 2013;210:675–81. doi: 10.1084/jem.20122070. [DOI] [PMC free article] [PubMed] [Google Scholar]
- Derbinski J, Schulte A, Kyewski B, Klein L. Promiscuous gene expression in medullary thymic epithelial cells mirrors the peripheral self. Nat Immunol. 2001;2:1032–9. doi: 10.1038/ni723. [DOI] [PubMed] [Google Scholar]
- Duncan AW, Rattis FM, DiMascio LN, Congdon KL, Pazianos G, Zhao C, Yoon K, Cook JM, Willert K, Gaiano N, Reya T. Integration of Notch and Wnt signaling in hematopoietic stem cell maintenance. Nat Immunol. 2005;6:314–22. doi: 10.1038/ni1164. [DOI] [PubMed] [Google Scholar]
- Gordon J, Xiao S, Hughes B, Su D, Navarre SP, Condie BG, Manley NR. Specific expression of lacZ and cre recombinase in fetal thymic epithelial cells by multiplex gene targeting at the Foxn1 locus. BMC Dev Biol. 2007;7:69. doi: 10.1186/1471-213X-7-69. [DOI] [PMC free article] [PubMed] [Google Scholar]
- Hoberg JE, Popko AE, Ramsey CS, Mayo MW. IkappaB kinase alpha-mediated derepression of SMRT potentiates acetylation of RelA/p65 by p300. Mol Cell Biol. 2006;26:457–71. doi: 10.1128/MCB.26.2.457-471.2006. [DOI] [PMC free article] [PubMed] [Google Scholar]
- Karagianni P, Wong J. HDAC3: taking the SMRT-N-CoRrect road to repression. Oncogene. 2007;26:5439–49. doi: 10.1038/sj.onc.1210612. [DOI] [PubMed] [Google Scholar]
- Kinoshita D, Hirota F, Kaisho T, Kasai M, Izumi K, Bando Y, Mouri Y, Matsushima A, Niki S, Han H, Oshikawa K, Kuroda N, Maegawa M, Irahara M, Takeda K, Akira S, Matsumoto M. Essential role of IkappaB kinase alpha in thymic organogenesis required for the establishment of self-tolerance. J Immunol. 2006;176:3995–4002. doi: 10.4049/jimmunol.176.7.3995. [DOI] [PubMed] [Google Scholar]
- Klein L, Kyewski B, Allen PM, Hogquist KA. Positive and negative selection of the T cell repertoire: what thymocytes see (and don’t see) Nat Rev Immunol. 2014;14:377–91. doi: 10.1038/nri3667. [DOI] [PMC free article] [PubMed] [Google Scholar]
- Lahm A, Paolini C, Pallaoro M, Nardi MC, Jones P, Neddermann P, Sambucini S, Bottomley MJ, Lo Surdo P, Carfí A, Koch U, De Francesco R, Steinkühler C, Gallinari P. Unraveling the hidden catalytic activity of vertebrate class IIa histone deacetylases. Proc Natl Acad Sci U S A. 2007;104:17335–40. doi: 10.1073/pnas.0706487104. [DOI] [PMC free article] [PubMed] [Google Scholar]
- Lewandowski SL, Janardhan HP, Trivedi CM. Histone Deacetylase 3 coordinates deacetylase-independent epigenetic silencing of transforming growth factor-β1 (TGF- β1) to orchestrate second heart field development. J Biol Chem. 2015;290:27067–27089. doi: 10.1074/jbc.M115.684753. [DOI] [PMC free article] [PubMed] [Google Scholar]
- Miyawaki S, Nakamura Y, Suzuka H, Koba M, Yasumizu R, Ikehara S, Shibata Y. A new mutation, aly, that induces a generalized lack of lymph nodes accompanied by immunodeficiency in mice. Eur J Immunol. 1994;24:429–34. doi: 10.1002/eji.1830240224. [DOI] [PubMed] [Google Scholar]
- Montgomery RL, Davis CA, Potthoff MJ, Haberland M, Fielitz J, Qi X, Hill JA, Richardson JA, Olson EN. Histone deacetylases 1 and 2 redundantly regulate cardiac morphogenesis, growth, and contractility. Genes Dev. 2007;21:1790–802. doi: 10.1101/gad.1563807. [DOI] [PMC free article] [PubMed] [Google Scholar]
- Montgomery RL, Potthoff MJ, Haberland M, Qi X, Matsuzaki S, Humphries KM, Richardson JA, Bassel-duby R, Olson EN. Maintenance of cardiac energy metabolism by histone deacetylase 3 in mice 118. 2008 doi: 10.1172/JCI35847.3588. [DOI] [PMC free article] [PubMed] [Google Scholar]
- Murtaugh LC, Stanger BZ, Kwan KM, Melton DA. Notch signaling controls multiple steps of pancreatic differentiation. Proc Natl Acad Sci U S A. 2003;100:14920–5. doi: 10.1073/pnas.2436557100. [DOI] [PMC free article] [PubMed] [Google Scholar]
- Nagamine K, Peterson P, Scott HS, Jun K, Minoshima S, Heino M, Krohn KJE, Maria DL, Mullis PE, Antonarakis SE, Kawasaki K, Asakawa S, Fumiaki I, Shimizu N. Positional cloning of the APECED gene. Nat Genet. 1997;17:393–398. doi: 10.1038/ng1297-393. [DOI] [PubMed] [Google Scholar]
- Nowell CS, Bredenkamp N, Tetélin S, Jin X, Tischner C, Vaidya H, Sheridan JM, Stenhouse FH, Heussen R, Smith AJH, Blackburn CC. Foxn1 regulates lineage progression in cortical and medullary thymic epithelial cells but is dispensable for medullary sublineage divergence. PLoS Genet. 2011;7:e1002348. doi: 10.1371/journal.pgen.1002348. [DOI] [PMC free article] [PubMed] [Google Scholar]
- Ohigashi I, Zuklys S, Sakata M, Minato N, Hollander GA, Correspondence YT, Mayer CE, Hamazaki Y, Takahama Y. Adult Thymic Medullary Epithelium Is Maintained and Regenerated by Lineage-Restricted Cells Rather Than Bipotent Progenitors. CellReports. 2015;13:1–12. doi: 10.1016/j.celrep.2015.10.012. [DOI] [PubMed] [Google Scholar]
- Otero DC, Baker DP, David M. IRF7-dependent IFN-β production in response to RANKL promotes medullary thymic epithelial cell development. J Immunol. 2013;190:3289–98. doi: 10.4049/jimmunol.1203086. [DOI] [PMC free article] [PubMed] [Google Scholar]
- Pajerowski AG, Nguyen C, Aghajanian H, Shapiro MJ, Shapiro VS. NKAP is a transcriptional repressor of notch signaling and is required for T cell development. Immunity. 2009;30:696–707. doi: 10.1016/j.immuni.2009.02.011. [DOI] [PMC free article] [PubMed] [Google Scholar]
- Parent AV, Russ HA, Khan IS, LaFlam TN, Metzger TC, Anderson MS, Hebrok M. Generation of functional thymic epithelium from human embryonic stem cells that supports host T cell development. Cell Stem Cell. 2013;13:219–29. doi: 10.1016/j.stem.2013.04.004. [DOI] [PMC free article] [PubMed] [Google Scholar]
- Pham L, Kaiser B, Romsa A, Schwarz T, Gopalakrishnan R, Jensen ED, Mansky KC. HDAC3 and HDAC7 have opposite effects on osteoclast differentiation. J Biol Chem. 2011;286:12056–65. doi: 10.1074/jbc.M110.216853. [DOI] [PMC free article] [PubMed] [Google Scholar]
- Reichert N, Choukrallah MA, Matthias P. Multiple roles of class I HDACs in proliferation, differentiation, and development. Cell Mol Life Sci. 2012;69:2173–87. doi: 10.1007/s00018-012-0921-9. [DOI] [PMC free article] [PubMed] [Google Scholar]
- Rodewald HR. Thymus organogenesis. Annu Rev Immunol. 2008;26:355–88. doi: 10.1146/annurev.immunol.26.021607.090408. [DOI] [PubMed] [Google Scholar]
- Rossi SW, Jenkinson WE, Anderson G, Jenkinson EJ. Clonal analysis reveals a common progenitor for thymic cortical and medullary epithelium. Nature. 2006;441:988–91. doi: 10.1038/nature04813. [DOI] [PubMed] [Google Scholar]
- Sekai M, Hamazaki Y, Minato N. Medullary Thymic Epithelial Stem Cells Maintain a Functional Thymus to Ensure Lifelong Central T Cell Tolerance. Immunity. 2014;41:753–761. doi: 10.1016/j.immuni.2014.10.011. [DOI] [PubMed] [Google Scholar]
- Shimizu H, Astapova I, Ye F, Bilban M, Cohen RN, Hollenberg AN. NCoR1 and SMRT play unique roles in thyroid hormone action in vivo. Mol Cell Biol. 2015;35:555–65. doi: 10.1128/MCB.01208-14. [DOI] [PMC free article] [PubMed] [Google Scholar]
- Su D, Navarre S, Oh W, Condie BG, Manley NR. A domain of Foxn1 required for crosstalk-dependent thymic epithelial cell differentiation. Nat Immunol. 2003;4:1128–35. doi: 10.1038/ni983. [DOI] [PubMed] [Google Scholar]
- Takaba H, Morishita Y, Tomofuji Y, Danks L, Nitta T, Komatsu N, Kodama T, Takayanagi H. Fezf2 Orchestrates a Thymic Program of Self-Antigen Expression for Immune Tolerance. Cell. 2015;163:975–987. doi: 10.1016/j.cell.2015.10.013. [DOI] [PubMed] [Google Scholar]
- Tanigaki K, Honjo T. Regulation of lymphocyte development by Notch signaling. Nat Immunol. 2007;8:451–456. doi: 10.1038/ni1453. [DOI] [PubMed] [Google Scholar]
- Ucar A, Ucar O, Klug P, Matt S, Brunk F, Hofmann TG, Kyewski B. Adult Thymus Contains FoxN1− Epithelial Stem Cells that Are Bipotent for Medullary and Cortical Thymic Epithelial Lineages. Immunity. 2014;41:257–269. doi: 10.1016/j.immuni.2014.07.005. [DOI] [PMC free article] [PubMed] [Google Scholar]
- Wong K, Lister NL, Barsanti M, Lim JMC, Hammett MV, Khong DM, Siatskas C, Gray DHD, Boyd RL, Chidgey AP. Multilineage potential and self-renewal define an epithelial progenitor cell population in the adult thymus. Cell Rep. 2014;8:1198–209. doi: 10.1016/j.celrep.2014.07.029. [DOI] [PubMed] [Google Scholar]
- You SH, Lim HW, Sun Z, Broache M, Won KJ, Lazar MA. Nuclear receptor co-repressors are required for the histone-deacetylase activity of HDAC3 in vivo. Nat Struct Mol Biol. 2013;20:182–7. doi: 10.1038/nsmb.2476. [DOI] [PMC free article] [PubMed] [Google Scholar]
- Ziesché E, Kettner-Buhrow D, Weber A, Wittwer T, Jurida L, Soelch J, Müller H, Newel D, Kronich P, Schneider H, Dittrich-Breiholz O, Bhaskara S, Hiebert SW, Hottiger MO, Li H, Burstein E, Schmitz ML, Kracht M. The coactivator role of histone deacetylase 3 in IL-1-signaling involves deacetylation of p65 NF-κB. Nucleic Acids Res. 2013;41:90–109. doi: 10.1093/nar/gks916. [DOI] [PMC free article] [PubMed] [Google Scholar]
Associated Data
This section collects any data citations, data availability statements, or supplementary materials included in this article.