

Abstract
Successful clinical translation of antibody-drug conjugates (ADCs) can be challenging due to complex pharmacokinetics and differences between preclinical and clinical tumors. To facilitate this translation, we have developed a general pharmacokinetic-pharmacodynamic (PK-PD) modeling and simulation (M&S)-based strategy for ADCs. Here we present the validation of this strategy using T-DM1 as a case study. A previously developed preclinical tumor disposition model for T-DM1 (Singh and Shah, AAPSJ. 2015; 18(4):861–875) was used to develop a PK-PD model that can characterize in vivo efficacy of T-DM1 in preclinical tumor models. The preclinical data was used to estimate the efficacy parameters for T-DM1. Human PK of T-DM1 was a priori predicted using allometric scaling of monkey PK parameters. The predicted human PK, preclinically estimated efficacy parameters, and clinically observed volume and growth parameters for breast cancer were combined to develop a translated clinical PK-PD model for T-DM1. Clinical trial simulations were performed using the translated PK-PD model to predict progression-free survival (PFS) and objective response rates (ORRs) for T-DM1. The model simulated PFS rates for HER2 1+ and 3+ populations were comparable to the rates observed in three different clinical trials. The model predicted only a modest improvement in ORR with an increase in clinically approved dose of T-DM1. However, the model suggested that a fractionated dosing regimen (e.g., front loading) may provide an improvement in the efficacy. In general, the PK-PD M&S-based strategy presented here is capable of a priori predicting the clinical efficacy of ADCs, and this strategy has been now retrospectively validated for all clinically approved ADCs.
Keywords: antibody-drug conjugates, modeling and simulation, objective response rates, PK-PD, preclinical-to-clinical translation, progression-free survival, T-DM1
INTRODUCTION
Biotechnology revolution in the past two decades has resulted in plethora of antibody-based therapeutics capable of targeting specific tissues inside the body. Antibody-drug conjugates (ADCs) are one such emerging class of compounds, which uses the targeting capability of a monoclonal antibody (mAb) to deliver potent cytotoxic agents directly to tumor cells (1,2). With more than 55 molecules currently in development (3,4), ADCs continue to demonstrate superiority over conventional anticancer agents by widening the therapeutic window (5). A typical ADC molecule consists of highly potent anticancer agents covalently attached to a mAb backbone via a chemical linker. The number of drug molecules attached to an antibody can vary within the same ADC formulation, where the number of drug molecules attached to an antibody is known as the drug/antibody ratio (DAR). Most clinically evaluated and approved ADCs (e.g., Adcetris® (6) and Kadcylla® (7)) were developed using random conjugation method and thus consist of a heterogeneous mixture of different DAR species. Upon systemic administration, the ADC molecules travel to the site-of-action and bind to cell surface receptors on the tumor cells via the mAb portion. Internalization of the receptor bound ADC inside the tumor cells leads to specific delivery of anticancer agents into the targeted cells. In order to understand and predict this pharmacokinetic (PK) behavior of ADCs, it is important to analyze and mathematically characterize the disposition of ADCs and their components on systemic and tumor levels. Once developed, the PK model can provide an efficient tool to predict the PK of ADC in plasma and tumor for not only animals but also humans (8,9). In addition, the PK model can be used to develop a quantitative exposure-response or dose-response relationship for ADCs by integrating the model with a suitable pharmacodynamic (PD) model (10). The PK-PD relationship developed preclinically can also serve as a cornerstone for the preclinical-to-clinical translational of ADC efficacy (11–13). Once validated, the translated PK-PD model can provide an efficient and cost-effective way of investigating the performance of different ADC dosing regimens on targeted patient population. Thus, for an efficient development of ADCs, it is vital to have a PK-PD modeling and simulation (M&S)-driven translational strategy that can integrate experimental data from discovery and preclinical stages to successfully predict clinical outcomes of ADCs. We have developed one such strategy and associated PK-PD models in the past, and in this paper, we present the validation of this ADC translational strategy using retrospective analysis of trastuzumab emtansine (T-DM1).
The ADC translation strategy and associated multi-scale mechanistic PK-PD model were first developed based on the experimental data from clinically approved ADC brentuximab-vedotin (SGN-35) (11). Brentuximab-vedotin consists of anti-CD30 mAb attached to potent tubulin polymerization inhibitor monomethyl auristatin E (MMAE) via a protease cleavable linker valine-citrulline (vc). First, the disposition of different brentuximab-vedotin-related analytes in CD30+ tumor cells was characterized using a cell-level PK model. The cellular PK model was then integrated with the systemic and tumor disposition PK model to a priori predict tumor exposures of unconjugated MMAE. Total concentrations of unconjugated MMAE inside the tumor were then used to characterize preclinical tumor growth inhibition data. Finally, integrated PK-PD model was translated to clinic by using systemic PK of ADC in the clinic and introducing patient-specific tumor growth parameters. Upon clinical trial simulations, a priori predicted progression-free survival (PFS) rates by the translated PK-PD model were found to be very similar to the observed PFS in Hodgkin’s lymphoma and anaplastic large cell lymphoma (ALCL) patients. The validity of ADC tumor disposition model has been further evaluated using anti-5T4 ADC A1mcMMAF (10), where the model was able to a priori predict tumor exposures of the unconjugated drug.
Our strategy for clinical translational of ADCs was recently employed by Betts et al. (13) for inotuzumab ozogamicin, which is an anti-CD22 mAb linked to ozogamicin (a calicheamicin derivative) via an acid-labile linker. The authors employed the mechanistic PK-PD model to translate the efficacy of ADC from animals to human, and a priori predicted the PFS in non-Hodgkin’s lymphoma patients following the ADC treatment. Using the translated PK-PD model, the authors also evaluated the performance of different dosing regimens in the clinic and concluded that fractionated dosing regimen was much more efficacious than a traditional “once per 3 weeks” (Q3W) regimen. Using PK-PD M&S, Betts et al. were also able to highlight the expected differences in the tumor cell exposure of the released drug between solid tumors and liquid cancers like acute lymphocytic leukemia (ALL).
Here we provide the validation of our PK-PD M&S-driven translational strategy using clinically approved ADC T-DM1, with the goal of presenting a general translational strategy that can be employed for clinical development of other novel ADC molecules. Previously, we have presented the development and validation of an augmented tumor disposition model for T-DM1 ((14), which is an ADC that consists of a non-cleavable linker. Briefly, intracellular catabolism of T-DM1 was characterized in three different HER2-expressing cell lines using a cellular PK model, where the parameter associated with intracellular degradation of ADC was introduced. Disposition of released drug across the tumor cells was characterized using passive diffusion and active efflux terms. The updated cellular model for ADC was integrated with the tumor disposition model to a priori predict tumor exposures of different analytes of T-DM1. In the analysis described within this paper, the previously developed preclinical tumor PK model for T-DM1 (14) was merged with a PD model to develop a PK-PD model that can characterize tumor growth inhibition (TGI) data generated following T-DM1 administration in a range of tumor bearing mice, where different tumors had differing levels of HER2 expression. Parameters associated with the preclinical PK-PD model of T-DM1 were translated to the clinic by using clinically observed breast cancer-related parameters and allometrically scaled human PK of T-DM1. Clinical trial simulations were performed for multiple phase-II and phase-III trials of T-DM1, and the simulated PFS was compared with the observed data in patients with varying levels of HER2 expression. Finally, different dosing regimens for T-DM1 were compared using the validated PK-PD model.
MATERIALS AND METHODS
Plasma Pharmacokinetic Model
Figure 1a describes the integrated plasma PK model for T-DM1. Similar structural model was assumed across different species (mice, monkeys, and humans) to characterize the PK of multiple analytes of T-DM1 (i.e., total trastuzumab—TTmAb, T-DM1, and DM1 catabolites) in the systemic circulation. The biexponential profile of TTmAb/T-DM1 was captured by a two-compartment model with linear elimination from the central compartment (CLADC). The distribution of TTmAb/T-DM1 to the peripheral compartment was characterized using a clearance distribution term (CLDADC). To characterize the faster eliminating profile of T-DM1 compared to TTmAb, an additional 1st-order elimination rate, coined as “non-specific deconjugation rate ,” was introduced. The presence of both TTmAb and T-DM1 profiles allows the estimation of the two distinct clearance pathways from the central compartment of the ADC. Both elimination pathways of T-DM1 serve as the input for the central compartment of DM1 catabolites. Disposition of released DM1 catabolites is also characterized using a two-compartment model with a linear elimination (CLDrug) from the central compartment and distributional clearance (CLDDrug) to the peripheral compartment. Detailed model equations are provided below, and the description of each state variable is provided in Supplementary Table S2.
| (1) |
| (2) |
| (3) |
| (4) |
| (5) |
| (6) |
| (7) |
Fig. 1.
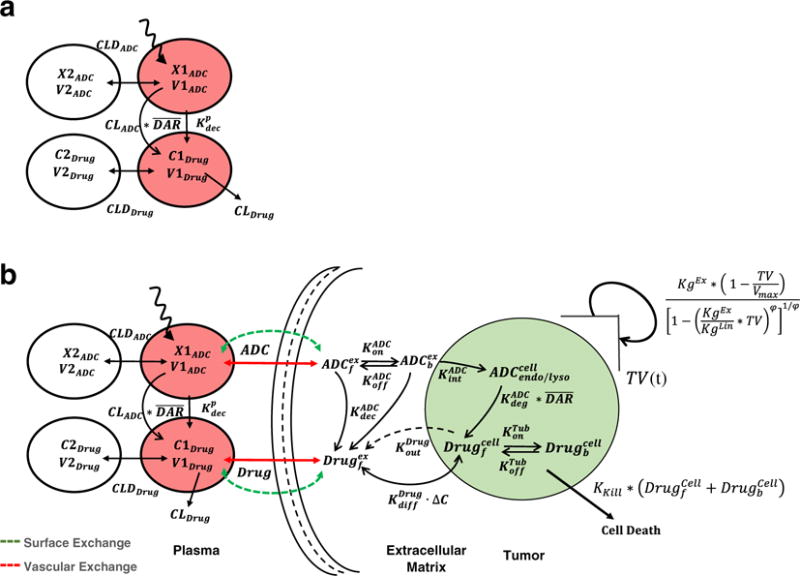
Schematics of the mathematical models used for the PK-PD analysis. a A PK model consisting of two integrated two-compartment models used for simultaneously characterizing the disposition of T-DM1 and DM1 catabolites in the systemic circulation. b A multi-scale PK- PD model used for characterizing the tumor distribution of T-DM1 and DM1 catabolites and ADC-induced tumor growth killing (refer to the “MATERIALS AND METHODS” section for the complete description of the model)
Integrated Tumor PK-PD Model
Figure 1b describes the schematics of the integrated PK-PD model used to characterize tumor disposition of ADC and the released drug as well as ADC-induced regression in tumor volume. Mechanistic processes involved in the tumor disposition of ADC are described in detail in our previous work (10,11,14). Briefly, after T-DM1 administration in the systemic circulation, disposition of both ADC and the released drug is characterized by a two-compartment model as explained in Fig. 1a. Due to high interstitial pressure and lack of functional lymphatic system in a tumor microenvironment, the exchange of ADC and small molecule is assumed to be limited to only diffusive processes. As described in the original model developed by Wittrup et al. (15–17), the exchange of both ADC and released drug is characterized by molecular size-specific permeability and diffusion associated terms (see Eqs. 8 and 16). With an assumption of a spherical tumor, size/radius of the tumor determines the rate of ADC/drug exchange in the tumor via diffusion across the tumor surface or permeability across the blood vessel endothelium. These terms are reflected in Fig. 1b as the surface exchange and vascular exchange processes. At lower tumor sizes, the surface exchange predominates whereas at higher tumor sizes, the vascular exchange predominates. Effectively, higher concentrations of ADC and drug achieved in certain parts of the tumor due to heterogeneous distribution of ADC/drug are characterized by incorporating “void volume (ε)” terms specific to antibody and small molecule. Within the tumor microenvironment, a cellular space is assumed to characterize the catabolism of ADC molecules. ADC molecules in the extracellular space are available to bind (characterized using and ) to free HER2 followed by antigen-mediated internalization ( ) and proteases-induced degradation ( ) processes. Free drug released in the cytoplasm after degradation of ADC is available to bind to microtubules, characterized using total tubulin concentration (Tubtotal) and binding constants ( on and ). Free unconjugated drug in the cytoplasm is transported outside via a bidirectional diffusion process operating across the concentration gradient and an outward active efflux process. Unconjugated drug generated in the extracellular space, either via non-specific deconjugation process or from the cellular release, is then transported outside the tumor microenvironment via drug-specific permeability and diffusion terms explained earlier.
To model the PD effect of T-DM1, intratumoral DM1 concentrations were assumed to induce the tumor regression. Growth of the tumor was modeled using an equation proposed by Haddish-Berhane et al. (12), which is a modification of the original cell distribution model proposed by Simeoni et al. (18). When the tumor is small, the growth is characterized mainly using the exponentially function KgEx, and as the tumor grows, the model switches from exponential growth to linear growth (KgLin). At a very late stage, the tumor volume reaches a maximum carrying capacity (Vmax) and the tumor stops growing. Total intracellular concentrations of unconjugated DM1 catabolites (free and tubulin bound) were used to induce the regress in the tumor volumes (TV(t)) using a 1st-order killing rate constant (KKill).
All the model equations associated with the PK-PD model are provided below, and the details of model parameters are provided in the Table I. The description of each state variable is provided in Supplementary Table S2.
Table I.
A list of PK-PD model parameters, either estimated or obtained from different sources in the literature
| Parameter | Definition | Value | (CV %) | Unit | Source | |
|---|---|---|---|---|---|---|
| Parameters feeding the cellular disposition model of T-DM1 | ||||||
| 2nd-order association rate constant between T-DM1 and HER2 antigen | 0.37 | 1/nM/h | (14) | |||
| Dissociation rate constant between T-DM1 and HER2 antigen | 0.097 | 1/h | (14) | |||
| Internalization rate of the HER2-T-DM1 complex inside the cell | 0.09 | 1/h | (14) | |||
| Proteasomal degradation rate of T-DM1 in endosomal/lysosomal space | 0.03 | 1/h | (14) | |||
| 2nd-order association rate constant between DM1 catabolites and intracellular tubulin protein | 0.03 | 1/nM/h | (14) | |||
| Dissociation rate constant between tubulin catabolites and tubulin protein | 0.0285 | 1/h | (14) | |||
| Tubtotal | Total concentration of intracellular tubulin protein | 65 | nM | (14) | ||
| Non-specific deconjugation rate of T-DM1 from the extracellular space | 0.0223 | 1/h | (14) | |||
| Bidirectional diffusion rate constant for DM1 catabolites in the intracellular and extracellular space | 0.092 | 1/h | (14) | |||
| Active efflux rate constant of DM1 catabolites from the intracellular space to extracellular space | 0 | 1/h | (14) | |||
| Total antigen expression levels derived using the number of HER2 | 166 | nM | (19) | |||
| receptors per cell and the number of cells packed in a liter volume | 830 | |||||
| assuming the volume of a cell as 1 pl | 1660 | |||||
| Parameters associated with tumor disposition of T-DM1 | ||||||
| RCap | Radius of the tumor blood capillary | 8.0 | μm | (10,11,14) | ||
| RKrogh | An average distance between two capillaries | 75.0 | μm | (10,11,14) | ||
| PADC, PDrug | The rates of permeability of T-DM1 and DM1 catabolites across the blood vessels, respectively | 334, 21,000 | μm/day | (10,11,14) | ||
| DADC, DDrug | The rates of diffusion of T-DM1 and DM1 catabolites across the blood vessels, respectively | 0.022, 0.25 | cm2/day | (10,11,14) | ||
| εADC, εDrug | Tumor void volume for T-DM1 and DM1 catabolites | 0.24, 0.44 | Unitless | (10,11,14) | ||
| RTumor, DTumor | Radius and diameter of a spherical tumor calculated based on varying tumor volume (TV) where: | Dynamic | cm | |||
| Parameters associated with systemic pharmacokinetics in different species | ||||||
| CLADC, CLDADC | Central and distributional clearances of mAb/ADC in different species, respectively | Mouse | 0.0934, 0.118 | L/day/kg | Singh et al. (14) | |
| Monkey | 0.0043 (8.2%), 0.014 (48%) | Estimated | ||||
| Human | 0.0043, 0.014 | Predicted | ||||
| V1ADC, V2ADC | Central and peripheral volume of distribution of mAb/ADC in different species, respectively | Mouse | 0.043, 0.0948 | L/kg | Singh et al. (14) | |
| Monkey | 0.034 (14%), 0.04 (32%) | Estimated | ||||
| Human | 0.034, 0.04 | Predicted | ||||
| CLDrug, CLDDrug | Central and distributional clearances of DM1 catabolites, respectively | Mouse | 11.29,155 | L/day/kg | Singh et al. (14) | |
| Monkey | 2.92 (32%), 1.0 (2.62%) | Estimated | ||||
| Human | 2.23, 1.0 | Predicted | ||||
| V1Drug, V2Drug | Central and peripheral volume of distribution of DM1 catabolites | Mouse | 3.30, 2.01 | L/kg | Singh et al. (14) | |
| Monkey | 0.034 (fixed), 5.0 (7.84%) | Estimated | ||||
| Human | 0.034, 5.0 | Predicted | ||||
|
|
Non-specific deconjugation rate constant for T-DM1 in the systemic circulation | Mouse | 0.241 | 1/Day | Singh et al. (14) | |
| Monkey | 0.241 | assumed | ||||
| Human | 0.241 | assumed | ||||
| Parameters associated with preclinical tumor growth inhibition (TGI) studies | ||||||
| DTmouse model | Doubling time associated with the exponential growth of mouse tumor | BT474EEI | 21.0 (1.8%) | Day | Estimated | |
| FO5 | 4.5 (6.65%) | |||||
| Calu-3 | 8.99 (4.12%) | |||||
| KPL-4 | 8.21 (7.8%) | |||||
| N87 | 14.3 (3.6%) | |||||
| BT474 | 11.2 (2.05%) | |||||
| MAXF1162 | 10.2 (1.94%) | |||||
| HBCx-34 HP | 11.4 (3.6%) | |||||
| ST313 HP | 10.5 (1.8%) | |||||
| HBCx-10 | 6.84 (2.4%) | |||||
| MAXF 449 | 13.8 (2.45%) | |||||
| KKill, ωKill | Mean and IIV for a linear killing constant | BT474EEI | 6.83E–5 (3%), 28.0% (6.8%) | 1/day | Estimated | |
| FO5 | 2.38E-4 (7%), 34.0% (22.3%) | |||||
| Calu-3 | 4.86E-4 (14%), 41.0% (23.7%) | |||||
| KPL-4 | 1.96E-3 (5.3%), 21.0% (9.8%) | |||||
| N87 | 6.38 E - 4 (38%), 32.0% (31.4%) | |||||
| BT474 | 9E-4 (29.5%), 31.0%(>50%) | |||||
| MAXF1162 | 5.58E-4 (6.7%), 23.0% (10%) | |||||
| HBCx-34 HP | 1.8 E - 4 (33.5%), 18.0% (92%) | |||||
| ST313 HP | 1.93E-4 (>50%), 11.0% (21%) | |||||
| HBCx-10 | 1.43E-4 (22%), 14.0% (83%) | |||||
| MAXF 449 | 1.57E-4 (5.5%), - | WE | ||||
Equations associated with tumor distribution of T-DM1 and DM1 containing catabolites are as follows
| (8) |
| (9) |
| (10) |
| (11) |
| (12) |
| (13) |
| (14) |
| (15) |
| (16) |
| (17) |
| (18) |
Equations associated with tumor growth inhibition by T-DM1 are as follows:
| (19) |
| (20) |
| (21) |
Model Building and Validation Datasets
Tables II and IV and Supplementary Table S1 list different preclinical and clinical studies of T-DM1, data from which is used to validate the PK-PD M&S-based translational strategy for ADCs. TGI study dataset (Table II) is obtained from diverse sources and incorporates different mouse models (xenografts, patient-derived xenograft (PDX), and orthotropic), different cell lines with varying levels of HER2 expression, and different doses and dosing regimens of T-DM1. T-DM1 PK in monkeys (Table S1) is obtained from different toxicokinetic studies, where 3- and 10-fold higher doses than the clinically approved dose were administered in a single or multiple dosing regimen, and three different analytes (TTmAb, T-DM1, and DM1) were measured (25,26). PK dataset in humans was obtained from both phase-I and phase-II studies conducted at the clinically approved dose of 3.6 mg/kg Q3W in HER2-positive metastatic breast cancer patients (20,27). Table III lists clinically reported values for tumor growth parameters, which were obtained from different sources in the literature and utilized for translating the PK-PD model. Table IV lists the details of different clinical trials (phase-II and phase-III), which were utilized for the validation of model-predicted PFS values (7,28–30). In all the clinical publications, both independent radiological facility (IRF) and investigator (INV) assessments were presented, and both were reported to be very similar.
Table II.
A list of tumor growth inhibition (TGI) studies used to establish preclinical PK-PD relationship for T-DM1
| Preclinical tumor growth inhibition (TGI) studies of T-DM1
| ||||
|---|---|---|---|---|
| Mouse models | Model type | HER2 status | Dosing regimen | Reference |
| BT474EEI | Xenograft | 3+ |
|
Jumbe et al. (20) |
| Fo5 | Breast tissue-derived orthotropic and metastatic (BOM) model | 3+ |
|
Jumbe et al. (20) |
| Calu-3 | Xenograft | 3+ |
|
|
| KPL4 | Xenograft | 3+ |
|
|
| N87 | Xenograft | 3+ |
|
|
| BT474 | Xenograft | 3+ | 0.2-5 mg/kg single dose | Van der Lee et al. (19) |
| MAXF 1162 | PDX | 3+ | 1-10 mg/kg single dose | Van der Lee et al. (19) |
| HBCx-34 HP | PDX | 2+ | 3-30 mg/kg single dose | Van der Lee et al. (19) |
| ST313 HP | PDX | 2+ | 3-30 mg/kg single dose | Van der Lee et al. (19) |
| HBCx-10 | PDX | 1+ | 3-30 mg/kg single dose | Van der Lee et al. (19) |
| MAXF 449 TNBC | PDX | 1+ | 3-30 mg/kg single dose | Van der Lee et al. (19) |
Table IV.
A list of T-DM1 clinical trial datasets used for the validation of a priori predictions of PFS rates by the translated PK-PD model
| Clinical trials of T-DM1
| ||||||
|---|---|---|---|---|---|---|
| Study | Patient population | Phase | Number of patients | Dosing regimen | Treatment arms | Reference |
| TDM4450 | First-line HER2+ metastatic breast cancer patients | II | 137 | 3.6 mg/kg Q3W until disease progression | T-DM1 versus trastuzumab+ docetaxel | Hurvitz et al. (28) |
| TDM4258g | HER2+ metastatic breast cancer patients with prior treatment with trastuzumab | II | 112 | 3.6 mg/kg Q3W up to 12 months | Trastuzumab followed by T-DM1 | Burris III et al. (29) Krop et al. (30) |
| EMILIA | HER2+ metastatic breast cancer patients with prior treatment with trastuzumab and taxane | III | 991 | 3.6 mg/kg Q3W until disease progression | T-DM1 versus capecitabine + lapatinib | Verma et al. (7) |
Table III.
A list of clinically reported breast cancer-related parameters used to build the translated PK-PD model
| Parameters | Definition | Value (CV %) | Units | Source |
|---|---|---|---|---|
| TV(0) | Initial tumor volume derived using the following expression | Initial tumor lesion length = 19 mm (101%) | mm3 | Bernadou et al. (31) |
|
|
Initial sum of Lengths and Breadth for tumor lesions =35 mm (125%) | |||
| DTExp | Doubling time associated with the exponential growth phase of the tumor | 25 (200%) | Day | Pearlman et al. (32) |
| DTLin | Doubling time associated with the linear growth phase of the tumor | 621 (85%) | Day | Weedon-Fekjær et al. (33) |
| Ψ | Switch between exponential growth and linear growth phases | 20 | Unitless | Haddish-Berhane et al. (12) |
| Vmax | Maximum achievable tumor volume | 523.8 | cm3 | Assumed based on maximum achievable tumor radius to be 5 cm (11,13) |
PK-PD Translation Strategy and Data Analysis
Figure 2 provides the step-by-step details of our general PK-PD M&S-based preclinical-to-clinical translational strategy for ADCs. The same strategy was employed in this investigation to develop/validate a mechanistic PK-PD model for T-DM1, which was then used to a priori predict the clinical PK and PFS for the ADC.
Fig. 2.
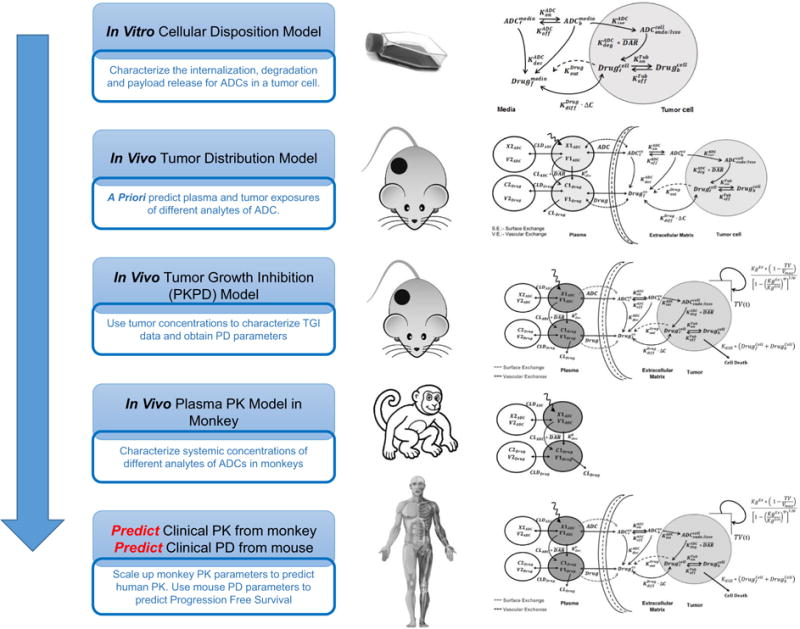
A flowchart detailing the proposed PK-PD M&S-based strategy for the preclinical-to-clinical translation of ADCs
Characterization of intracellular and tumor disposition of ADCs
First two steps of our strategy include (i) characterization of the cellular disposition of T-DM1 in an in vitro system and (ii) integration of the cellular disposition model with the in vivo systemic PK and tumor disposition model to a priori predict tumor exposures for different analytes of T-DM1 in xenograft mouse model. These two steps have been accomplished for T-DM1 and have been reported in detail in our previously published manuscript (14).
Estimation of efficacy parameters for ADCs using PK-PD model
Third step of the strategy entails using the predicted intratumoral concentrations of DM1 catabolites to drive the TGI data in various mouse models, in order to estimate the efficacy parameters for the ADC. The model described in Fig. 1b was used to accomplish this step. Our previous work on cellular disposition of T-DM1 used common cellular PK parameters for three different HER2-expressing cell lines, which differed only in their levels of HER2 expression. Consequently, it was assumed that antigen expression was the only varying parameter among different mouse models included in this analysis. For the PDX tumors for which no information on the receptor numbers per cell was available, we converted the semi-quantitative immunohistochemical (IHC) scores of PDX tumors into HER2 receptor numbers per cell using the work of Van der Lee et al. (19). These authors have performed a comparative analysis of semi-quantitative IHC scores of PDX tumor tissues with established breast cancer cell lines, and based on their analysis, we assumed that a 3+ mouse model has ∼1 million, 2+ has ∼0.5 million, and 1+ has ∼0.1 million HER2 receptors per cell. Tumor concentrations of the released drug following systemic administration of ADC in different mouse models were predicted using the multi-scale mechanistic tumor disposition model presented before (Fig. 1b). In order to characterize the TGI data, all datasets pertaining to a given mouse model were fitted simultaneously. From each tumor model, the growth rate of the tumor and ADC-induced killing rate constant (KKill) was estimated, along with the log-normal distribution of the parameter (i.e., ). Based on all the animal models, a composite distribution of estimated killing rate constants and tumor doubling times was generated.
Characterization of pharmacokinetics of T-DM1 in monkey
The 4th step of the translational strategy involves estimation of monkey PK parameters for the ADC. PK profiles of different T-DM1 analytes in monkey after the systemic administration of ADC were fitted simultaneously using the model shown in Fig. 1a to estimate the T-DM1 PK parameters in monkeys.
Prediction of clinical PK of ADC using allometric scaling of monkey PK
PK parameters for TTmAb/T-DM1 and DM1 were scaled up using the following allometric equation
| (22) |
where “θ” in Eq. 22 stands for the mean value of the four pharmacokinetic parameters (i.e., CL, CLD, V1, and V2) for either TTmAb, T-DM1 or small molecule DM1. The term “e” refers to the allometric exponent used to scale up the parameter from monkeys to humans. In case of mAb (TTmAb/T-DM1), exponent value of “1” was used for all the PK parameters, as per our previous report (12). In case of small molecule (DM1), however, exponent of “0.75” was used for CL and CLD and “1” was used for V1 and V2. The value of non-specific deconjugation rate ( ) was assumed to be the same between monkeys and humans. Scaled up human PK parameters for the ADC were used to perform Monte Carlo simulations on 250 subjects, and the resulting median and 2.5th and 97.5th percentile profiles were superimposed over the observed PK profiles of T-DM1 in the clinic to assess the quality of the allometric scaling.
Prediction of PFS
The PK-PD model shown in Fig. 1b was used to perform clinical trial simulation in HER2-expressing breast cancer patients in order to predict PFS for T-DM1. In the translated PK-PD model, systemic PK parameters for T-DM1 were scaled up from monkey PK parameters as described above, and T-DM1 tumor disposition parameters were the same as used preclinically (14). Based on the systemic PK and preclinically validated tumor disposition model, the tumor concentrations of ADC were predicted. While there is no clinical data to validate the predicted tumor concentrations of ADC in the clinic, it is known that plasma PK of ADC is notably different than tumor PK, and therefore, it is hypothesized that the model generated tumor PK of ADC would be a better driver to characterize ADC-induced tumor regression in the clinic. The tumor growth parameters estimated for mice were replaced by clinically observed growth parameters for HER2+ metastatic breast cancer patients (Table III). The physiological and biochemical heterogeneity (variability) in the breast cancer patients that would lead to different tumor growth rates was accounted for by including literature reported variability values of the growth rate parameter during clinical trial simulations (Eq. 19; Table III). Difference in the antigen expression levels between different patients was also accounted for by including different absolute HER2 receptor number values in different patient populations during the clinical trial simulations. In the absence of any direct information about the number of HER2 receptors in HER2 overexpressing patients, it was assumed that HER2 3+ and 1+ patients expressed ∼1 and ∼0.1 million HER2 receptors on the surface of cancer cells, respectively. Variability in the inherent sensitivity for T-DM1 between different patient populations was accounted for by utilizing different preclinically estimated KKill values (obtained from 11 different TGI studies) along with their estimated variability to predict the clinical efficacy. Clinical trial simulations were performed (via stochastic simulation) for 1000 breast cancer patients in the presence and absence of 1 year therapy with T-DM1 (mimicking studies described in (7,28–30) at the clinically approved dosing regimen of 3.6 mg/kg given Q3W. Patients with HER2 positive status of 3+ and 1+ were simulated. PFS values were calculated from the simulated tumor diameters every month (up to 16 months) using the Response Evaluation Criteria In Solid Tumors (RECIST) criteria (34) and superimposed over the observed data for comparison. As the model simulations did not specifically address the effect of patient censoring on PFS, this effect was evaluated by creating artificial scenarios where 10% (n = 100) of the population was censored from upper, middle, lower, and entire range of simulated tumor profiles for HER2 3+-expressing patients (n = 1000). PFS rates between the original and different censored populations were compared.
Calculation of changes in ORRs at different dose levels
The translated PK-PD model for T-DM1 was used to explore clinical dose-response relationship for the ADC. T-DM1 treatment at the doses ranging from 0.1 to 20 mg/kg, given Q3W for 1 year, was evaluated. Objective responses were binned into four categories based on RECIST guidelines: (i) complete response (tumor undetectable, assumed diameter <0.5 cm), (ii) partial response (>30% decrease in tumor diameter, but still detectable), (iii) stable disease (<30% decrease and <20% increase in tumor diameter), and (iv) progressive disease (>20% increase in tumor diameter) (34). Changes in ORRs observed at 16 months post start of the T-DM1 treatment were used to establish the dose-response relationships.
Effect of different dosing regimens on PFS
The translated PK-PD model was used to evaluate the performance of a fractionated dosing regimen of T-DM1 in the clinic. The total amount of ADC dose per cycle and the total number of cycles were kept constant while evaluating different regimens. Effects of T-DM1 on tumor growth were evaluated at the following: (a) 3.6 mg/kg given every 4 weeks (Q4W); (b) 1.2 mg/kg given every 1 week (Q1W); and (c) 3, 0.3, and 0.3 mg/kg given on days 0, 7, and 14 of a 21-day cycle (front-loading regimen). Predicted PFS for each regimen was compared with the PFS obtained at a clinically approved dosing regimen of 3.6 mg/kg given Q3W in patients with HER2 3+ and 1+ status.
Modeling and simulation
All the datasets were digitized from original publications using Grab It!® software package. To minimize the error associated with digitalization, time-point values for all the digitized data points were replaced with the original reported time-point values in the publications. Stochastic simulations for the PK-PD model were performed using the software Berkeley Madonna (University of California at Berkeley, CA), and model was fitted to the data using maximum likelihood (ML) estimation methods in ADAPT-5 software (BMSR, CA) (35). For the model fitting, following variance model (Var(t)) was used, where σintercept refers to the additive error and σslope refers to the proportional error with respect to the model prediction (Y(t)):
| (23) |
RESULTS
TGI data fittings using the PK-PD model
Figure 3 describes the model fitting for 11 different HER2+ tumor bearing mouse models. Different dosing regimens and data from different studies were pooled together to estimate the unified growth and T-DM1 efficacy parameters for each mouse model. For most of the TGI studies, distinct linear and saturable phases were unavailable in the observed growth data. Therefore, a minimalistic exponential growth model was used to capture all the growth profiles. A unified doubling time was able to capture all data for a given mouse model. A linear killing function was chosen over a non-linear killing function due to model identifiability issues. The mean value and inter-individual variability on the linear efficacy parameter (KKill) was estimated with reasonable precision for most tumor models (see Table I). Most of the mean estimates on inter-individual variability (IIV) were below 40%, whereas in some mouse models (e.g., MAXF 449 TNBC), incorporation of IIV was not required. All the estimated doubling time values and killing constants (KKill) are plotted together in Supplementary Fig. S1 and Fig. 3l, respectively. The distribution of killing rate constants (KKill) (Fig. 3l) was later used to perform the stochastic simulations for clinical translation. While translating for high-expressing (HER2 3+) population, the distribution of efficacy parameters from 3+ mouse models was used, whereas for low-expressing (HER2 1+) population, the mean and standard deviation from 1+ mouse models was used to perform the stochastic simulations.
Fig. 3.
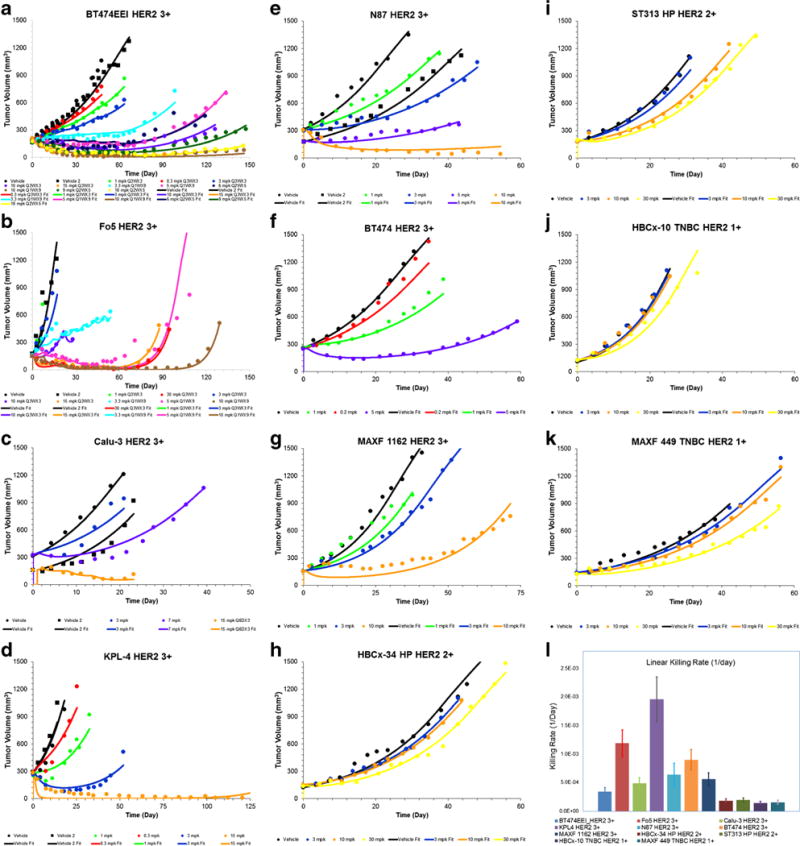
Observed (symbols) and PK-PD model fitted (lines) profiles of tumor growth inhibition by T-DM1 in different mouse tumor models. a BT474EEI. b Fo5. c Calu-3. d KPL4. e N87. f BT474. g MAXF 1162. h HBCx-34 HP. i ST313 HP. j HBCx-10 TNBC. k MAXF 449. l Estimated mean and inter-individual variability for T-DM1 killing rate constants in different mouse models
Fitting monkey plasma PK and prediction of T-DM1 human PK
Figure 4 (A1–3) shows the simultaneous fitting of systemic PK profiles of three different analytes of T-DM1 (TTmAb, T-DM1, and DM1) in monkey using the integrated systemic PK model shown in Fig. 1a. The model was able to capture all the data (detailed in Supplementary Table S1) very well. Due to a lower precision (>50% CV) on the estimate of the central compartment volume of distribution (V1) for the DM1 catabolite, it was fixed to a value similar to central compartment volume of distribution for antibody. This assumption is based on the expectations that the initial volume of distribution for the molecules released from ADC will be similar to that of the ADC itself. The rest of the model parameters were estimated with a good precision (CV% <50).
Fig. 4.
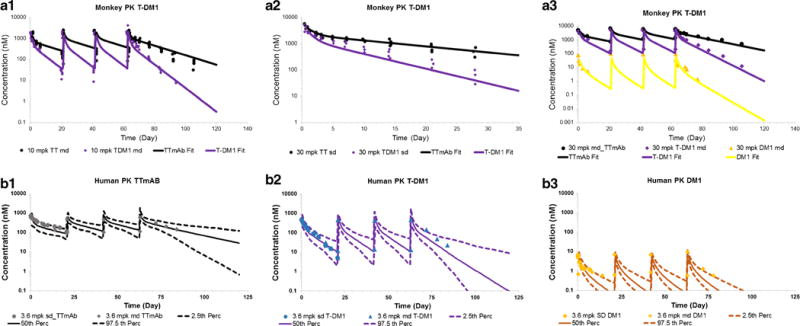
A1–3 Observed (symbols) and model fitted (lines) PK profiles for total trastuzumab (black), T-DM1 (purple), and DM1 (yellow), after T-DM1 administration in cynomolgus monkeys. A1 Ten milligrams per kilogram given Q3WX4. A2 Thirty milligrams per kilogram single dose. A3 Thirty milligrams per kilogram given Q3WX4. B1–3 Allometrically scaled PK parameters based human PK predictions for T-DM1 superimposed over observed PK in metastatic breast cancer patients. The solid lines represent predicted median, and the dotted lines represent 2.5th and 97.5th percentiles. Observed data are represented as symbols. B1 Total trastuzumab. B2 T-DM1. B3 DM1 PK after 3.6 mg/kg T-DM1 administration in monkeys at the dosing regimen of Q3WX4
In order to evaluate the quality of the allometrically scaled human PK parameters for the ADC, Monte Carlo simulations (n = 250) were performed using the scaled mean parameters (as described in the “MATERIALS AND METHODS” section) and their associated variability. The median PK profiles and 95% confidence interval around it were superimposed over the clinically observed PK data. As shown in Fig. 4 (B1–3), the predictions very well matched the observed data for all three analytes and most of the data fell within the 95% confidence interval. While the predicted median PK profiles for TTmAb and T-DM1 passes through the middle of the observed data, there was a systemic bias (under-prediction) observed for the DM1 profile. This discrepancy can result from several assumptions, including the use of standard small molecule coefficients for allometric scaling (36), use of an ADC deconjugation rate similar to monkey, formulation impurities, and analytical method related issues. Nonetheless, since it is known that the systemic concentrations of the released drug do not contribute significantly towards the total tumor concentrations of the drug (10,14), the scaled-up human PK parameters were deemed acceptable for further analysis.
Predictions of the clinical efficacy of T-DM1
Figure 5 (A1–3) shows the simulated tumor diameters for different patient populations (1000 patients/population), after 1 year therapy with T-DM1 at the dosing regimen of 3.6 mg/kg given Q3W. Clinical trial simulations were conducted to mimic the actual clinical trials reported in Table IV. Clinically relevant growth values along with scaled up human PK and estimated mouse efficacy parameters ( , )were used to make PFS predictions. The PFS predictions for control (non-treatment) arm were very similar to observed PFS in non-responding patients with normal levels of HER2 expression (Fig. 5 (B)). The PFS predictions in HER2 1+ patients were very close to the observed PFS in clinic for HER2+ patients having below median level of HER2 expression. It is important to note that we only had two HER2 1+ preclinical mouse model data, and availability of more preclinical data would have strengthen this predictions. The predictions made for HER2 3+ patients very well superimposed over the observed PFS from three different clinical trials, where the overexpression of HER2 in the participants was experimentally determined using the IHC score of 3+ (7,28–30). The effect of patient censoring on the simulated PFS rates is shown in the Supplementary Fig. S2. The PFS rates between the original and different censored populations completely superimpose each other, suggesting that the chosen sample size (n = 1000) for PFS predictions is large enough to prevent the generations of any bias associated with patient censoring.
Fig. 5.
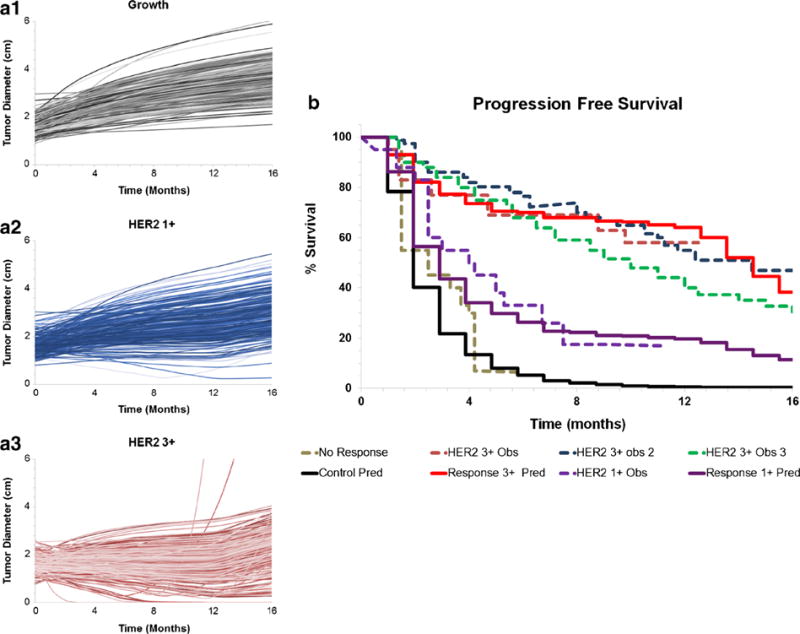
A1–3 Model generated simulations of tumor diameters in A1 control or no-treatment, A2 T-DM1-treated HER2 1+ patients, and A3 T- DM1-treated HER2 3+ patients. B Model-predicted PFS rates in HER2+ metastatic breast cancer patients (solid lines) overlaid with observed PFS rates (dotted lines) in the clinical trials. Non-responding population is shown in black, HER2 1+ population is shown in purple, and HER2 3+ population is shown in red
Prediction of ORR vs. dose relationship
Figure 6a describes the changes in the ORRs (i.e., PD, CR, SD, and PR) with an increase or decrease in clinically approved dose of T-DM1. The model predicted a gradual decrease in progressive disease, gradual increase in complete response, minimal decrease in stable disease, and no changes in partial response, with increasing dose of T-DM1 in a Q3W regimen. A decrease in the dose resulted in relatively steeper changes in the ORRs. Overall, the predicted improvements in ORRs with an increase in the clinically approved dose of T-DM1 were minimal.
Fig. 6.
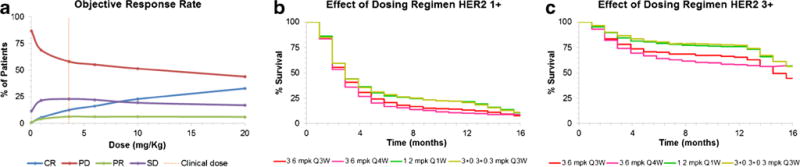
a PK-PD model simulated ORR vs. dose relationships. b Effect of different dosing regimens on the PFS rates in HER2 1+ population. c Effect of different dosing regimens on the PFS rates in HER2 3+ population
Effect of different dosing regimens on PFS
Figure 6b, c shows the predicted effects of different dosing regimens of T-DM1 on the PFS of both HER2 1+ and 3+ breast cancer patients (n = 1000). In both the patient populations, T-DM1 given at 3.6 mg/kg Q4W (in pink) resulted in a slight reduction in the PFS compared to the established dosing regimen of 3.6 mg/kg given Q3W (in red). However, both the fractionated regimens (1.2 mg/kg given Q1W (green) and 3.0 + 0.3 + 0.3 mg/kg (yellow) given on days 0, 7, and 14 of a 21-day cycle) resulted in a modest improvement in the PFS compared to the clinically approved regimen.
DISCUSSION
Despite significant efforts to improve the discovery and development of novel anticancer agents, the success rate for their bench-to-bedside translation remains low. Majority of these failures occur in the late stages of clinical development due to the lack of significant improvement in the efficacy compared to the standard of care treatment. This also applies to ADCs. Some of the most prominent discontinuations of ADC molecules over the last decade include the following: CD56-targeting IMGN901 (ImmunoGen Inc.) after phase-II trial in small cell lung cancer patients (37), CD33-targeting Gemtuzumab Ozogamicin (Mylotarg®, Pfizer Inc.) after phase-III trial in acute myeloid leukemia (AML) patients (25), CD-70 targeting SGN-75 (Seattle Genetics, Inc.) after phase-Ib trial in renal cell carcinoma patients, and CD33-targeting SGN-33 (Seattle Genetics, Inc.) after phase-IIb trial in acute myeloid leukemia (AML) patients (38). Lower clinical success rates are often a result of failure to correctly translate the information learned from preclinical investigations in order to predict the clinical outcomes (39). These disappointments often lead to skepticism in the current preclinical methodology/animal models, and their ability to accurately identify promising candidates for the clinic (40). However, often the failures are not a result of poor preclinical models, but rather inability to adequately translate the preclinical exposure-response relationships to the clinic. For the targeted molecules like ADCs, whose plasma concentrations are not in rapid equilibrium with the tumor concentrations, the discrepancies in preclinical and clinical TGI responses especially arises when plasma concentrations are used to drive the efficacy of an ADC using an empirical PK-PD model (41). Additionally, differences in the antigen expression levels, tumor size, and growth rates, as well as sensitivity of the cells to the drug molecules, also lead to preclinical-to-clinical translational failures. Consequently, a mechanistic model that accounts for the disposition of ADC in the tumor, based on the systemic exposure of the ADC and key tumor biomeasures (e.g., tumor size, antigen expression level, antigen internalization, etc.), is often more suitable to develop a clinically translatable PK-PD relationship. We have developed one such model for ADCs (11), which has been previously applied to predict the clinical outcomes of brentuximab-vedotin (11) and inotuzumab-ozogamicin (13). In this paper, we present further validation of the mechanistic PK-PD model and associated PK-PD M&S-based preclinical-to-clinical translational strategy for ADCs, using a case study on the clinically approved ADC T-DM1.
Figure 2 provides the detailed step-by-step methodology adopted in the development of a clinically translatable PK-PD model for ADCs. Step 1 involves the development of a cellular PK model that is able to characterize in vitro disposition of the ADC in the target tumor cells. Such models are really helpful in characterizing key processes like ADC binding and internalization, ADC degradation and linker-cleavage, drug release and interaction with the intracellular site-of-action, as well as efflux of released drug in the extracellular space. With the help of in vitro PK profiles of multiple analytes (e.g., total antibody, conjugated antibody, total drug, and unconjugated drug), one can accurately estimate the values of the parameters that represent the key intracellular processes mentioned above. Such cellular level PK model for T-DM1 has been developed by us before (14), which was able to estimate the values of prominent pathways responsible for bringing DM1 to intracellular site-of-action (i.e., tubulin) in different HER2-expressing cell lines. This model is different than the one previously used to characterize the cellular PK of brentuximab-vedotin (11), as it is augmented with intracellular degradation rate of ADC and accounts for both passive as well as active pathways of drug efflux from the tumor cells.
Step 2 of the strategy involves integration of the cellular disposition model of ADC (developed in step 1) with the in vivo tumor disposition model of ADC and validation of this PK model in a murine tumor model. Data from a tumor biodistribution study, including plasma and tumor exposures for different analytes of ADCs, is required to accomplish this step. First the plasma PK of all the analytes is characterized using the model shown in Fig. 1a, and then the systemic PK parameters are incorporated in the model shown in Fig. 1b to a priori predict tumor exposures of different analytes just based on their plasma PK. Thus, this step serves as a validation step for the tumor distribution model of ADC. Using the molecular size specific parameters for antibody and small molecule distribution into the tumor, our model has been able to a priori predict the tumor exposures for multiple ADCs in the past (brentuximab-vedotin (12), A1mcMMAF (10)), including T-DM1 (14).
Step 3 of the strategy is aimed towards estimating the efficacy of the ADC preclinically. The concentrations of the active component (i.e., released drug) at the site-of-action (i.e., tumor cells), which is predicted using the PK model developed in step 2, is used to drive the efficacy of the ADC. The TGI data obtained from different preclinical tumor models is characterized using the PK-PD model shown in Fig. 1b to estimate the efficacy-related parameters for the ADC and establish a reliable exposure-response relationship for the ADC. It is advisable to incorporate the TGI data from diverse preclinical tumor model for this step (42). For example, in the analysis presented in this manuscript, we have used TGI data for T-DM1 obtained from five xenograft, five patient-derived xenograft (PDX), and one orthotropic mouse model. Additionally, it is advisable to use the tumor models with diverse antigen expression levels. For the T-DM1 analysis presented here, the mouse models differed in the level of HER2 expression, and belonged to 1+, 2+, and 3+ IHC scores (see Table II). It is also advisable to use the TGI data obtained following the administration of ADC via different dosing regimens, as shown for T-DM1 in the Fig. 3. This step also allows one to obtain a biological distribution of tumor growth rates (e.g., doubling times) (Supplementary Fig. S1) and ADC efficacy parameters (e.g., killing rate) based on different animal tumor models (see Fig. 3l), which can be further used for realistic clinical trial simulations.
Step 4 involves prediction of the human PK of ADC in order to incorporate it in the PK-PD model shown in Fig. 1b for the clinical trial simulations. In both previous translation reports (Shah et al., JPKPD (11), and Betts et al., AAPSJ (13)), clinical PK of the ADC was first characterized using available clinical data and then the efficacy was predicted. However, in this paper, we have employed a more prospective strategy where clinical PK for different ADC analytes (i.e., total antibody, conjugated antibody, and unconjugated drug) is predicted a priori using preclinical data. For mAbs, it is shown that single-species allometric scaling of the monkey PK parameters provides a good a priori estimate of the human PK parameters (43). Based on this report, and our prior experience with allometric scaling of ADC PK (12), we prefer to allometrically scale up the PK of ADCs in monkey to predict the human PK. For T-DM1, the PK model shown in Fig. 1a was able to simultaneously characterize the monkey PK of all three analytes (TTmAb, T-DM1, and DM1) at two different dose levels reasonably well. There have been reports in the literature where more complex PK models have been used to characterize the deconjugation of T-DM1 and disposition of different DAR species of T-DM1 (44,45). However, most of the time the systemic PK for individual DAR species is not available, and hence, we have refrained from using those models. In addition, our previous work has shown that the 1st-order non-specific deconjugation rate constant ( ) for ADC, which is used in the model shown in Fig. 1a, is able to well characterizes the faster elimination of conjugated mAb compared to the total mAb (see Table I). In order to scale the PK of T-DM1 from monkey to human, a scaling exponent of 1 was used for both CL and V of ADC, whereas the scaling exponents of 0.75 and 1 were used for CL and Vof DM1 catabolites. While the exponents used for DM1 are typical for small molecular drugs, there are no universally accepted scaling coefficients for ADCs. For mAbs, the allometric scaling exponents vary based on whether the molecule exhibits target-mediated disposition (9,46) or linear pharmacokinetics (43,47), and the same may be true for ADC. However, on top of the mAb elimination, the PK of ADC is also determined by the deconjugation of drug from the ADC, scaling of which across the species is not yet well understood. Therefore, the scaling exponents of 1 for ADC CL and V were chosen based on our previous experience (12). The quality of allometrically scaled human PK parameters for T-DM1 was evaluated by performing Monte Carlo simulations with the scaled parameters and comparing the simulated PK profiles with the clinically observed PK profiles of different analytes of T-DM1. As shown in Fig. 6, most of the observed PK profiles for T-DM1 analytes fell within the predicted confidence intervals, suggesting that allometrically scaled PK parameters are able to represent clinical PK of T-DM1 reasonably well. Of note, development of immunogenicity against the ADC in the clinic can impair our model’s ability to a priori predict plasma PK of T-DM1 in humans, as the systemic clearance of the ADC can be affected by the presence of anti-therapeutic antibodies. However, for T-DM1, very minimal immunogenicity reactions (∼4.5%) have been reported in three different clinical trials (48), suggesting that it would not be a significant concern for our predictions.
The final step of the translational strategy (i.e., step 5) involves prediction of the clinical outcomes of ADC using the translated PK-PD model that is developed by combining the projected human PK (from step 4) and efficacy parameters estimated from preclinical TGI studies (in step 3). Since PFS is the primary end point for many clinical trials and also serves a surrogate end point for the overall survival (OS) (49), validation of the PK-PD model-predicted clinical response was performed by comparing the model generated PFS profiles with clinically observed profiles. One of the most important parameter for the clinical PK-PD model is the growth rate of the tumor. Since the growth rates for clinical tumors are much slower than the rates observed in the preclinical animal models, for T-DM1 clinical PK-PD model, the observed growth rates for HER2+ metastatic breast cancers obtained from literature reported values were used. Since there is a range of values reported for the growth rate of breast cancer in the literature (see Table III), data from different sources were integrated using the growth model provided in Eq. 19 (as explained in the “MATERIALS AND METHODS” section). Faster doubling time reported in some studies (32) served as the early exponential phase (KgExp) whereas the slower doubling time reported by others (33) was utilized as a later linear phase (KgLin). A maximum achievable tumor burden of 523.8 cm3 was used based on an assumption that a spherical tumor of 10 cm diameter will be fatal to a breast cancer patient. The validity of our predictions using literature derived tumor growth rate parameters was evaluated by generating PFS in the absence of ADC and comparing it with the clinically observed PFS in T-DM1 non-responding patients (29). In general, the model-predicted PFS values and the observed PFS values were quite similar; however, since non-responders still exhibit some degree of response with the current treatment on-board, a slight overprediction of the growth rate (i.e., faster decline in PFS) was predicted with the model (Fig. 5b). Nonetheless, these results provide confidence in our tumor growth model and our ability to predict clinical tumor growth using literature derived growth rate values for the first time.
Subsequently, the PFS predictions were made for HER2 1+ and 3+ patients using the PK-PD model that utilizes the T-DM1 efficacy parameters (KKill) estimated from the preclinical TGI studies. Information about the level of HER2 expression in different patient populations was derived from the reported semi-quantitative immunohistochemical (IHC) scores, using the same strategy that was used to estimate HER2 expression in patient-derived xenografts. The model-predicted PFS rates were found to be very similar to the clinically observed PFS values for both below-median HER2 overexpressing patients (assumed 1+) and above-median HER2 overexpressing patients (assumed 3+) (Fig. 5b). These results validated the ability of our mechanistic PK-PD model to predict the efficacy of ADC in different patient populations with different levels of antigen expression. In addition, for the first time, these results provide an evidence that our PK/PD model can be used to support the precision medicine efforts for ADCs in the clinic.
Once validated, the translated PK-PD model can be used to predict different clinical outcomes. For example, here we have used the model to simulate ORR vs. dose relationship for T-DM1. Figure 6a describes the simulated relationship, which suggest that marginal (e.g., 2-fold) increase in the clinical dose (3.6 mg/kg given Q3W) of T-DM1 is not expected to improve the efficacy or change the ORRs significantly. We have also used the translated PK-PD model to evaluate the effects of alternative dosing regimens on the simulated PFS for T-DM1 in HER2 1+ and 3+ patients. As shown in Fig. 6b, c, model simulations suggested that the two different fractionated dosing regimens (1.2 mg/kg given Q1W and 3.0 + 0.3 + 0.3 mg/kg given on days 0, 7, and 14 of a 21-day cycle) were relatively more efficacious than the clinically approved dosing regimen. The increased benefit was more prominent in “high HER2-expressing” (HER2 3+) population as compared to “low HER2-expressing” (HER2 1+) population. Of note, there was a substantial delay of 2–4 months (3–4 cycles) before the improved tumor responses were observed with the fractionated dosing regimen, and based on the modeling analysis, we hypothesize that this was due to the amount of time needed for accumulation of enough drug (DM1 catabolites) in the tumor with the new regimen. Jumbe et al. (20) have also evaluated different dosing regimens for T-DM1 (Q1W, Q2W, and Q3W) in preclinical HER2-expressing animal models (BT474EEI and F05). They concluded that there was no improvement in the efficacy of ADC when a fractionated dosing regimen was used. The discrepancy between our clinical simulations and preclinical observations by Jumbe et al. may stem from the use of very high ADC dose (i.e., 15 mg/kg) in the preclinical study. At this high dose (∼4.5-fold higher than the clinically approved dose of 3.6 mg/kg), all the regimens may be very efficacious, and it may be hard to assess the differences in the efficacy with different dosing regimens. While the fractionated dosing regimen has been shown to be more efficacious for other ADCs (50), superiority of the fractionated dosing regimen for T-DM1 can only be evaluated once the PK-PD model is also combined with the PK-TD model (51) to assess how the therapeutic index (TI) for the ADC changes with this regimen.
While the translational strategy presented here is capable of a priori predicting clinical PK-PD of ADCs, there are several issues that need to be considered before implementing it. This strategy heavily relies on preclinical data to accomplish the end goal. Thus, if the ADC used for clinical translation is produced in-house, one needs to generate a wealth of data to support this strategy. On the other hand, if most of the preclinical data for this work come from published studies, the error associated with digitization of data and misinterpretation of published experimental methods needs to be considered. If the strategy is used to predict clinical PK and efficacy of an ADC that is at the discovery or early development stage, one needs to keep in mind that there may not be a way to validate the predictions made by the model. Lastly, it is also important to keep in mind that the predictions made by the model are only approximations, and the quality of the predictions is as good as the quality of the parameter values used to perform clinical simulations with the model.
In summary, here we have presented a generalized PK-PD M&S-based strategy for preclinical-to-clinical translation of ADCs, using T-DM1 as an example. This strategy has been now retrospectively validated for multiple clinically approved ADC molecules with varying drug-linker chemistries. In this paper, we have specifically presented the capability of the translated PK-PD model to a priori predict PFS for T-DM1 in different patient populations. The model was also able to provide an insight into how the ORRs and PFS for the ADC will change based on a change in the clinically approved dosing regimen for the ADC. While the validation presented here was for a clinically approved ADC, all the translational steps were blinded to the availability of clinical data, providing us confidence that the strategy presented in this manuscript can serve as a valuable tool for bench-to-bedside translation of other novel ADC molecules.
Supplementary Material
Acknowledgments
This work was supported by NIH grant GM114179 to D.K.S and the Centre for Protein Therapeutics Consortium at University at Buffalo. The authors would also like to thank Dr. Wojciech Krzyzanski, Dr. Robert Bies, and Olivia Campagne for their technical advice while performing the modeling analysis for this paper.
Footnotes
Electronic supplementary material The online version of this article (doi:10.1208/s12248-017-0071-y) contains supplementary material, which is available to authorized users.
References
- 1.Kovtun YV, Goldmacher VS. Cell killing by antibody-drug conjugates. Cancer Lett. 2007;255(2):232–40. doi: 10.1016/j.canlet.2007.04.010. [DOI] [PubMed] [Google Scholar]
- 2.Mullard A. Maturing antibody-drug conjugate pipeline hits 30. Nat Rev Drug Discov. 2013;12(5):329–32. doi: 10.1038/nrd4009. [DOI] [PubMed] [Google Scholar]
- 3.THE CLINICAL LANDSCAPE OF ANTIBODY-DRUG CONJUGATES [Internet] 2014 Available from: http://adcreview.com/articles/doi-10-14229jadc-2014-8-1-001/.
- 4.Diamantis N, Banerji U. Antibody-drug conjugates—an emerging class of cancer treatment. Br J Cancer. 2016;114(4):362–7. doi: 10.1038/bjc.2015.435. [DOI] [PMC free article] [PubMed] [Google Scholar]
- 5.Schumacher D, Hackenberger CP, Leonhardt H, Helma J. Current status: site-specific antibody drug conjugates. J Clin Immunol. 2016;36(Suppl 1):100–7. doi: 10.1007/s10875-016-0265-6. [DOI] [PMC free article] [PubMed] [Google Scholar]
- 6.Ansell SM. Brentuximab vedotin. Blood. 2014;124(22):3197–200. doi: 10.1182/blood-2014-06-537514. [DOI] [PubMed] [Google Scholar]
- 7.Verma S, Miles D, Gianni L, Krop IE, Welslau M, Baselga J, et al. Trastuzumab emtansine for HER2-positive advanced breast cancer. N Engl J Med. 2012;367(19):1783–91. doi: 10.1056/NEJMoa1209124. [DOI] [PMC free article] [PubMed] [Google Scholar]
- 8.Singh AP, Shin YG, Shah DK. Application of pharmacokinetic-pharmacodynamic modeling and simulation for antibody-drug conjugate development. Pharm Res. 2015;32(11):3508–25. doi: 10.1007/s11095-015-1626-1. [DOI] [PubMed] [Google Scholar]
- 9.Singh AP, Krzyzanski W, Martin SW, Weber G, Betts A, Ahmad A, et al. Quantitative prediction of human pharmacokinetics for mAbs exhibiting target-mediated disposition. AAPS J. 2015;17(2):389–99. doi: 10.1208/s12248-014-9690-8. [DOI] [PMC free article] [PubMed] [Google Scholar]
- 10.Shah DK, King LE, Han X, Wentland JA, Zhang Y, Lucas J, et al. A priori prediction of tumor payload concentrations: preclinical case study with an auristatin-based anti-5T4 antibody-drug conjugate. AAPS J. 2014;16(3):452–63. doi: 10.1208/s12248-014-9576-9. [DOI] [PMC free article] [PubMed] [Google Scholar]
- 11.Shah DK, Haddish-Berhane N, Betts A. Bench to bedside translation of antibody drug conjugates using a multiscale mechanistic PK/PD model: a case study with brentuximab-vedotin. J Pharmacokinet Pharmacodyn. 2012;39(6):643–59. doi: 10.1007/s10928-012-9276-y. [DOI] [PubMed] [Google Scholar]
- 12.Haddish-Berhane N, Shah DK, Ma D, Leal M, Gerber HP, Sapra P, et al. On translation of antibody drug conjugates efficacy from mouse experimental tumors to the clinic: a PK/PD approach. J Pharmacokinet Pharmacodyn. 2013;40(5):557–71. doi: 10.1007/s10928-013-9329-x. [DOI] [PubMed] [Google Scholar]
- 13.Betts AM, Haddish-Berhane N, Tolsma J, Jasper P, King LE, Sun Y, et al. Preclinical to clinical translation of antibody-drug conjugates using PK/PD modeling: a retrospective analysis of inotuzumab ozogamicin. AAPS J. 2016;18(5):1101–16. doi: 10.1208/s12248-016-9929-7. [DOI] [PubMed] [Google Scholar]
- 14.Singh AP, Maass KF, Betts AM, Wittrup KD, Kulkarni C, King LE, et al. Evolution of antibody-drug conjugate tumor disposition model to predict preclinical tumor pharmacokinetics of trastuzumab-emtansine (T-DM1) AAPS J. 2016;18(4):861–75. doi: 10.1208/s12248-016-9904-3. [DOI] [PMC free article] [PubMed] [Google Scholar]
- 15.Thurber GM, Schmidt MM, Wittrup KD. Antibody tumor penetration: transport opposed by systemic and antigenmediated clearance. Adv Drug Deliv Rev. 2008;60(12):1421–34. doi: 10.1016/j.addr.2008.04.012. [DOI] [PMC free article] [PubMed] [Google Scholar]
- 16.Thurber GM, Schmidt MM, Wittrup KD. Factors determining antibody distribution in tumors. Trends Pharmacol Sci. 2008;29(2):57–61. doi: 10.1016/j.tips.2007.11.004. [DOI] [PMC free article] [PubMed] [Google Scholar]
- 17.Schmidt MM, Wittrup KD. A modeling analysis of the effects of molecular size and binding affinity on tumor targeting. Mol Cancer Ther. 2009;8(10):2861–71. doi: 10.1158/1535-7163.MCT-09-0195. [DOI] [PMC free article] [PubMed] [Google Scholar]
- 18.Simeoni M, Magni P, Cammia C, De Nicolao G, Croci V, Pesenti E, et al. Predictive pharmacokinetic-pharmacodynamic modeling of tumor growth kinetics in xenograft models after administration of anticancer agents. Cancer Res. 2004;64(3):1094–101. doi: 10.1158/0008-5472.can-03-2524. [DOI] [PubMed] [Google Scholar]
- 19.van der Lee MM, Groothuis PG, Ubink R, van der Vleuten MA, van Achterberg TA, Loosveld EM, et al. The preclinical profile of the duocarmycin-based HER2-targeting ADC SYD985 predicts for clinical benefit in low HER2-expressing breast cancers. Mol Cancer Ther. 2015;14(3):692–703. doi: 10.1158/1535-7163.MCT-14-0881-T. [DOI] [PubMed] [Google Scholar]
- 20.Jumbe NL, Xin Y, Leipold DD, Crocker L, Dugger D, Mai E, et al. Modeling the efficacy of trastuzumab-DM1, an antibody drug conjugate, in mice. J Pharmacokinet Pharmacodyn. 2010;37(3):221–42. doi: 10.1007/s10928-010-9156-2. [DOI] [PubMed] [Google Scholar]
- 21.Lewis Phillips GD, Li G, Dugger DL, Crocker LM, Parsons KL, Mai E, et al. Targeting HER2-positive breast cancer with trastuzumab-DM1, an antibody-cytotoxic drug conjugate. Cancer Res. 2017;68(22):9280–90. doi: 10.1158/0008-5472.CAN-08-1776. [DOI] [PubMed] [Google Scholar]
- 22.Cretella D, Saccani F, Quaini F, Frati C, Lagrasta C, Bonelli M, et al. Trastuzumab emtansine is active on HER-2 overexpressing NSCLC cell lines and overcomes gefitinib resistance. Mol Cancer. 2014;13:143. doi: 10.1186/1476-4598-13-143. [DOI] [PMC free article] [PubMed] [Google Scholar]
- 23.Lambert JM, Chari RV. Ado-trastuzumab emtansine (T-DM1): an antibody-drug conjugate (ADC) for HER2-positive breast cancer. J Med Chem. 2014;57(16):6949–64. doi: 10.1021/jm500766w. [DOI] [PubMed] [Google Scholar]
- 24.Yamashita-Kashima Y, Shu S, Harada N, Fujimoto-Ouchi K. Enhanced antitumor activity of trastuzumab emtansine (T-DM1) in combination with pertuzumab in a HER2-positive gastric cancer model. Oncol Rep. 2013;30(3):1087–93. doi: 10.3892/or.2013.2547. [DOI] [PubMed] [Google Scholar]
- 25.Pfizer to discontinue commercial availability of Mylotarg for AML in US. 2010 Available from: http://www.news-medical.net/news/20100622/Pfizer-to-discontinue-commercial-availability-of-Mylotarg-for-AML-in-US.aspx.
- 26.Poon KA, Flagella K, Beyer J, Tibbitts J, Kaur S, Saad O, et al. Preclinical safety profile of trastuzumab emtansine (T-DM1): mechanism of action of its cytotoxic component retained with improved tolerability. Toxicol Appl Pharmacol. 2013;273(2):298–313. doi: 10.1016/j.taap.2013.09.003. [DOI] [PubMed] [Google Scholar]
- 27.Samuel Agresta BK. Inventor methods of treating metastatic breast cancer with trastuzumab-mcc-DMI. USA: 2010. [Google Scholar]
- 28.Hurvitz SA, Dirix L, Kocsis J, Bianchi GV, Lu J, Vinholes J, et al. Phase II randomized study of trastuzumab emtansine versus trastuzumab plus docetaxel in patients with human epidermal growth factor receptor 2-positive metastatic breast cancer. J Clin Oncol Off J Am Soc Clin Oncol. 2013;31(9):1157–63. doi: 10.1200/JCO.2012.44.9694. [DOI] [PubMed] [Google Scholar]
- 29.Burris HA, 3rd, Rugo HS, Vukelja SJ, Vogel CL, Borson RA, Limentani S, et al. Phase II study of the antibody drug conjugate trastuzumab-DM1 for the treatment of human epidermal growth factor receptor 2 (HER2)-positive breast cancer after prior HER2-directed therapy. J Clin Oncol Off J Am Soc Clin Oncol. 2011;29(4):398–405. doi: 10.1200/JCO.2010.29.5865. [DOI] [PubMed] [Google Scholar]
- 30.Krop IE, LoRusso P, Miller KD, Modi S, Yardley D, Rodriguez G, et al. A phase II study of trastuzumab emtansine in patients with human epidermal growth factor receptor 2-positive metastatic breast cancer who were previously treated with trastuzumab, lapatinib, an anthracycline, a taxane, and capecitabine. J Clin Oncol Off J Am Soc Clin Oncol. 2012;30(26):3234–41. doi: 10.1200/JCO.2011.40.5902. [DOI] [PubMed] [Google Scholar]
- 31.Bernadou G, Campone M, Merlin JL, Gouilleux-Gruart V, Bachelot T, Lokiec F, et al. Influence of tumour burden on trastuzumab pharmacokinetics in HER2 positive non-metastatic breast cancer. Br J Clin Pharmacol. 2016;81(5):941–8. doi: 10.1111/bcp.12875. [DOI] [PMC free article] [PubMed] [Google Scholar]
- 32.Pearlman AW. Breast cancer—influence of growth rate on prognosis and treatment evaluation: a study based on mastectomy scar recurrences. Cancer. 1976;38(4):1826–33. doi: 10.1002/1097-0142(197610)38:4<1826::aid-cncr2820380460>3.0.co;2-l. [DOI] [PubMed] [Google Scholar]
- 33.Weedon-Fekjaer H, Lindqvist BH, Vatten LJ, Aalen OO, Tretli S. Breast cancer tumor growth estimated through mammography screening data. Breast Cancer Research: BCR. 2008;10(3):R41. doi: 10.1186/bcr2092. [DOI] [PMC free article] [PubMed] [Google Scholar]
- 34.Eisenhauer EA, Therasse P, Bogaerts J, Schwartz LH, Sargent D, Ford R, et al. New response evaluation criteria in solid tumours: revised RECIST guideline (version 1.1) Eur J Cancer. 2009;45(2):228–47. doi: 10.1016/j.ejca.2008.10.026. [DOI] [PubMed] [Google Scholar]
- 35.David Z, D’Argenio AS, Wang X. ADAPT 5 user’s guide: pharmacokinetic/pharmacodynamic systems analysis software. Los Angeles: Biomedical Simulations Resource; 2009. [Google Scholar]
- 36.Tang H, Mayersohn M. A novel model for prediction of human drug clearance by allometric scaling. Drug Metab Dispos. 2005;33(9):1297–303. doi: 10.1124/dmd.105.004143. [DOI] [PubMed] [Google Scholar]
- 37.Immunogen discontinues IMGN901 study in small-cell lung cancer (SCLC) Available from: http://adcreview.com/news/immunogen-discontinues-imgn901-study-small-cell-lung-cancer-sclc/
- 38.Seattle genetics announces phase IIb trial of lintuzumab (SGN-33) in patients with acute myeloid leukemia (AML) did not meet primary endpoint. 2010 Available from: http://www.businesswire.com/news/home/20100913005867/en/Seattle-Genetics-Announces-Phase-IIb-Trial-Lintuzumab.
- 39.Mak IW, Evaniew N, Ghert M. Lost in translation: animal models and clinical trials in cancer treatment. Am J Transl Res. 2014;6(2):114–8. [PMC free article] [PubMed] [Google Scholar]
- 40.Peterson JK, Houghton PJ. Integrating pharmacology and in vivo cancer models in preclinical and clinical drug development. Eur J Cancer. 2004;40(6):837–44. doi: 10.1016/j.ejca.2004.01.003. [DOI] [PubMed] [Google Scholar]
- 41.Wong H, Choo EF, Alicke B, Ding X, La H, McNamara E, et al. Antitumor activity of targeted and cytotoxic agents in murine subcutaneous tumor models correlates with clinical response. Clin Cancer Res. 2012;18(14):3846–55. doi: 10.1158/1078-0432.CCR-12-0738. [DOI] [PubMed] [Google Scholar]
- 42.Ruggeri BA, Camp F, Miknyoczki S. Animal models of disease: pre-clinical animal models of cancer and their applications and utility in drug discovery. Biochem Pharmacol. 2014;87(1):150–61. doi: 10.1016/j.bcp.2013.06.020. [DOI] [PubMed] [Google Scholar]
- 43.Deng R, Iyer S, Theil FP, Mortensen DL, Fielder PJ, Prabhu S. Projecting human pharmacokinetics of therapeutic antibodies from nonclinical data: what have we learned? MAbs. 2011;3(1):61–6. doi: 10.4161/mabs.3.1.13799. [DOI] [PMC free article] [PubMed] [Google Scholar]
- 44.Chudasama VL, Schaedeli Stark F, Harrold JM, Tibbitts J, Girish SR, Gupta M, et al. Semi-mechanistic population pharmacokinetic model of multivalent trastuzumab emtansine in patients with metastatic breast cancer. Clin Pharmacol Ther. 2012;92(4):520–7. doi: 10.1038/clpt.2012.153. [DOI] [PMC free article] [PubMed] [Google Scholar]
- 45.Bender B, Leipold DD, Xu K, Shen BQ, Tibbitts J, Friberg LE. A mechanistic pharmacokinetic model elucidating the disposition of trastuzumab emtansine (T-DM1), an antibody-drug conjugate (ADC) for treatment of metastatic breast cancer. AAPS J. 2014;16(5):994–1008. doi: 10.1208/s12248-014-9618-3. [DOI] [PMC free article] [PubMed] [Google Scholar]
- 46.Dong JQ, Salinger DH, Endres CJ, Gibbs JP, Hsu CP, Stouch BJ, et al. Quantitative prediction of human pharmacokinetics for monoclonal antibodies: retrospective analysis of monkey as a single species for first-in-human prediction. Clin Pharmacokinet. 2011;50(2):131–42. doi: 10.2165/11537430-000000000-00000. [DOI] [PubMed] [Google Scholar]
- 47.Oitate M, Masubuchi N, Ito T, Yabe Y, Karibe T, Aoki T, et al. Prediction of human pharmacokinetics of therapeutic monoclonal antibodies from simple allometry of monkey data. Drug Metab Pharmacokinet. 2011;26(4):423–30. doi: 10.2133/dmpk.dmpk-11-rg-011. [DOI] [PubMed] [Google Scholar]
- 48.Girish S, Gupta M, Wang B, Lu D, Krop IE, Vogel CL, et al. Clinical pharmacology of trastuzumab emtansine (T-DM1): an antibody-drug conjugate in development for the treatment of HER2-positive cancer. Cancer Chemother Pharmacol. 2012;69(5):1229–40. doi: 10.1007/s00280-011-1817-3. [DOI] [PMC free article] [PubMed] [Google Scholar]
- 49.Beauchemin C, Johnston JB, Lapierre ME, Aissa F, Lachaine J. Relationship between progression-free survival and overall survival in chronic lymphocytic leukemia: a literature-based analysis. Curr Oncol. 2015;22(3):e148–56. doi: 10.3747/co.22.2119. [DOI] [PMC free article] [PubMed] [Google Scholar]
- 50.Daniel J, DeAngelo MS, Martinelli G, Kantarjian H, Liedtke M, Stock W, Goekbuget N, Wang K, Pacagnella L, Sleight B, Vandendries E, Advani AS. Efficacy and safety of inotuzumab ozogamicin (INO) vs standard of care (SOC) in salvage 1 or 2 patients with acute lymphoblastic leukemia (ALL): an ongoing global phase 3 study. Vienna: European Hematology Association; 2015. [Google Scholar]
- 51.Bender BC, Schaedeli-Stark F, Koch R, Joshi A, Chu YW, Rugo H, et al. A population pharmacokinetic/pharmacodynamic model of thrombocytopenia characterizing the effect of trastuzumab emtansine (T-DM1) on platelet counts in patients with HER2-positive metastatic breast cancer. Cancer Chemother Pharmacol. 2012;70(4):591–601. doi: 10.1007/s00280-012-1934-7. [DOI] [PubMed] [Google Scholar]
Associated Data
This section collects any data citations, data availability statements, or supplementary materials included in this article.