

Abstract
The human gut microbiota produces dozens of metabolites that accumulate in the bloodstream1,2, where they can have systemic effects on the host. Although these small molecules commonly reach concentrations similar to those achieved by pharmaceutical agents, remarkably little is known about the microbial metabolic pathways that produce them. Here we use a combination of genetics and metabolic profiling to characterize a pathway from the gut symbiont Clostridium sporogenes that generates aromatic amino acid metabolites. Our results reveal that this pathway produces twelve compounds, nine of which are known to accumulate in host serum. All three aromatic amino acids (tryptophan, phenylalanine and tyrosine) serve as substrates for the pathway, and it involves branching and alternative reductases for specific intermediates. By genetically manipulating C. sporogenes, we modulate serum levels of these metabolites in gnotobiotic mice, and show that in turn this affects intestinal permeability and systemic immunity. This work has the potential to provide the basis of a systematic effort to engineer the molecular output of the gut bacterial community.
Changes in the composition of the gut microbiota have been connected to aspects of host physiology and human disease. However, much of the work to date remains associative; relatively few microbe–host interactions have been defined at the level of molecular mechanisms. One of the contributions of gut bacteria to host biology is the circulating pool of bacterially derived small-molecule metabolites1, which can reach or exceed concentrations achieved by a typical drug dose (10 μM–1 mM). In many cases, these compounds exhibit specificity by engaging receptors and altering host biology. There are three central challenges for establishing connections between microbial metabolism and host health, and ultimately treatment modalities. The first is to characterize the biological activities of these metabolites, including their relevance to human disease. The second is to identify the metabolic pathways responsible for their production, which will enable the prediction of metabolic output directly from sequencing data. The third is to use this knowledge to enable genetic engineering and synthetic ecology to reprogram the metabolic output of the gut community.
Here we sought to identify the pathway that C. sporogenes, a gut bacterium from the phylum Firmicutes, uses to produce indolepropionic acid (IPA). IPA is a metabolite produced exclusively by the microbiota from dietary tryptophan that accumulates in host serum and exhibits a high degree of inter-individual variation3. Recent studies have shown that IPA can fortify the intestinal barrier by directly engaging the pregnane X receptor (PXR)4. IPA also has potent radical-scavenging activity and has received considerable attention for its neuroprotective properties5. Despite broad interest, the source of IPA production in the gut has remained unknown.
Previous studies have shown that a small number of bacteria, including C. sporogenes and Clostridium botulinum, can produce IPA from tryptophan2,6. These species also metabolize phenylalanine and tyrosine to their corresponding propionic acid derivatives (phenylpropionic acid (PPA) and 4-hydroxyphenylpropionic acid (4-OH-PPA))6. Reductive phenylalanine metabolism by C. sporogenes has been studied and most of the enzymes involved in PPA production have been purified and biochemically characterized7,8. The most energetically demanding step in this pathway is the dehydration of phenyllactic acid to t-cinnamic acid, catalysed by the heterotrimeric enzyme phenyllactate dehydratase (FldABC). Owing to the poor acidity of the β-hydrogen, this reaction requires the activation of phenyllactic acid as a coenzyme A thioester7 and a charge reversal (or Umpolung) at the α-carbon involving a highly reactive ketyl radical that helps to acidify the β-hydrogen8. We hypothesized that IPA might arise from a pathway similar to PPA and would therefore require a paralogous dehydratase to catalyse this chemically complex step.
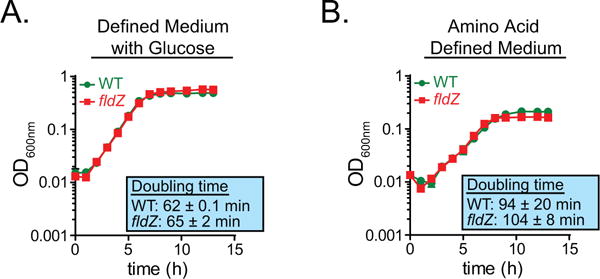
A computational search of the C. sporogenes genome (Extended Data Fig. 1) failed to identify a closely related dehydratase. Therefore, we reasoned that phenyllactate dehydratase itself might be involved in IPA production. The phenyllactate dehydratase genes are part of a 15-kb cluster in the C. sporogenes chromosome (Fig. 1). We chose to selectively disrupt the fldC subunit of the phenyllactate dehydratase via insertion of a ClosTron cassette9, because, on the basis of genomic context, insertional mutagenesis of this subunit was likely to have fewer polar effects, owing to its 3′ position within the cassette relative to the two other subunits (Extended Data Fig. 2). To study the effect of this mutation on C. sporogenes, we cultured the wild-type and mutant strains in a defined minimal medium containing ten essential amino acids at standard concentrations10 (standard amino acid complete medium; Supplementary Table 1). In this basal medium, wild-type C. sporogenes exhibited exponential growth characteristics with a doubling time of 82 ± 2 min, but the fldC mutant exhibited a growth defect, with a doubling time of 160 ± 10 min (Fig. 2a). Addition of glucose to the basal medium restored the growth characteristics of the mutant to wild-type levels (Fig. 2b), indicating that the fldC mutant suffers from impaired amino acid metabolism. Liquid chromatography-tandem mass spectrometry (LC–MS/MS) analysis of the supernatants showed that IPA accumulated in the supernatant of wild-type C. sporogenes, but not the fldC mutant (Fig. 2c). Similarly, levels of PPA and 4-OH-PPA were high in wild-type supernatants, but were very low or undetectable in the fldC mutant (Fig. 2c). Collectively, these results indicate that fldC is essential for the reductive metabolism of all three aromatic amino acids (AAAs) and provide genetic evidence for a shared reductive pathway.
Figure 1. Genes in the reductive pathway of phenylalanine metabolism map to a conserved gene cluster.
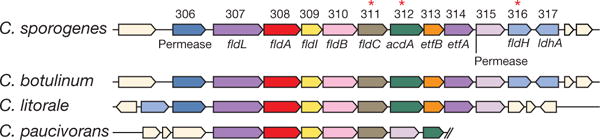
Gene designations are indicated as follows: fldL, acyl-CoA ligase; fldA, acyl-CoA transferase; fldI, dehydratase activator; fldB, phenyllactate dehydratase subunit; fldC, phenyllactate dehydratase subunit; acdA, acyl-CoA dehydrogenase; etfB, electron transport flavoprotein subunit B; etfA, electron transport flavoprotein subunit A; fldH, phenyllactate dehydrogenase; ldhA, lactate dehydrogenase. Asterisks indicate genes targeted for disruption.
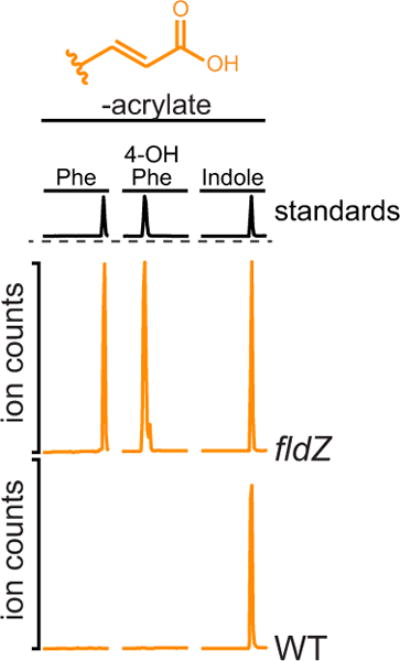
Figure 2. A pathway for reductive aromatic amino acid metabolism by members of the gut microbiota.
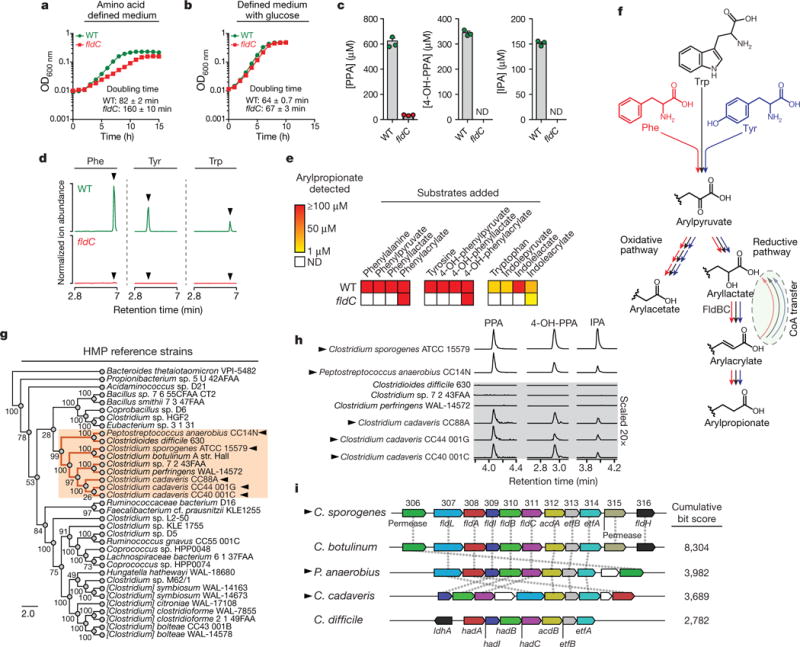
a, b, The fldC mutant exhibits a growth defect during AAA metabolism. OD, optical density; WT, wild type. c, Metabolite analysis of supernatants from cultures in a. d, e, The fldC mutant exhibits a defect in reductive metabolism of AAAs. ND, not detected. f, Summary of the predicted pathway for AAA metabolism showing phenyllactate dehydratase (FldBC). g, Phylogenetic distribution of reference strains. h, Metabolite screening identifies AAA-reducing strains. i, AAA-reducing microbes share similar gene clusters with C. sporogenes. hadA, isocaproyl-CoA:2-hydroxyisocaproate CoA transferase; hadI, 2-hydroxyisocaproyl-CoA dehydratase activator; hadBC, 2-hydroxyisocaproyl-CoA dehydratase; acdB, acyl-CoA dehydrogenase. a, b, d, h, Representative curves from n = 3 biological replicates are shown; a–c, Data are mean ± s.d. Arrowheads in d mark retention times for arylpropionates. Arrowheads in g, h, i indicate strains capable of AAA reduction.
Because of the nutritional requirements of C. sporogenes, the growth medium needs to be supplemented with ten amino acids (including the AAAs of interest), which complicates analysis of the mutants. Therefore, to assess the metabolic blockade in the fldC mutant, cell suspensions were prepared in which amino acids derived from the growth medium were washed away. Resting cell suspensions of wild-type and mutant C. sporogenes were incubated with each aromatic amino acid substrate individually or with the presumed intermediates along the reductive pathway, and the final products of reductive and oxidative AAA metabolism (arylpropionate and arylacetate, respectively) were assessed in the supernatants by LC–MS/MS. After incubation of wild-type C. sporogenes with phenylalanine, tyrosine and tryptophan, we observed robust production of PPA, 4-OH-PPA and IPA (Fig. 2d). Consistent with our findings in actively dividing cultures, these three products were undetectable in the fldC mutant strain (Fig. 2d). Similarly, wild-type, but not fldC mutant, cells could convert the arylpyruvic acid and aryllactic acid to the corresponding arylpropionic acids, suggesting that FldC acts downstream of the transamination and initial reduction steps. However, the fldC mutant transformed phenylacrylate, 4-OH-phenylacrylate and indoleacrylate (the presumed dehydratase products) to their corresponding propionic acids (Fig. 2e). Taken together, these findings show that fldC is required for the biosynthesis of IPA, 4-OH-PPA and PPA, and they reveal that reductive AAA metabolism in C. sporogenes proceeds through a common pathway involving phenyllactate dehydratase as its penultimate step (Fig. 2f).
C. sporogenes is the only gut bacterium currently known to produce IPA. Having identified the C. sporogenes genes that encode the production of IPA, we asked whether the capacity to make IPA is shared by other gut-derived bacteria. To address this question, we obtained 40 bacterial isolates (Supplementary Table 2) from the Human Microbiome Project (HMP), focusing on members of the phylum Firmicutes, because reductive AAA metabolism has not been demonstrated in other phyla. Phylogenetic analysis based on the sequence of the RpoB protein revealed broad taxonomic representation among strains selected for this analysis, representing 8 families (Fig. 2g). These bacteria were then cultured in reinforced clostridial medium (RCM), and the supernatants were analysed by liquid chromatography–quadrupole–time of flight mass spectrometry. Of the 40 strains tested, 36 grew in RCM, 31 of which exhibited undetectable arylpropionate levels. As expected, dominant peaks corresponding to the three arylpropionates were detected in C. sporogenes supernatants (Fig. 2h). Notably, we identified four new IPA-producing gut bacteria: Peptostreptococcus anaerobius CC14N and three strains of Clostridium cadaveris (Fig. 2h). These bacteria are phylogenetically distinct from C. sporogenes (Fig. 2g), so we investigated whether they carry similar phenyllactate dehydratase gene clusters. We assembled genomes for these four strains from deposited Illumina sequence reads and included the assembled genomes in a search of 1,868 available HMP reference genomes for homologues of the phenyllactate dehydratase gene cluster. In this analysis, we also included Clostridioides difficile 630, which was previously documented as a non-IPA producing organism6, and C. botulinum, a known IPA-producer6. As expected, C. botulinum carries a gene cluster that is syntenic with the cluster from C. sporogenes, and C. difficile does not possess a similar gene cluster (highest score was for the reductive leucine gene cluster hadAIBC) (Fig. 2i). Among all HMP genomes analysed, the most similar gene clusters were identified in the genomes of P anaerobius CC14N, the three C. cadaveris strains, and three additional P anaerobius strains represented in the HMP database. Overall, these findings reveal that the capacity of gut bacteria to produce IPA is more general than previously thought. Furthermore, our results suggest that the presence of homologues to the phenyllactate dehydratase gene cluster is a reliable marker of IPA-producing bacteria.
To further characterize the AAA metabolic pathway, we next created four additional mutants in genes (porA, fldH, acdA, fldZ) that we hypothesized had roles in either oxidative or reductive AAA metabolism. Results from analysis of the mutants (Fig. 3, Extended Data Figs 3–7, Supplementary Discussion and Supplementary Table 3) support the following conclusions: (i) fldH, fldC and acdA are essential for the reductive metabolism of all three AAA; (ii) porA is important for the oxidative metabolism of phenylalanine and tyrosine, but is not involved in tryptophan oxidation; and (iii) fldZ is unlikely to be involved in reductive AAA metabolism.
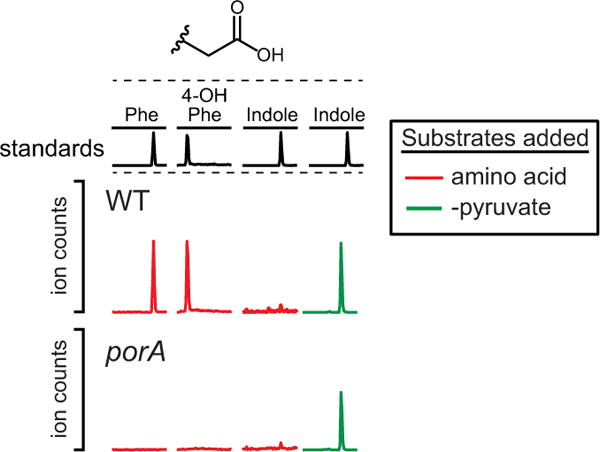
Figure 3. Metabolite profiling reveals shared and divergent features in AAA metabolic pathways.
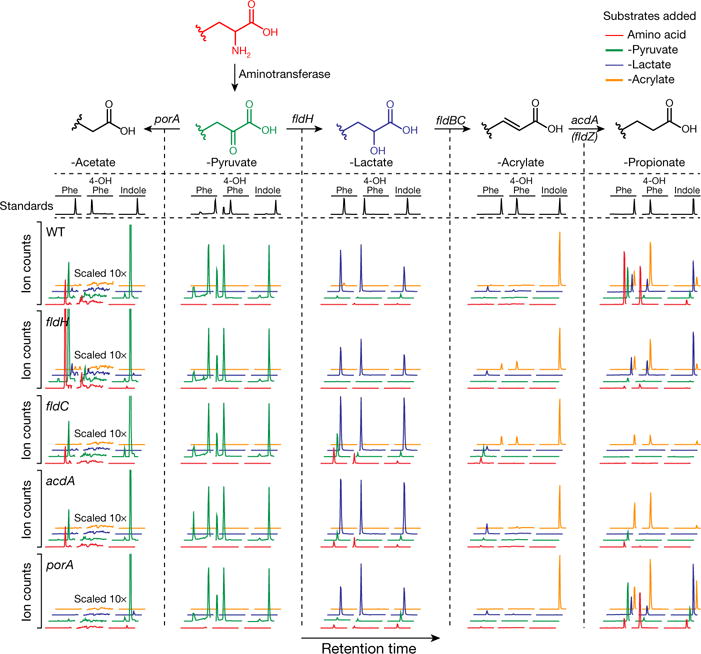
Mutant and wild-type C. sporogenes were incubated with phenylalanine, tyrosine and tryptophan derivatives of each of the four coloured compounds and metabolites were assayed by LC-MS/MS. Compared to wild-type, the fldH, fldC and acdA mutants were deficient in reductive metabolism of phenylalanine, tyrosine and tryptophan (rows 1–4, column 5, red and green traces). Relative to wild-type, the porA mutant was deficient in oxidative metabolism of phenylalanine and tyrosine, but not tryptophan (rows 1 and 5, column 1, red and green traces). Representative chromatograms from n = 3 biological replicates. Phe, phenyl; 4-OH-Phe, 4-hydroxyphenyl.
Having genetically explored the aryl amino acid metabolic pathway, we next investigated whether these mutants could be used to control circulating metabolites in the host during intestinal colonization. We chose to focus on the tryptophan-derived metabolites from the pathway (Fig. 4a), because they are known to accumulate in host serum in a microbiota-dependent fashion2. We inoculated germ-free mice with either wild-type C. sporogenes or the fldC mutant (n = 5, each group) for four weeks and measured tryptophan metabolites in the serum by LC–MS/MS. Wild-type and mutant strains colonized the intestine to similar levels over the course of the experiment, as determined by measurements of colony-forming units in faeces. In mice colonized by the wild-type strain, the mean IPA concentration was around 80 μM, but in mice colonized with the fldC mutant, IPA was undetectable (Fig. 4b) (lower limit of detection, approximately 8 nM). Levels of other metabolites upstream of the fldC blockade were significantly increased in mice colonized with the fldC mutant (red arrows in Fig. 4a). These results demonstrate that, in an experimental model host, genetic manipulation of a gut commensal can be used to alter the levels of three high-concentration microbiota-derived serum metabolites.
Figure 4. Gut bacteria-driven modulation of mouse serum metabolites alters host immune activation and intestinal permeability.
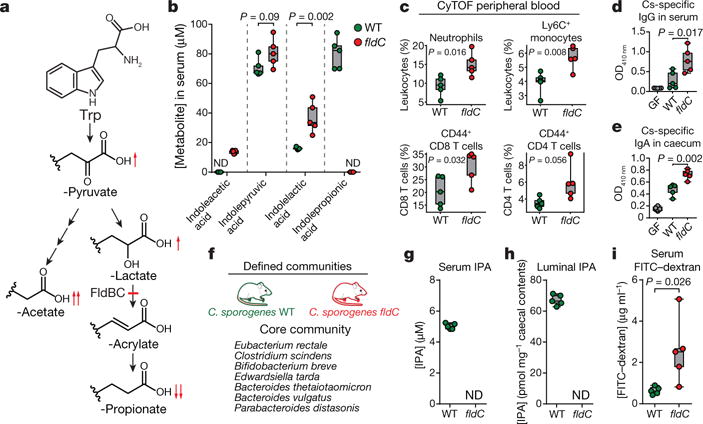
a, Tryptophan metabolism by C. sporogenes. b–e, Germ-free (GF) mice were mono-colonized with the wild-type strain or the fldC mutant. b, Altered tryptophan metabolites in fldC-colonized mice. c, Immune cell subsets in peripheral blood analysed using mass cytometry (CyTOF). d, e, Bacterial indirect ELISA. f, Defined community experiment. g–i, Germ-free mice were colonized with organisms listed in f, including either WT or fldC mutant C. sporogenes. g, h, IPA was quantified in serum (g) or caecal contents (h) by LC-MS/MS. i, FITC-dextran intestinal permeability. b–e, g–i, Box and whisker plots show median values, 25th–75th percentiles and range for n = 5 biological replicates. b–e, i, P values are shown from two-tailed, unpaired t-tests.
Manipulation of microbiota-derived metabolites represents a novel and potentially powerful strategy for altering the physiological status of the host. Colonization with live C. sporogenes decreases intestinal permeability in a PXR-dependent fashion and IPA is thought to be the major molecular switch for this process4. Because gut barrier dysfunction is associated with increased mucosal immune activation11, we hypothesized that modulating IPA levels would alter host immunity. We first characterized immune cell profiles in the peripheral blood using mass cytometry to identify global changes to host immune phenotype12. Animals colonized by the fldC mutant exhibited significantly elevated frequencies of circulating myeloid cells, including neutrophils and classical (Ly6C+) monocytes, as well as increased antigen-experienced effector/memory T cells (both CD4+ and CD8+) (Fig. 4c, Extended Data Figs 8–10). We reasoned that this activation of both innate and adaptive arms of the immune system may be accompanied by specificity of the immune response to C. sporogenes. To evaluate the host adaptive immune response to this gut commensal, we assayed C. sporogenes-specific serum IgG and caecal IgA in mice colonized by fldC mutant or wild-type C. sporogenes using whole bacterial cell enzyme-linked immunosorbent assays (ELISA). These experiments revealed a significant increase in circulating C. sporogenes-specific IgG in mice colonized by the IPA-deficient fldC mutant compared to wild-type colonized mice (Fig. 4d). Furthermore, IgA secreted into the lumen of the gut was increased in mice colonized by the fldC mutant (Fig. 4e). These results show that by altering microbiota-derived metabolites, we can elicit broad changes in host immune activation and induce pervasive changes in bacteria-specific humoral immunity.
We next investigated whether genetic modulation of C. sporogenes metabolic output is robust to colonization in the context of a more complex microbial community. To evaluate this, we colonized mice with either wild-type or fldC mutant C. sporogenes in the background of a defined microbial community consisting of prominent non-IPA-producing gut bacterial isolates designed to recapitulate phylogenetic and functional diversity in the gut (Fig. 4f). After five weeks of colonization, IPA levels were around 5 μM in the serum and around 65 pmol mg−1 in caecal contents of wild-type-colonized mice, but undetectable in the fldC-colonized mice (Fig. 4g, h). These experiments show that, in a more complex community, IPA levels are dependent on C. sporogenes and require an intact fldC gene. We next tested whether elevated IPA levels corresponded to decreased intestinal permeability, a phenotype previously demonstrated for mice administered live compared to heat-killed C. sporogenes4. Indeed, the fldC-colonized mice exhibited significantly increased permeability to FITC-dextran compared to their wild-type-colonized counterparts (Fig. 4i). Although we cannot rule out the possibility that alterations in the levels of other reductive AAA metabolites mediate this host phenotype, collectively the data are consistent with a model in which IPA signals through PXR to fortify the intestinal barrier.
The C. sporogenes reductive AAA pathway can produce twelve metabolites, of which nine are known to accumulate in host plasma, and at least three are produced exclusively by the microbiota (Supplementary Table 4). Our data provide direct evidence that, by genetically modifying gut bacteria, the levels of high-abundance bacterially derived metabolites can be altered, thereby impacting the physiology of the host. As engineering gut microbes and the intestinal ecosystem gains sophistication, our experiments provide a proof-of-concept for controlling the metabolic output of the microbiota to optimize dozens of biologically relevant circulating metabolites.
METHODS
Data reporting
Owing to constraints to the gnotobiotic mouse experiments, no statistical methods were used to predetermine sample size. The experiments were not randomized and the investigators were not blinded to allocation during experiments and outcome assessment.
Bacterial strains and culture conditions
Clostridium sporogenes ATCC 15579 was obtained from the American Type Culture Collection (ATCC). It was routinely cultured in TYG (3% w/v tryptone, 2% w/v yeast extract, 0.1% w/v sodium thioglycolate) broth13 at 37 °C in an anaerobic chamber from Coy Laboratories in an atmosphere of 5% hydrogen, 10% CO2 and 85% N2. The cells were stored as anaerobically prepared 25% v/v glycerol stocks sealed in 12 × 32 mm glass crimp top vials to ensure anoxic conditions during long-term storage. All manipulations with C. sporogenes were performed in the anaerobic chamber and with medium and reagents pre-reduced for at least 48 h. The Escherichia coli CA434 (HB101/pRK24) conjugation host was routinely cultured at 30 °C in LB broth supplemented with tetracycline (12 μg ml−1) to ensure maintenance of the pRK24 plasmid. E. coli TG1 was used for routine cloning. Chloramphenicol (25 μg ml−1) was used for selection of pMTL007C-E2 plasmids in E. coli. HMP reference strains were obtained from the BEI Resources and were cultured in reinforced clostridial medium (RCM) modified to exclude agar and prevent interference with downstream assays. Organisms used in the defined community colonization included: Clostridium sporogenes ATCC 15579, Clostridium scindens ATCC 35704, Eubacterium rectale ATCC 33656, Bifidobacterium breve UCC2003, Edwardsiella tarda ATCC 23685, Bacteroides thetaiotaomicron VPI-5482, Bacteroides vulgatus ATCC 8482 and Parabacteroides distasonis ATCC 8503.
Plasmid construction and cloning
For specific gene disruptions, we used the Intron targeting and design tool on the ClosTron website (http://www.clostron.com/clostron2.php) using the Perutka algorithm9. The intron contained within the pMTL007C-E2 plasmid was retargeted to the specific sites listed in Supplementary Table 5 and were synthesized by DNA 2.0. Sequencing primers were synthesized by IDT DNA Technologies and are listed in Supplementary Table 5.
Introduction of plasmid DNA into C. sporogenes by conjugation
To introduce plasmid DNA into C. sporogenes, we performed bi-parental mating using a custom filter-mating-based approach. First the individual plasmids to be conjugated were transformed into chemically competent E. coli CA434 (HB101/pRK24) and selected on LB supplemented with tetracycline and chloramphenicol. Transformants were screened for the plasmid of interest by PCR and for those strains containing the plasmid of interest, 1 ml of overnight culture (24–30 h) was evenly pipetted on top of the 13.6-cm2 cellulose acetate membrane of a disposable 150-ml tube top vacuum filtration system from Corning (430320). Residual antibiotics were removed by two sequential washes with 8 ml of sterile phosphate-buffered saline (PBS) under vacuum. The cellulose acetate membrane containing the E. coli CA434 was excised using a #11 scalpel blade, placed in a sterile Petri dish and transferred into the anaerobic chamber. The membrane was placed cell-side up onto a pre-reduced TYG agar plate without antibiotics and 200 μl of an overnight culture in TYG broth (~18h) of C. sporogenes was evenly pipetted onto the membrane and this plate was incubated anaerobically at 37 °C. After 24 h, the membrane was transferred to a 50-ml conical tube, 2 ml of pre-reduced PBS was added and the tubes were mixed vigorously to dislodge cells from the membrane. Subsequently, 100μl of the cell suspension was spread onto each of four TYG agar plates supplemented with D-cylcoserine (250 μg ml−1) and thiamphenicol (15 μg ml−1). Typically, 10–100 colonies were obtained per agar plate. These colonies were picked and re-streaked on agar plates containing the same antibiotics. Individual well-isolated colonies were then picked and inoculated into TYG broth containing the same antibiotics and glycerol stocks were prepared.
Gene disruption using the ClosTron procedure
To construct disruptions in specific genes, we used the ClosTron mutagenesis procedure with slight modifications. This technique uses a bacterial group II intron derived from the Ll.LtrB intron of Lactococcus lactis. The retargeted pMTL007C-E2 plasmids were individually introduced into C. sporogenes by conjugation as described in ‘Introduction of plasmid DNA into C. sporogenes by conjugation’. Colonies verified by PCR to contain the plasmid of interest were cultured anaerobically in TYG with D-cylcoserine and thiamphenicol, then 100 μl of undiluted, 10-fold diluted or 100-fold diluted cultures were spread onto TYG agar plates supplemented with erythromycin (5 μg ml−1). Typically, 5-30 colonies were identified on the 10-fold diluted plates. These colonies were picked, re-streaked onto TYG agar plates supplemented with erythromycin and well-isolated colonies were inoculated into TYG broth supplemented with erythromycin. Genomic DNA was isolated from candidate clones using the DNeasy Blood and Tissue Kit from Qiagen and this DNA was used as a template in a PCR using the gene-specific primers. Primer sets were designed to produce a ~600-bp product for the wild-type and ~2,800-bp product for the mutant containing the intron. When verified mutants were streaked onto TYG plates containing thiamphenicol, no growth was observed, indicating that the loss of the pMTL007C-E2 plasmid had occurred.
Quantitative growth curves in batch culture
To characterize the phenotype of mutants in AAA metabolism, we used a previously described defined10 minimal medium referred to as standard amino acid complete medium (SACC, formulation in Supplementary Table 1). Initial experiments revealed very different growth rates for the mutants compared to the wild type in SACC and this precluded synchronization of the growth curves. Because glucose supplementation resulted in similar growth rates for wild-type and mutant strains, all pre-cultures were prepared with SACC medium supplemented with glucose (10 mM). The wild-type and mutant C. sporogenes were streaked from an anaerobic glycerol stock onto TYG agar plates without or with erythromycin (5 μg ml−1), respectively, and incubated for ~24 h at 37 °C. Individual well-isolated colonies were inoculated into 5 ml of SACC medium broth supplemented with glucose (10 mM) and were cultured for 24 h at 37 °C. Cells were diluted 1,000-fold into fresh SACC medium supplemented with glucose and cultured for 15–16 h to reach late-log phase. Optical densities at 600 nm (OD600 nm) were recorded for cultures, then cells were washed twice with SACC, and subcultured in 3 ml of SACC with or without glucose (10 mM) at an OD600 nm of ~0.01 in Balch tubes. The culture tubes were sealed with butyl rubber septa, removed from the anaerobic chamber and incubated at 37 °C in a water bath. OD600 nm readings were then manually recorded every hour until the cultures reached stationary phase using a GENESYS 20 spectrophotometer from Thermo Scientific. Doubling times were calculated from regions of the growth curve exhibiting linearity on a semi-log plot with the least squares fitting tool used by V. Roth (http://www.doubling-time.com/compute_more.php). Bacterial growth curves were performed in triplicate with each biological replicate deriving from a single well-isolated colony.
AAA metabolite incubations with resting cell suspensions
Metabolite analysis in culture supernatant was complicated by the fact that SACC contains multiple amino acids. Therefore, we developed an assay with resting cell suspensions to interrogate the effect of adding specific substrates and pathway intermediates to wild-type and mutant strains of C. sporogenes. The cells were cultured in rich medium (TYG, 20 ml) to early stationary phase (15–16 h) and then collected by centrifugation (5,000g, 10 min, 4 °C). Cells were washed twice with 20 ml of prereduced isotonic potassium phosphate buffer (40 mM potassium phosphate, 10 mM MgSO4, pH 7.0) and the final pellets were re-suspended in either 1 ml (1/20 culture volume) or 4 ml (1/5 culture volume) of buffer. Previous studies indicated that after incubation in isotonic buffer for >30 min, the cells reach a constant level of ATP14, suggesting that most of the residual substrates from the rich medium had been consumed. Therefore, we incubated the cells at room temperature for 45 min, then added various AAA metabolites (1 mM, final concentration) and incubated the cell suspensions at 37 °C. After 1 h, the cell suspensions were centrifuged and supernatants were collected for subsequent metabolite analyses. To evaluate whether there were any major differences in cell densities between wild-type and mutant strains, we determined the total protein content in each of the resting cell suspensions. In brief, cells were combined with an equal volume of 0.4 M NaOH, boiled for 10 min, then the protein concentration was determined using the BioRad DC protein assay with comparison to a calibration curve created with known concentrations of bovine serum albumin.
Liquid chromatography–mass spectrometry (LC-MS)
We used two separate approaches to measure AAA metabolites. To quantify products of AAA metabolism by wild-type and mutant C. sporogenes, we used a tandem mass spectrometry approach using a triple quadrupole mass spectrometer. For screening supernatants of HMP bacterial strains, we used an LC–Q-TOF instrument.
Tandem mass spectrometry
For serum samples, protein was precipitated by combining serum (50 μl) with an equal volume of 6% aqueous sulfosalicylic acid, followed by incubation at room temperature for 5 min, then clarification by centrifugation (12,000g, 5 min, room temperature). Subsequently, 50 μl of the supernatant was combined with 75 μl of 50% acetonitrile containing 100 μM trans-cinnamic-d7 acid as an internal standard. For caecal contents, 30–40 mg was weighed into a 2-ml screw top tube containing 50 mg of acid-washed glass beads (150–212 μm; Sigma-Aldrich, G1145). Nineteen volumes (for example, 19 μl extraction solvent per 1 mg caecal contents) of 50% ACN acidified with 0.1% formic acid containing 100 μM trans-cinnamic-d7 acid as an internal standard was then added to each tube, and samples were homogenized with a Mini Beadbeater 24 (Biospec Products) operating at 3,500 oscillations per minute for 5 min. The tubes were then centrifuged at 12,000g for 5 min at room temperature, and approximately 200 μl per sample was filtered through a Durapore PVDF 0.22-μm membrane using Ultrafree centrifugal filters (Millipore, UFC30GV00). Compounds were separated using an Agilent 1200 LC equipped with an Agilent poroshell 120 C18 column (4.6 × 50 mm) and detected with an Agilent 6460 Triple Quad mass spectrometer. Eluent A consisted of 0.1% formic acid (v/v) in water and eluent B consisted of 100% acetonitrile. Two microlitres of samples were injected via autosampler into mobile phase and chromatographic separation was achieved at a flow rate of 0.18 ml min−1 using a linear gradient of 30-90% eluent B over 5 min. Eluent B was held at 90% for 0.75 min, then brought to 30% over 0.25 min and the column was re-equilibrated at 30% eluent B for 7 min. Compounds were detected in negative ionization mode using the specific SRM transitions listed in Supplementary Table 6. Peak areas were normalized using the internal standard, and concentrations were determined by comparison to calibration curves prepared from dilution series of authentic standards for each compound. In Fig. 3, chromatograms were normalized to the maximum intensity for that class of compound (for example, phenylalanine, tyrosine or tryptophan). In column 1, the normalized spectra were vertically scaled 10 times to illustrate the phenylacetate peaks. The chromatogram colour indicates the precursor added and peaks indicate detection of the corresponding aryl derivative shown at the top of the respective columns.
Liquid chromatography–quadrupole–time of flight mass spectrometry (LC-Q-TOF)
To precipitate proteins, we combined 100 μl of culture supernatant with 450 μl of methanol, incubated at room temperature for 5 min, then centrifuged at 13,000g for 5 min. Subsequently, 100 μl of supernatant was transferred to a new tube and evaporated to dryness in a Thermo Savant SpeedVac. Then 1 ml of resuspension solvent (0.1% formic acid (v/v) in water) was added, compounds were dissolved by vortexing for ~30 s and samples were clarified by filtration through a Durapore MultiScreen 96-well plate. Compounds were separated using an Agilent 1290 Infinity II UPLC equipped with an Agilent ZORBAX RRHD Eclipse Plus 1.8-μm particle size C18 column (2.1 × 10 cm) and detected using an Agilent 6545 Q-TOF equipped with a dual jet stream electrospray ionization source operating under extended dynamic range (EDR 1700 m/z) in negative ionization mode. Eluent A consisted of 0.1% formic acid (v/v) in water and eluent B consisted of 0.1% formic acid (v/v) in 100% acetonitrile. Two microlitres of samples were injected via autosampler into mobile phase and chromatographic separation was achieved at a flow rate of 0.6 ml min−1 using a linear gradient of 0–100% eluent B over 7.5 min. Eluent B was held at 100% for 2 min, then brought to 0% over 0.1 min and the column was re-equilibrated at 0% eluent B for 2 min. Peak assignments in samples were made based on comparisons of retention times and accurate mass to charge ratios from authentic standards analysed under identical conditions.
Bioinformatics analysis
Our initial analysis revealed that several key cultured HMP representatives we obtained from the BEI Resources were not present in the HMP reference genome assembly available from NCBI. These organisms had been sequenced as part of the NIH-funded Human Microbiome Project and the sequence reads were deposited in NCBI, but the genomes had either not been assembled or had not been annotated (Supplementary Table 2). Therefore, to search for phenyllactate dehydratase gene clusters in these organisms, we assembled and annotated the genomes from publicly available sequence reads as described in ‘Genome assembly’.
Genome assembly
All available reads for Clostridium bolteae CC43_001B (NCBI Bioproject PRJNA71569), Clostridium cadaveris CC40_001C (NCBI Bioproject PRJNA71541), Clostridium cadaveris CC44_001G (NCBI Bioproject PRJNA71543), Clostridium cadaveris CC88A (NCBI Bioproject PRJNA71545) and Peptostreptococcus anaerobius CC14N (NCBI Bioproject PRJNA71563) were downloaded from the NCBI Sequence Read Archive (SRA) in FASTQ format. Two libraries for each of these five strains were previously prepared and sequenced at the Broad Institute on an Illumina HiSeq 2000 as part of the Human Microbiome Project. One library contained a 180-bp insert and the other contained a 5-kb insert. Adapters were removed and reads were trimmed using Trimmomatic v.0.3615 with the following parameters recommended for de novo assembly (ILLUMINACLIP:TruSeq3-PE-2.fa:2:30:12:1:true LEADING:3 TRAILING:3 MAXINFO:40:0.994 MINLEN:36). Both libraries from each sample were assembled together using SPAdes v.3.9.116 using default parameters (error correction, k = 21,33,55 and –careful for mismatch correction). The summary statistics for each genome assembly is shown in Supplementary Table 7.
Genome annotation
For each assembly, all scaffolds longer than 2,000 bp were uploaded to the Rapid Annotations using Subsystems Technology (RAST) server for annotation17. A summary of key genome features derived from the RAST annotation are provided in Supplementary Table 7. Annotated genome files were then exported from RAST as GenBank flat files for subsequent analyses.
Gene cluster searches
The phenyllactate dehydratase gene cluster (CLOSPO_00306 to CLOSPO_00316) was used as the query to search annotated genomic scaffolds from HMP Reference Genomes (NCBI Bioproject PRJNA28331, downloaded from NCBI on 12 June 2016) using MultiGeneBlast18 with the default parameters. The five genome annotations that we completed and downloaded from RAST were also searched using MultiGeneBlast.
Phylogenetic analysis of cultured HMP strains
Initial inspection of the HMP reference genomes revealed considerable inconsistency in the completeness of the 16S rRNA locus. In many cases, only small fragments of the 16S rRNA gene were reported in the genome assemblies deposited in GenBank and in some cases no sequence was reported at all. We chose to focus on the RNA polymerase subunit B protein, because previous studies have shown that phylogenies reconstructed from RpoB proteins can provide comparable or better resolution than 16S rRNA sequences19 and nearly all of the HMP reference genomes contained a full-length RpoB protein-coding gene. Using Geneious v.9.1.7, a MUSCLE alignment of all RpoB sequences was built using default parameters and gaps in the alignment were manually trimmed. A phylogenetic tree was then built using RAxML v.7.2.8 with the gamma BLOSUM62 protein model and Rapid hill-climbing algorithm.
NCBI accessions
The phenyllactate dehydratase gene clusters and rpoB gene sequences for the five genomes that we assembled and annotated have been deposited in GenBank and accession numbers for phenyllactate dehydratase gene clusters and RpoB homologues are indicated in Supplementary Table 7.
Mice
Mouse experiments were performed on gnotobiotic Swiss Webster germ-free mice (male, 6–10 weeks of age, n = 5 per group) originally obtained from Taconic Biosciences maintained in aseptic isolators. For the mono-colonization experiments, mice were colonized with either wild-type or fldC mutant C. sporogenes by oral gavage (200 μl, ~1 × 10⁷ CFU) and were maintained on standard chow (LabDiet 5k67). For the defined community, mice were first colonized with a mixture consisting of equal volumes from cultures of Bacteroides thetaiotaomicron (~16 h overnight culture), Bacteroides vulgatus (~ 16 h overnight culture), Parabacteroides distasonis (~30 h culture) and Edwardsiella tarda (~ 16 h overnight culture). One week later, the mice were gavaged with a mixture consisting of equal volumes from cultures of Eubacterium rectale (~24 h overnight culture), Clostridium scindens (~30 h culture), Bifidobacterium breve (~24 h overnight culture) and either wild-type or fldC mutant C. sporogenes (~16 h overnight culture). Successful colonization and stable community membership was determined by qPCR as described previously20,21 using custom primer sets listed in Supplementary Table 8. Four weeks following colonization with C. sporogenes, mice were humanely euthanized by CO2 asphyxiation, blood was collected by cardiac puncture and serum was collected for LC–MS/MS analysis using microtainer serum separator tubes from Becton Dickinson. Caecal contents were collected and snap-frozen in liquid nitrogen and stored at −80 °C until use. All mouse experiments were conducted under a protocol approved by the Stanford University Institutional Animal Care and Use Committee.
In vivo intestinal permeability
Mice were starved of food and water 4 h before the start of the experiment. Each mouse was weighed and an appropriate volume of 100 mg ml−1 FITC-dextran (4 kDa; Sigma, FD4) dissolved in water was administered by oral gavage to achieve 60 mg kg−1. After 4 h, mice were euthanized and serum was obtained as described in the section above (‘Mice’). Subsequently, 50-μl aliquots of serum were diluted with an equal volume of water and fluorescence was detected using a Wallac 1420 VICTOR2 plate reader with a filterset specific for fluorescein (excitation, 485 nm; emission, 535 nm). The concentration of FITC–dextran in the serum was determined by comparison to a standard curve generated with known concentrations of pure FITC–dextran.
Mass cytometry and analysis
Peripheral blood was collected by cardiac puncture, and spleens and femurs were collected. Spleens were ground over 70-μm filters into single-cell suspensions, and bone marrow was flushed from femurs using a 25G needle. Cells were collected in PBS + 5 mM EDTA and incubated with a final concentration of 25 μM cisplatin (Enzo Life Sciences) for 60 s before quenching with PBS + 0.5% BSA. Cells were pelleted at 600g for 5 min at 4 °C, re-suspended in PBA + 0.5% BSA and fixed with paraformaldehyde at a final concentration of 1.5% for 10 min at room temperature. Cells were washed twice in PBS + 0.5% BSA before being stored at −80 °C. Samples were barcoded and stained for mass cytometry as previously described22, and data were acquired on a CyTOF2 mass cytometer (Fluidigm). All data were normalized to correct for changes in instrument sensitivity over time using polystyrene bead standards23, and data were de-barcoded into individual samples before analysis. FCS files are available at http://www.cytobank.org/nolanlab/reports. Scaffold maps were generated as previously described22 using open-source software available at https://github.com/nolanlab/scaffold. Unsupervised force-directed graphs were generated as previously described22.
Immunoassays
A whole bacterial cell immunoassay was developed using overnight cultures of C. sporogenes cells according to a previous published protocol with minor modifications24. C. sporogenes ATCC 15579 was cultured overnight in TYG broth. The cells were subsequently washed twice with PBS and re-suspended in ELISA binding solution (50 mM sodium carbonate, pH 9.6). Initial studies revealed that seeding cells at a density of 1 × 10⁷ CFU per well in 100 μl was optimal and in subsequent studies, wells of a Corning 96-well polystyrene high protein-binding plate were seeded at this density and incubated overnight at 4 °C. The following day, wells were decanted and washed three times with 300 μl per well of PBST (1× PBS, pH 7.4 with 0.1% (v/v) Tween-20). Microscopic analysis revealed homogeneous distribution of bacterial cells on the surface within the wells. Appropriately diluted serum (1:200) or caecal contents prepared as described below (1:10) in PBST (100 μl per well) was added to wells and incubated at room temperature for 2 h. The wells were washed three times with 300 μl per well of PBST, and then HRP-conjugated goat anti-mouse IgG (Abcam, ab6789) or anti-mouse IgA (Abcam, ab97235) was added, diluted at 1:10,000 (IgA) or 1:50,000 (IgG) in PBST (100 μl per well). After incubation at room temperature for 3 h, wells were washed three times with 300 μl per well of PBST and colour was developed using the 1-step ABTS kit from ThermoFisher exactly as described by the manufacturer. Immunoglobulins from caecal contents were obtained by combining one part of fecal contents (~100 mg) with nine parts of fecal extraction buffer (~900 μl; 50 mM EDTA, 1× PBS) reconstituted with cOmplete EDTA-free protease inhibitor cocktail (Roche). The suspension was vortexed twice for 30 s, then centrifuged at 13,000g for 10 min and the supernatant was obtained and diluted for ELISA analyses.
Code availability
Scaffold maps were generated as previously described22 using open-source software that is freely available at https://github.com/nolanlab/scaffold.
Data availability
The authors declare that the data supporting the findings of this study are available within the paper and its Supplementary Information.
Extended Data
Extended Data Figure 1. Search for an indolelactate dehydratase.
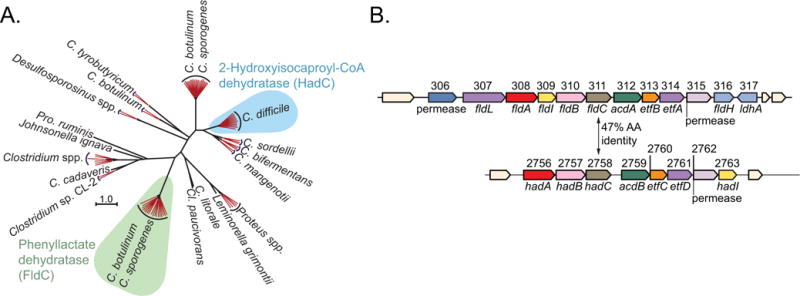
a, Phylogenetic analyses indicate that FldC (CLOSPO_00311) is distinct from its closest isospecific, heterofunctional homologue (HadC, CLOSPO_02758) in C. sporogenes. The neighbour-joining tree was built from the top 100 BLAST hits to FldC from the GenBank database. Sequences from very similar species and strains are collapsed into red branches. b, Genomic context for fldC and the most similar gene (hadC) in C. sporogenes. The amino acid sequence similarity between FldC and HadC is 47%.
Extended Data Figure 2. Generation of the phenyllactate dehydratase disruption mutant.
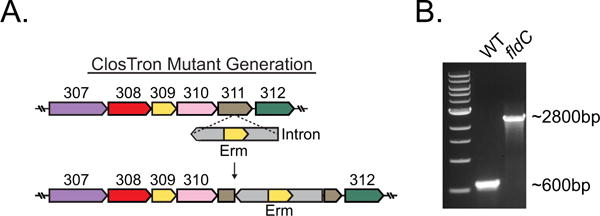
a, The ClosTron bacterial type II intron system was used to disrupt fldC (CLOSPO_00311) by insertion of an erythromycin-containing intron within the coding sequence at nucleotide position 561. b, Successful integration at the fldC locus was determined by amplifying DNA using primers flanking the region of insertion. The expected PCR product for the wild type is 600 bp as shown in the ethidium-bromide-stained agarose gel from a single experiment. Successful chromosomal integration was confirmed by Sanger sequencing.
Extended Data Figure 3. Summary of biochemical pathways for AAA metabolism by C. sporogenes.
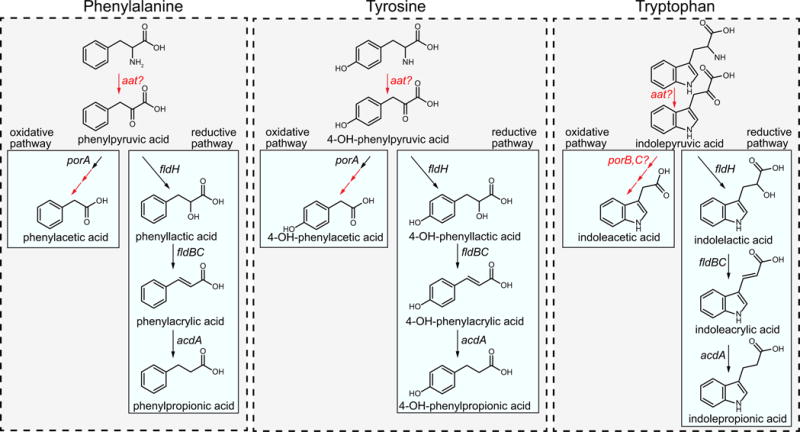
Phenylalanine, tyrosine and tryptophan are all metabolized through the reductive pathway by the same enzymes. The first step is an aminotransferase reaction, probably catalysed by aromatic amino acid aminotransferase (Aat). This enzyme activity has been demonstrated in C. sporogenes cells, however, the gene encoding this enzyme has not been identified. The arylpyruvates are then converted to their corresponding aryllactates by phenyllactate dehydrogenase (FldH, CLOSPO_00316). The aryllactates are then dehydrated by phenyllactate dehydratase (FldBC, CLOSPO_00310-311) along with its activator (FldI, CLOSPO_00309). Previous studies indicate that the dehydration reaction requires the substrate to first be activated to a CoA thioester, probably catalysed by acyl-CoA ligase (FldL, CLOSPO_00307), and that the CoA is recycled by the action of acyl-CoA transferase (FldA, CLOSPO_00308). Finally, the arylacrylates are reduced by acyl-CoA dehydrogenase (AcdA, CLOSPO_00312) involving its two electron transport factors (EtfA-EtfB, CLOSPO_00313-314). For the oxidative pathway, phenylpyruvate and 4-OH-phenylpyruvate are first oxidatively decarboxylated by pyruvate:ferredoxin oxidoreductase A (PorA, CLOSPO_00147-149), followed by phosphate acyltransferase and acyl kinase reactions that remain to be studied. The enzyme involved in indoleacetic acid production remains unknown, however, candidate genes in the genome include pyruvate:ferredoxin oxidoreductases B and C (PorB, CLOSPO_02262; PorC, CLOSPO_03792). Transformations for which the specific genes involved are not known are indicated in red.
Extended Data Figure 4. acdA, fldH and porA mutants exhibit growth defects when cultured with amino acids as the sole carbon source.
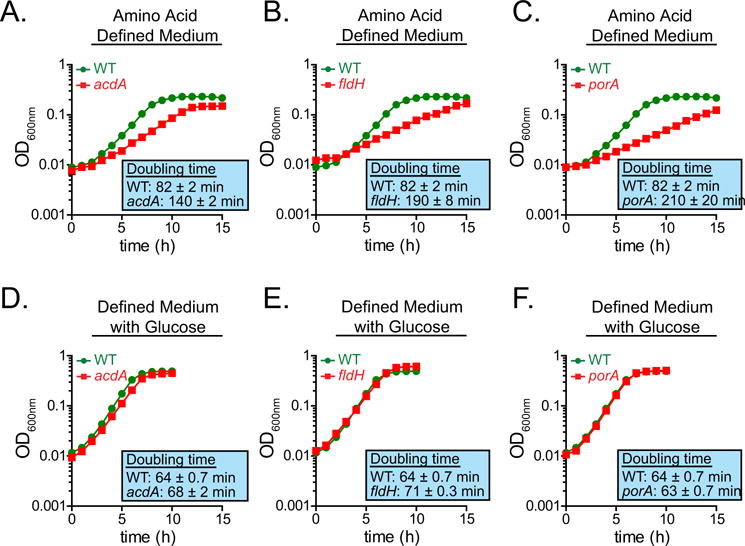
a–f, The wild-type (a–f) and acdA (a, d), fldH (b, e) and porA (c, f) mutant strains of C. sporogenes were cultured in minimal defined medium containing 10 amino acids at standard concentrations (SACC) with (d–f) or without (a–c) glucose (10 mM) and growth was monitored spectrophotometrically. Representative curves from n = 3 biological replicates are shown and doubling times are reported as mean ± s.d.
Extended Data Figure 5. fldZ does not exhibit a growth defect during amino acid fermentation.
a, b, The wild-type and fldZ mutant strains of C. sporogenes were cultured in minimal defined medium containing 10 amino acids at standard concentrations (SACC) with (a) or without (b) glucose (10 mM) and growth was monitored spectrophotometrically. Representative curves from n = 3 biological replicates are shown and doubling times are reported as mean ± s.d.
Extended Data Figure 6. The fldZ mutant is defective in conversion of phenylacrylate and 4-OH-phenylacryalte.
Resting cell suspensions of wild-type and fldZ mutant C. sporogenes were prepared and incubated with phenylacrylate, 4-OH-phenylacrylate or indoleacrylate for 1 h at 37 °C. Cells were then collected by centrifugation and the corresponding arylacrylates were detected in the supernatant by LC-MS/MS. The presence of a peak corresponds to a defect in the conversion of the indicated substrate (that is, retention of precursor). Representative chromatograms from n = 3 biological replicates are shown.
Extended Data Figure 7. porA is important for phenylacetate and 4-OH-phenylacetate production, but not indoleacetate.
Resting cell suspensions of wild-type and porA mutant C. sporogenes were prepared at a fourfold higher cell density (for example, 1/20 culture volume), and incubated with phenylalanine, tyrosine, tryptophan (red) or indolepyruvate (green) for 1 h at 37 °C. Cells were then collected by centrifugation and the arylacetates were detected in the supernatant by LC-MS/MS. The absence of a peak indicates a defect in the conversion of the indicated substrate to the corresponding arylacetate. Representative chromatograms from n = 3 biological replicates are shown.
Extended Data Figure 8. Broad overview of scaffold maps of mass cytometry data.
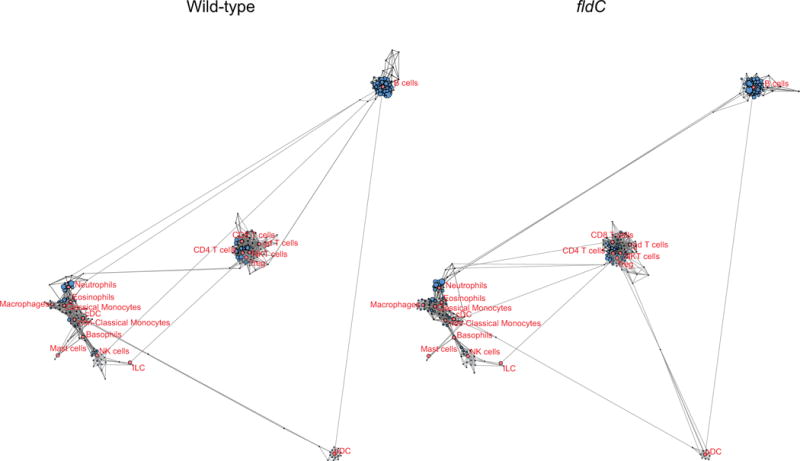
Scaffold maps of immune cells in the peripheral blood of mice colonized with wild-type or fldC mutant C. sporogenes. The full scaffold maps are presented here to provide topological context; zoomed-in regions are shown in Extended Data Fig. 9.
Extended Data Figure 9. Fine detail scaffold maps of mass cytometry data.
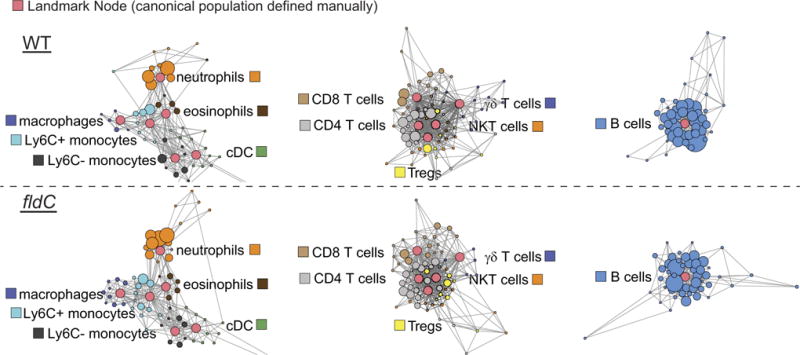
Scaffold maps of mass cytometry data from the peripheral blood of mice colonized with wild-type (top) or fldC mutant (bottom) C. sporogenes. Red nodes represent landmarks, or canonical immune cell populations defined manually. These landmarks facilitate the interpretation of the graph. Other nodes represent unsupervised clusters of similar cells, providing a data-driven representation of the cells present in the samples. The size of these nodes reflects the number of cells in that particular cluster. Unsupervised clusters are coloured according to their nearest landmark node. Edges in the graphs connect similar cells, with the length of each edge inversely proportional to that similarity. Cells that are most similar to one another are thereby connected by a short edge.
Extended Data Figure 10. Unsupervised force-directed graph of T cells in the peripheral blood.
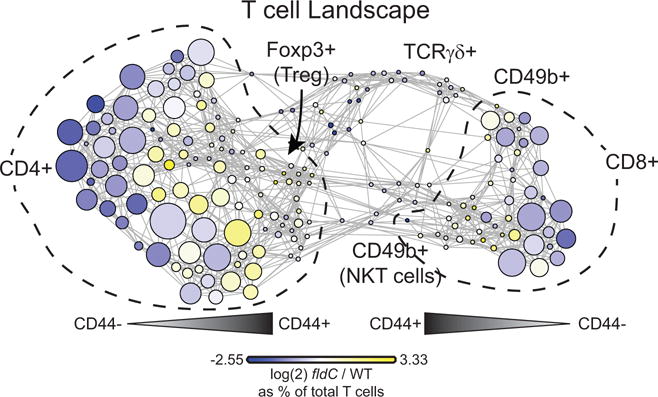
T cells from mice colonized with wild-type and fldC mutant C. sporogenes were clustered together. Each cluster of T cells is coloured by the log2 fold change of the frequency in mice colonized with fldC mutant over wild-type C. sporogenes to visualize differences between the groups.
Supplementary Material
Acknowledgments
We thank A. I. Scott for technical assistance and S. Yoshida (Kyoto University) for critical review of the manuscript. This work was funded by a grant from the National Institutes of Health NIDDK (R01-DK101674) to J.L.S. and M.A.F., an NIH Director’s New Innovator Award (DP2-OD006515) to J.L.S., and Early Independence Award (DP5-OD023056) to M.H.S., FDA Grant BAA-12-00118 to G.P.N., NIH Awards U19AI057229, U19AI100627, R33CA183654, R33CA0183692, R01GM10983601, R01CA184968, R01CA19665701, R21CA183660, R01NS08953301, 5UH2AR067676 and R01HL120724 to G.P.N., Department of Defence Grants OC110674 and W81XWH-14-1-0 180 to G.P.N., Gates Foundation Grant OPP1113682 to G.P.N., DP1 DK113598 to M.A.F., R01 DK110174 to M.A.F., HHMI-Simons Faculty Scholars Award to M.A.F., Byers Award in Basic Science to M.A.F., a Fellowship for Science and Engineering from the David and Lucile Packard Foundation to M.A.F. and a BASF research grant to M.A.F, and two Burroughs Wellcome Investigators in the Pathogenesis of Infectious Disease Awards to M.A.F. and J.L.S. A.J.H. was supported by an NIH postdoctoral NRSA (T32-AI007328). W.V.T. and B.D.M. were each supported by a National Science Foundation Graduate Research Fellowship Grant No. DGE-114747.
Reviewer Information Nature thanks M. Blaut, M. Redinbo, G. Siuzdak and the other anonymous reviewer(s) for their contribution to the peer review of this work.
Footnotes
Online Content Methods, along with any additional Extended Data display items and Source Data, are available in the online version of the paper; references unique to these sections appear only in the online paper.
Supplementary Information is available in the online version of the paper.
Author Contributions D.D., M.A.F. and J.L.S. conceived the study. D.D. generated the mutant bacteria. D.D., A.J.H. and W.V.T. performed the anaerobic growth curve experiments. A.L. and T.M.C. supervised generation of the LC-MS/MS assay. D.D. performed the metabolite incubations and LC-MS/MS experiments. B.D.M. assembled genomes from publicly available raw sequence data. D.D. and B.D.M. analysed genomic data. D.D. and S.K.H. performed gnotobiotic experiments. M.H.S. performed mass cytometry experiments and analysed data. G.PN. supervised mass cytometry experiments and analysis. D.D., M.A.F. and J.L.S. wrote the manuscript. All authors discussed the results and commented on the manuscript.
Author Information The authors declare no competing financial interests. Readers are welcome to comment on the online version of the paper.
Publisher’s note: Springer Nature remains neutral with regard to jurisdictional claims in published maps and institutional affiliations.
References
- 1.Nicholson JK, et al. Host-gut microbiota metabolic interactions. Science. 2012;336:1262–1267. doi: 10.1126/science.1223813. [DOI] [PubMed] [Google Scholar]
- 2.Wikoff WR, et al. Metabolomics analysis reveals large effects of gut microflora on mammalian blood metabolites. Proc Natl Acad Sci USA. 2009;106:3698–3703. doi: 10.1073/pnas.0812874106. [DOI] [PMC free article] [PubMed] [Google Scholar]
- 3.Danaceau JP, Anderson GM, McMahon WM, Crouch DJ. A liquid chromatographic-tandem mass spectrometric method for the analysis of serotonin and related indoles in human whole blood. J Anal Toxicol. 2003;27:440–444. doi: 10.1093/jat/27.7.440. [DOI] [PubMed] [Google Scholar]
- 4.Venkatesh M, et al. Symbiotic bacterial metabolites regulate gastrointestinal barrier function via the xenobiotic sensor PXR and Toll-like receptor 4. Immunity. 2014;41:296–310. doi: 10.1016/j.immuni.2014.06.014. [DOI] [PMC free article] [PubMed] [Google Scholar]
- 5.Chyan YJ, et al. Potent neuroprotective properties against the Alzheimer β-amyloid by an endogenous melatonin-related indole structure, indole-3- propionic acid. J Biol Chem. 1999;274:21937–21942. doi: 10.1074/jbc.274.31.21937. [DOI] [PubMed] [Google Scholar]
- 6.Elsden SR, Hilton MG, Waller JM. The end products of the metabolism of aromatic amino acids by clostridia. Arch Microbiol. 1976;107:283–288. doi: 10.1007/BF00425340. [DOI] [PubMed] [Google Scholar]
- 7.Dickert S, Pierik AJ, Linder D, Buckel W. The involvement of coenzyme A esters in the dehydration of (R)-phenyllactate to (E)-cinnamate by Clostridium sporogenes. FEBS J. 2000;267:3874–3884. doi: 10.1046/j.1432-1327.2000.01427.x. [DOI] [PubMed] [Google Scholar]
- 8.Dickert S, Pierik AJ, Buckel W. Molecular characterization of phenyllactate dehydratase and its initiator from Clostridium sporogenes. Mol Microbiol. 2002;44:49–60. doi: 10.1046/j.1365-2958.2002.02867.x. [DOI] [PubMed] [Google Scholar]
- 9.Heap JT, et al. The ClosTron: mutagenesis in Clostridium refined and streamlined. J Microbiol Methods. 2010;80:49–55. doi: 10.1016/j.mimet.2009.10.018. [DOI] [PubMed] [Google Scholar]
- 10.Lovitt RW, Morris JG, Kell DB. The growth and nutrition of Clostridium sporogenes NCIB 8053 in defined media. J Appl Bacteriol. 1987;62:71–80. doi: 10.1111/j.1365-2672.1987.tb02382.x. [DOI] [PubMed] [Google Scholar]
- 11.Su L, et al. Targeted epithelial tight junction dysfunction causes immune activation and contributes to development of experimental colitis. Gastroenterology. 2009;136:551–563. doi: 10.1053/j.gastro.2008.10.081. [DOI] [PMC free article] [PubMed] [Google Scholar]
- 12.Bendall SC, et al. Single-cell mass cytometry of differential immune and drug responses across a human hematopoietic continuum. Science. 2011;332:687–696. doi: 10.1126/science.1198704. [DOI] [PMC free article] [PubMed] [Google Scholar]
- 13.Theys J, et al. Repeated cycles of Clostridium-directed enzyme prodrug therapy result in sustained antitumour effects in vivo. Br J Cancer. 2006;95:1212–1219. doi: 10.1038/sj.bjc.6603367. [DOI] [PMC free article] [PubMed] [Google Scholar]
- 14.Bader J, Simon H. ATP formation is coupled to the hydrogenation of 2-enoates in Clostridium sporogenes. FEMS Microbiol Lett. 1983;20:171–175. [Google Scholar]
- 15.Bolger AM, Lohse M, Usadel B. Trimmomatic: a flexible trimmer for Illumina sequence data. Bioinformatics. 2014;30:2114–2120. doi: 10.1093/bioinformatics/btu170. [DOI] [PMC free article] [PubMed] [Google Scholar]
- 16.Nurk S, et al. Assembling single-cell genomes and mini-metagenomes from chimeric MDA products. J Comput Biol. 2013;20:714–737. doi: 10.1089/cmb.2013.0084. [DOI] [PMC free article] [PubMed] [Google Scholar]
- 17.Aziz RK, et al. The RAST Server: rapid annotations using subsystems technology. BMC Genomics. 2008;9:75. doi: 10.1186/1471-2164-9-75. [DOI] [PMC free article] [PubMed] [Google Scholar]
- 18.Medema MH, Takano E, Breitling R. Detecting sequence homology at the gene cluster level with MultiGeneBlast. Mol Biol Evol. 2013;30:1218–1223. doi: 10.1093/molbev/mst025. [DOI] [PMC free article] [PubMed] [Google Scholar]
- 19.Case RJ, et al. Use of 16S rRNA and rpoB genes as molecular markers for microbial ecology studies. Appl Environ Microbiol. 2007;73:278–288. doi: 10.1128/AEM.01177-06. [DOI] [PMC free article] [PubMed] [Google Scholar]
- 20.Sonnenburg ED, et al. Specificity of polysaccharide use in intestinal bacteroides species determines diet-induced microbiota alterations. Cell. 2010;141:1241–1252. doi: 10.1016/j.cell.2010.05.005. [DOI] [PMC free article] [PubMed] [Google Scholar]
- 21.Martens EC, Chiang HC, Gordon JI. Mucosal glycan foraging enhances fitness and transmission of a saccharolytic human gut bacterial symbiont. Cell Host Microbe. 2008;4:447–457. doi: 10.1016/j.chom.2008.09.007. [DOI] [PMC free article] [PubMed] [Google Scholar]
- 22.Spitzer MH, et al. An interactive reference framework for modeling a dynamic immune system. Science. 2015;349:1259425. doi: 10.1126/science.1259425. [DOI] [PMC free article] [PubMed] [Google Scholar]
- 23.Finck R, et al. Normalization of mass cytometry data with bead standards. Cytometry A. 2013;83A:483–494. doi: 10.1002/cyto.a.22271. [DOI] [PMC free article] [PubMed] [Google Scholar]
- 24.Elder BL, Boraker DK, Fives-Taylor PM. Whole-bacterial cell enzyme-linked immunosorbent assay for Streptococcus sanguis fimbrial antigens. J Clin Microbiol. 1982;16:141–144. doi: 10.1128/jcm.16.1.141-144.1982. [DOI] [PMC free article] [PubMed] [Google Scholar]
- 25.Bader J, Rauschenbach P, Simon H. On a hitherto unknown fermentation path of several amino acids by proteolytic clostridia. FEBS Lett. 1982;140:67–72. doi: 10.1016/0014-5793(82)80522-x. [DOI] [PubMed] [Google Scholar]
- 26.Bühler M, Giesel H, Tischer W, Simon H. Occurrence and the possible physiological role of 2-enoate reductases. FEBS Lett. 1980;109:244–246. doi: 10.1016/0014-5793(80)81096-9. [DOI] [PubMed] [Google Scholar]
Associated Data
This section collects any data citations, data availability statements, or supplementary materials included in this article.
Supplementary Materials
Data Availability Statement
The authors declare that the data supporting the findings of this study are available within the paper and its Supplementary Information.