Abstract
Protein aggregation is a hallmark of diverse neurodegenerative diseases. Multiple lines of evidence have revealed that protein aggregates can penetrate inside cells and spread like prions. How such aggregates enter cells remains elusive. Through a focused siRNA screen targeting genes involved in membrane trafficking, we discovered that mutant SOD1 aggregates, like viruses, exploit cofilin‐1 to remodel cortical actin and enter cells. Upstream of cofilin‐1, signalling from the RHO GTPase and the ROCK1 and LIMK1 kinases controls cofilin‐1 activity to remodel actin and modulate aggregate entry. In the spinal cord of symptomatic SOD1G93A transgenic mice, cofilin‐1 phosphorylation is increased and actin dynamics altered. Importantly, the RHO to cofilin‐1 signalling pathway also modulates entry of tau and α‐synuclein aggregates. Our results identify a common host cell signalling pathway that diverse protein aggregates exploit to remodel actin and enter cells.
Keywords: actin, aggregation, cofilin, neurodegenerative diseases, prions
Subject Categories: Cell Adhesion, Polarity & Cytoskeleton; Membrane & Intracellular Transport; Protein Biosynthesis & Quality Control
Introduction
The deposition of proteins of abnormal conformation is at the origin of a broad range of human age‐related diseases including the devastating neurodegenerative diseases Alzheimer's (AD), Parkinson's (PD), Huntington's (HD), amyotrophic lateral sclerosis (ALS), dementia and prion diseases (Soto, 2003). Prion diseases were traditionally thought to be unique because the misfolded protein in this group of diseases, PrP, is infectious (Prusiner, 1998). A prion is a proteinaceous infectious particle which can propagate its misfolded and pathogenic conformation by corrupting the normally soluble host protein. In the recent years, an explosion of studies has challenged our views on neurodegenerative diseases. In fact, the diverse protein aggregates that characterize neurodegenerative diseases share the defining properties of prions and can spread their abnormal conformation like prions, where seeds made of protein aggregates can induce aggregation of the soluble counterpart in a host (Brundin et al, 2010; Frost & Diamond, 2010; Jucker & Walker, 2011; Münch & Bertolotti, 2012; Prusiner, 2012). Therefore, knowledge on the extremely rare prion diseases has opened up new avenues for the understanding of more common neurodegenerative diseases such as AD or ALS.
Amongst the diverse neurodegenerative diseases, ALS is an attractive model to study the propagation of protein aggregates because its defining clinical features are reminiscent of prion diseases. Like prion diseases, ALS is a devastating and rapidly progressive neurodegenerative disease. ALS manifests by muscle weakness, which always begins at a focal point, but the body region involved is highly variable between individuals. The symptoms then spread contiguously to adjacent regions by an orderly process (Gowers, 1892; Ravits & La Spada, 2009). The spreading of SOD1 aggregates from cell to cell by a prion‐like mechanism, which has not only been observed in cells (Grad et al, 2011, 2014; Münch et al, 2011) but also in mice (Ayers et al, 2014, 2015; Thomas et al, 2017), could explain the defining pathological hallmarks of ALS. With this model, the site of disease corresponds to the misfolding of the disease‐causing protein and the spreading of the symptoms results from the spreading of the SOD1 prion.
Numerous studies have demonstrated the propagation of diverse disease‐related protein aggregates in animal models (Sibilla & Bertolotti, 2017). However, the mechanisms underlying these properties are largely unknown. Cellular models recapitulating the propagation of protein aggregates are essential to conduct mechanistic studies. In most cases, the protein aggregates associated with neurodegenerative diseases are intracellular and replicate inside cells. Therefore, amongst the diverse steps of the prion cycle, the entry of protein aggregates into their host is a particularly important one because it is a first step in a pathological cascade, and so far, this process is ill‐defined.
We have previously shown that SOD1 aggregates enter cells by macropinocytosis (Münch et al, 2011), a route later found to be also exploited by tau aggregates (Holmes et al, 2013). Here, we aimed at identifying cellular factors involved in aggregate entry. Knowing that aggregates enter cells by macropinocytosis, a poorly defined endocytic pathway, we designed a targeted siRNA screen using a membrane trafficking siRNA library to identify host cell factors involved in aggregate entry, with the hope to provide some mechanistic insights on this elusive prion‐like cycle.
Our work identifies a critical cellular factor, cofilin‐1 required to remodel cortical actin, enabling entry of diverse protein aggregates. Upstream of cofilin‐1 and controlling aggregate entry is the RHO‐ROCK1‐LIMK1 signalling pathway. These findings reveal host cellular factors critical for aggregate entry. Remarkably, cofilin‐1 is also exploited by some viruses to enter cells, thereby highlighting an analogy between entry of protein aggregates and viruses.
Results
An siRNA screen identifies modifiers of mutant SOD1 aggregate uptake
We previously found that SOD1 aggregates enter cells by macropinocytosis (Münch et al, 2011), a finding confirmed by others (Zeineddine et al, 2015) and relevant to diverse disease‐causing aggregates (Holmes et al, 2013). However, beyond the knowledge that aggregates transit through vesicles to enter cells, the cellular factors involved in this process are unknown. To shed light on this process, we conducted a screen with a membrane trafficking siRNA library. We confirmed that, in our cellular system, aggregates penetrated inside cells using high‐resolution confocal microscopy (Movie EV1). Aggregate uptake was quantified by high‐throughput and automated image analysis in human 293T cells using high‐content microscopy, following reverse transfection with pools of four siRNAs per gene prior to Dylight‐650‐labelled mutant SOD1 aggregates inoculation (Figs 1A and EV1A and B and Materials and Methods). The technical reproducibility of four independent screens allowed us to combine the different dataset, and hits were ranked according to the combined Z‐score of all experimental repeats (Figs EV2A and B, and 1B). The top hit of the screen was PICALM (Fig EV2B), a clathrin‐coated‐pit adaptor protein homologous to AP180, which we previously reported (Münch et al, 2011). Knockdown of PICALM increased SOD1 aggregate uptake indirectly by the following mechanism: it decreases clathrin‐mediated endocytosis, to which cells compensate by increasing other endocytic routes, in turn resulting in increasing SOD1 aggregate uptake (Münch et al, 2011). The presence of PICALM in the screen provided confidence that the siRNA screen identified relevant hits. This also confirms our previous findings showing that clathrin‐mediated endocytosis does not mediate SOD1 aggregate entry (Münch et al, 2011).
Figure 1. An unbiased high‐content screen identifies modifiers of aggregate entry.
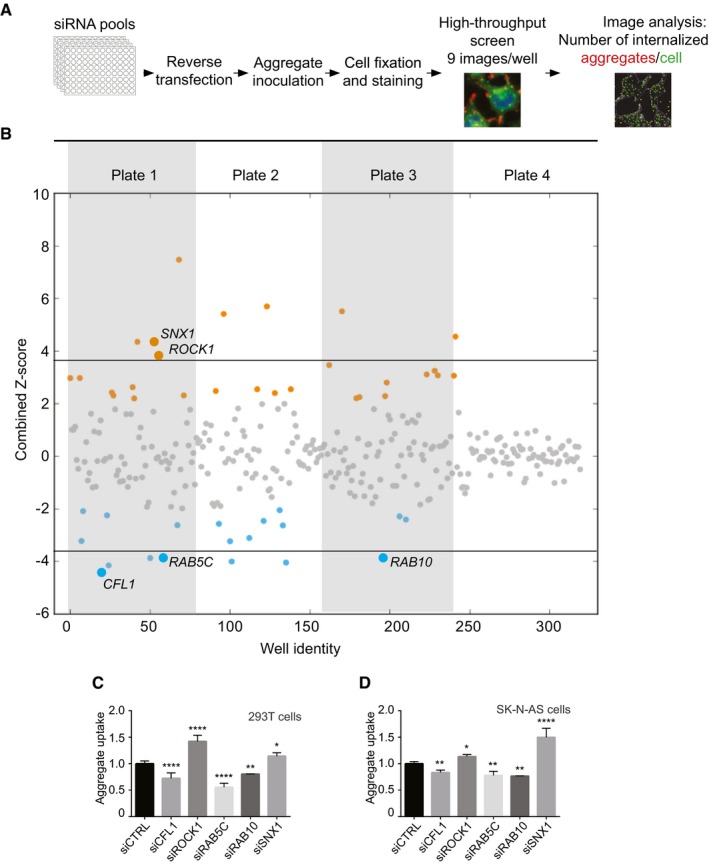
- Scheme representing the experimental workflow.
- Combined Z‐scores for each siRNA knockdown or mock transfection, presented as a scatter plot with the x‐axis indicating the screening well. Z‐score points representing hits above 2.0 are coloured in orange and below −2 in blue. Horizontal lines illustrate the Z‐score threshold (± 3.8) used for the secondary screen, selecting 15 of the most significant candidate genes.
- Flow cytometry analysis of 293T cells 16 h after inoculation with 0.8 μM Dylight‐650‐SOD1H46R aggregates. Cells were transfected with the indicated siRNA or control (CTRL) siRNA 3 days before their inoculation with aggregates. Fluorescence intensity was measured by flow cytometry on 10,000 cells per sample (n = 2–5).
- Flow cytometry analysis of SK‐N‐AS cells 1 h after inoculation with 0.8 μM Dylight‐650‐SOD1H46R aggregates and 3 days after transfection with the indicated siRNA. Fluorescence intensity was measured by flow cytometry on 10,000 cells per sample (n = 3–10).
Figure EV1. Representative images of the siRNA screen.
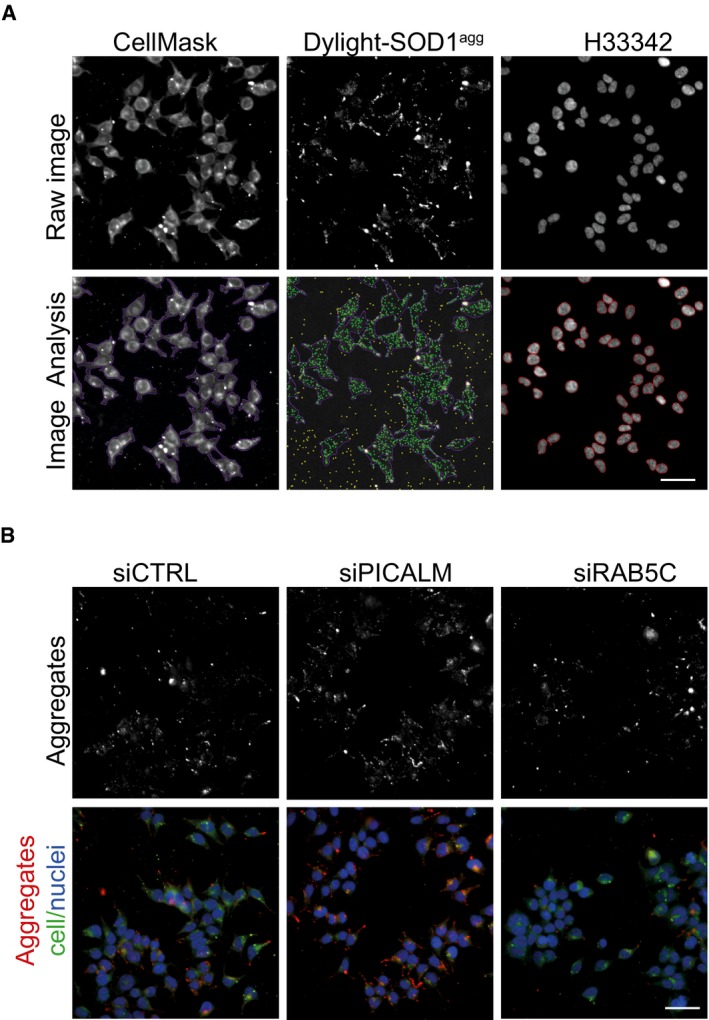
- Representative primary image samples extracted from the siRNA screen with the Nikon high‐content microscope (20× 0.75 NA objective). Upper row: Subregion taken from a three‐channel image of 293T cells treated for 16 h with Dylight‐650‐labelled SOD1 aggregates. The sample was co‐stained with H33342 (blue) to reveal nuclei and CellMask (green) to reveal plasma membrane. Lower row: results of image segmentation using the Nikon NIS‐Elements general analysis. Aggregates within cells are identified as green dots. CellMask reveals the outline of the plasma membrane artificially coloured as purple boundary. Yellow dots are rejected spots, being either aggregates outside of cells or containing saturated pixels. Red circle lines delineate the cell nuclei. Scale bar: 50 μm.
- High‐content images of 293T cells 3 days after transfection with control (CTRL) siRNA, PCALM siRNA or RAB5C siRNA and stained with H33342 (blue) to reveal nuclei, CellMask green plasma membrane stain (green). Cells were fixed and imaged after 16 h flowing inoculation with Dylight‐650‐labelled SOD1 aggregates (red). Scale bar: 50 μm.
Figure EV2. Overview of siRNA screen procedure.
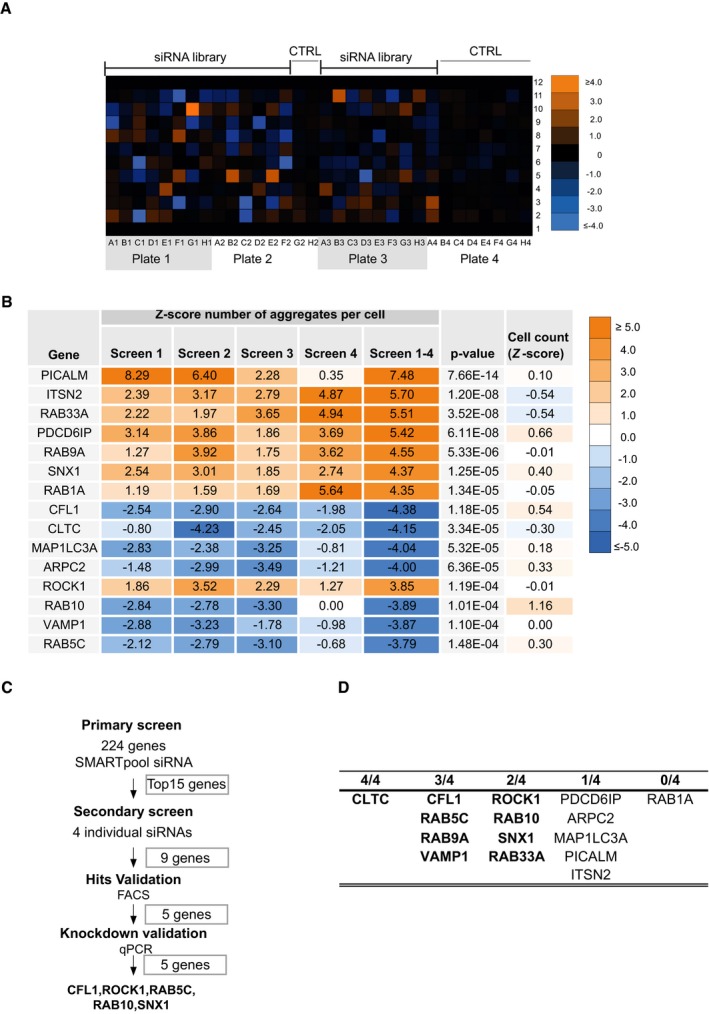
- Upper panel: Colour matrix representing the combined Z‐score (protein aggregates per cell normalized to control) for each siRNA knockdown reconstructed at original well‐plate grid locations.
- Summary of siRNA screening results for the top 15 genes. Hits are ranked according to the absolute value of the combined Z‐scores (screens 1–4), normalized from average of experimental replicates (screen 1, screen 2, screen 3 and screen 4). P‐value is the estimated probability of obtaining a value as combined Z‐scores; the cell count corresponds to the mean of cell count Z‐scores from four independent biological experiments.
- Overview of the validation strategy of siRNA screen.
- Number of individual siRNA (out of 4) per hit modifying SOD1 aggregate entry in secondary screen.
We next performed a secondary validation screen for the top 15 genes (Z‐score > 3.8 or < −3.8) using stringent validation criteria previously used in an siRNA screen for HIV restriction factors (Liu et al, 2011) (Fig EV2C and D). 9 out of 15 genes passed the secondary screen. The hits were next tested in an orthogonal experimental set‐up, measuring aggregate uptake by flow cytometry, as described (Münch et al, 2011). First, we confirmed that the method enabled the detection of internalized aggregates (Fig EV3), as previously reported (Münch et al, 2011). This second validation yielded five genes: cofilin‐1, RHO‐associated protein kinase 1 (ROCK1), the Ras‐related proteins RAB5C, RAB10 and sorting nexin‐1 (SNX1) (Figs EV2C and D, and 1C). We also confirmed that individual siRNA against CFL1, ROCK1, RAB5C, RAB10 as well as SNX1 efficiently reduced their respective mRNA levels (Fig EV4). Having performed the primary screen and validation in 293T cells, we next tested the different modifiers in a neuronal cell line. The relevance of the five validated modifiers of SOD1 aggregate uptake was confirmed in the neuronal cell line SK‐N‐AS (Figs 1D and EV5). We next performed additional controls to assess the selectivity of the hits identified. RAB5C is one of three isoforms of RAB5 and the siRNA screen selectively identified RAB5C as a modifier of SOD1 aggregate entry. We confirmed that this effect was indeed specific because knockdown of RAB5A or RAB5B did not affect SOD1 aggregate uptake (Fig EV6). These results validate the screening method and identify modifiers of SOD1 aggregate uptake.
Figure EV3. Confocal images showing SOD1 aggregates are inside cells after trypsinization and prior to FACS analysis.
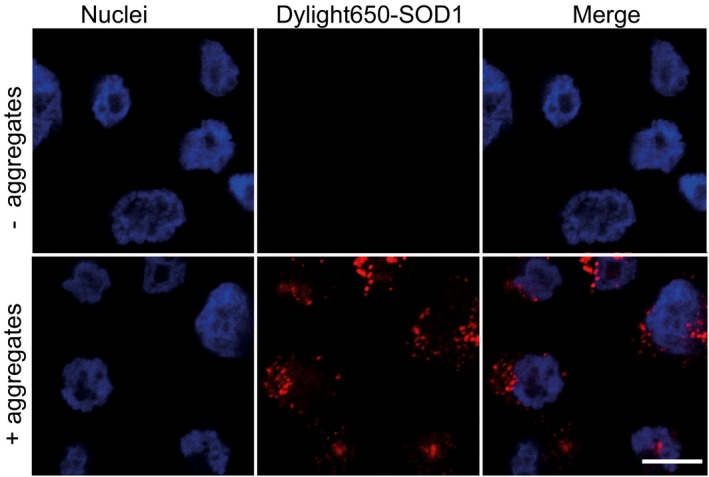
SK‐N‐AS cells were trypsinized and fixed after 2 h following inoculation with Dylight‐650‐labelled SOD1 aggregates. Images were acquired with the Zeiss 710 confocal microscope (Carl Zeiss Ltd.) by 63× objective focusing on nuclei layer, to ensure that the images enable the visualization of the cellular content. Scale bar: 10 μm.
Figure EV4. siRNA knockdown of the five modifiers isolated in the screen.
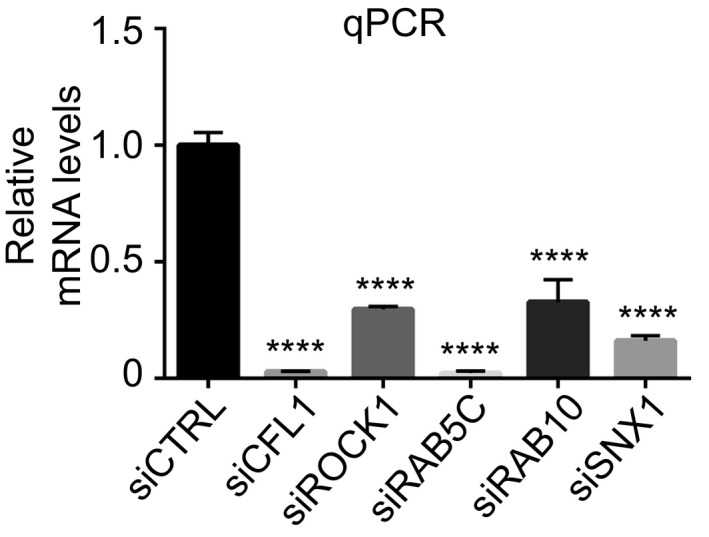
mRNA levels measured by quantitative RT–PCR 2 days after transfection with the indicated siRNA. Data are means ± SEM (n ≥ 2). Ordinary one‐way ANOVA followed by multiple comparisons. ****P ≤ 0.0001.Source data are available online for this figure.
Figure EV5. Modifiers of SOD1 aggregate entry.
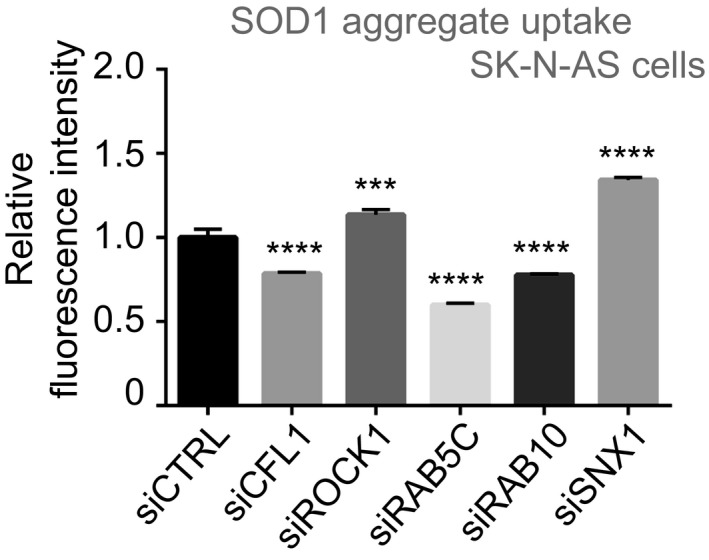
Flow cytometry analysis of SK‐N‐AS cells 16 h after inoculation with 0.8 μM Dylight‐650‐SOD1H46R aggregates and 3 days after transfection with the indicated siRNA. Fluorescence intensity was measured by flow cytometry on 10,000 cells per sample. Data are means ± SEM (n = 3). Ordinary one‐way ANOVA followed by multiple comparisons. ***P ≤ 0.001, ****P ≤ 0.0001.Source data are available online for this figure.
Figure EV6. SOD1 aggregate uptake following RAB5 knockdown.
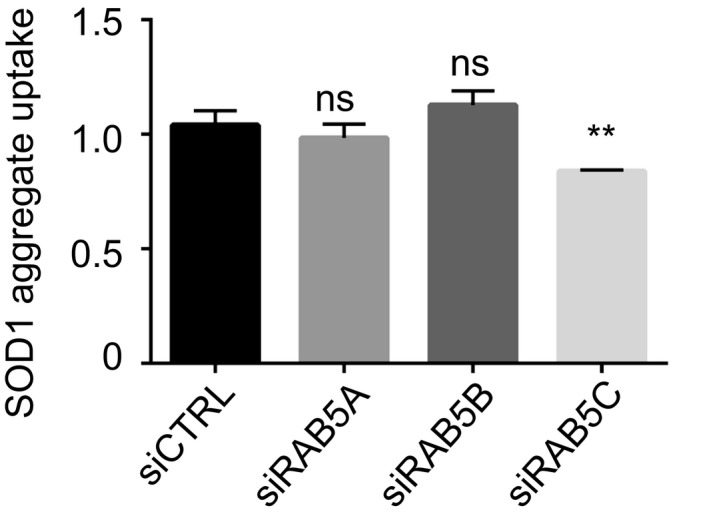
Flow cytometry analysis of SK‐N‐AS cells 1 h after inoculation with 0.8 μM Dylight‐650‐SOD1H46R aggregates and 3 days after transfection with the indicated siRNA. Data are means ± SEM (n ≥ 2). Fluorescence intensity was measured by flow cytometry on 10,000 cells per sample and analysed by ordinary one‐way ANOVA followed by multiple comparisons. **P ≤ 0.01.Source data are available online for this figure.
Signalling through RHO, ROCK1, LIMK1 to cofilin‐1 regulates SOD1 aggregate entry into cells
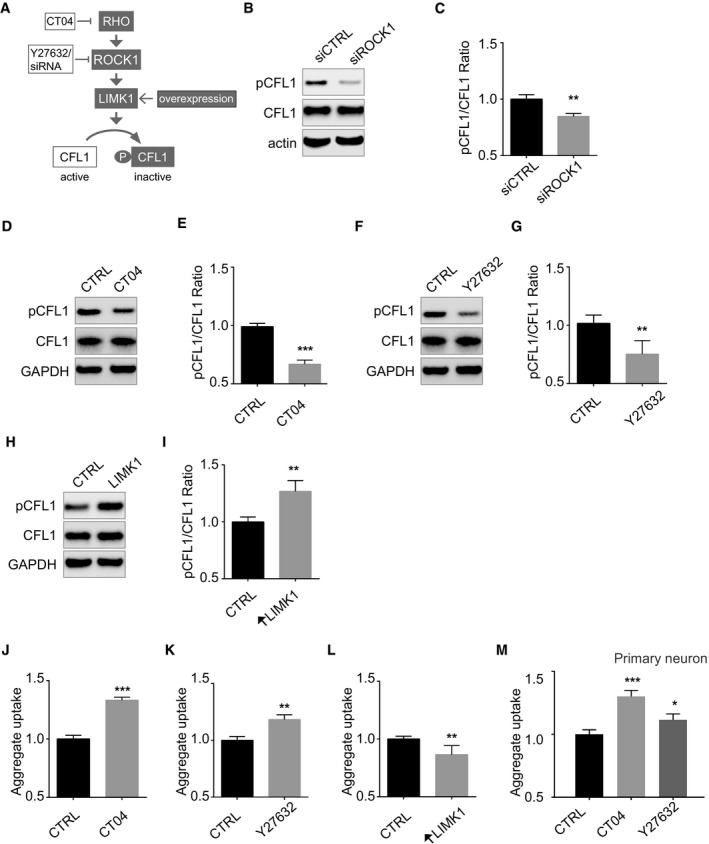
Remarkably, two of the top five hits, ROCK1 and cofilin‐1, belonged to the same pathway. This provided strong evidence to suggest that the ROCK1‐cofilin‐1 pathway was important for aggregate uptake and to examine this pathway in depth. Cofilin‐1 is an actin depolymerization factor, a crucial regulator of actin dynamics (Lappalainen & Drubin, 1997) whose activity is restricted by phosphorylation by the LIM‐kinase 1(LIMK1) (Mizuno et al, 1998; Maekawa et al, 1999). LIMK1 is itself regulated by the kinases ROCK1 and RHO (Maekawa et al, 1999) (Fig 2A). Indeed, knockdown of ROCK1 decreased cofilin‐1 phosphorylation (Fig 2B and C). Likewise, the RHO inhibitor CT04 as well as the ROCK1 inhibitor Y27632 also decreased cofilin‐1 phosphorylation (Fig 2D–G). Conversely, overexpression of LIMK1 increased cofilin‐1 phosphorylation (Fig 2H and I). Having found that cofilin‐1 siRNA decreased aggregate uptake whilst ROCK1 siRNA increased aggregate uptake (Fig 1C and D), we next tested whether the diverse manipulations of the RHO to cofilin‐1 signalling pathway described above affected aggregate uptake. We found that both the RHO inhibitor CT04 and the ROCK inhibitor Y27632 increased mutant SOD1 aggregate uptake (Fig 2J and K). Conversely, overexpression of LIMK1 decreased aggregate uptake (Fig 2L). These findings were validated in primary neurons where both RHO inhibition and ROCK inhibition increased mutant SOD1 aggregate uptake (Fig 2M). These results provide multiple independent lines of evidence establishing that a decrease in RHO signalling increases cofilin‐1 activity to increase aggregate entry.
Figure 2. Signalling from RHO to cofilin‐1 controls aggregate entry into cells.
-
ACartoon depicting the RHO‐ROCK1, LIMK1 signalling pathway to cofilin‐1 (CFL1).
-
BImmunoblots of the indicated proteins in lysates of SK‐N‐AS cells 3 days after transfection with ROCK1 siRNA or control siRNA.
-
CQuantifications of triplicates of (B). The graph depicts levels of phospho‐cofilin‐1 (pCFL1) relative to total CFL1 in cells with ROCK1 siRNA knockdown compared with control siRNA treatment. Data are means ± SEM (n = 3). Unpaired t‐test. Two‐tailed **P = 0.0043.
-
DImmunoblots of the indicated proteins in lysates of SK‐N‐AS cells treated with CT04 or vehicle (CTRL).
-
EQuantifications of replicates of (D). Data are means ± SEM (n = 3). Unpaired t‐test. Two‐tailed ***P = 0.0003.
-
F, GSame as (D, E) with Y27632. Data are means ± SEM (n = 4). Unpaired t‐test. Two‐tailed **P = 0.0081.
-
HImmunoblots of the indicated proteins in lysates of SK‐N‐AS cells 2 days after transfection with pTGSH‐LIMK1 or empty vector.
-
IQuantifications of replicates of (H). Data are means ± SEM (n = 4). Unpaired t‐test. Two‐tailed **P = 0.0021.
-
J, KFlow cytometry analysis of SK‐N‐AS cells 1 h after inoculation with 0.8 μM Dylight‐650‐SOD1H46R aggregates and following a 15 h treatment with 1 μg/ml CT04 (J) or 10 μM Y27632 (K) or vehicle (CTRL). Data are means ± SEM (n ≥ 3). Unpaired t‐test. Two‐tailed P‐values are 0.0001 and 0.0097 for treatment with CT04 and Y27632, respectively.
-
LFlow cytometry analysis of aggregate uptake in SK‐N‐AS cells transfected with pTGSH‐LIMK1 or empty vector as a control 2 days before inoculation with labelled SOD1 aggregates. Data are means ± SEM (n = 3). Unpaired t‐test. Two‐tailed **P = 0.0064.
-
MFlow cytometry analysis of aggregate uptake 1 h after inoculation of aggregates in primary neuron in the presence of 1 μg/ml CT04 or 10 μM Y27632 or vehicle (CTRL) added 1 h before aggregates. Data are means ± SEM (n = 3). Unpaired t‐test. Two‐tailed P‐values are 0.0009 and 0.0254 for treatment with CT04 and Y27632, respectively.
Remodelling of the cortical actin barrier through cofilin‐1 is required for SOD1 aggregate entry
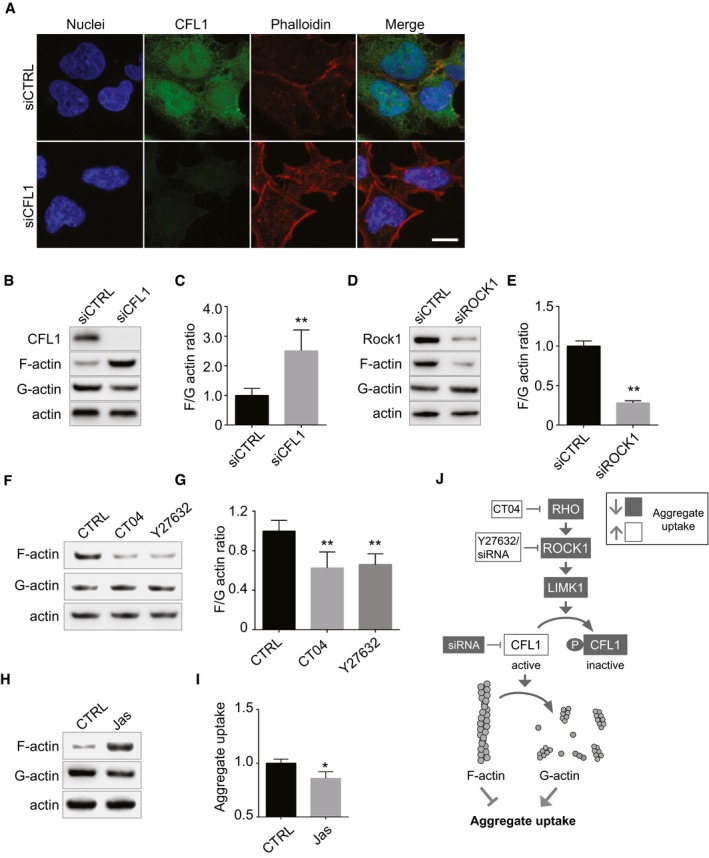
To gain insights into the underlying mechanism by which cofilin‐1 facilitates aggregate entry, we next examined actin dynamics, knowing that cofilin‐1 is an actin depolymerizing factor. As expected (Mizuno, 2013), knockdown of cofilin‐1 increased cortical actin, as revealed by phalloidin staining (Fig 3A) a finding confirmed by biochemical fractionation of F‐actin and G‐actin (Fig 3B and C). ROCK1 knockdown had the opposite effect on the F/G‐actin ratio (Fig 3D and E) and aggregate uptake (Fig 1C and D). Both the RHO inhibitor CT04 and the ROCK inhibitor Y27632, which increased mutant SOD1 aggregate uptake (Fig 2J and K) and decreased cofilin‐1 phosphorylation (Fig 2D–G), decreased F/G‐actin ratio (Fig 3F and G). Jasplakinolide (Holzinger, 2009), which promotes actin polymerization, also reduced SOD1 aggregate uptake (Fig 3H and I). These results suggest that cortical actin forms a restriction barrier to aggregate entry and inhibition of RHO signalling promotes reorganization of cortical actin to facilitate aggregate entry (Fig 3J).
Figure 3. Cofilin‐1 controls cortical actin, a barrier to SOD1 aggregate entry.
-
AConfocal images of 293T cells 3 days after transfection with cofilin‐1 (CFL1) siRNA or control siRNA and stained with H33342 (blue) to reveal nuclei, anti‐CFL1 antibody (green) and phalloidin (red) to reveal actin filaments. Scale bar: 10 μm.
-
BFractionation of cell lysates followed by immunoblots to reveal F‐actin, G‐actin. SK‐N‐AS cells were transfected with control or CFL1 siRNA 3 days before the analysis.
-
CQuantifications of replicates of (B). The graph depicts levels of F‐actin/G‐actin ratio in cells transfected with or without CFL1 siRNA. Data are means ± SEM (n = 4). Unpaired t‐test. Two‐tailed **P = 0.0068.
-
D, EAs in (B, C) except that cells were transfected with control or ROCK1 siRNA. Data are means ± SEM (n = 2). Unpaired t‐test. Two‐tailed **P = 0.0046.
-
FFractionation of SK‐N‐AS cell lysates followed by immunoblots to reveal F‐actin, G‐actin. Before lysis, cells were treated for 16 h with 1 μg/ml CT04 or 10 μM Y27632.
-
GQuantification of replicated experiments as in (F). Data are means ± SEM (n = 4). Unpaired t‐test. Two‐tailed P‐values are 0.0083 and 0.0043 for treatment with CT04 and Y27632, respectively.
-
HImmunoblots of F‐actin, G‐actin and total actin in fractionated lysates from SK‐N‐AS cells after a treatment with vehicle (DMSO) or 25 nM Jasplakinolide for 16 h.
-
IFlow cytometry analysis of aggregate entry, 1 h after inoculation of SK‐N‐AS cells with 0.8 μM Dylight‐650‐SOD1H46R aggregates following a treatment with vehicle (DMSO) or 25 nM Jasplakinolide for 16 h. Fluorescence intensity was measured by flow cytometry on 10,000 cells per sample (n = 2). Data are means ± SEM. Unpaired t‐test. Two‐tailed *P = 0.0155.
-
JCartoon depicting the regulation of acting remodelling by the RHO to CFL1 pathway.
To further investigate how alteration of cofilin‐1 regulates aggregate entry, we monitored cofilin‐1 activity following aggregate inoculation. Because cofilin‐1 is regulated by phosphorylation (Mizuno et al, 1998; Maekawa et al, 1999), we examined the levels of phospho‐cofilin‐1 by immunoblots at different time after aggregate inoculation. The total cofilin‐1 protein levels did not measurably vary following aggregate inoculation (Fig 4A). However, phosphorylation of cofilin‐1 decreased between 10 and 60 min following aggregate inoculation (Fig 4A and B). Interestingly, following this initial decrease, phospho‐cofilin‐1 levels then increased 1 h after aggregate inoculation. This indicates that aggregates elicited a transient decrease in cofilin‐1 phosphorylation, further supporting the notion that aggregates exploit cofilin‐1 to enter cells and remodel actin. The increased cofilin‐1 phosphorylation following an initial decrease indicates the existence of a negative feedback response where cells react to the initial alteration by increasing cofilin‐1 phosphorylation. Indeed, cofilin‐1 dephosphorylation leads to actin disassembly, which in turn increases cofilin‐1 phosphorylation (Nagata‐Ohashi et al, 2004; Soosairajah et al, 2005; Liu et al, 2015). Importantly, the changes in cofilin‐1 phosphorylation were not observed when cells were inoculated with dextran (Mr ∼10,000) instead of SOD1 aggregates (Fig 4C and D), establishing the selective nature of the changes induced by SOD1 aggregates (Fig 4A and B). Bi‐phasic changes in cofilin‐1 phosphorylation as observed here (Fig 4A and B) is also a hallmark of HIV‐1 infection (Yoder et al, 2008). The role of cofilin‐1 in aggregate entry identified here reveals a mechanistic analogy between SOD1 aggregate entry and the entry of some viruses, which also exploits cofilin‐1 to remodel actin and enter cells (Yoder et al, 2008; Xiang et al, 2012; Zheng et al, 2013).
Figure 4. SOD1 aggregates transiently alter cofilin‐1 phosphorylation in cells.
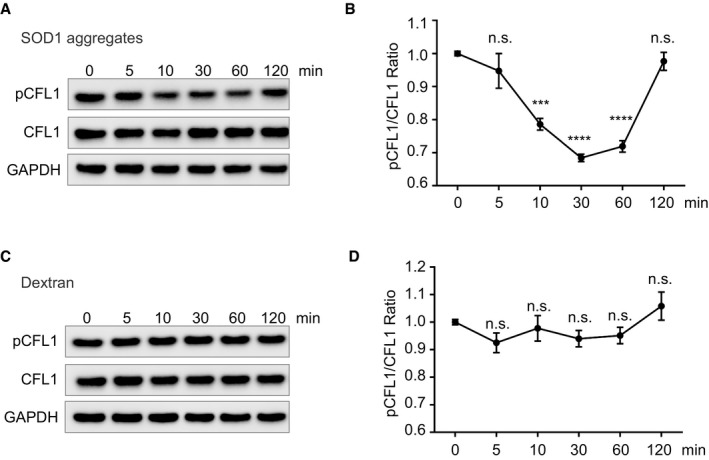
- Immunoblots of the indicated proteins in lysates of SK‐N‐AS cells inoculated with SOD1 aggregates for the indicated time.
- Quantifications of triplicates of (A). The graph depicts the level of pCFL1 relative to total CFL1 during the SOD1 aggregates inoculation in SK‐N‐AS cells.
- SK‐N‐AS cells inoculated with dextran (Mr 10,000) for the indicated time were lysed and analysed by immunoblots with the indicated antibodies.
- Quantifications of triplicates of (C). The graph depicts the level of pCFL1 relative to total CFL1 during the dextran (Mr 10,000) inoculation in SK‐N‐AS cells.
Cofilin‐1 phosphorylation increases over time in SOD1G93A transgenic mice
To examine the possible pathological relevance of our findings, we monitored cofilin‐1 activity in transgenic mice expressing the human ALS‐causing mutant SOD1G93A (Gurney et al, 1994). The transgenic SOD1G93A mice develop a motor neuron disease that closely resembles human ALS with progressive deposition of mutant SOD1 (Johnston et al, 2000; Wang et al, 2009) and progressive motor neuron loss leading to motor deficits. As previous noted in different transgenic SOD1 lines (Johnston et al, 2000; Wang et al, 2009), insoluble SOD1G93A accumulated in the spinal cord of SOD1G93A transgenic mice, as the disease progressed (Fig 5A). Coincidentally, phosphorylation of cofilin‐1 increased over time in the SOD1G93A transgenic mice, whilst the total levels of cofilin‐1 were not measurably altered (Fig 5A and B). This is analogous to what has been observed in cells, where an increase in cofilin‐1 phosphorylation follows an initial transient decrease (Fig 4A and B). Whilst the bi‐phasic nature of the changes in cofilin‐1 phosphorylation cannot be captured in a mouse model, the alteration of cofilin‐1 activity in vivo demonstrates the pathophysiological importance of cofilin‐1 in this disease model. The changes in cofilin‐1 phosphorylation observed in the spinal cord of SOD1 transgenic mice were associated with an increased F/G‐actin ratio (Fig 5C and D). These alterations were specific to the spinal cord, the affected tissue in the SOD1G93A mice because no such changes were observed in the brains of the transgenic mice (Fig 5E and F). These results argue that cofilin‐1 signalling is altered in SOD1G93A mice.
Figure 5. SOD1 aggregates alter cofilin‐1 phosphorylation in SOD1G93A transgenic mice.
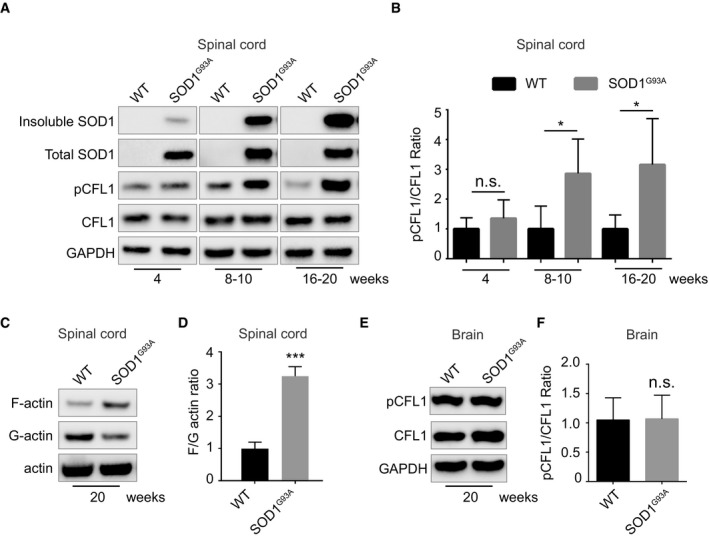
- Immunoblots of the indicated proteins in spinal cord lysates of SOD1G93A transgenic mice or wild‐type mice from 4 to 20 weeks of age.
- Quantifications of the pCFL1/CFL1 ratio in immunoblots such as the ones shown in (A). The graph depicts levels of pCFL1 relative to total CFL1 in lumbar region of the spinal cord of SOD1G93A compared with wild type. Data are means ± SEM (n = 4). Unpaired t‐test. Two‐tailed P‐values are 0.2359, 0.0363 and 0.0376 in each age group separately.
- Actin fractionation followed by immunoblots of spinal cord lysates from SOD1G93A transgenic or wild‐type mice (20 weeks old).
- Quantifications of the F‐actin/G‐actin ratio on immunoblots as in (C). The graph depicts the level of F‐actin/G‐actin ratio in lumbar region of the spinal cord of SOD1G93A compared with wild type at 20 weeks. Data are means ± SEM (n = 3). Unpaired t‐test. Two‐tailed ***P = 0.0004.
- Immunoblots of the indicated proteins in whole brain lysates of SOD1G93A transgenic or wild‐type mice (20 weeks old).
- Quantifications of the pCFL1/CFL1 ratio on immunoblots as in (E). The graph depicts the level of pCFL1 relative to total CFL1 in brains of SOD1G93A compared with wild type at 20 weeks. Data are means ± SEM (n = 5). Unpaired t‐test. Two‐tailed P = 0.8644.
Relevance of modifiers of SOD1 aggregate uptake to diverse protein aggregates
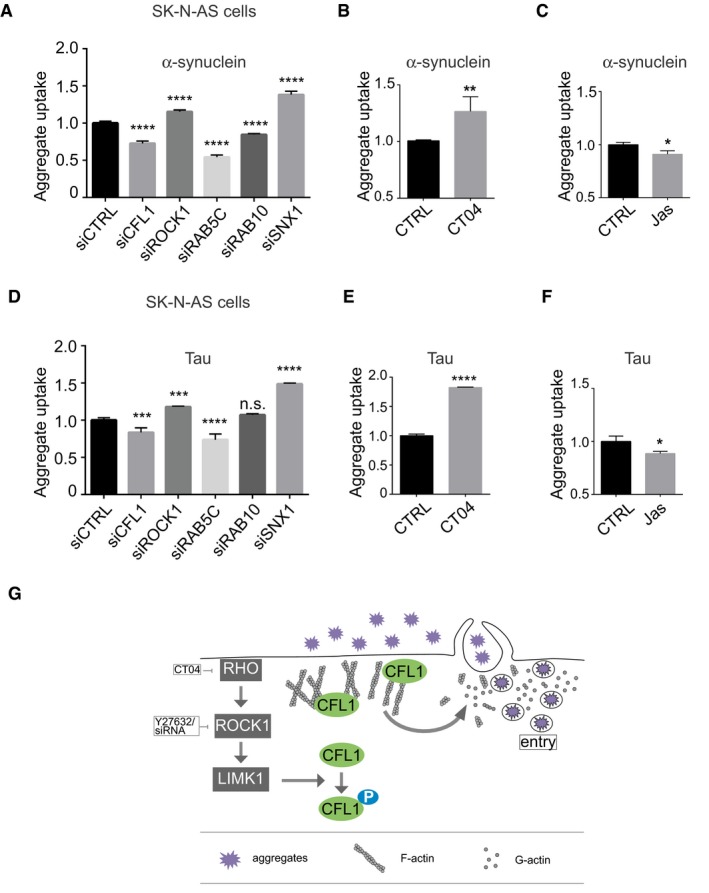
The diverse misfolded proteins associated with neurodegenerative diseases spread just like prions (Jucker & Walker, 2011) suggesting that some of the mechanisms underlying such properties may be shared. Having identified here a set of host factors modulating entry of SOD1 aggregates in cells and realizing that the actin barrier is also important in restricting viral entry, we next investigated whether the validated genes identified in the screen performed with SOD1 aggregates were relevant to other disease‐related protein aggregates. Aggregates made of α‐synuclein, the major component of deposits in Parkinson's disease, also spread from cell to cell (Danzer et al, 2007; Desplats et al, 2009). Recombinant α‐synuclein was produced as previously described (Murray et al, 2003), aggregated, labelled with Dylight‐650 and sonicated before being inoculated to cells, as previously reported (Danzer et al, 2007; Desplats et al, 2009). We next investigated whether the five validated genes identified in the SOD1 screen also modulated entry of α‐synuclein fibrils inside cells. As observed for SOD1 aggregates, we found that siRNA against cofilin‐1, RAB5C and RAB10 decreased aggregate entry whilst siRNA targeted at ROCK1 and SNX1 increased entry of α‐synuclein aggregates (Fig 6A). Pharmacological inhibition of RHO also increased α‐synuclein fibrils entry (Fig 6B), confirming that signalling upstream of cofilin‐1 is required to modify aggregate entry. Conversely, Jasplakinolide, which promotes actin polymerization, reduced aggregate entry (Fig 6C). This demonstrates that the RHO to cofilin‐1 signalling pathway leading to changes in actin dynamics modulates entry of two unrelated protein aggregates, SOD1G93A and α‐synuclein.
Figure 6. The RHO to cofilin‐1 signalling pathway modulates entry of diverse protein aggregates.
-
AFlow cytometry analysis of aggregate entry after inoculation of SK‐N‐AS cells with 0.1 μM Dylight‐650‐α‐synuclein aggregates and 3 days after transfection with the indicated siRNA. Fluorescence intensity was measured by flow cytometry on 10,000 cells per sample (n = 3). Ordinary one‐way ANOVA followed by multiple comparisons. ****P ≤ 0.0001.
-
B, CFlow cytometry analysis of α‐synuclein aggregate uptake as in (A) except that SK‐N‐AS cells were treated with 1 μg/ml CT04 (B) or 25 nM Jasplakinolide (C) for 16 h. Data are means ± SEM (n = 3). Unpaired t‐test. Two‐tailed P‐values are 0.0073 and 0.0159 for treatment with CT04 and Jasplakinolide, respectively.
-
DFlow cytometry analysis of SK‐N‐AS cells after inoculation with 0.06 μM Dylight‐650‐tau aggregates and 3 days after transfection with the indicated siRNA. Fluorescence intensity was measured by flow cytometry on 10,000 cells per sample (n = 3). Ordinary one‐way ANOVA followed by multiple comparisons. ***P ≤ 0.001, ****P ≤ 0.0001.
-
E, FSame as in (B and C) with tau aggregates. Data are means ± SEM (n ≥ 3). Representative results are shown. Data are means ± SEM (n = 3). Unpaired t‐test. Two‐tailed P‐values are 0.0001 and 0.0232 for treatment with CT04 and Jasplakinolide, respectively.
-
GThe Rho to cofilin‐1 signalling pathway is exploited by protein aggregates to remodel to cortical actin, enabling cell entry.
To further explore the possible general relevance of our findings to different protein aggregates, we next investigated the effect of the modifiers identified in the SOD1 screen on uptake of Dylight‐labelled recombinant tau aggregates prepared as described (Falcon et al, 2015). With the exception of RAB10, all the modifiers of SOD1 and α‐synuclein also modified entry of tau aggregates (Fig 6D). Importantly, as for SOD1 and α‐synuclein aggregates, inhibition of RHO increased tau aggregates entry (Fig 6E), whilst Jasplakinolide reduced aggregate entry (Fig 6F). Thus, diverse protein aggregates exploit the RHO‐ROCK1‐cofilin‐1 signalling pathway to overcome the actin barrier and invade cells, just like viruses do (Fig 6G).
Discussion
Using a focused siRNA screen, we have discovered that SOD1 aggregates exploit the actin depolymerizing factor cofilin‐1, a crucial regulator of actin dynamics, to remodel cortical actin and enter cells. Through a combination of approaches, we show that upstream of cofilin‐1, signalling through RHO, ROCK1 and LIMK1 restricts cofilin‐1 activity to stabilize cortical actin filaments, which act as a barrier to prevent aggregate entry. This work provides novel mechanistic insights in SOD1 aggregate entry, a process which has been poorly characterized so far, and identifies host factors modulating aggregate entry.
Recently, the realm of prions has expanded. There is now abundant literature showing that the diverse proteins associated with neurodegenerative diseases share the defining features of prions (Brundin et al, 2010; Frost & Diamond, 2010; Goedert et al, 2010; Jucker & Walker, 2011; Münch & Bertolotti, 2012). The mechanism underlying the prion‐like spread of disease‐causing proteins is unknown, particularly for aggregates that spread from cell to cell. Here, we focused on identifying one of the earliest events in this process, the internalization of aggregates, and reveal host cell factors mediating aggregate entry. Importantly, we show that aggregates made of the diverse disease‐causing proteins, mutant SOD1, α‐synuclein or tau, exploit the RHO to cofilin‐1 signalling pathway to weaken cortical actin, the first intracellular barrier and enter cells. This defines yet another common molecular feature to diverse neurodegenerative diseases.
Previously, we reported that mutant SOD1 enter cells using macropinocytosis (Münch et al, 2011), a finding recapitulated by others (Yerbury, 2016). Tau aggregates were also subsequently found to use macropinocytosis to enter cells in different studies (Holmes et al, 2013; Sanders et al, 2014; Falcon et al, 2015). However, further progress has been hindered by the fact that macropinocytosis is not well defined and due to the lack of specific agents to manipulate this process. Incidentally, the identification of cellular factors, cofilin‐1 and its regulators as modifiers of aggregate entry provides a framework for future investigations of a possible role of cofilin‐1 in macropinocytosis.
Our results reveal a pathway mediating aggregate entry. Through a combination of diverse pharmacological manipulations or knockdown of RHO, ROCK1 or LIMK1, we found that the dynamics of cofilin‐1 activity and actin polymerization is an important control of aggregate entry. This demonstrates the importance of cortical actin in forming a barrier to aggregate entry. However, it is noteworthy that none of the manipulations completely prevented aggregate entry, suggesting that cells adapted to the manipulations or that some alternative entry routes might be utilized, when one is compromised. Interestingly, some viruses can use multiple routes to enter cells (Cossart & Helenius, 2014). The changes in cofilin‐1 activity during aggregate entry are bi‐phasic, implying that actin ought to play a dual role in this process: at early stage of aggregate entry, actin depolymerization is required in order to weaken cortical actin which acts as a barrier to aggregates. This change is transient, with a rapid increase in cofilin‐1 phosphorylation following the initial decrease, probably due to a negative feedback loop. Indeed, cofilin‐1 dephosphorylation leads to actin disassembly, which in turn increases cofilin‐1 phosphorylation (Nagata‐Ohashi et al, 2004; Soosairajah et al, 2005; Liu et al, 2015). Although the dynamic of cofilin‐1 signalling cannot be captured in vivo, we find remarkable that cofilin‐1 phosphorylation dramatically increases with age in SOD1G93A spinal cord. This increased cofilin‐1 phosphorylation leads to its inactivation and results in an increase in filamentous actin. This establishes that cofilin‐1 and actin dynamics are altered in a mouse model of ALS. Considering the broad importance of actin function, such an alteration in actin dynamics ought to be deleterious. Further confirming the pathological relevance of these findings, these alterations were not widespread but restricted to the degenerating spinal cord. Thus, alteration of cofilin‐1 signalling and actin dynamics appears tightly correlated to neurodegeneration. Importantly, as we have found here in SOD1‐ALS mice, increased cofilin‐1 phosphorylation was observed in post‐mortem samples from ALS patients (Sivadasan et al, 2016). In addition, genetic links between ALS and alteration of actin dynamics also exist with mutations in the gene encoding the actin‐binding protein profilin 1, a protein with dual function on actin dynamics, causing familial ALS (Wu et al, 2012). The most common genetic cause of ALS and frontotemporal dementia consists in an aberrant hexanucleotide repeat expansions in C9orf72 (Guerreiro et al, 2015). These repeats are translated in di‐peptide repeat proteins which also spread like prions (Westergard et al, 2016). Intriguingly, C9orf72 was found to interact with cofilin‐1 and to increase cofilin‐1 phosphorylation through LIMK1/2 (Sivadasan et al, 2016). Our findings provide a mechanistic starting point to evaluate the interplay between cofilin‐1, actin dynamics and the spread of aggregates.
It is noteworthy that some viruses such as human immunodeficiency virus 1 (HIV1), herpes simplex virus 1 (HSV1) and rotavirus, also exploit cofilin‐1 for cell entry (Berkova et al, 2007; Yoder et al, 2008; Zheng et al, 2013). Like SOD1 aggregates, both HIV1 and HSV1 infection cause bi‐phasic change in cofilin‐1 activity to promote actin dynamics and enter cells (Yoder et al, 2008; Xiang et al, 2012; Zheng et al, 2013). It is remarkable that the strategy revealed here and used by different protein aggregates to penetrate inside cells shares similar components to those employed by some viruses. This reinforces the notion that protein aggregates share some of the properties of infectious agents.
Materials and Methods
Protein purification, labelling and aggregation
SOD1
Recombinant human H46R mutant SOD1 protein was purified from Sf9 cells as described previously (Münch et al, 2011). Purified SOD1 was cross‐linked with Dylight‐650 N‐hydroxysuccinimide (NHS) Ester (Thermo Fisher Scientific) according to the manufacturer's instructions.
To generate aggregates, labelled and unlabelled SOD1 were mixed (5 and 10 μM, respectively) with 20% 2,2,2‐trifluoroethanol (TFE, Sigma‐Aldrich) and MES (0.5 M, pH 6.3) for 24 h. The aggregates were purified by centrifugation at 20,000 g for 10 min at room temperature. Supernatant containing free dye and soluble protein was removed. The pellet was resuspended in Tris–NaCl buffer (10 mM Tris–HCL pH 8, 100 mM NaCl) and briefly sonicated before use (3 min, 1 s on/off). SOD1‐Dylight‐650 aggregates were used as a final concentration of 0.8 μM (monomer equivalent).
α‐synuclein
Recombinant human α‐synuclein was cloned into pRK172 vector and transformed in BL21 competent E. coli cells (NEB). Protein expression was induced by 0.1 mM IPTG for 4 h at 37°C in TB broth. The pellet of 1 L culture was resuspended in 50 ml of lysis buffer (50 mM Tris–HCl pH7.4, 2 mM EDTA, 5 mM MgSO4, 5 mM DTT, 0.2 mM PMSF, protease inhibitor and 20 mM NaCl). Cells were sonicated and spun at 40,572 g in a TLA45 rotor (Beckman) for 30 min. Filtered supernatant containing α‐synuclein was precipitated by 30% ammonium sulphate and centrifuged at 40,572 g in a TLA45 rotor (Beckman) for 30 min. The pellet was resuspended in lysis buffer and loaded on a 5 ml HiTrap Q HP anion‐exchange column (GE Healthcare). Elution was performed using a 0–1 M NaCl gradient. α‐synuclein eluted at around 150 mM NaCl. Fractions containing α‐synuclein were pooled and further purified by size exclusion a HiLoad 16/600 Superdex 200 PG column (GE Healthcare) in a buffer containing 50 mM Tris–HCl pH7.4, 2 mM EDTA, 5 mM MgSO4, 5 mM DTT and 20 mM NaCl. Fractions containing α‐synuclein (76–90 ml) were pooled and concentrated. α‐synuclein aggregation was induced by incubating protein at 37°C with 450 rpm shaking for 5 days. Protein fibrillization was confirmed using the thioflavin T (T3516, Sigma‐Aldrich) fluorescence assay. Protein aggregates were labelled with Dylight‐650 (Thermo Fisher Scientific) according to the manufacturer's instructions. Aggregates were sonicated (3 min, 1 s on/off) before use. α‐synuclein‐Dylight‐650 aggregates were used at a final concentration of 0.1 μM (monomer equivalent).
Tau
Recombinant tau‐441(2N4R) isoform protein was purchased from AnaSpec (AS‐55556‐100, AnaSpec EGT Corporate Headquarters). In vitro fibrillization of full‐length tau (2N4R) was prepared by mixing with 300 mM recombinant tau, 50 mM low molecular weight heparin and 2 mM DTT in 100 mM sodium acetate buffer under constant orbital agitation (1,000 rpm) at 37°C for 3 days (Falcon et al, 2015). Aggregates were labelled with Dylight‐650 (Thermo Fisher Scientific) according to the manufacturer's instructions and were sonicated (3 min, 1 s on/off) before being inoculated into cells. Dylight‐650‐tau aggregates were inoculated at a final concentration of 0.06 μM (monomer equivalent).
Three dimension (3D) images process
High‐resolution images of aggregates taken up by cells were obtained on a Leica SP8 confocal microscope (Leica Microsystem Ltd.). Images were obtained using a HC PL APO CS2 63× 1.4 NA objective. Multiple image planes were obtained, sampled at a spacing of 60 nm by 60 nm (lateral direction) and 300 nm (axial direction). Other Leica SP8 settings were Zoom 3, 5× line average, 600 Hz scan speed, 1,024 × 1,024 array size. The pinhole was set equivalent to 1 Airy at 580 nm for all channels. The microscope spectral detection windows were set as follows. H33342: excitation 405 nm, detection 410–475 nm; CellMask Green: excitation 514 nm, detection 518–593 nm; and Dylight‐650‐SOD1: excitation 633 nm, detection 639–747 nm. The green and far red signals were imaged on separate scans of the sample to minimize bleedthrough. Image stacks were segmented in three dimensions using Imaris Software (BITplane AG).
siRNA screen
siRNA libraries and plates preparation
Two SMARTpool siRNA libraries, containing four unique ON‐TARGETplus siRNA duplexes targeting total 224 genes, were used in the screen. Human Membrane Trafficking library (GE Healthcare, 140 genes) was used in plate 1 and plate 2. A custom membrane trafficking (84 genes) was used in plates 3 and 4. Non‐targeting siRNA were used as controls (columns 1 and 12) as well as mock transfections.
SMARTpool siRNA library (GE healthcare) was aliquoted into poly‐L‐lysine (Sigma‐Aldrich)‐coated CellCarrier 96 microplates (PerkinElmer) as stock plates and stored at −20°C. siRNA reverse transfection in plates was conducted by using DharmaFECT1 (GE healthcare) transfection reagent. After 72 h of transfection, 0.8 μM Dylight‐650‐labelled SOD1 in fresh medium was passed through a 0.45 μm filter and incubated in each well for 16 h (overnight).
Cells were washed by PBS and incubated with CellMask green plasma membrane stain (1:1,000; Thermo Fisher Scientific) and H33342 (1:10,000; Thermo Fisher Scientific) in PBS for 10 min. Cell plates were then fixed by 4% PFA for 15 min at room temperature before imaging.
Image acquisition and processing
96‐well plates were imaged using a Nikon high‐content analysis system under the control of NIS‐Elements JOBS software (Nikon UK Ltd). Images were obtained using a 20× 0.75 NA Plan Apo objective. A cropped camera array field corresponding to 630 × 630 μm in object space was used. Nine images were obtained in a regular 3 by 3 grid, spaced 1 mm apart, centred in each well. At each position, a three‐channel fluorescence image was taken as follows. H33342 (blue): emission 435–485 nm, typical exposure time 40 ms; CellMask green stain: emission 500–550 nm, typical exposure time 200 ms; Dylight‐650‐SOD1 (far red): emission 663–738 nm, typical exposure time 500 ms. Whilst fixed exposure values were used across each set of plates, some adjustments to the exposure time were made between replicates. At each position, the system first performed an autofocus operation using the CellMask green signal.
Images were analysed using the “general analysis” tool in NIS‐Elements‐HC software (Nikon UK Ltd). Individual nuclei were segmented to give a count of the number of cells per field. The CellMask green image was used to create a binary mask defining the area of the cells. Aggregates were identified using a spot detection tool. The total number of spots lying within the cell area binary mask per field was counted.
Secondary screen
The top 15 genes from the primary screen were applied to a secondary screen by set of four single siRNAs knockdown. Transfections of four single siRNA per gene were conducted as before in a 96‐well plates. The Z‐score threshold of 1.5 was applied in the secondary screen. The criterion is that at least two out of four siRNAs must be hits to be considered “on‐target”. Any gene containing contradictory results from the four single siRNAs was not taken into further validation. Genes which passed the secondary screen were used for further validation. Dharmacon ON‐TARGETplus non‐targeting siRNA (D‐001810‐01‐05) was used as a negative control. The sequences of the validated siRNA are CCUCUAUGAUGCAACCUAU for CFL1; GAACAAGAUCUGUCAAUUU for RAB5C; CUACAAGUGUUGCUAGUUU for ROCK1; CACGUUAGCUGAAGAUAUC for RAB10; GGAAAGAGCUAGCGCUGAA for SNX1. RAB5A gene knockdown and RAB5B gene knockdown were conducted by siRNA SMARTpool (GE Dharmacon L‐004009 and L‐004010 independently).
Mammalian cell culture
HEK293T cells were maintained in DMEM medium (11960044, Thermo Fisher Scientific) supplemented with l‐glutamine–penicillin–streptomycin solution (G6784; Sigma‐Aldrich) and 10% foetal bovine serum (FBS, 10270, Thermo Fisher Scientific).
SK‐N‐AS cells (ATCC, Cat#CRL2137) were cultured in DMEM medium supplemented with 1% MEM non‐essential amino acids (11140050, Thermo Fisher Scientific), l‐glutamine–penicillin–streptomycin solution and 10% FBS.
Cells were routinely tested for mycoplasma contaminations (GATC Biotech).
Primary neuron culture
C57 JAX mice were obtained from the Jackson Laboratories. Primary cortical neurons were prepared from E15.5 pups and cultured in Neurobasal media supplemented with B‐27 (Invitrogen) supplemented with l‐glutamine–penicillin–streptomycin solution (G6784; Sigma‐Aldrich) on tissue culture plates coated with poly‐L‐lysine (Sigma‐Aldrich). The neurons were maintained by changing medium every 3–4 days.
Expression of plasmids and siRNAs
Human LIMK1 cDNA in entry gateway cloning vector was obtained from GE Healthcare (Cat#OHS5894‐202502218) and recombined with pTGSH‐HA vector (Dualsystems Biotech AG) to produce the expression construct pTGSH‐LIMK1 with a C‐terminal haemagglutinin‐Strep tag. All plasmids were verified by sequencing. For transient transfection, cells were plated in 24‐well plates and constructs were transfected with FUGENE HD transfection reagent (Promega UK) for 48 h.
siRNAs were transfected with Lipofectamine RNAiMAX (Thermo Fisher Scientific) in SK‐N‐AS cells, plated in complete medium in 24‐well plates at a concentration of 105 cells/ml 1 day before the transfection. For the screen, siRNAs were reverse transfected into HEK293T cells. Briefly, DharmaFECT1 was diluted in OptiMEM (Thermo fisher scientific) and added to wells with siRNA to make the RNAi‐Dharma complex. HEK293T cells in complete growth medium (3 × 10⁴ cells/ml) were plated in each well to give a final concentration of 50 nM of siRNA. Cells were collected 48 or 72 h after transfection.
Cell treatments
RHO inhibitor CT04 (1 μg/ml; Cytoskeleton, Inc.), ROCK inhibitor Y27632 (10 μM; Tocris) or Jasplakinolide (25 nM; Santa Cruz) was applied to SK‐N‐AS in serum free medium for 16 h or primary neuron for 1 h.
Alexa488‐dextran (Mr ~10,000, Thermo Fisher Scientific) was dissolved in DMSO as 10 mg/ml stock. SK‐N‐AS cells were replaced by 0.5% serum medium for 16 h before 3.2 μM (monomer equivalent) SOD1 aggregates (prepared as before) or 800 μg/ml dextran inoculation for the indicated time.
Quantitative RT–PCR
Knockdown of genes was confirmed by quantitative RT–PCR (qPCR) 48 h after siRNA transfections in 96‐well plates. RNA was extracted with RNeasy mini kit (Qiagen) according to the manufacturer's instruction. 500 ng RNA was reverse transcribed to cDNA with the iScript cDNA synthesis kit (Bio‐Rad) according to the manufacturer's instruction. qRT–PCR gene amplification was conducted with CYBR Select Master Mix (Applied Biosystems) in Corbett Research Rotor‐Gene real‐time PCR machine version 6000 (Thermo Fisher Scientific). Expression of each gene was normalized to the housekeeping gene gapdh and expressed as fold change (2ΔΔCT).
qPCR primers: CFL1 (F: GTGCCCTCTCCTTTTCGTTT; R: TTGAACACCTTGATGACACCAT); RAB5C (F:CCGCTTTGTCAAGGGACAGTT; R:AGGCTGTGATACCGCTCCT); ROCK1 (F:GATCCCAAATCGGAAGTGAA; R:CAAATCATATACCAAAGCATCCAA); RAB10 (F:TTCGGATGATGCCTTCAATA; R:AGGAGGTTGTGATGGTGTGA); SNX1 (F:CATGTTACAGGACCCTGACG; R:GACCAGCACCACTCAATGTC); GAPDH (F: ACCACAGTCCATGCCATCAC; R: TCCACCACCCTGTTGCTGTA).
Flow cytometry
0.8 μM Dylight‐650‐SOD1H46R (0.1 μM Dylight‐650‐α‐synuclein or 0.06 μM Dylight‐650‐tau) aggregates were inoculated in cells for the times indicated. The excessive aggregates were removed by washing with PBS. Cells were digested with 0.25% trypsin to digest the extracellular aggregates and to produce a single‐cell suspension.
Fluorescence intensity was measured by flow cytometry on 10,000 cells per sample on a LSRFortessaTM (BD Biosciences). FlowJo (v10) (FlowJo LLC) was applied for fluorescence intensity quantification. The median fluorescence intensity of each sample was normalized to control.
Immunoblot
Cells or mouse tissue were lysed with RIPA buffer (Cell Signaling Technology) plus protease inhibitor and PhosStop (Sigma‐Aldrich). Cell lysates were sonicated and quantified with the BCA assay kit (Pierce BCA Protein Assay Kit, Thermo Fisher Scientific). Samples were boiled with Laemmli buffer at 95°C for 5 min and loaded onto Bolt 4–12% Bis–Tris plus gel (Thermo Fisher Scientific) in MES buffer. Gels were transferred to nitrocellulose membranes (Thermo Fisher Scientific). Membranes were incubated with antibodies as follows: anti‐CFL1 (1:10,000; Abcam, ab42824); anti‐pCFL1 (1:1,000; Cell Signaling Technology, 77G2); anti‐ROCK1 (1:2,000; Abcam, ab45171); anti‐GAPDH (1:2,000; Millipore); anti‐actin (1:1,000; Abcam, ab3280); and anti‐human SOD1, clone C4F6 (1:1,000; Medimabs, Cat#MM‐0070‐2‐P). Horseradish peroxidase‐conjugated anti‐mouse or anti‐rabbit antibody was used as secondary antibody (Promega). Membranes were revealed with ECL Prime (GE Healthcare) and ChemiDoc Touch (Bio‐Rad).
F‐actin and G‐actin separation and F‐actin/G‐actin ratio determination
F/G‐actin was fractionated with G‐actin/F‐actin in vivo assay kit (Cytoskeleton, Inc) according to the manufacturer's instruction. Briefly, the cell or mouse tissue was lysed with LAS2 buffer at 37°C for 10 min. Cell debris were removed by centrifugation at 425 g for 5 min. 100 μl of the supernatant was ultra‐centrifuged (Beckman rotor TLA55) at 100,000 g for 1 h at 37°C to separate the G‐actin (supernatant) and F‐actin (pellet). The pellet was lysed with 100 μl of F‐actin depolymerization buffer for 1 h on ice. The samples were used for actin quantification by SDS–PAGE and immunoblot analysis.
SOD1 fractionation
Spinal cords from SOD1 mutant mice were homogenized (100 mg/ml) in homogenization buffer (PBS containing 1 mM EDTA, 1 mM EGTA and 10 mM TCEP, as well as 20 mM iodoacetamide plus complete protease inhibitor mixture (Sigma‐Aldrich)). After centrifugation at 17,000 g for 20 min, the supernatants were collected. Pellets were washed twice with the homogenization buffer, solubilized in Laemmli buffer containing 100 mM of TCEP, sonicated for 5 min and boiled at 95°C for 5 min. Protein samples from the soluble and insoluble extracts were separated and analysed by SDS–PAGE and immunoblot analysis.
Immunofluorescence
Cells were fixed with 4% PFA in PBS for 8 min followed by permeabilization with 0.1% Triton X‐100 in PBS (PBST) and blocked with 5% normal goat serum (NGS)/PBS. Cells were stained with Alexa Fluor 594‐Phalloidin (Invitrogen) (1:40 in 1% NGS/PBST) or anti‐CFL1 antibody (1:10,000 in 1%NGS/PBST) at room temperature for 1 h followed by Alexa Fluor 488 linked goat‐anti‐rabbit secondary antibody (Thermo Fisher Scientific) for another 1 h, then mounted with Pro‐Long gold anti‐fade mountant (Thermo Fisher Scientific). Images were taken with the Zeiss 780 confocal microscope (Carl Zeiss Ltd.) using 63× objective for z‐stacks. Images were typically 1,024 × 1,024 pixels. The stacks of z‐section were recorded at 0.5‐μm intervals to encompass the full width of each cell.
Mouse model
Mouse care and procedures were performed in compliance with the regulation on the use of Animals in Research (UK Animals Scientific Procedures Act of 1986 and the EU Directive 2010/63/EU) with local ethical approval.
SOD1 mice SOD1G93A in C57BL/6J were used previously (Das et al, 2015; Luh et al, 2017). The lumbar region of the spinal cord of SOD1G93A and wild‐type littermates as well as the whole brain was collected for analysis.
Quantification and statistical analysis
All data are presented as means ± SEM. Data were analysed using one‐way ANOVA test followed by multiple comparison or unpaired t‐test (two samples comparison) was applied using Prism 7.02 (GraphPad Software, La Jolla, CA). The level of significance was set at *P < 0.05 as significantly different, and **P < 0.01, ***P < 0.001, ****P < 0.0001 as highly significantly different. n.s. not significantly different, P ≥ 0.05. The statistical method, sample number (n) and P‐values (t‐test) are specified in each figure legends.
Statistical analysis in screen and ranking of genes
Screening data for each gene comprising location in the imaged well‐plate array, cell count and number of fluorescent aggregates per cell were extracted for statistical analysis to detect any hit genes which, when knocked down, give rise to significantly more or significantly fewer fluorescent aggregates than average.
Initially, the number of cells imaged in each sample was assessed to discount gene knockdowns that adversely affect cell viability. Accordingly, for each replicate experiment, a minimum accepted cell count was calculated as the value 1.5 standard deviations below the median count. Array locations with cell counts below this cut‐off were excluded from further analysis.
Graphical representation of the spots per cell (SPC) data in a reconstructed colour matrix form, corresponding to the siRNA well plate (as used in Fig EV3A), illustrated that there were systematic effects resulting from the samples' location in the experimental array. Accordingly, the first and last columns of the array were not used and the SPC data were normalized on a per‐row basis.
The row‐based normalization involved scaling each row of SPC values so that the sum of adjusted SPC values is the same for all rows. The SPC data for each replicate were centred and scaled separately, by expressing them as primary Z‐scores for each individual replicate. Subsequently, these were then used to calculate a combined Z‐score, considering all four replicates. The combined Z‐scores were calculated from the distribution of the genes' mean primary score, that is the Z‐normalized gene data from separate replicates was averaged and analysed to make a new score. All of the Z‐scores were calculated using robust estimates for the centre and standard deviation of the respective distributions.
The data were presented as a ranked gene list (see Fig EV3B), according to the magnitude of the combined Z‐score over all experimental repeats.
Author contributions
AB conceived, directed the study and wrote the manuscript. ZZ conceived and performed experiments, prepared the figures and helped in writing the manuscript. NB and ZZ developed imaging method and NB assisted with confocal microscopy. TS provided computational biology support and performed the statistical analysis in the screen. CS contributed to SOD1 protein purification and SOD1 aggregate characterization. LG performed the additional experiments required for the revision.
Conflict of interest
The authors declare that they have no conflict of interest.
Supporting information
Expanded View Figures PDF
Movie EV1
Source Data for Expanded View
Review Process File
Source Data for Figure 1
Source Data for Figure 2
Source Data for Figure 3
Source Data for Figure 4
Source Data for Figure 5
Source Data for Figure 6
Acknowledgements
We are grateful to Robin Ketteler, who provided a set of custom siRNAs, Cleo Bishop for advice on the screen design, Indrajit Das for SOD1 mice tissues, Yvonne Vallis for help with primary neurons and Arnaud Echard for discussions. This work was supported by the Medical Research Council (UK) MC‐A023‐5PD71, a Motor Neurone Disease Association grant (Bertolotti/Apr11/6072) and the European Research Council under the European Union's Seventh Framework Programme (FP7/2007‐2013)/ERC grant 309516. A.B. is an honorary fellow of the Clinical Neurosciences Department of Cambridge University.
The EMBO Journal (2018) 37: e97822
References
- Ayers JI, Fromholt S, Koch M, DeBosier A, McMahon B, Xu G, Borchelt DR (2014) Experimental transmissibility of mutant SOD1 motor neuron disease. Acta Neuropathol 128: 791–803 [DOI] [PubMed] [Google Scholar]
- Ayers JI, Fromholt SE, O'Neal VM, Diamond JH, Borchelt DR (2015) Prion‐like propagation of mutant SOD1 misfolding and motor neuron disease spread along neuroanatomical pathways. Acta Neuropathol 131: 103–114 [DOI] [PMC free article] [PubMed] [Google Scholar]
- Berkova Z, Crawford SE, Blutt SE, Morris AP, Estes MK (2007) Expression of rotavirus NSP4 alters the actin network organization through the actin remodeling protein cofilin. J Virol 81: 3545–3553 [DOI] [PMC free article] [PubMed] [Google Scholar]
- Brundin P, Melki R, Kopito R (2010) Prion‐like transmission of protein aggregates in neurodegenerative diseases. Nat Rev Mol Cell Biol 11: 301–307 [DOI] [PMC free article] [PubMed] [Google Scholar]
- Cossart P, Helenius A (2014) Endocytosis of viruses and bacteria. Cold Spring Harb Perspect Biol 6: a016972 [DOI] [PMC free article] [PubMed] [Google Scholar]
- Danzer KM, Haasen D, Karow AR, Moussaud S, Habeck M, Giese A, Kretzschmar H, Hengerer B, Kostka M (2007) Different species of alpha‐synuclein oligomers induce calcium influx and seeding. J Neurosci 27: 9220–9232 [DOI] [PMC free article] [PubMed] [Google Scholar]
- Das I, Krzyzosiak A, Schneider K, Wrabetz L, D'Antonio M, Barry N, Sigurdardottir A, Bertolotti A (2015) Preventing proteostasis diseases by selective inhibition of a phosphatase regulatory subunit. Science 348: 239–242 [DOI] [PMC free article] [PubMed] [Google Scholar]
- Desplats P, Lee HJ, Bae EJ, Patrick C, Rockenstein E, Crews L, Spencer B, Masliah E, Lee SJ (2009) Inclusion formation and neuronal cell death through neuron‐to‐neuron transmission of alpha‐synuclein. Proc Natl Acad Sci USA 106: 13010–13015 [DOI] [PMC free article] [PubMed] [Google Scholar]
- Falcon B, Cavallini A, Angers R, Glover S, Murray TK, Barnham L, Jackson S, O'Neill MJ, Isaacs AM, Hutton ML, Szekeres PG, Goedert M, Bose S (2015) Conformation determines the seeding potencies of native and recombinant Tau aggregates. J Biol Chem 290: 1049–1065 [DOI] [PMC free article] [PubMed] [Google Scholar]
- Frost B, Diamond MI (2010) Prion‐like mechanisms in neurodegenerative diseases. Nat Rev Neurosci 11: 155–159 [DOI] [PMC free article] [PubMed] [Google Scholar]
- Goedert M, Clavaguera F, Tolnay M (2010) The propagation of prion‐like protein inclusions in neurodegenerative diseases. Trends Neurosci 33: 317–325 [DOI] [PubMed] [Google Scholar]
- Gowers WR (1892) Manual of diseases of the nervous system, Vol. I. London: J. & A. Churchill; [Google Scholar]
- Grad LI, Guest WC, Yanai A, Pokrishevsky E, O'Neill MA, Gibbs E, Semenchenko V, Yousefi M, Wishart DS, Plotkin SS, Cashman NR (2011) Intermolecular transmission of superoxide dismutase 1 misfolding in living cells. Proc Natl Acad Sci USA 108: 16398–16403 [DOI] [PMC free article] [PubMed] [Google Scholar]
- Grad LI, Yerbury JJ, Turner BJ, Guest WC, Pokrishevsky E, O'Neill MA, Yanai A, Silverman JM, Zeineddine R, Corcoran L, Kumita JR, Luheshi LM, Yousefi M, Coleman BM, Hill AF, Plotkin SS, Mackenzie IR, Cashman NR (2014) Intercellular propagated misfolding of wild‐type Cu/Zn superoxide dismutase occurs via exosome‐dependent and ‐independent mechanisms. Proc Natl Acad Sci USA 111: 3620–3625 [DOI] [PMC free article] [PubMed] [Google Scholar]
- Guerreiro R, Brás J, Hardy J (2015) SnapShot: genetics of ALS and FTD. Cell 160: 798–798.e1 [DOI] [PubMed] [Google Scholar]
- Gurney ME, Pu H, Chiu AY, Dal Canto MC, Polchow CY, Alexander DD, Caliendo J, Hentati A, Kwon YW, Deng HX, Chen W, Zhai P, Sufit RL, Siddique T (1994) Motor neuron degeneration in mice that express a human Cu, Zn superoxide dismutase mutation. Science 264: 1772–1775 [DOI] [PubMed] [Google Scholar]
- Holmes BB, DeVos SL, Kfoury N, Li M, Jacks R, Yanamandra K, Ouidja MO, Brodsky FM, Marasa J, Bagchi DP, Kotzbauer PT, Miller TM, Papy‐Garcia D, Diamond MI (2013) Heparan sulfate proteoglycans mediate internalization and propagation of specific proteopathic seeds. Proc Natl Acad Sci USA 110: E3138–E3147 [DOI] [PMC free article] [PubMed] [Google Scholar]
- Holzinger A (2009) Jasplakinolide: an actin‐specific reagent that promotes actin polymerization. Methods Mol Biol 586: 71–87 [DOI] [PubMed] [Google Scholar]
- Johnston JA, Dalton MJ, Gurney ME, Kopito RR (2000) Formation of high molecular weight complexes of mutant Cu, Zn‐superoxide dismutase in a mouse model for familial amyotrophic lateral sclerosis. Proc Natl Acad Sci USA 97: 12571–12576 [DOI] [PMC free article] [PubMed] [Google Scholar]
- Jucker M, Walker LC (2011) Pathogenic protein seeding in alzheimer disease and other neurodegenerative disorders. Ann Neurol 70: 532–540 [DOI] [PMC free article] [PubMed] [Google Scholar]
- Lappalainen P, Drubin DG (1997) Cofilin promotes rapid actin filament turnover in vivo . Nature 388: 78–82 [DOI] [PubMed] [Google Scholar]
- Liu L, Oliveira NM, Cheney KM, Pade C, Dreja H, Bergin A‐MH, Borgdorff V, Beach DH, Bishop CL, Dittmar MT, McKnight Á (2011) A whole genome screen for HIV restriction factors. Retrovirology 8: 94 [DOI] [PMC free article] [PubMed] [Google Scholar]
- Liu L, Li J, Zhang L, Zhang F, Zhang R, Chen X, Brakebusch C, Wang Z, Liu X (2015) Cofilin phosphorylation is elevated after F‐actin disassembly induced by Rac1 depletion. BioFactors 41: 352–359 [DOI] [PubMed] [Google Scholar]
- Luh LM, Das I, Bertolotti A (2017) qMotor, a set of rules for sensitive, robust and quantitative measurement of motor performance in mice. Nat Protoc 12: 1451–1457 [DOI] [PMC free article] [PubMed] [Google Scholar]
- Maekawa M, Ishizaki T, Boku S, Watanabe N, Fujita A, Iwamatsu A, Obinata T, Ohashi K, Mizuno K, Narumiya S (1999) Signaling from Rho to the actin cytoskeleton through protein kinases ROCK and LIM‐kinase. Science 285: 895–898 [DOI] [PubMed] [Google Scholar]
- Mizuno K, Yang N, Higuchi O, Ohashi K, Nagata K, Wada A, Kangawa K, Nishida E (1998) Cofilin phosphorylation by LIM‐kinase 1 and its role in Rac‐mediated actin reorganization. Nature 393: 809–812 [DOI] [PubMed] [Google Scholar]
- Mizuno K (2013) Signaling mechanisms and functional roles of cofilin phosphorylation and dephosphorylation. Cell Signal 25: 457–469 [DOI] [PubMed] [Google Scholar]
- Münch C, Bertolotti A (2012) Propagation of the prion phenomenon: beyond the seeding principle. J Mol Biol 421: 491–498 [DOI] [PubMed] [Google Scholar]
- Münch C, O'Brien J, Bertolotti A (2011) Prion‐like propagation of mutant superoxide dismutase‐1 misfolding in neuronal cells. Proc Natl Acad Sci USA 108: 3548–3553 [DOI] [PMC free article] [PubMed] [Google Scholar]
- Murray IVJ, Giasson BI, Quinn SM, Koppaka V, Axelsen PH, Ischiropoulos H, Trojanowski JQ, Lee VM‐Y (2003) Role of α‐synuclein carboxy‐terminus on fibril formation in vitro†. Biochemistry 42: 8530–8540 [DOI] [PubMed] [Google Scholar]
- Nagata‐Ohashi K, Ohta Y, Goto K, Chiba S, Mori R, Nishita M, Ohashi K, Kousaka K, Iwamatsu A, Niwa R, Uemura T, Mizuno K (2004) A pathway of neuregulin‐induced activation of cofilin‐phosphatase Slingshot and cofilin in lamellipodia. J Cell Biol 165: 465–471 [DOI] [PMC free article] [PubMed] [Google Scholar]
- Prusiner SB (1998) Prions. Proc Natl Acad Sci USA 95: 13363–13383 [DOI] [PMC free article] [PubMed] [Google Scholar]
- Prusiner SB (2012) Cell biology. A unifying role for prions in neurodegenerative diseases. Science 336: 1511–1513 [DOI] [PMC free article] [PubMed] [Google Scholar]
- Ravits JM, La Spada AR (2009) ALS motor phenotype heterogeneity, focality, and spread: deconstructing motor neuron degeneration. Neurology 73: 805–811 [DOI] [PMC free article] [PubMed] [Google Scholar]
- Sanders DW, Kaufman SK, DeVos SL, Sharma AM, Mirbaha H, Li A, Barker SJ, Foley AC, Thorpe JR, Serpell LC, Miller TM, Grinberg LT, Seeley WW, Diamond MI (2014) Distinct tau prion strains propagate in cells and mice and define different tauopathies. Neuron 82: 1271–1288 [DOI] [PMC free article] [PubMed] [Google Scholar]
- Sibilla C, Bertolotti A (2017) Prion properties of SOD1 in amyotrophic lateral sclerosis and potential therapy. Cold Spring Harb Perspect Biol 9: a024141 [DOI] [PMC free article] [PubMed] [Google Scholar]
- Sivadasan R, Hornburg D, Drepper C, Frank N, Jablonka S, Hansel A, Lojewski X, Sterneckert J, Hermann A, Shaw PJ, Ince PG, Mann M, Meissner F, Sendtner M (2016) C9ORF72 interaction with cofilin modulates actin dynamics in motor neurons. Nat Neurosci 19: 610–1618 [DOI] [PubMed] [Google Scholar]
- Soosairajah J, Maiti S, Wiggan O, Sarmiere P, Moussi N, Sarcevic B, Sampath R, Bamburg JR, Bernard O (2005) Interplay between components of a novel LIM kinase‐slingshot phosphatase complex regulates cofilin. EMBO J 24: 473–486 [DOI] [PMC free article] [PubMed] [Google Scholar]
- Soto C (2003) Unfolding the role of protein misfolding in neurodegenerative diseases. Nat Rev Neurosci 4: 49–60 [DOI] [PubMed] [Google Scholar]
- Thomas EV, Fenton WA, McGrath J, Horwich AL (2017) Transfer of pathogenic and nonpathogenic cytosolic proteins between spinal cord motor neurons in vivo in chimeric mice. Proc Natl Acad Sci USA 114: E3139–E3148 [DOI] [PMC free article] [PubMed] [Google Scholar]
- Wang J, Farr GW, Zeiss CJ, Rodriguez‐Gil DJ, Wilson JH, Furtak K, Rutkowski DT, Kaufman RJ, Ruse CI, Yates JR, Perrin S, Feany MB, Horwich AL (2009) Progressive aggregation despite chaperone associations of a mutant SOD1‐YFP in transgenic mice that develop ALS. Proc Natl Acad Sci USA 106: 1392–1397 [DOI] [PMC free article] [PubMed] [Google Scholar]
- Westergard T, Jensen BK, Wen X, Cai J, Kropf E, Iacovitti L, Pasinelli P, Trotti D (2016) Cell‐to‐cell transmission of dipeptide repeat proteins linked to C9orf72‐ALS/FTD. Cell Rep 17: 645–652 [DOI] [PMC free article] [PubMed] [Google Scholar]
- Wu C‐H, Fallini C, Ticozzi N, Keagle PJ, Sapp PC, Piotrowska K, Lowe P, Koppers M, McKenna‐Yasek D, Baron DM, Kost JE, Gonzalez‐Perez P, Fox AD, Adams J, Taroni F, Tiloca C, Leclerc AL, Chafe SC, Mangroo D, Moore MJ et al (2012) Mutations in the profilin 1 gene cause familial amyotrophic lateral sclerosis. Nature 488: 499–503 [DOI] [PMC free article] [PubMed] [Google Scholar]
- Xiang Y, Zheng K, Ju H, Wang S, Pei Y, Ding W, Chen Z, Wang Q, Qiu X, Zhong M, Zeng F, Ren Z, Qian C, Liu G, Kitazato K, Wang Y (2012) Cofilin 1‐mediated biphasic F‐actin dynamics of neuronal cells affect herpes simplex virus 1 infection and replication. J Virol 86: 8440–8451 [DOI] [PMC free article] [PubMed] [Google Scholar]
- Yerbury JJ (2016) Protein aggregates stimulate macropinocytosis facilitating their propagation. Prion 10: 119–126 [DOI] [PMC free article] [PubMed] [Google Scholar]
- Yoder A, Yu D, Dong L, Iyer SR, Xu X, Kelly J, Liu J, Wang W, Vorster PJ, Agulto L, Stephany DA, Cooper JN, Marsh JW, Wu Y (2008) HIV envelope‐CXCR4 signaling activates cofilin to overcome cortical actin restriction in resting CD4 T cells. Cell 134: 782–792 [DOI] [PMC free article] [PubMed] [Google Scholar]
- Zeineddine R, Pundavela JF, Corcoran L, Stewart EM, Do‐Ha D, Bax M, Guillemin G, Vine KL, Hatters DM, Ecroyd H, Dobson CM, Turner BJ, Ooi L, Wilson MR, Cashman NR, Yerbury JJ (2015) SOD1 protein aggregates stimulate macropinocytosis in neurons to facilitate their propagation. Mol Neurodegener 10: 57 [DOI] [PMC free article] [PubMed] [Google Scholar]
- Zheng K, Xiang Y, Wang Q, Zhong M, Wang S, Wang X, Fan J, Kitazato K, Wang Y (2013) Epidermal growth factor receptor‐PI3K signaling controls cofilin activity to facilitate herpes simplex virus 1 entry into neuronal cells. MBio 5: e00958–13 [DOI] [PMC free article] [PubMed] [Google Scholar]
Associated Data
This section collects any data citations, data availability statements, or supplementary materials included in this article.
Supplementary Materials
Expanded View Figures PDF
Movie EV1
Source Data for Expanded View
Review Process File
Source Data for Figure 1
Source Data for Figure 2
Source Data for Figure 3
Source Data for Figure 4
Source Data for Figure 5
Source Data for Figure 6


