Circulating virus-specific CCR5+ effector memory CD4+ T cells primed by past exposures to related viruses (1) respond rapidly to rhinovirus and (2) contribute to virus control through enhanced activation and tissue-homing ability.
Keywords: CCR5, MHCII tetramers, neutralizing antibodies, rhinovirus, Th1
Abstract
Background
Little is known about T cells that respond to human rhinovirus in vivo, due to timing of infection, viral diversity, and complex T-cell specificities. We tracked circulating CD4+ T cells with identical epitope specificities that responded to intranasal challenge with rhinovirus (RV)-A39, and we assessed T-cell signatures in the nose.
Methods
Cells were monitored using a mixture of 2 capsid-specific major histocompatibility complex II tetramers over a 7-week period, before and after RV-A39 challenge, in 16 human leukocyte antigen-DR4+ subjects who participated in a trial of Bifidobacterium lactis (Bl-04) supplementation.
Results
Pre-existing tetramer+ T cells were linked to delayed viral shedding, enriched for activated CCR5+ Th1 effectors, and included a minor interleukin-21+ T follicular helper cell subset. After RV challenge, expansion and activation of virus-specific CCR5+ Th1 effectors was restricted to subjects who had a rise in neutralizing antibodies, and tetramer-negative CCR5+ effector memory types were comodulated. In the nose, CXCR3−CCR5+ T cells present during acute infection were activated effector memory type, whereas CXCR3+ cells were central memory type, and cognate chemokine ligands were elevated over baseline. Probiotic had no T-cell effects.
Conclusions
We conclude that virus-specific CCR5+ effector memory CD4+ T cells primed by previous exposure to related viruses contribute to the control of rhinovirus.
The common cold exacts an enormous health and economic burden on a global scale, with 1 billion colds occurring annually within the United States alone [1]. Human rhinovirus (RV), a picornavirus, is the major cause of common cold. Although often considered innocuous, RV poses serious and life-threatening health risks among children and adults with chronic diseases of the lower airways, including asthma, chronic obstructive pulmonary disease, and cystic fibrosis [2–9]. Moreover, RV has been implicated in the development of asthma, which impacts ~8%–10% of populations in developed countries [10–12].
Despite several decades of study, knowledge of adaptive immunity to RV in humans remains nascent, and preventive treatments are lacking. These shortcomings arise from 3 key barriers. First, to fully comprehend adaptive immunity, it is critical to study RV infection in a time-controlled fashion, owing to the complex and dynamic kinetics of antiviral responses. Second, mouse models are suboptimal owing to the fact that the major group viruses do not bind mouse intercellular adhesion molecule-1 or else fail to recapitulate all the features of common cold occurring in humans [13]. Finally, RV displays a high degree of antigenic variability, and RV infection does not induce durable protection against reinfection with either the same or unrelated strains [14–19].
The induction of neutralizing antibodies during infection and the presence of serum immunoglobulin G antibodies specific for RV capsid proteins each indicate a requirement for T-cell help [20, 21]. This is bolstered by identification of RV-specific CD4+ T-cell clones that secrete interferon (IFN)-γ and the presence of IFN-γ+ CD4+ T cells in bronchoalveolar lavage of asthmatics undergoing experimental RV challenge [22, 23]. We and others have recently reported on immunodominant CD4+ T-cell epitopes of RV capsid proteins, VP1 and VP2 [24, 25]. Those results confirmed the presence of multiple peptide/major histocompatibility complex II (MHCII) specificities in human leukocyte antigen (HLA)-diverse individuals.
In this study, we describe the use of MHCII tetramers to precisely track virus-specific CD4+ T cells and assess their relationship to infection profiles after intranasal challenge with RV-A39. Owing to inherent variability in the response to RV in humans, we sought to monitor only those T cells with identical epitope specificities. To accomplish this, we recruited HLA-DR4+ subjects within a large cohort of subjects who participated in a clinical trial of probiotic supplementation for the common cold [26, 27]. Our findings support a key role for CCR5+ Th1 effectors in the control of RV infection.
METHODS
Study Design
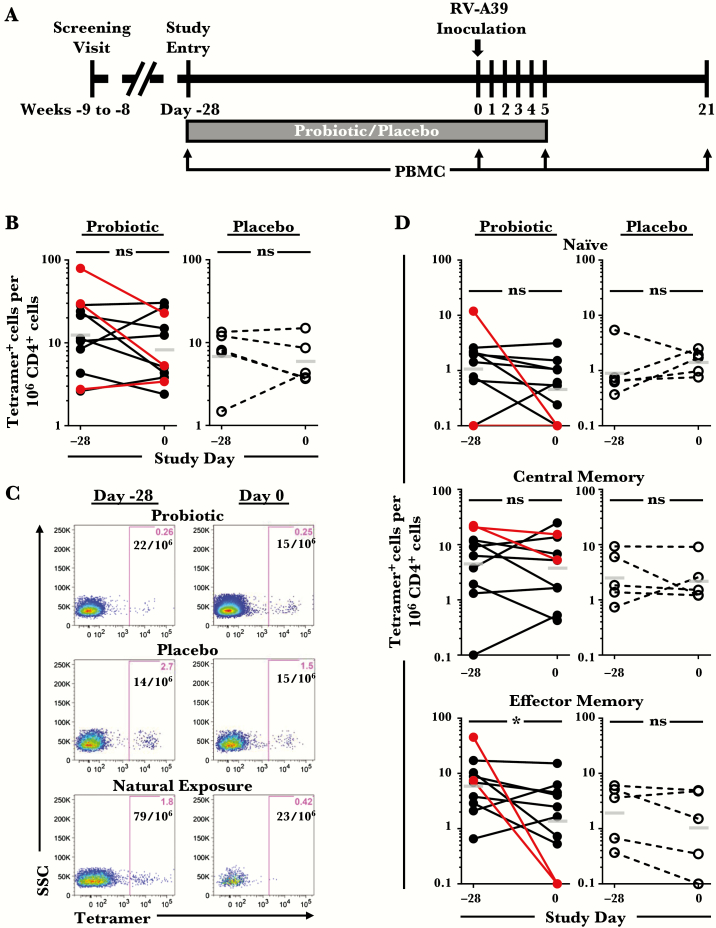
Subjects expressing the common allele HLA-DRB1*0401 (HLA-DR4+) were identified by HLA typing a large cohort enrolled in a randomized double-blind placebo-controlled trial of probiotic supplementation for common cold using Bifidobacterium animalis subsp lactis Bl-04 at the University of Virginia Medical Center (NCT01669603) (Supplementary Figure 1) [27]. Sixteen healthy HLA-DR4+ subjects (ages 18–60 years) completed RV challenge. Blood was obtained from study subjects before treatment (day −28), before RV-A39 challenge (day 0), and during the acute and convalescent infection (days 5 and 21) (Figure 1A). Nasal wash specimens for T-cell studies were analyzed from 8 infected HLA-diverse subjects on day 5 of RV-A39 challenge. Additional HLA-DR4+ healthy subjects not undergoing RV challenge were recruited through the University of Virginia. Informed consent was obtained from all study participants, and research was approved by the University of Virginia Human Investigation Committee. See the Online Supplement for additional details.
Figure 1.
Numbers of pre-existing circulating rhinovirus (RV)-A39-specific CD4+ T cells and their memory signature. (A) Experimental model of probiotic supplementation with RV-A39 challenge. (B) Comparison of the numbers of circulating tetramer+ T cells at day −28 (presupplementation) and day 0 (postsupplementation and immediately before RV inoculation) in HLA-DR4+ subjects (probiotic, n = 11; placebo, n = 5). Subjects shown in red had evidence of natural exposure to RV-A39 or related viral species. Bars denote geometric means. (C) Representative data from 3 subjects. (D) Numbers of tetramer+ T cells with naive (CD45RO−), central memory (CCR7+CD45RO+), or effector memory (CCR7−CD45RO+) phenotypes in each group. One subject receiving probiotic was excluded from phenotypic analyses owing to technical limitations. *, P < .05. Abbreviations: ns, not significant; PBMC, peripheral blood mononuclear cells.
Identification of Virus-Specific CD4+ T Cells
Virus-specific CD4+ T cells were identified by tetramer staining of peripheral blood mononuclear cells (PBMCs) obtained by density gradient centrifugation [24]. We previously described the development of 2 HLA-DR4 tetramers that display 1 peptide epitope each from the capsid proteins VP1 and VP2 of RV-A39 [24]. Tetramer+ cells were identified directly ex vivo using a mixture of both phycoerythrin (PE)-conjugated tetramers to stain PBMCs. Tetramer+ cells were then enriched from PBMCs using an anti-PE column and stained for surface markers, and T-cell frequencies were calculated according to established methods [28]. Analysis of intracellular cytokines was performed after in vitro expansion with RV-A39 peptides by established methods [24]. See the Online Supplement for additional details.
Analysis of CD4+ T Cells in Nasal Washes
Mucus was gently dissociated with warm phosphate-buffered saline and filtered using a 35-μm nylon mesh filter (Corning Life Sciences, Corning, NY). Cells were then stained for viability and surface markers before analysis by flow cytometry.
Flow Cytometry
Cells were analyzed on an LSRFortessa (BD Biosciences, San Jose, CA). Cell population gating was performed using fluorescence-minus-one controls, and a control tetramer displaying an irrelevant peptide (GAD555-567) [29] confirmed the specificity of RV tetramer staining. Compensation and manual gating analysis was performed using FlowJo, version 9.3.3 (FlowJo LLC, Ashland, OR). Unsupervised high-dimensional analysis using a t-distributed stochastic neighbor embedding (t-SNE) algorithm was performed using ACCENSE and Cytobank (http://cytobank.org) [30, 31]. Expression levels of CD45RO, CCR7, CCR5, CD25, and interleukin (IL)-7Rα were used to generate t-SNE plots. Complex cytokine signatures were analyzed using SPICE version 5.3, downloaded from http://exon.niaid.nih.gov [32]. See the Online Supplement for additional details.
Cytokine Assays
Cytokines were measured in nasal wash specimens by multiplex assay (TGFβ1, G-CSF, GM-CSF, IFN-γ, IL-1α, IL-12p70, IL-15, MIP3α, IL-1β, IL-6, IP-10, MCP-1, MIP1α, and TNFα; Aushon BioSystems, Inc., Billerica, MA) and by enzyme-linked immunosorbent assay (CXCL8/IL-8; R&D Systems, Minneapolis, MN).
Statistical Analysis
For statistical analysis, see the Online Supplement.
RESULTS
Experimental Model and Study Subjects
To attain sufficient subjects to rigorously characterize and track virus-specific CD4+ T cells with identical antigen specificities in an in vivo RV infection model, HLA-DR4+ subjects were identified by screening 789 subjects enrolled in a double-blind, placebo-controlled trial of probiotic supplementation for common cold [27]. The 7-week trial involved a 4-week period of probiotic supplementation followed by intranasal challenge with RV-A39 and 3 weeks of subsequent monitoring (Figure 1A). Forty-two subjects were identified who tested negative for serum neutralizing antibodies to RV-A39 and who expressed the common HLA-DRB1 allele, *0401. Of these, 16 subjects completed the 7-week trial (probiotic, n = 11; placebo, n = 5) (Supplementary Figure 1).
Baseline Assessment of Virus-Specific CD4+ T-Cell Numbers and Memory Status
Circulating RV-A39-specific CD4+ T cells were analyzed at days −28 and 0 before RV challenge to assess basal T-cell numbers and phenotypes. Tetramer+ T cells were identified in PBMCs using a mixture of 2 HLA-DR4 tetramers displaying conserved immunodominant peptide epitopes from the viral capsid proteins VP1 and VP2 (peptides VP1P14 and VP2P60) (Supplementary Figures 2 and 3) [24]. Analysis of data for probiotic effects identified no difference in numbers of virus-specific T cells between or within probiotic and control groups at each time point (P > .05) (Supplementary Table 1, Figure 1B). This was consistent with the recent report of a lack of an effect of Bl-04 supplementation on circulating CD4+ T cells [33]. Virus-specific T cells were present in all subjects at days −28 and 0 at frequencies between 2 and 79 per million CD4+ T cells (Figure 1B and C). In post hoc analyses, 3 subjects were either seropositive for RV-A39 (n = 2) or had positive PCR for RV/enterovirus in nasal wash specimens (n = 1) on day 0, indicating natural exposure to RV-A39 or related viral species before inoculation (Figure 1). Two of these subjects had high frequencies of virus-specific T cells (30 and 79 per 106 CD4+ T cells), which decreased during the 4-week period. The majority of pre-existing tetramer+ cells were central (CCR7+CD45RO+) or effector (CCR7−CD45RO+) memory types (Figure 1D). Although effector memory T-cell numbers decreased within the probiotic group from day −28 to day 0 (P = .0371), this effect was not significant when naturally exposed subjects were excluded (P = .148).
Pre-Existing Virus-Specific T Cells Are Activated and Armed to Home to the Respiratory Tract
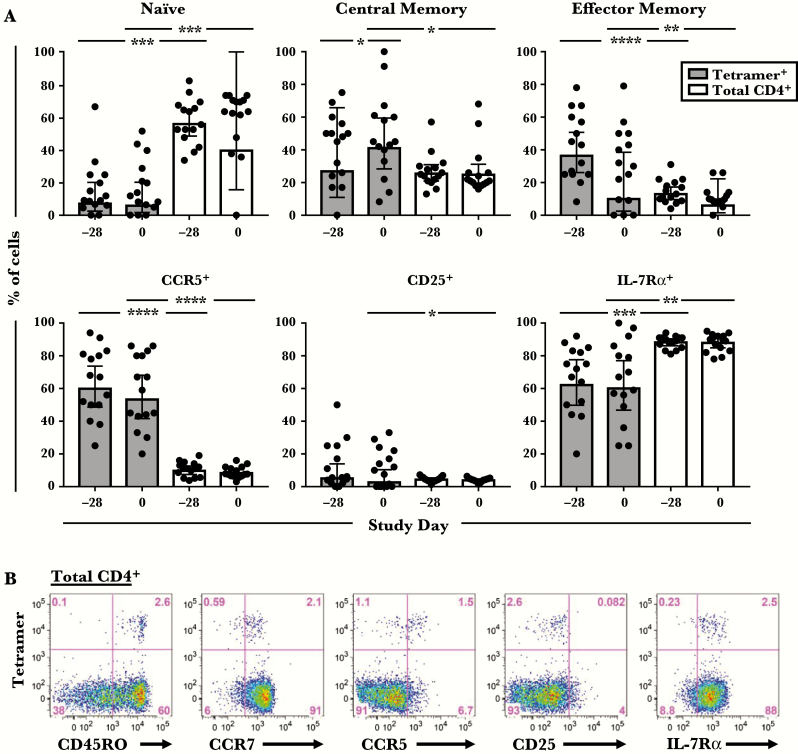
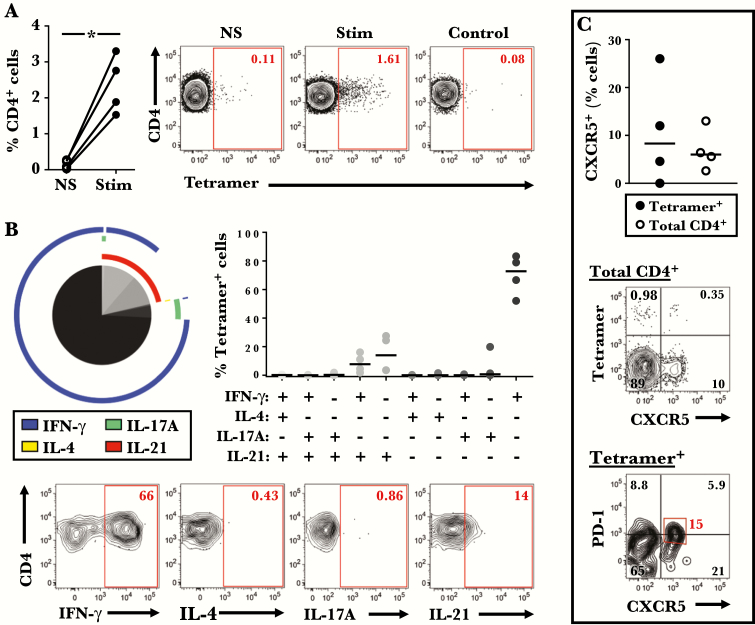
Because additional statistical analyses revealed no T-cell differences between probiotic and placebo groups at any time point, including after RV infection (Supplementary Table 1), phenotypic data for virus-specific T cells were analyzed together from here on. Both central and effector memory types were enriched within tetramer+ cells compared with total CD4+ T cells before RV challenge. Moreover, expression of the T-cell activation marker CD25 was higher on tetramer+ cells (P = .042), whereas expression of IL-7Rα, which decreases upon activation, was lower (P ≤ .002) (Figure 2). It is notable that a higher proportion of tetramer+ cells expressed CCR5, a Th1-associated receptor that permits homing to the respiratory tract (P < .0001) (Figure 2) [34–37]. Analysis of cytokine expression in 4 uninfected HLA-DR4+ subjects showed that pre-existing tetramer+ cells were predominantly IFN-γ+, but they also included IL-17A+IFN-γ−, IL-21+IFN-γ−, and IL-21+IFN-γ+ cells, indicating a mixture of Th1, Th17, and T follicular helper (Tfh) cells (Figure 3A and B). The presence of circulating tetramer+ T cells bearing the surface signature of Tfh cells (CXCR5+PD-1lo/−) was confirmed directly ex vivo (Figure 3C). Collectively, these features confirm enhanced activation and tissue migratory potential of pre-existing virus-specific Th1 cells.
Figure 2.
Comparison of the surface phenotype of tetramer+ T cells with total CD4+ T cells. (A) Cells were analyzed at day −28 and day 0 before rhinovirus challenge. Data are shown for 15 subjects (probiotic [n = 10]; placebo [n = 5]). Bars denote geometric means with 95% confidence intervals. *, P < .05; **, P < .01; ***, P < .001; ****, P < .0001. (B) Representative data from 1 subject showing expression of surface markers on tetramer+ cells within the CD4+ T-cell gate.
Figure 3.
Tetramer+ T cells comprise a mixture of Th1 and T follicular helper (Tfh) cells. (A) Percentage of tetramer+ cells in stimulated and unstimulated peripheral blood mononuclear cell cultures (n = 4). Representative data from 1 subject are shown on the right. *, P < .05. (B) Averaged cytokine profile of tetramer+ cells for 4 subjects (left), and the percentage of cells with a specific cytokine signature within each subject (right). Pie slices denote T-cell subsets, and colored arcs depict cytokine production. Representative contour plots are shown on the bottom. (C) Comparison of the percentage of CXCR5+ cells within tetramer+ and total CD4+ T cells (n = 4). Bars denote medians. Representative plots showing CXCR5 and PD-1 expression on tetramer+ T cells are shown on the bottom.
Numbers of Virus-Specific T Cells Link to a Rise in Serum-Neutralizing Antibodies and Delayed Viral Shedding After Infection
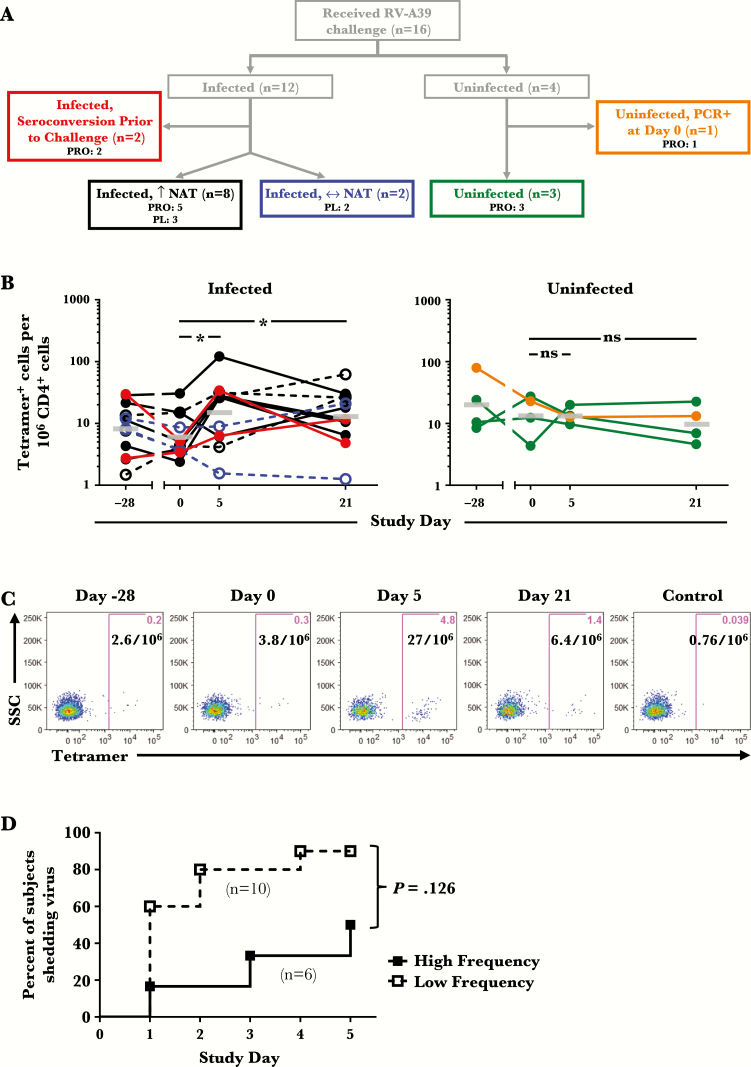
Intranasal challenge with RV-A39 resulted in infection in 12 of 16 subjects (probiotic, n = 7; placebo, n = 5). All infected subjects developed positive nasal cultures for RV-A39 on days 1–5, with peak viral titers at day 3 (Supplementary Figure 4A). Eight of these had a rise in serum neutralizing antibody titers (NAT) by day 21, 2 had no rise, and the remaining 2 were those who tested seropositive for RV-A39 on day 0, but nonetheless had positive cultures after inoculation (Figure 4A). Four subjects remained uninfected, all in the probiotic group, including one who had positive viral polymerase chain reaction (PCR) on day 0 (Figure 4A). There was a trend towards decreased viral titers and longer time to viral shedding in the probiotic versus control group, similar to that observed in the parent study (Supplementary Figure 4B and C) [27].
Figure 4.
Numbers of tetramer+ T cells in relation to infection status and viral shedding after challenge with rhinovirus (RV)-A39. (A) Diagram of infection outcomes in 16 HLA-DR4+ subjects. Colored boxes denote heterogeneous infection profiles based on rise in serum neutralizing antibody titers ([NAT] day 21 versus day 0) and viral polymerase chain reaction (PCR) test (day 0). (B) Change in frequencies of tetramer+ T cells during the 7-week study period in infected and uninfected subjects, color coded according to the flow chart in A. Open symbols with dashed lines denote subjects who received placebo. Bars denote geometric means. *, P < .05. (C) Representative data showing RV-A39 tetramer staining at each time point in an infected subject. A tetramer displaying an irrelevant peptide (GAD555-567) was used as a control. (D) Time to viral shedding in subjects inoculated with RV-A39 classified as “high frequency” (≥10 tetramer+ cells per 106 CD4+ T cells) and “low frequency” (<10 tetramer+ cells per 106 CD4+ T cells) based on T-cell numbers on day 0. Abbreviations: ns, not significant; PL, placebo; PRO, probiotic.
Among all infected subjects who had a rise in NAT, numbers of circulating tetramer+ T cells increased (1.2- to 16-fold change) during acute infection (day 5) and/or in the convalescent period (day 21) compared with day 0 (P ≤ .0137) (Figure 4B and C). By contrast, tetramer+ T cells remained relatively constant in uninfected subjects and infected subjects with no rise in NAT (Figure 4B). Using an arbitrary threshold of 10 cells per million T cells, subjects who had higher numbers of virus-specific T cells on day 0 (≥10 tetramer+ cells/106 CD4+ T cells) had longer time to viral shedding and a lower proportion shed virus compared with those who had lower T-cell numbers (<10 tetramer+ cells/106 CD4+ T cells; P = .039) (Figure 4D). This effect was diminished after correcting for probiotic effect (P = .126).
Virus-Specific Effector Memory T Cells Respond to Rhinovirus Infection
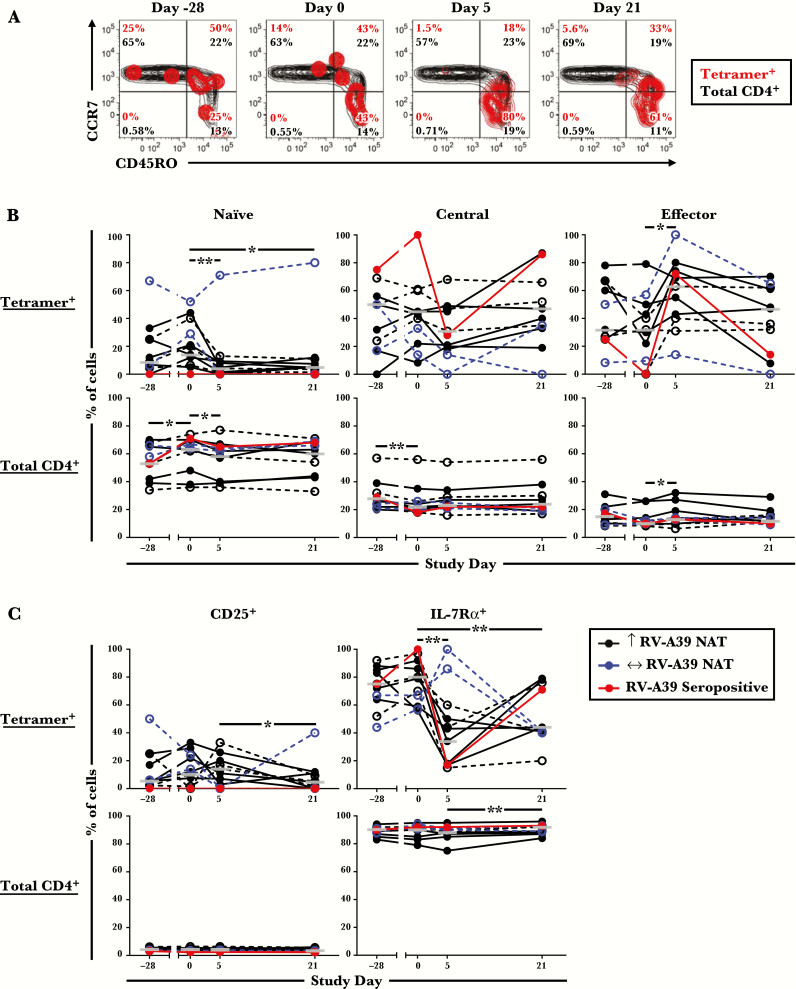
T-cell phenotyping of tetramer+ T cells after challenge revealed a sharp decrease in the percentage of naive T cells on day 5 in all infected subjects who had a rise in NAT, concurrent with an increase in the percentage of effector memory cells, loss of IL-7Rα, and increased expression of CD25 (Figure 5A–C). Conversely, IL-7Rα levels increased on tetramer+ cells in infected subjects who had no measurable increase in NAT (Figure 5C). In uninfected subjects, tetramer+ cells displayed a shift towards effector memory type, despite no overall change in numbers or activation status (Figure 4B, Supplementary Figure 5).
Figure 5.
Phenotypic transitions in tetramer+ T cells after rhinovirus challenge. (A) Representative contour plots from 1 infected subject showing tetramer+ T cells overlaid on CD4+ T cells analyzed for CCR7 and CD45RO. (B) Memory status of tetramer+ and total CD4+ T cells at each time point. (C) Expression of CD25 and IL-7Rα by tetramer+ and total CD4+ T cells at each time point. Data are shown for 11 infected subjects. One infected subject receiving probiotic was excluded from the analyses owing to technical limitations. Open symbols with dashed lines denote subjects who received placebo. Bars denote medians. *, P ≤ .05 and **, P < .01 for infected subjects who had a rise in neutralizing antibody titers post-challenge.
CCR5 Is a Marker for Effector Memory T Cells That Respond to Rhinovirus Infection
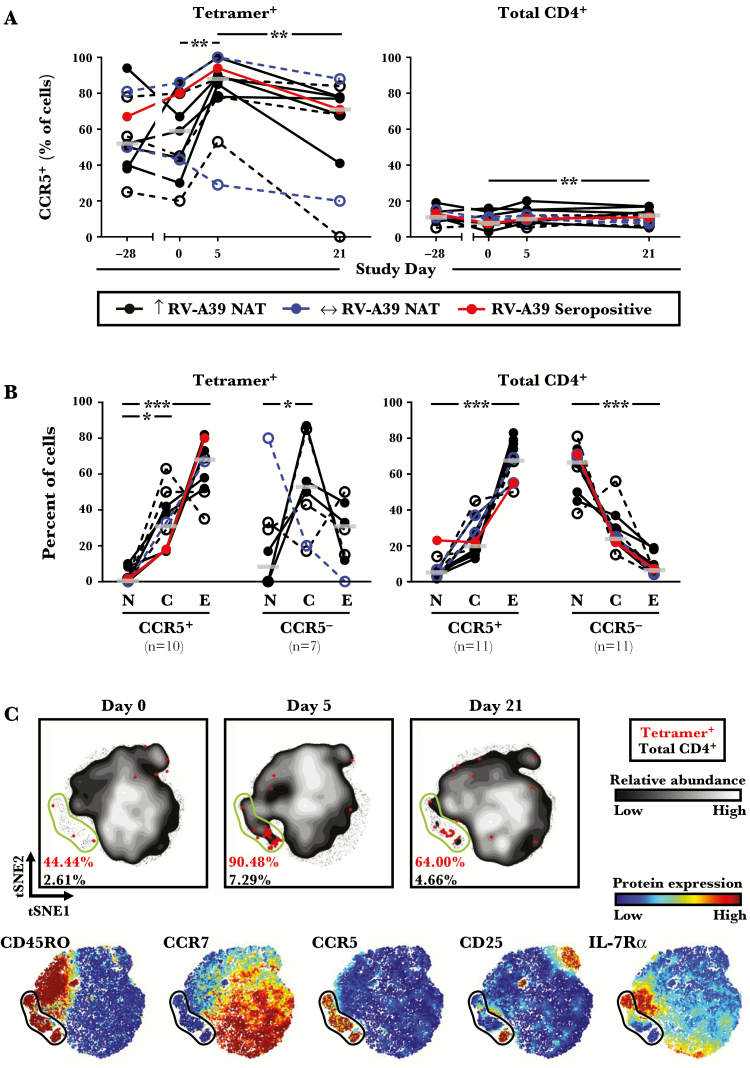
To assess the relevance of circulating virus-specific effector memory T cells to the respiratory tract, expression of CCR5 on tetramer+ cells was analyzed in relation to RV infection. Levels of CCR5 were markedly increased on tetramer+ cells after challenge in infected subjects, and CCR5+ tetramer+ cells were enriched for effector memory cells (Figure 6A and B). To visualize CCR5+ tetramer+ cells within the broader CD4+ T-cell compartment, unsupervised high-dimensional analysis was performed using t-SNE [30, 31]. This method maps single cells onto a 2-dimensional plot based on their expression of all tested markers. This analysis confirmed that in infected subjects who had a rise in NAT, tetramer+ cells mapped to a population of effector memory CCR5+ T cells that contained activated cells (CD25+ and/or IL-7Rα− cells) (Figure 6C, Supplementary Figure 6). Moreover, CCR5+ cells comprised a major subset of total CD4+ T cells at baseline (geometric mean = 8.6%; 95% confidence interval, 6.9%–11.8%; n = 11) that was modulated in a similar fashion to CCR5+ tetramer+ cells during infection. CCR5+ T cells, including those that were tetramer+, were also modulated in uninfected subjects after RV challenge. By contrast, in those infected subjects who had no rise in NAT, t-SNE analysis confirmed a lack of modulation of tetramer+ and CCR5+ T cells (Figure 6C, Supplementary Figure 6).
Figure 6.
Modulation of CCR5+ CD4+ T cells during rhinovirus (RV) infection. (A) Percentage of tetramer+ and total CD4+ T cells displaying CCR5 at each time point, as determined using traditional gating methods (n = 11). (B) Percentage of tetramer+ and total CD4+ T with [N], [C], or [E] phenotypes at day 5, according to CCR5 expression. Subjects with limited cell numbers were excluded. Open symbols with dashed lines denote subjects who received placebo. Bars denote medians. (C) High-dimensional mapping of T-cell responses using t-distributed stochastic neighbor embedding (t-SNE) in an infected subject. Rainbow-colored t-SNE maps depict the intensity of expression for each marker tested. Gates denote CCR5+ subsets. *, P ≤ .05, **, P < .01, and ***, P < .001 for infected subjects who had a rise in neutralizing antibody titers (NAT) post-challenge. Abbreviations: C, central memory; E, effector memory; N, naive.
Nasal T Cells Isolated During Acute Infection Display a Rhinovirus-Specific Signature
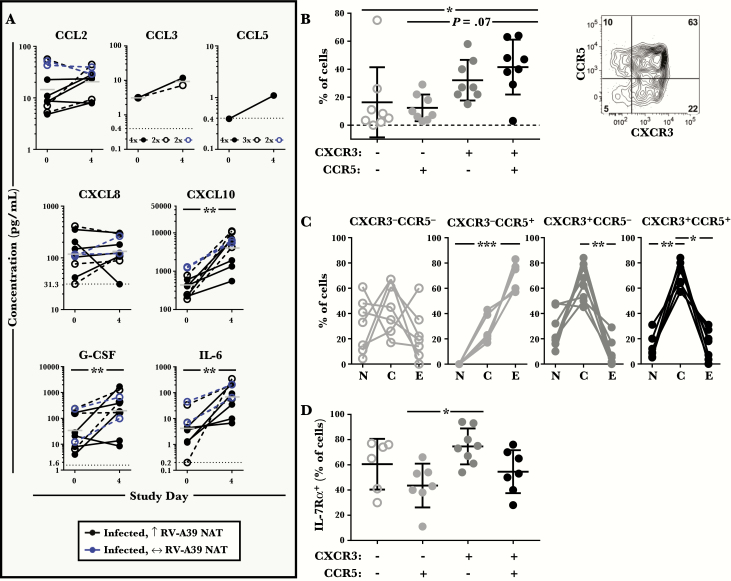
Analysis of nasal wash specimens obtained during early infection (day 4) revealed an increase in cytokine levels versus baseline for CXCL10/IP-10 (the ligand for the Th1-associated receptor CXCR3), as well as IL-6 and G-CSF (both of which modulate CCR5 expression on T cells) (P < .01) (Figure 7A) [38–41]. Among those CCR5 ligands measured (CCL2/MCP-1, CCL3/MIP-1α, and CCL5/RANTES), CCL2 was most abundant before RV challenge, and levels generally increased after challenge (Figure 7A) [42]. Changes in CXCL8/IL-8, which has been linked to symptom severity, as well as other cytokines tested, were variable (Figure 7A, Supplementary Figure 7) [43].
Figure 7.
Nasal cytokine milieu and CD4+ T-cell signature during acute infection. (A) Cytokine levels in nasal washes collected on study days 0 and 4 (n = 10). Open symbols with dashed lines denote subjects who received placebo. Bars denote geometric means. Symbols below the limit of detection of the assay (horizontal dotted line) denote samples with undetectable levels. (B–D) Phenotype of CD4+ T cells in nasal washes obtained 5 days after rhinovirus (RV) challenge from 8 human leukocyte antigen-diverse infected subjects. (B) Proportion of nasal CD4+ T cells that express CCR5 and/or CXCR3. Bars denote the mean ± standard deviation (SD). A representative contour plot showing the expression of CCR5 and CXCR3 on nasal CD4+ T cells is shown to the right. (C) Percentage of nasal CD4+ T cells with N, C, or E phenotypes, according to the expression of CCR5 and CXCR3. (D) Percentage of nasal CD4+ T cells expressing IL-7Rα, according to the expression of CCR5 and CXCR3. Bars denote the mean ± SD. *, P ≤ .05, **, P < .01, and ***, P < .001. Abbreviation: NAT, neutralizing antibody titers. Abbreviations: C, central memory; E, effector memory; N, naive.
Nasal wash specimens obtained from infected subjects at day 5 contained CD4+ T cells, which comprised 0.4%–2.5% of total live cells (data not shown). Assessment of T-cell signatures in the nose confirmed a dominant Th1 signature based on expression of CXCR3 and CCR5 (Figure 7B). Whereas CXCR3−CCR5+ cells were predominantly effector memory type (CCR7−CD45RO+), the majority of CXCR3+ cells were central memory cells (CCR7+CD45RO+) (Figure 7C). Moreover, subtypes that expressed CCR5 had lower levels of IL-7Rα compared with cells that lacked this receptor (Figure 7D). These collective observations strongly support the recruitment of CCR5+ memory Th1 effectors, including activated virus-specific T cells, from the blood to the upper respiratory tract, during RV infection.
DISCUSSION
For the first time, we provide formal evidence of a role for circulating CCR5+ memory Th1 effectors in the control of RV infection. By monitoring RV-specific T cells for an extended period, we provide multiple lines of evidence to support their role before and after RV infection. This includes the following: (1) T-cell molecular signatures and numbers consistent with immune surveillance in the absence of infection; (2) a relationship between increased numbers of pre-existing T cells and increased time to viral shedding; (3) T-cell expansion, activation, and enhanced homing ability in tandem with production of neutralizing antibodies; and (4) the presence of T-cell signatures in the nose during acute infection that match activated RV-specific T cells in the blood.
Although previous in vitro studies have inferred a role for CD4+ T cells in RV infection [22, 25, 44], none have used tetramers to systematically enumerate and characterize responding T cells directly ex vivo. A major limitation of tetramer studies is the requirement to match each tetramer to the HLA type of the test subject. Thus, recruiting sufficient subjects with the same HLA type to analyze identical T-cell specificities can be problematic. We circumvented this limitation by recruiting HLA-DR4+ subjects from a much larger cohort of subjects who were challenged with RV-A39. This enabled us to apply a precise and uniform approach to analyze the quantity and quality of the CD4+ T-cell response to RV, its kinetics, and its relation to infection status.
We recently reported that immunodominant CD4+ T-cell epitopes of the related virus RV-A16 are conserved and that T cells recognizing these epitopes are cross-reactive among RV-A species [24]. In the present study, higher numbers of RV-specific T cells were detected at baseline among subjects who had evidence of recent natural viral exposure, and tetramer+ cells were present in all seronegative subjects. Given the conserved nature of DR4-restricted RV-A39 epitopes, such pre-existing memory T cells likely arise from iterative priming by related viruses during previous exposures. The enrichment of effector memory cells within the tetramer+ subset at baseline, coupled with their enhanced activation and expression of the tissue homing marker CCR5, supports a role for pre-existing virus-specific T cells in immune surveillance. This was borne out by their rapid expansion, augmented activation, and increased migratory potential in the blood after RV challenge, which may reflect egress of primed T cells from lymph nodes and/or “spillover” of effectors from inflamed tissue.
In further support of a protective role for T cells, those subjects who had higher numbers of pre-existing RV-specific cells had longer time to viral shedding, and a lower proportion of these subjects shed virus. Although this effect was no longer significant when the effect of probiotic was taken into account, statistical analysis supported a trend, despite the low sample size [27]. Although no effect of probiotic on T cells was observed in the present study, we acknowledge the administration of probiotic supplementation as a limitation. Nonetheless, our findings are in line with previous studies of Bl-04 supplementation, which also failed to identify probiotic modulation of T-cell populations or broader immune signatures [33, 45]. Thus, further work is required in a larger sample to examine the relationship between pre-existing T-cell numbers and infection.
Expansion of RV-specific T cells after challenge was restricted to those subjects who had a rise in serum NAT. Virus-specific T cells produced both Th1- and Tfh-associated cytokines, suggesting that these cells are equipped to promote viral clearance and provide help for antibody responses [22, 23, 44, 46–48]. It is notable that no T-cell expansion or evidence of activation was observed in 2 infected subjects who had no rise in NAT. This might reflect the ability to clear virus locally independent of circulating T cells, perhaps through innate mechanisms or involvement of other cell types. We were surprised to find that, in subjects who remained uninfected after RV challenge, enrichment of T effector cells and increased expression of CCR5 was evident for virus-specific cells, despite no change in T-cell numbers. Whether such “covert” T-cell responses reflect successful local regulation of virus warrants further exploration.
The RV-specific T cells identified in our study represent only 2 epitope specificities: 1 each for VP1 and VP2. Although recent work suggests that these structural proteins are major antigenic targets for CD4+ T cells [24, 25], additional epitopes may reside within the RV capsid or else within functional proteins; thus, RV-specific CD4+ T cells are likely more abundant than reported here. In addition, relatively rare RV specificities are unlikely to account for the observed fluxes in a major CCR5+ effector memory T-cell subset after RV challenge. These likely reflect a bystander T-cell response involving rerouting of CCR5+ T cells between the blood and upper respiratory tract. The presence of T cells in the nose of infected subjects that bear a molecular signature akin to circulating RV-specific cells strongly supports active T-cell migration between these sites. In addition to CCR5, nasal T cells were analyzed in the context of the canonical Th1 marker, CXCR3. Although nasal CXCR3−CCR5+ cells were predominantly effector memory type (CCR7−CD45RO+) analogous to RV-specific T cells in the blood, CXCR3+ cells maintained expression of CCR7. Moreover, CCR5+ subtypes in the nose expressed lower levels of IL-7Rα compared with CCR5− subtypes. Together, our results support the view that CCR5 is a marker for effector memory T cells that respond locally to RV infection.
CONCLUSIONS
In summary, our findings demonstrate a pivotal role for CCR5+ memory Th1 cells primed by past exposure to related viruses in the control of RV. Our results provide an important stepping stone to future work aimed at understanding T cell-mediated protective and pathogenic mechanisms in RV infection that could guide the design of new treatments.
Supplementary Data
Supplementary materials are available at The Journal of Infectious Diseases online. Consisting of data provided by the authors to benefit the reader, the posted materials are not copyedited and are the sole responsibility of the authors, so questions or comments should be addressed to the corresponding author.
Supplementary Material
Notes
Acknowledgments. We thank Terri Smoot and Cheree Denby (University of Virginia) for assistance with specimen procurement; Deborah Thacker (University of Virginia) for assistance with rhinovirus culture and neutralizing antibody assays; Joanne Lannigan and Michael Solga (University of Virginia) for assistance with flow cytometry; and Dr. Thomas Braciale (University of Virginia) for helpful comments on the manuscript.
Financial Support. This work was funded by National Institutes of Health/National Institute of Allergy and Infectious Diseases grants T32 AI007496 (to L. M. M.), U01 AI100799 (to W. W. K., J. A. W.), RO1 AI020565 (to J. A. W.), and Danisco Sweeteners Oy, Kantvik, Finland (part of Dupont Nutrition and Health) (to R. B. T., J. A. W.).
Potential conflicts of interest. S. J. L. and M. J. L. are employees of DuPont Nutrition & Health. J. A. W. is an inventor on a pending international patent application, titled “Compositions and Methods for Preventing and Treating Rhinovirus Infections” (serial no. PCT/US2016/018723). All authors have submitted the ICMJE Form for Disclosure of Potential Conflicts of Interest. Conflicts that the editors consider relevant to the content of the manuscript have been disclosed.
References
- 1. Fendrick AM, Monto AS, Nightengale B, Sarnes M. The economic burden of non-influenza-related viral respiratory tract infection in the United States. Arch Intern Med 2003; 163:487–94. [DOI] [PubMed] [Google Scholar]
- 2. Calhoun WJ, Dick EC, Schwartz LB, Busse WW. A common cold virus, rhinovirus 16, potentiates airway inflammation after segmental antigen bronchoprovocation in allergic subjects. J Clin Invest 1994; 94:2200–8. [DOI] [PMC free article] [PubMed] [Google Scholar]
- 3. Gern JE, Calhoun W, Swenson C, Shen G, Busse WW. Rhinovirus infection preferentially increases lower airway responsiveness in allergic subjects. Am J Respir Crit Care Med 1997; 155:1872–6. [DOI] [PubMed] [Google Scholar]
- 4. Soto-Quiros M, Avila L, Platts-Mills TA et al. . High titers of IgE antibody to dust mite allergen and risk for wheezing among asthmatic children infected with rhinovirus. J Allergy Clin Immunol 2012; 129:1499–1505.e5. [DOI] [PMC free article] [PubMed] [Google Scholar]
- 5. Cox DW, Bizzintino J, Ferrari G et al. . Human rhinovirus species C infection in young children with acute wheeze is associated with increased acute respiratory hospital admissions. Am J Respir Crit Care Med 2013; 188:1358–64. [DOI] [PMC free article] [PubMed] [Google Scholar]
- 6. Iwane MK, Prill MM, Lu X et al. . Human rhinovirus species associated with hospitalizations for acute respiratory illness in young US children. J Infect Dis 2011; 204:1702–10. [DOI] [PubMed] [Google Scholar]
- 7. Nicholson KG, Kent J, Hammersley V, Cancio E. Acute viral infections of upper respiratory tract in elderly people living in the community: comparative, prospective, population based study of disease burden. BMJ 1997; 315:1060–4. [DOI] [PMC free article] [PubMed] [Google Scholar]
- 8. McManus TE, Marley AM, Baxter N et al. . Respiratory viral infection in exacerbations of COPD. Respir Med 2008; 102:1575–80. [DOI] [PMC free article] [PubMed] [Google Scholar]
- 9. Kieninger E, Singer F, Tapparel C et al. . High rhinovirus burden in lower airways of children with cystic fibrosis. Chest 2013; 143:782–90. [DOI] [PubMed] [Google Scholar]
- 10. Lemanske RF Jr, Jackson DJ, Gangnon RE et al. . Rhinovirus illnesses during infancy predict subsequent childhood wheezing. J Allergy Clin Immunol 2005; 116:571–7. [DOI] [PubMed] [Google Scholar]
- 11. O’Callaghan-Gordo C, Bassat Q, Díez-Padrisa N et al. . Lower respiratory tract infections associated with rhinovirus during infancy and increased risk of wheezing during childhood. A cohort study. PLoS One 2013; 8:e69370. [DOI] [PMC free article] [PubMed] [Google Scholar]
- 12. Kusel MM, de Klerk NH, Kebadze T et al. . Early-life respiratory viral infections, atopic sensitization, and risk of subsequent development of persistent asthma. J Allergy Clin Immunol 2007; 119:1105–10. [DOI] [PMC free article] [PubMed] [Google Scholar]
- 13. Bartlett NW, Walton RP, Edwards MR et al. . Mouse models of rhinovirus-induced disease and exacerbation of allergic airway inflammation. Nat Med 2008; 14:199–204. [DOI] [PMC free article] [PubMed] [Google Scholar]
- 14. Palmenberg AC, Spiro D, Kuzmickas R et al. . Sequencing and analyses of all known human rhinovirus genomes reveal structure and evolution. Science 2009; 324:55–9. [DOI] [PMC free article] [PubMed] [Google Scholar]
- 15. Bochkov YA, Gern JE. Clinical and molecular features of human rhinovirus C. Microbes Infect 2012; 14:485–94. [DOI] [PMC free article] [PubMed] [Google Scholar]
- 16. Barclay WS, al-Nakib W, Higgins PG, Tyrrell DA. The time course of the humoral immune response to rhinovirus infection. Epidemiol Infect 1989; 103:659–69. [DOI] [PMC free article] [PubMed] [Google Scholar]
- 17. Alper CM, Doyle WJ, Skoner DP et al. . Prechallenge antibodies: moderators of infection rate, signs, and symptoms in adults experimentally challenged with rhinovirus type 39. Laryngoscope 1996; 106:1298–305. [DOI] [PubMed] [Google Scholar]
- 18. Cate TR, Couch RB, Johnson KM. Studies with Rhinoviruses in volunteers: production of illness, effect of naturallly acquired antibody, and demonstration of a protective effect not associated with serum antibody. J Clin Invest 1964; 43:56–67. [DOI] [PMC free article] [PubMed] [Google Scholar]
- 19. Fleet WF, Couch RB, Cate TR, Knight V. Homologous and heterologous resistance to rhinovirus common cold. Am J Epidemiol 1965; 82:185–96. [DOI] [PubMed] [Google Scholar]
- 20. Iwasaki J, Smith WA, Stone SR, Thomas WR, Hales BJ. Species-specific and cross-reactive IgG1 antibody binding to viral capsid protein 1 (VP1) antigens of human rhinovirus species A, B and C. PLoS One 2013; 8:e70552. [DOI] [PMC free article] [PubMed] [Google Scholar]
- 21. Iwasaki J, Smith WA, Khoo SK et al. . Comparison of rhinovirus antibody titers in children with asthma exacerbations and species-specific rhinovirus infection. J Allergy Clin Immunol 2014; 134:25–32. [DOI] [PubMed] [Google Scholar]
- 22. Gern JE, Dick EC, Kelly EA, Vrtis R, Klein B. Rhinovirus-specific T cells recognize both shared and serotype-restricted viral epitopes. J Infect Dis 1997; 175:1108–14. [DOI] [PubMed] [Google Scholar]
- 23. Message SD, Laza-Stanca V, Mallia P et al. . Rhinovirus-induced lower respiratory illness is increased in asthma and related to virus load and Th1/2 cytokine and IL-10 production. Proc Natl Acad Sci U S A 2008; 105:13562–7. [DOI] [PMC free article] [PubMed] [Google Scholar]
- 24. Muehling LM, Mai DT, Kwok WW, Heymann PW, Pomés A, Woodfolk JA. Circulating memory CD4+ t cells target conserved epitopes of rhinovirus capsid proteins and respond rapidly to experimental infection in humans. J Immunol 2016; 197:3214–24. [DOI] [PMC free article] [PubMed] [Google Scholar]
- 25. Gaido CM, Stone S, Chopra A, Thomas WR, Le Souëf PN, Hales BJ. Immunodominant T-cell epitopes in the VP1 capsid protein of rhinovirus species A and C. J Virol 2016; 90:10459–71. [DOI] [PMC free article] [PubMed] [Google Scholar]
- 26. West NP, Horn PL, Pyne DB et al. . Probiotic supplementation for respiratory and gastrointestinal illness symptoms in healthy physically active individuals. Clin Nutr 2014; 33:581–7. [DOI] [PubMed] [Google Scholar]
- 27. Turner RB, Woodfolk JA, Borish L et al. . Effect of probiotic on innate inflammatory response and viral shedding in experimental rhinovirus infection - a randomised controlled trial. Benef Microbes 2017; 8:207–15. [DOI] [PMC free article] [PubMed] [Google Scholar]
- 28. Kwok WW, Roti M, Delong JH et al. . Direct ex vivo analysis of allergen-specific CD4+ T cells. J Allergy Clin Immunol 2010; 125:1407–1409.e1. [DOI] [PMC free article] [PubMed] [Google Scholar]
- 29. Danke NA, Yang J, Greenbaum C, Kwok WW. Comparative study of GAD65-specific CD4+ T cells in healthy and type 1 diabetic subjects. J Autoimmun 2005; 25:303–11. [DOI] [PubMed] [Google Scholar]
- 30. Shekhar K, Brodin P, Davis MM, Chakraborty AK. Automatic classification of cellular expression by nonlinear stochastic embedding (ACCENSE). Proc Natl Acad Sci U S A 2014; 111:202–7. [DOI] [PMC free article] [PubMed] [Google Scholar]
- 31. Amir El-ad, Davis KL, Tadmor MD et al. . viSNE enables visualization of high dimensional single-cell data and reveals phenotypic heterogeneity of leukemia. Nat Biotechnol 2013; 31:545–52. [DOI] [PMC free article] [PubMed] [Google Scholar]
- 32. Roederer M, Nozzi JL, Nason MC. SPICE: exploration and analysis of post-cytometric complex multivariate datasets. Cytometry A 2011; 79:167–74. [DOI] [PMC free article] [PubMed] [Google Scholar]
- 33. West NP, Horn PL, Pyne DB et al. . Probiotic supplementation has little effect on peripheral blood regulatory T cells. J Allergy Clin Immunol 2016; 138:1749–1752.e7. [DOI] [PubMed] [Google Scholar]
- 34. Kohlmeier JE, Miller SC, Smith J et al. . The chemokine receptor CCR5 plays a key role in the early memory CD8+ T cell response to respiratory virus infections. Immunity 2008; 29:101–13. [DOI] [PMC free article] [PubMed] [Google Scholar]
- 35. Galkina E, Thatte J, Dabak V, Williams MB, Ley K, Braciale TJ. Preferential migration of effector CD8+ T cells into the interstitium of the normal lung. J Clin Invest 2005; 115:3473–83. [DOI] [PMC free article] [PubMed] [Google Scholar]
- 36. Campbell JJ, Brightling CE, Symon FA et al. . Expression of chemokine receptors by lung T cells from normal and asthmatic subjects. J Immunol 2001; 166:2842–8. [DOI] [PubMed] [Google Scholar]
- 37. Wisniewski JA, Muehling LM, Eccles JD,. et al. Th1 signatures are present in the lower airways of children with severe asthma, regardless of allergic status. J Allergy Clin Immunol; In Press. [DOI] [PMC free article] [PubMed] [Google Scholar]
- 38. Booth V, Keizer DW, Kamphuis MB, Clark-Lewis I, Sykes BD. The CXCR3 binding chemokine IP-10/CXCL10: structure and receptor interactions. Biochemistry 2002; 41:10418–25. [DOI] [PubMed] [Google Scholar]
- 39. Loetscher M, Loetscher P, Brass N, Meese E, Moser B. Lymphocyte-specific chemokine receptor CXCR3: regulation, chemokine binding and gene localization. Eur J Immunol 1998; 28:3696–705. [DOI] [PubMed] [Google Scholar]
- 40. Ukena SN, Velaga S, Goudeva L et al. . Human regulatory T cells of G-CSF mobilized allogeneic stem cell donors qualify for clinical application. PLoS One 2012; 7:e51644. [DOI] [PMC free article] [PubMed] [Google Scholar]
- 41. McLoughlin RM, Jenkins BJ, Grail D et al. . IL-6 trans-signaling via STAT3 directs T cell infiltration in acute inflammation. Proc Natl Acad Sci U S A 2005; 102:9589–94. [DOI] [PMC free article] [PubMed] [Google Scholar]
- 42. Blanpain C, Migeotte I, Lee B et al. . CCR5 binds multiple CC-chemokines: MCP-3 acts as a natural antagonist. Blood 1999; 94:1899–905. [PubMed] [Google Scholar]
- 43. Turner RB, Weingand KW, Yeh CH, Leedy DW. Association between interleukin-8 concentration in nasal secretions and severity of symptoms of experimental rhinovirus colds. Clin Infect Dis 1998; 26:840–6. [DOI] [PubMed] [Google Scholar]
- 44. Parry DE, Busse WW, Sukow KA, Dick CR, Swenson C, Gern JE. Rhinovirus-induced PBMC responses and outcome of experimental infection in allergic subjects. J Allergy Clin Immunol 2000; 105:692–8. [DOI] [PubMed] [Google Scholar]
- 45. West NP, Horn PL, Barrett S et al. . Supplementation with a single and double strain probiotic on the innate immune system for respiratory illness. e-SPEN J 2014; 9:e178–84. [Google Scholar]
- 46. Teijaro JR, Verhoeven D, Page CA, Turner D, Farber DL. Memory CD4 T cells direct protective responses to influenza virus in the lungs through helper-independent mechanisms. J Virol 2010; 84:9217–26. [DOI] [PMC free article] [PubMed] [Google Scholar]
- 47. Wilkinson TM, Li CK, Chui CS et al. . Preexisting influenza-specific CD4+ T cells correlate with disease protection against influenza challenge in humans. Nat Med 2012; 18:274–80. [DOI] [PubMed] [Google Scholar]
- 48. Wimalasundera SS, Katz DR, Chain BM. Characterization of the T cell response to human rhinovirus in children: implications for understanding the immunopathology of the common cold. J Infect Dis 1997; 176:755–9. [DOI] [PubMed] [Google Scholar]
Associated Data
This section collects any data citations, data availability statements, or supplementary materials included in this article.


