

Abstract
Neuropsychiatric symptoms (NPS) are common in Alzheimer's disease (AD)-associated neurodegeneration. However, NPS lack a consistent relationship with AD pathology. It is unknown whether any common neural circuits can link these clinically disparate while mechanistically similar features with AD pathology. Here, we explored the neural circuits of NPS in AD-associated neurodegeneration using multivariate pattern analysis (MVPA) of resting-state functional MRI data. Data from 98 subjects (70 amnestic mild cognitive impairment and 28 AD subjects) were obtained. The top 10 regions differentiating symptom presence across NPS were identified, which were mostly the fronto-limbic regions (medial prefrontal cortex, caudate, etc.). These 10 regions' functional connectivity classified symptomatic subjects across individual NPS at 69.46% to 81.27%, and predicted multiple NPS (indexed by Neuropsychiatric Symptom Questionnaire-Inventory) and AD pathology (indexed by baseline and change of beta-amyloid/pTau ratio) all above 70%. Our findings suggest a fronto-limbic dominated neural circuit that links multiple NPS and AD pathology. With further examination of the structural and pathological changes within the circuit, the circuit may shed light on linking behavioral disturbances with AD-associated neurodegeneration.
Keywords: Alzheimer's disease, functional magnetic resonance imaging, mild cognitive impairment, multivariate pattern analysis, neuropsychiatric symptoms
Introduction
Neuropsychiatric symptoms (NPS) are a distinctive set of behavioral disturbances in Alzheimer's disease (AD) (Lyketsos et al. 2002), and can contribute to functional impairment (Okura et al. 2010) and cause significant distress to both patients and caregivers (Shin et al. 2005; Sink et al. 2006). The most common NPS in AD include apathy, depression, agitation/aggression, anxiety, disinhibition, and irritability (Geda et al. 2008; Lyketsos et al. 2002). Over half of individuals with amnestic mild cognitive disease (MCI), the symptomatic preclinical stage of AD, and almost all of those with AD have NPS (Geda et al. 2008; Lyketsos et al. 2002). A comprehensive assessment of multiple NPS, such as through the Neuropsychiatric Inventory Questionnaire (NPI-Q), are related to AD-associated clinical progression, but not AD pathology (David et al. 2016). It is yet to be established whether common neural substrates exist that link multiple NPS with AD pathology.
There is a recent national emphasis on studying shared biological mechanisms with psychiatric nosology or multiple NPS in AD, with an eye to developing effective interventions that can simultaneously address multiple psychiatric disorders or NPS (Insel et al. 2010; Kales et al. 2015). A recent meta-analysis identified grey matter loss in the insula and dorsal anterior cingulate as common substrates for executive control deficits across multiple psychiatric disorders (Goodkind et al. 2015). In the case of NPS in AD, one hypothesis is that they result from the disruption of neural transmission within a relatively restricted set of brain regions, especially prefrontal cortex and the limbic system (Reeves et al. 2009; Sekine et al. 2001). Relevantly, a growing body of work suggests that these regions are crucial in distinguishing AD patients with depression (Thomas et al. 2006), apathy (Theleritis et al. 2014), anxiety (Poulin et al. 2011), agitation/aggression (Lanctot et al. 2004), or disinhibition (Smith et al. 2009), from AD patients without behavioral disturbance, or from AD-free counterparts. Also, there is an increasing recognition on the overlap of neural circuit across multiple NPS that may mediate the AD pathology with behavioral manifestations of NPS (Rosenberg et al. 2015). However, the contribution of individual regions or the activity patterns within this system may be different across symptoms, which in turn may explain the unique clinical manifestation of individual NPS domains. Noticeably, the fronto-limbic system may be relevant to AD pathology as well (Zhou et al. 2013; Ren et al. 2016). A thorough characterization of the shared neural circuit with the consideration of the disproportional contribution of individual regions or activity patterns to different NPS may provide a link between NPS and AD pathology.
The traditional methods of examining neural regions involved in individual NPS domains or established psychiatric disorders have included seed-based (Biswal et al. 1995) and univariate analyses (Friston et al. 1995). However, these analyses can result in signal loss since they do not take into account patterns distributed across voxels (Sun et al. 2009). To address this problem, multivariate/multi-voxel pattern analysis (MVPA) provides higher sensitivity in identifying distributed neural patterns by combining information from multiple locations (Bray et al. 2009). Recently, MVPA has been applied to determine the neural patterns that are associated with psychiatric disorders, using resting-state functional magnetic resonance (rs-fMRI) data. Functional connectivity (FC) patterns of activity within several regions of the fronto-limbic system showed high discriminative power in classifying the presence of depression (Zeng et al. 2012). In the present rs-fMRI study, using a sample with AD pathology (individuals with amnestic MCI and AD) we applied MVPA to identify FC between distinct brain regions associated with individual NPS domains; following this we quantified brain regions' discriminative power across NPS domains and defined a shared neural circuit. We also examined the predictive value of the shared neural circuit on a composite score of multiple NPS (i.e., NPI-Q) and AD pathology (indexed by Beta-amyloid-(1-42) (Aβ)/pTau). We hypothesized that a shared neural circuit involved fronto-limbic regions would most likely relate to multiple NPS domains; furthermore, by synthesizing the involvement frequency of individual regions and the strength of FC of the fronto-limbic circuit, such NPS shared neural circuit would be related to AD pathology.
Materials and Methods
Data source
Data used in the preparation of this article were obtained from the ADNI database (adni.loni.usc.edu). The ADNI was launched in 2003 as a public-private partnership, led by Principal Investigator Michael W. Weiner, MD. The primary goal of ADNI has been to test whether serial magnetic resonance imaging (MRI), positron emission tomography (PET), other biological markers, and clinical and neuropsychological assessment can be combined to measure the progression of MCI and early AD. For up-to-date information, see www.adni-info.org.
Participants
We identified a total number of 227 subjects with rs-fMRI data from ADNIGO or ADNI2 where rs-fMRI data were collected using 3T scanners. From those, we identified 167 subjects who had scanning time and NPS assessments within a six-month time window. 57 healthy controls were excluded and imaging data from the remaining 110 amnestic MCI and AD subjects (aged from 55 to 90) were examined. 98 (70 amnestic MCI and 28 AD subjects) were involved in the present study (4 subjects were excluded due to different scanning parameters, and 8 were excluded due to normalization problems). These subjects remained their clinical status throughout their available visits at ADNI sites.
The diagnoses of amnestic MCI and AD were both made by a psychiatrist or neurologist at each study site and reviewed by a Central Review Committee, based on a subjective memory complaint and performance on neurocognitive testing, including the Logical Memory II subscale of the Wechsler Memory Scale-Revised (score ≤ 8 for both, cut-off adjusted for education level), the Mini-Mental State Exam (score 26 – 30 for MCI, and 20 – 26 for AD), and the Clinical Dementia Rating (global score = 0.5 for MCI and 0.5 or 1 for AD). AD subjects also had to meet the NINCDS-ADRDA criteria for probable AD. There was no difference of age, sex, education, occurrence of individual NPS, or change of Aβ/pTau ratio between MCI and AD samples. However, AD sample tended to have greater NPI-Q score and lower baseline Aβ/pTau ratio than MCI sample (Table 1). Of note, to determine neural mechanism of NPS in the context of AD, individuals without certain NPS domains or with low NPI-Q scores but with AD pathology will provide a cleaner comparison than individuals with neither NPS nor AD pathology. Therefore, we only included amnestic MCI and AD subjects. Furthermore, in the main analysis, we combined amnestic MCI and AD subjects in the main analysis given the following reasons: large sample sizes are required to achieve desired learning accuracy and sufficiency to estimate classification error in pattern analysis (Raudys and Jain 1991); amnestic MCI and AD have potential shared neural deficits (in spite of different degrees of severity) (Fan et al. 2008). Regardless, we also performed analyses with MCI sample only since the information may help inform AD prevention.
Table 1. Sample characteristics as total and by group.
| Total Sample | Sample comparison | |||
|---|---|---|---|---|
| (N = 98) | MCI Sample (N = 70) | AD Sample (N = 28) | t or χ2 test, df (p) | |
| Age, Mean (SD) | 73.05 (7.80) | 72.80 (8.08) | 73.68 (7.15) | -0.50, 96 (.62) |
| Male, N (%) | 52 (53.06) | 38 (54.29) | 14 (50.00) | 0.15, 1 (.70) |
| Education, Mean (SD) | 15.89 (2.75) | 16.10 (2.80) | 15.36 (2.59) | 1.21, 96 (.23) |
| NPI-Q, Mean (SD) | 2.91 (3.58) | 2.47 (3.26) | 4.00 (4.16) | -1.93, 96 (.056) |
| Irritability, N (%) | 34 (34.69%) | 25 (35.71%) | 9 (32.14%) | 0.11, 1 (.74) |
| Agitation, N (%) | 28 (28.57%) | 18 (25.71%) | 10 (35.71%) | 0.98, 1 (.32) |
| Nighttime behaviors, N (%) | 24 (24.49%) | 16 (22.86%) | 8 (28.57%) | 0.35, 1 (.55) |
| Appetite and eating, N (%) | 23 (23.47%) | 13 (18.57%) | 10 (35.71%) | 3.27, 1 (.070) |
| Depression, N (%) | 22 (22.45%) | 16 (22.86%) | 6 (21.43%) | 0.02, 1 (.88) |
| Anxiety, N (%) | 21 (21.43%) | 14 (20.00%) | 7 (25.00%) | 0.30, 1 (.59) |
| Aβ/ptau ratio – baseline, Mean (SD) | 5.13 (3.89) | 5.97 (4.24) | 3.34 (2.17) | 3.76, 81 (< .001) |
| Aβ/ptau ratio – change, Mean (SD) | -0.82 (2.12) | -0.87 (2.13) | -0.29 (2.19) | -0.52, 39 (.61) |
Note. NPI, Neuropsychiatric Inventory; MCI, mild cognitive impairment; AD, Alzheimer's disease; SD, standard deviation; Aβ, beta-amyloid.
Measures
NPS were assessed with the NPI-Q based on caregiver/informant report. The NPI-Q includes a total of 12 neuropsychiatric domains and each domain contains a survey question about the presence of a particular NPS in the past 30 days. If a person has not manifested a given symptom, the domain is scored zero. If a person has displayed a symptom, the severity of the symptom is further rated using a three-point scale from mild (1) to severe (3). We used the questionnaire in two ways: as a continuous variable summing the severity of all occurring NPS domains (NPI, mean = 2.91, range: 0 – 16) and as six dichotomous variables by selecting the top 50% of the most frequently occurring symptom domains, including irritability/lability (34.69%), agitation/aggression (28.57%), nighttime behaviors (24.49%), appetite and eating (23.47%), depression/dysphoria (22.45%) and anxiety (21.43%). Weak correlations were observed among the six NPS domains (Spearman's rho ranged from .0002 to .16), suggesting them be considered as separate variables. For the rest six symptoms, the frequencies were too low to conduct classification analysis.
AD pathology
Aβ and pTau were derived from the cerebrospinal fluid aliquots, measured using the multiplex xMAP Luminex platform (Luminex Corp., Austin, Tex., USA) with immunoassay kit-based reagents (INNO-BIA AlzBio3; Innogenetics, Ghent, Belgium). An Aβ/pTau ratio was used as the ‘AD signature’ for which lower Aβ/pTau ratios indicated an increased burden of AD pathology (De Meyer et al. 2010). We used two types of Aβ/pTau ratio in the analysis: (1) the Aβ/pTau ratio at the relevant time point with rs-fMRI data (baseline); (2) the prospective change of Aβ/pTau ratio from the relevant time point with rs-fMRI data to the end time point when AD pathology was analyzed (change, mean = 1.5 years).
Identification of FC features for individual NPS domains
Before identifying shared neural substrates, we first examined the FC features related with each NPS domain. The following steps were conducted: imaging data acquisition and preprocessing, feature extraction, and MVPA of functional connectivity (fcMVPA).
Imaging data acquisition and preprocessing
All rs-fMRI data were collected using a 3.0 Tesla Phillips MRI with an echo-planar imaging (EPI) sequence (TR = 3000 ms, TE = 30 ms, slice thickness = 3.3 mm, matrix = 64×64, spatial resolution = 3×3×3 mm3, number of volumes = 140, number of slices = 48). Structural images were obtained using an MPRAGE sequence (TR/TE = 6.77/3.13 ms, TI = 0 ms, FA = 9°, matrix = 256×256, resolution 1×1×1mm3, slice thickness = 1 mm).
All the rs-fMRI data were preprocessed using the DPARSF (Data Processing Assistant for rs-fMRI) (Chao-Gan and Yu-Feng 2010), based on the statistical parametric mapping software package (SPM8, http://www.fil.ion.ucl.ac.uk/spm/). Across individuals, the first 10 volumes were discarded to avoid potential noise related to the equilibrium of the scanner and participant's adaptation to the scanner. The remaining 130 volumes were preprocessed using slice time correction and motion correction. Of note, no subject's data was discarded during motion correction using the criterion at displacement < 2 mm and rotation < 2 degree. Next, the images were registered to each individual's own structural image, normalized to Montreal Neurological Institute (MNI) standard space (resliced to 3×3×3 mm3) and spatially smoothed using a Gaussian kernel (FWHM = 4 mm). Then the linear trends were removed, and a band-pass filter (0.01 - 0.08 Hz) was applied to remove long-term physiological shifts and non-neural signals. Before calculating FC, nuisance covariates including six head motion parameters, global mean signal, white matter signal, and cerebrospinal fluid signal were regressed out to reduce head motion effects and non-neuronal noise (Fox et al. 2006; Kelly et al. 2008).
Brain atrophy was considered as a covariate in later analysis. Voxel-based morphometry (VBM) analysis was performed using SPM8. Briefly, the structural images were segmented into gray matter (GM), white matter and cerebrospinal fluid. After an initial affine registration of the GM map into the MNI space, the GM images were nonlinearly warped using diffeomorphic anatomical registration through Exponentiated Lie Algebra (DARTEL) (Ashburner 2007). Finally, the GM maps were resliced to 3×3×3 mm3 for each subject to match with functional images. In the following analysis, GM volumes of consensus ROIs (described in Data Analysis. Identification of consensus ROIs) were extracted and averaged.
Feature extraction
The registered rs-fMRI data with the MNI template were divided into 90 cerebral ROIs according to the automated anatomical labeling (AAL) atlas (Tzourio-Mazoyer et al. 2002) using the software package WFU_PickAtlas (Maldjian et al. 2003). The mean time series for each ROI were then extracted for each individual by averaging the rs-fMRI time series over all voxels within the ROI. We computed all possible FC between the 90 AAL cerebral ROIs using the Pearson correlation coefficient. We then removed diagonal elements and extracted lower triangle elements of the FC matrix. Thus each person's feature vector included 90×89/2 = 4005 dimensions. These feature vectors were then Fisher's Z-transformed to normalize the distribution.
fcMVPA
We applied the same fcMVPA procedure to identify relevant features for each of the six NPS domains. We partitioned our data using a cross-validation scheme and then built machine learning classifiers using selected features.
Cross-validation
We combined the amnestic MCI (n = 70) and AD (n = 28) subjects due to their potential shared neural deficits for the main analysis; however, we still tried to maintain an equal number of MCI and AD cases for the classification tasks. To achieve this, by adapting the concept of leave-one-out-cross-validation (LOOCV) (Kearns and Ron 1999), we applied a leave-two-out-cross-validation (LTOCV) partition scheme during classification. In each LTOCV fold, we first randomly selected one AD subject and one MCI subject for a test set. Since each AD and MCI subjects were designed as test samples once, this resulted in 1960 (n = 70 * 28) cross-validation folds in total. To ensure equal numbers of AD and MCI subjects in the training set, we next included all remaining AD subjects (n = 27) and randomly selected an equal number of MCI subjects (n = 27) from the remaining MCI subjects (n = 69). We also checked training sets within each cross-validation fold to make sure that each training set had enough cases showing the pertinent individual NPS domain. Specifically, for any NPS domain with N subjects showing this symptom, this cross-validation fold would be removed if a training set had less than N/2 subjects with the symptom.
Feature selection
To avoid circularity bias and over-fitting (Pereira et al. 2009; Dosenbach et al. 2010) in following classification tasks, we performed feature selection primarily using the non-parametric Kendall's tau rank correlation in the training set for each cross-validation fold. Kendall's tau correlates two rank-ordered variables and measures the association strength and direction between two variables between -1 and 1 (Kendall and Jean 1990). Similar to previous studies (Zeng et al. 2012), we used Kendall's tau to select subsets of FC features that had the highest discriminant power for individual NPS domains. For each feature, we calculated the Kendall tau correlation coefficient against the class label (presence vs. absence of individual NPS domains). We then ranked the features according to their absolute Kendall's tau. Here we selected 100 FC features (the criterion of retaining top 100 features was based on previous literatures (Beltrachini et al. 2015; Challis et al. 2015)).
Classification
We applied the selected feature sets to classify subjects with a specific NPS domain (labels = 1) versus subjects without this NPS domain (labels = 0). We performed support vector machine (SVM) classification with the radial basis function (RBF) kernel using LIBSVM library (Chang and Lin 2011). SVM has been widely used due to its ability to handle high-dimensional data and its accuracy in classification and prediction (Ben-Hur et al. 2008; Magnin et al. 2009). As recommended (Hsu et al. 2003), we applied the RBF kernel when number of samples are larger than number of features. The SVM RBF kernel has two parameters: C (soft margin parameter) and gamma (parameter for RBF kernel function). The best parameter combination was selected using a grid search, which was used to reflect the classification performance for each cross-validation fold. During classification, different penalty costs were assigned to each class to correct for unbalanced classes (Chang and Lin 2011). The mean classification accuracy across all cross-validation folds was used as the estimate of the classifier's performance. Due to the randomization nature of our LTOCV scheme (details in fcMVPA.Cross-validation), 10 iterations of such classification tasks were conducted, and the final classification accuracy was reported as the average accuracy across all iterations.
Feature ranking
Since feature selection was based on different training set in each cross-validation fold, the selected feature subset was slightly different for each fold. After classification, we extracted all selected features and ranked them according to their occurrence across all cross-validation folds.
Data analysis
Identification of consensus ROIs
To identify the shared neural substrates (i.e., consensus ROIs) across multiple NPS domains, we adapted the concept of consensus FC - the subsets of FC feature that consistently contribute to classification across all cross-validation folds (Dosenbach et al. 2010). Here we define consensus ROIs as regions that consistently contribute to classifying the presence of all six NPS domains. To identify the consensus ROIs, for each NPS domain, we first normalized the feature subset's occurrence matrix with sum at 1 and then we projected FC features back to regions' space (since each FC feature is related with two ROIs). We then summed each related ROI's normalized occurrence over all NPS domains and ranked these ROIs based on their final occurrence. We tested the classification performance (as described in section fcMVPA. Classification) for individual NPS domains when top N (N = 3, 4, … 20) ROIs' FC features were used respectively. The top N ROIs that generated the highest averaged classification performance across the six NPS domains were used as the final consensus ROIs.
We then performed fcMVPA using only consensus ROIs' FC features (n = 45) to generate FC maps for individual NPS domains (notice here the feature selection process in fcMVPA was retained to generate Kendall tau values for each feature, but no feature was removed after the process). We used “feature weight” and “region weight” to reflect each FC and ROI 's discriminative powers, respectively. “Feature weight” is defined as the absolute value of Kendall's tau and “region weight” is defined as the sum of feature weights an ROI involved. Positive feature weights mean the strength of FC was greater in subject with a particular NPS domain compared to those without this NPS domain, and vice versa. In addition, we conducted the same analyses for MCI and AD samples separately.
Regression for NPI-Q and Aβ/pTau ratio
Using the combined sample, we also employed FC features of consensus ROIs to predict three outcomes – NPI-Q (which covers six NPS domains we used to select consensus ROIs and another six NPS domains we did not include in our initial study due to limitation of sample sizes; it also provides extra information for the severity of those NPS domains), baseline Aβ/pTau ratio, and change of Aβ/pTau ratio, respectively. We added age, sex, education and the consensus ROIs' averaged brain atrophy features as covariates in the regression analysis (feature scaling was performed to ensure the similarity of ranges of feature values and comparable contribution of each feature to the final regression from both training and test sets). In addition, we also performed same regression analyses for the three outcomes for MCI sample alone (regression for AD sample alone was not done due to small data size).
We performed epsilon-intensive support vector regression (ε-SVR) with RBF kernel using LIBSVM library (Chang and Lin 2011). During ε-SVR, the LOOCV scheme was applied: Each subject was designated as the test sample once, while the remaining subjects were used as training sample. All training sample's FC features of consensus ROIs (n = 45) were trained to predict the test sample's outcome. We then performed model fitting of the raw and predicted NPI score using linear function (f(x) = ax + b). Adjusted R2 was used to estimate goodness of fit for the model. All curve fitting and statistical testing were carried out using MATLAB R2015a (The Mathworks, Natick, MA).
To demonstrate the unique predictive strength of the shared neural circuit for both NPS (NPI-Q) and AD pathology (baseline and change of Aβ/pTau), ε-SVR was performed using NPI-Q as the predictor for baseline and change of Aβ/pTau.
Defining statistical significance with permutation tests
We used permutation tests to evaluate the statistical significance of classification and regression results and to derive p-values (Golland and Fischl 2003). For the classification, we first randomly permuted the class labels for all samples and then performed the classification task. The permutation test was then repeated 5,000 times. We counted the number of times when the permutation classification accuracy was greater than the accuracy obtained based on true labels. The p-value was reported as (number of permutation accuracy > true accuracy) / number of permutations. False discovery rate (FDR) correction for multiple comparisons was conducted as needed. LTOCV (for mixed AD and MCI subjects) and the LOOCV (for MCI subjects only) structures were retained during permutation tests. For the regression, the true value for each sample were permuted and the permutation test was also repeated 5,000 times. The coefficient of determination (R2) was calculated for the permutation. The p-value was reported as (number of permutation R2 > true R2) / number of permutations.
Results
Consensus ROIs and their FC maps for all six NPS domains
We identified that the top 10 ROIs generated the best averaged classification performance across all six NPS domains (Figure 1a). The top 10 consensus ROIs were: Paracentral-Lobule-L, Frontal-Sup-Medial-R, Caudate-L, Caudate-R, Frontal-Mid-L, Cingulum-Ant-L, Pallidum-L, Fusiform-L, Frontal-Sup-Orb-R, Rectus-R (see Figure 1b).
Figure 1. Consensus ROIs.

(a) Averaged classification performance across all six NPS domains when identified top N ROIs are used. When N = 10, the best averaged classification performance across all NPS domains is achieved. (b) The identified 10 ROIs are defined as consensus ROIs and are displayed on a surface rendering of the brain (BrainNet Viewer 1.53). Note, Acc, mean classification accuracy; Sens, mean sensitivity; Spec, mean specificity.
Figure 2 shows region and feature weights of the consensus ROIs' for all six NPS domains and their classification performance. For the entire sample, the average classification accuracy ranged 69.08% to 80.94% (sensitivity ranged 69.98% to 78.20%, specificity ranged 65.22% to 74.71%) across the six NPS domains using FC features from consensus ROIs (FDR corrected p ≤ 0.05 for all six NPS domains). When using FC features of consensus ROIs for MCI sample alone, the averaged classification accuracy ranged 64.29% to 81.43% (sensitivity ranged 67.04% to 70.00%, specificity ranged 69.02% to 74.02%) across the six NPS domains. For AD subjects alone, the averaged classification accuracy ranged 64.29% to 75% (sensitivity ranged 63.60% to 73.20%, specificity ranged 68.85% to 75.66%) across all six NPS domains (Table 2).
Figure 2. Region and FC feature weights of the consensus ROIs for all six NPS domains and their classification performance.
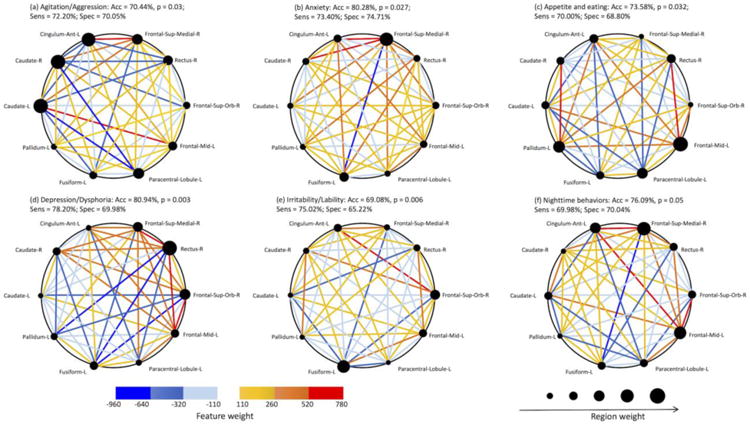
Consensus ROIs are scaled and displayed by their region weight. Positive feature weights (the strength of FC was greater in subject with a particular NPS domain compared to those without this NPS domain) are shown in hot colors, whereas negative feature weights (the strength of FC was lower in those with an NPS domain) are shown in cold colors.
Table 2. fcMVPA results for MCI and AD samples separately.
| Classification Accuracy (Sensitivity, Specificity) | Agitation/ Aggression | Anxiety | Appetite and eating | Depression/ Dysphoria | Irritability/ Lability | Nighttime behaviors |
|---|---|---|---|---|---|---|
| MCI | 74.29% (67.04%, 70.05%) | 80.00% (68.02%, 73.12%) | 81.43% (68.00%, 70.23%) | 77.14% (69.56%, 73.11%) | 64.29% (70%, 69.02%) | 77.14% (67.72%, 74.02%) |
| AD | 64.29% (64.48%, 69.92%) | 75.00% (65.54%, 72.08%) | 64.42% (70.02%, 69.94%) | 78.57% (69.98%, 75.66%) | 67.86% (73.20%, 74.10%) | 71.43% (63.60%, 68.85%) |
Note. fcMVPA, multivariate pattern analysis of functional connectivity; MCI, mild cognitive impairment; AD, Alzheimer's disease.
NPI-Q and Aβ/pTau ratio regression
Applying the regression for the consensus ROIs' FC features and covariates (age, sex, education, and brain atrophy), we generated the “predicted NPI-Q value” for each subject. The linear model fitting (f(x) = ax + b) of the raw and predicted NPI score is: a = 0.6802, 95% CI [0.6125, 0.7479]; b = 0.5268, 95% CI [0.2151, 0.8384]; adjusted R2= 80.34%, permutation test p = 0.019 (see Figure 3a). The linear model fitting of the raw and predicted baseline Aβ/pTau ratio is: a = 0.5567, 95% CI [0.4793, 0.634]; b = 1.793, 95% CI [1.296, 2.29]; adjusted R2 = 71.08%, p = 0.013 (see Figure 3b). The linear model fitting of the raw and predicted change of Aβ/pTau ratio: a = 0.6669, 95% CI [0.5288, 0.805]; b = -0.1757, 95% CI [-0.4858, 0.1344]; adjusted R2 = 70.23%, p = 0.011 (see Figure 3c). For MCI sample only, the adjusted R2 ranged from 49.96% to 67.72% (Table 3).
Figure 3. Regression for NPI-Q and Aβ/pTau ratio using consensus ROIs' FC features.

(a) Regression of consensus ROIs' predictive power on NPI-Q using SVR. Jitter-raw NPI-Q values were used to reduce overplotting. (b) Regression of consensus ROIs' predictive power on baseline Aβ/pTau ratio using SVR. (c) Regression of consensus ROIs' predictive power on change of Aβ/pTau ratio using SVR. Note. MCI, mild cognitive impairment; AD, Alzheimer's disease.
Table 3. NPI-Q and Aβ/pTau ratio regression for MCI subjects only.
| Outcome | Linear model fitting f(x) = ax + b | Adjusted R2 (p) | |
|---|---|---|---|
| a, 95% CI | b, 95% CI | ||
| NPI-Q | 0.5825 [0.4609, 0.704] | 0.6432 [0.1487, 1.138] | 56.73% (0.003) |
| Baseline Aβ/pTau ratio | 0.4161 [0.3047, 0.5274] | 2.871 [2.058, 3.685] | 49.96% (0.032) |
| Change of Aβ/pTau ratio | 0.562 [0.4315, 0.6924] | -0.1631 [-0.4601, -0.1339] | 67.72% (0.019) |
In addition, there was no significant linear relationship between NPI-Q and baseline Aβ/pTau ratio (adjusted R2 = 1.4%) or change of Aβ/pTau ratio (adjusted R2 = 0.4%).
Discussion
Neuropsychiatric symptoms are prominent clinical features of AD. There would likely be shared networks across multiple NPS, and such a shared network would have a strengthened relevance to AD pathology compared to NPS clinical manifestation or neural network belong to individual NPS. Based on these premises, using MVPA we sought to identify the underlying neural substrates of individual NPS. Building upon the MVPA results, we identified 10 consensus ROIs that may be shared by multiple NPS, including the medial prefrontal cortex (MPFC), superior frontal gyrus (SFG), medial frontal gyrus (MFG), caudate, pallidum, anterior cingulate (ACC), fusiform gyrus, rectus, and paracentral lobule. The results showed between 70% - 80% accuracy of the FC features of these 10 ROIs in classifying the symptomatic cases across the six most frequently occurring NPS. In addition, the FC features of the 10 ROIs also predicted the composite score of NPS (indexed by NPI-Q) as well as the AD pathology (indexed by baseline and change of Aβ/pTau ratio) with above 70% accuracy rate. As hypothesized, the majority of these ROIs were in the fronto-limbic circuit, with the rest observed to be in sensory-motor or temporal regions.
We extracted FC features of 10 ROIs with greatest discriminative powers from the cerebrum via fcMVPA results, and applied them to distinguish between individual NPS domains and predict NPI-Q scores and AD pathology. Our method achieved relatively high classification accuracies, i.e., lowest at 69.08% for irritability/lability, and highest at 80.94% for depression/dysphoria. These results were comparable, and in a number of cases better, than previously reported performance using fcMVPA. Zeng et al. used 550 FC features from the whole brain and achieved 94.3% accuracy when comparing depressed patients with healthy controls (Zeng et al. 2012). Liu et al. selected the top 250 FC features from the whole brain to distinguish anxiety patients from healthy controls with an accuracy of 82.5% (Liu et al. 2015). Habes et al. selected 600-1400 voxels' activation features from the visual cortex to understand depression, achieving 72-86% classification accuracy in regions involved in the fronto-limbic system (Habes et al. 2013). Compared to these published studies, our study relied on much fewer regions (n = 10) and FC features (n = 45) to more parsimoniously classify multiple NPS domains. In addition, our approach also showed optimized goodness of fit (all > 70%) for predicting a composite score of multiple NPS domains (NPI-Q, which includes six other domains that were not analyzed individually here) and for baseline and change of Aβ/pTau ratio (obtained from cerebrospinal fluid), respectively. These results advance our understanding of the potential neural substrates of NPS and in particular, shed light on the overlap of common networks for multiple NPS domains and their relevance to not only the symptomatic manifestation but also the AD pathology.
Several fronto-limbic regions were implicated in multiple NPS domains, including the MPFC, MFG, SFG, ACC, caudate, and pallidum. Accumulating evidence demonstrates that disruptions of fronto-limbic structures are associated with psychiatric disorders, such as depression, anxiety, obsessive-compulsive disorder (Goodkind et al. 2015), as well as NPS domains, such as depression, agitation, and anxiety in AD (Boublay et al. 2016). However, it should be acknowledged that previous studies have focused primarily on a single NPS domain and have not attempted to look for overlapping networks across multiple NPS domains. The present study suggests that fronto-limbic connections may represent a common neural basis for several NPS domains. These fronto-limbic regions are comprised of several resting-state networks in the brain, such as the anterior default mode network (aDMN, including the MPFC and ACC) and the basal ganglia network (BG, including caudate and pallidum)(Alexander et al. 1990; Greicius et al. 2003). Our results showed increased connection strength in aDMN accompanying the presence of multiple NPS. An increasing number of studies have now revealed that abnormally increased aDMN connections are associated with depression (Sheline et al. 2009), anxiety (Zhao et al. 2007), aggression (Hoptman et al. 2010), apathy (Whitfield-Gabrieli and Ford 2012), irritability (Letzen et al. 2013), and nighttime behaviors (Balthazar et al. 2014). Also, the increased aDMN connections are also observed in amnestic MCI (Qi et al. 2010), and some AD cases (Damoiseaux et al. 2012). In contrast to the uniformity of aDMN activity across multiple NPS domains, the strength of connections within the BG varied across domains. There was overall decreased strength of BG connections in depression, increased strength in agitation, irritability, and anxiety, while the pattern of strength in appetite, nighttime behaviors was not evident. Dysfunction of BG has been reported as an early marker for AD (Ryan et al. 2013), as well as depression and anxiety (Furman et al. 2011; Etkin et al. 2009; Marchand 2010). A reasonable next step will be to examine the directional influence across these networks in NPS and AD pathology, which may help refine the primary therapeutic target that simultaneously addressing both.
In addition to a general brain mapping of the 10 ROIs or the relevant default networks discussed above, it is important to emphasize how different weightings of ROIs contributed to the specific NPS domain relevant mapping. The greatest contribution for depression was located in rectus; caudate and ACC were the primary contributors for agitation; SFG contributed the most to anxiety and nighttime behaviors; MPFC contributed to appetite; and the fusiform gyrus was the major contributor for irritability. These findings are quite consistent with prior work suggesting regionally-specific contributions to the various NPS domains: neurofibrillary tangles in ACC have been associated with agitation in AD (Tekin et al. 2001). The medial SFG has been associated with worry triggered by sentences in generalized anxiety disorders (Paulesu et al. 2010), and MPFC activity was found to be related to eating disorders (Uher et al. 2004).
The roles of the fusiform gyrus, rectus and paracentral lobules in psychiatric disorders or AD-related NPS domains have not been studied yet. However, previous studies identified dysfunction or atrophy of these regions as early markers for incident AD (Sheline et al. 2010; Julkunen et al. 2009). Whether these regions directly contribute to NPS domains or their roles in cognitive and sensory-motor domains are indirectly linked to NPS domains need to be further validated. Of relevance, comparison of the neural profiles underlying multiple NPS domains and cognitive deficits in AD beyond these understudied regions will also help further elucidate the shared neural substrates underlying NPS domains. Of note, NPS domains often coexist in patients with AD-associated neurodegenerative processes. Prevalence of anxiety and nighttime behaviors are known to be high among individuals with depressive symptoms (Teri et al. 1999; Fuh et al. 2001). We initiated this area of investigation by examining the co-occurrence of NPS in the composite NPI-Q score. Future studies need to further validate the current neural pattern among patients with comorbid NPS domains with a longitudinal design.
Several limitations should be acknowledged. First, the classification and regression process in MVPA require large sample sizes. Also, potentially due to self-selection bias in the ADNI dataset, the NPS domains' burden was relatively low. Some common NPS domains, such as delusion and apathy (Boublay et al. 2016), did not appear in the current sample. Related to the low NPS burden, we therefore only selected the top 50% of the NPS domains and did not include cognitively healthy controls. However, this may also reflect the true prevalence of NPS in the relatively early stage of AD-associated neurodegeneration. Third, we segmented the brain using the AAL atlas (the cerebral regions). It is important to test whether the results can be replicated using whole brain voxel-wise analysis, such as searchlight analysis (Kriegeskorte et al. 2006; Pereira et al. 2009). Besides, we selected only the top 10 brain regions for further analysis, which may leave out some important regions. Amygdala and insula have been found to be involved in emotional regulation and mood disorders (Banks et al. 2007; Drevets 2003). It should also be pointed out that our measures of NPS are somewhat impoverished since the NPI-Q is considered a screening questionnaire, and a more comprehensive assessment of NPS domains would be a valuable avenue for future work. Relevantly, the shared neural circuit was generated from the presence of six NPS domains while the composite NPI-Q score covers the presence and severity of a total of 12 NPS domains (including six domains we did not use to select consensus ROIs during fcMVPA). We mean to show the comprehensive predictive value of the discovered neural network. Regardless, the circularity and performing cross-validation on the same dataset may be issues which require validations using different samples in the future.
Conclusion
We applied the MVPA approach to identify potential neural substrates of multiple NPS domains across AD stages. Future studies will need to investigate the structural and pathological changes within the identified substrates to further validate the neural links between NPS domains and AD pathology. The ten regions, most of which are fronto-limbic relevant neural circuits, showed discriminative accuracy ranged 70% to 80% for multiple NPS domains as well as AD pathology. With further validation, the shared neural circuit may link clinical symptomatic manifestation with the underlying AD pathology and enhance the diagnostic value of NPS in predicting AD progression.
Acknowledgments
We thank Andrew J. Anderson, Benjamin D. Zinszer, Carol A. Jew, and Jiayi Zhou for helpful discussions and comments.
Funding: The manuscript writing was funded by the Alzheimer's Association New Investigator Grant (NIRG-14-317353) and National Institutes of Health R01 grant (R01NR015452 and R21AG053193) to F. Lin.
Data collection and sharing for this project was funded by the Alzheimer's Disease Neuroimaging Initiative (ADNI) (National Institutes of Health Grant U01 AG024904) and DOD ADNI (Department of Defense award number W81XWH-12-2-0012). ADNI is funded by the National Institute on Aging, the National Institute of Biomedical Imaging and Bioengineering, and through generous contributions from the following: AbbVie, Alzheimer's Association; Alzheimer's Drug Discovery Foundation; Araclon Biotech; BioClinica, Inc.; Biogen; Bristol-Myers Squibb Company; CereSpir, Inc.; Eisai Inc.; Elan Pharmaceuticals, Inc.; Eli Lilly and Company; EuroImmun; F. Hoffmann-La Roche Ltd and its affiliated company Genentech, Inc.; Fujirebio; GE Healthcare; IXICO Ltd.; Janssen Alzheimer Immunotherapy Research & Development, LLC.; Johnson & Johnson Pharmaceutical Research & Development LLC.; Lumosity; Lundbeck; Merck & Co., Inc.; Meso Scale Diagnostics, LLC.; NeuroRx Research; Neurotrack Technologies; Novartis Pharmaceuticals Corporation; Pfizer Inc.; Piramal Imaging; Servier; Takeda Pharmaceutical Company; and Transition Therapeutics. The Canadian Institutes of Health Research is providing funds to support ADNI clinical sites in Canada. Private sector contributions are facilitated by the Foundation for the National Institutes of Health (www.fnih.org). The grantee organization is the Northern California Institute for Research and Education, and the study is coordinated by the Alzheimer's Disease Cooperative Study at the University of California, San Diego. ADNI data are disseminated by the Laboratory for Neuro Imaging at the University of Southern California.
Footnotes
Compliance with Ethical Standards: Conflict of Interest: X. Wang, P. Ren, M. Mapstone, Y. Conwell, A.P. Porsteinsson, J.J. Foxe, R.D.S. Raizada, and F. Lin declare that they have no conflict of interest.
Ethical approval: All procedures performed in studies involving human participants were in accordance with the ethical standards of the institutional and/or national research committee and with the 1964 Helsinki declaration and its later amendments or comparable ethical standards.
Informed consent: Informed consent was obtained from all individual participants included in the study.
References
- Alexander GE, Crutcher MD, DeLong MR. Basal ganglia-thalamocortical circuits: parallel substrates for motor, oculomotor, “prefrontal” and “limbic” functions. Prog Brain Res. 1990;85:119–146. [PubMed] [Google Scholar]
- Ashburner J. A fast diffeomorphic image registration algorithm. Neuroimage. 2007;38(1):95–113. doi: 10.1016/j.neuroimage.2007.07.007. [DOI] [PubMed] [Google Scholar]
- Balthazar ML, Pereira FR, Lopes TM, da Silva EL, Coan AC, Campos BM, et al. Neuropsychiatric symptoms in Alzheimer's disease are related to functional connectivity alterations in the salience network. Hum Brain Mapp. 2014;35(4):1237–1246. doi: 10.1002/hbm.22248. [DOI] [PMC free article] [PubMed] [Google Scholar]
- Banks SJ, Eddy KT, Angstadt M, Nathan PJ, Phan KL. Amygdala-frontal connectivity during emotion regulation. Soc Cogn Affect Neurosci. 2007;2(4):303–312. doi: 10.1093/scan/nsm029. [DOI] [PMC free article] [PubMed] [Google Scholar]
- Beltrachini L, De Marco M, Taylor ZA, Lotjonen J, Frangi AF, Venneri A. Integration of Cognitive Tests and Resting State fMRI for the Individual Identification of Mild Cognitive Impairment. Curr Alzheimer Res. 2015;12(6):592–603. doi: 10.2174/156720501206150716120332. [DOI] [PubMed] [Google Scholar]
- Ben-Hur A, Ong CS, Sonnenburg S, Schokopf B, Ratsch G. Support Vector Machines and Kernels for Computational Biology. Plos Computational Biology. 2008;4(10) doi: 10.1371/journal.pcbi.1000173. [DOI] [PMC free article] [PubMed] [Google Scholar]
- Biswal B, Yetkin FZ, Haughton VM, Hyde JS. Functional Connectivity in the Motor Cortex of Resting Human Brain Using Echo-Planar Mri. Magnetic Resonance in Medicine. 1995;34(4):537–541. doi: 10.1002/mrm.1910340409. [DOI] [PubMed] [Google Scholar]
- Boublay N, Schott AM, Krolak-Salmon P. Neuroimaging correlates of neuropsychiatric symptoms in Alzheimer's disease: a review of 20 years of research. Eur J Neurol. 2016 doi: 10.1111/ene.13076. [DOI] [PubMed] [Google Scholar]
- Bray S, Chang C, Hoeft F. Applications of multivariate pattern classification analyses in developmental neuroimaging of healthy and clinical populations. Front Hum Neurosci. 2009;3:32. doi: 10.3389/neuro.09.032.2009. [DOI] [PMC free article] [PubMed] [Google Scholar]
- Challis E, Hurley P, Serra L, Bozzali M, Oliver S, Cercignani M. Gaussian process classification of Alzheimer's disease and mild cognitive impairment from resting-state fMRI. Neuroimage. 2015;112:232–243. doi: 10.1016/j.neuroimage.2015.02.037. [DOI] [PubMed] [Google Scholar]
- Chang CC, Lin CJ. LIBSVM: A Library for Support Vector Machines. ACM Transactions on Intelligent Systems and Technology. 2011;2(3) doi: 10.1145/1961189.1961199. [DOI] [Google Scholar]
- Chao-Gan Y, Yu-Feng Z. DPARSF: A MATLAB Toolbox for “Pipeline” Data Analysis of Resting-State fMRI. Front Syst Neurosci. 2010;4:13. doi: 10.3389/fnsys.2010.00013. [DOI] [PMC free article] [PubMed] [Google Scholar]
- Damoiseaux JS, Prater KE, Miller BL, Greicius MD. Functional connectivity tracks clinical deterioration in Alzheimer's disease. Neurobiol Aging. 2012;33(4):828, e819–830. doi: 10.1016/j.neurobiolaging.2011.06.024. [DOI] [PMC free article] [PubMed] [Google Scholar]
- David ND, Lin F, Porsteinsson AP Alzheimer's Disease Neuroimaging, I. Trajectories of Neuropsychiatric Symptoms and Cognitive Decline in Mild Cognitive Impairment. Am J Geriatr Psychiatry. 2016;24(1):70–80. doi: 10.1016/j.jagp.2015.06.001. [DOI] [PMC free article] [PubMed] [Google Scholar]
- De Meyer G, Shapiro F, Vanderstichele H, Vanmechelen E, Engelborghs S, De Deyn PP, et al. Diagnosis-independent Alzheimer disease biomarker signature in cognitively normal elderly people. Arch Neurol. 2010;67(8):949–956. doi: 10.1001/archneurol.2010.179. [DOI] [PMC free article] [PubMed] [Google Scholar]
- Dosenbach NU, Nardos B, Cohen AL, Fair DA, Power JD, Church JA, et al. Prediction of individual brain maturity using fMRI. Science. 2010;329(5997):1358–1361. doi: 10.1126/science.1194144. [DOI] [PMC free article] [PubMed] [Google Scholar]
- Drevets WC. Neuroimaging abnormalities in the amygdala in mood disorders. Ann N Y Acad Sci. 2003;985:420–444. doi: 10.1111/j.1749-6632.2003.tb07098.x. [DOI] [PubMed] [Google Scholar]
- Etkin A, Prater KE, Schatzberg AF, Menon V, Greicius MD. Disrupted amygdalar subregion functional connectivity and evidence of a compensatory network in generalized anxiety disorder. Arch Gen Psychiatry. 2009;66(12):1361–1372. doi: 10.1001/archgenpsychiatry.2009.104. [DOI] [PMC free article] [PubMed] [Google Scholar]
- Fan Y, Batmanghelich N, Clark CM, Davatzikos C Alzheimer's Disease Neuroimaging, I. Spatial patterns of brain atrophy in MCI patients, identified via high-dimensional pattern classification, predict subsequent cognitive decline. Neuroimage. 2008;39(4):1731–1743. doi: 10.1016/j.neuroimage.2007.10.031. [DOI] [PMC free article] [PubMed] [Google Scholar]
- Fox MD, Corbetta M, Snyder AZ, Vincent JL, Raichle ME. Spontaneous neuronal activity distinguishes human dorsal and ventral attention systems. Proc Natl Acad Sci U S A. 2006;103(26):10046–10051. doi: 10.1073/pnas.0604187103. [DOI] [PMC free article] [PubMed] [Google Scholar]
- Friston KJ, Holmes AP, Poline JB, Grasby PJ, Williams SCR, Frackowiak RSJ, et al. Analysis of Fmri Time-Series Revisited. Neuroimage. 1995;2(1):45–53. doi: 10.1006/nimg.1995.1007. [DOI] [PubMed] [Google Scholar]
- Fuh JL, Liu CK, Mega MS, Wang SJ, Cummings JL. Behavioral disorders and caregivers' reaction in Taiwanese patients with Alzheimer's disease. Int Psychogeriatr. 2001;13(1):121–128. doi: 10.1017/s1041610201007517. [DOI] [PubMed] [Google Scholar]
- Furman DJ, Hamilton JP, Gotlib IH. Frontostriatal functional connectivity in major depressive disorder. Biol Mood Anxiety Disord. 2011;1(1):11. doi: 10.1186/2045-5380-1-11. [DOI] [PMC free article] [PubMed] [Google Scholar]
- Geda YE, Roberts RO, Knopman DS, Petersen RC, Christianson TJ, Pankratz VS, et al. Prevalence of neuropsychiatric symptoms in mild cognitive impairment and normal cognitive aging: population-based study. Arch Gen Psychiatry. 2008;65(10):1193–1198. doi: 10.1001/archpsyc.65.10.1193. [DOI] [PMC free article] [PubMed] [Google Scholar]
- Golland P, Fischl B. Permutation tests for classification: towards statistical significance in image-based studies. Inf Process Med Imaging. 2003;18:330–341. doi: 10.1007/978-3-540-45087-0_28. [DOI] [PubMed] [Google Scholar]
- Goodkind M, Eickhoff SB, Oathes DJ, Jiang Y, Chang A, Jones-Hagata LB, et al. Identification of a common neurobiological substrate for mental illness. JAMA Psychiatry. 2015;72(4):305–315. doi: 10.1001/jamapsychiatry.2014.2206. [DOI] [PMC free article] [PubMed] [Google Scholar]
- Greicius MD, Krasnow B, Reiss AL, Menon V. Functional connectivity in the resting brain: a network analysis of the default mode hypothesis. Proc Natl Acad Sci U S A. 2003;100(1):253–258. doi: 10.1073/pnas.0135058100. [DOI] [PMC free article] [PubMed] [Google Scholar]
- Habes I, Krall SC, Johnston SJ, Yuen KS, Healy D, Goebel R, et al. Pattern classification of valence in depression. Neuroimage Clin. 2013;2:675–683. doi: 10.1016/j.nicl.2013.05.001. [DOI] [PMC free article] [PubMed] [Google Scholar]
- Hoptman MJ, D'Angelo D, Catalano D, Mauro CJ, Shehzad ZE, Kelly AM, et al. Amygdalofrontal functional disconnectivity and aggression in schizophrenia. Schizophr Bull. 2010;36(5):1020–1028. doi: 10.1093/schbul/sbp012. [DOI] [PMC free article] [PubMed] [Google Scholar]
- Hsu CW, Chang CC, Lin CJ. A practical guide to support vector classification 2003 [Google Scholar]
- Insel T, Cuthbert B, Garvey M, Heinssen R, Pine DS, Quinn K, et al. Research domain criteria (RDoC): toward a new classification framework for research on mental disorders. Am J Psychiatry. 2010;167(7):748–751. doi: 10.1176/appi.ajp.2010.09091379. [DOI] [PubMed] [Google Scholar]
- Julkunen V, Niskanen E, Muehlboeck S, Pihlajamaki M, Kononen M, Hallikainen M, et al. Cortical thickness analysis to detect progressive mild cognitive impairment: a reference to Alzheimer's disease. Dement Geriatr Cogn Disord. 2009;28(5):404–412. doi: 10.1159/000256274. [DOI] [PubMed] [Google Scholar]
- Kales HC, Gitlin LN, Lyketsos CG. Assessment and management of behavioral and psychological symptoms of dementia. BMJ. 2015;350:h369. doi: 10.1136/bmj.h369. [DOI] [PMC free article] [PubMed] [Google Scholar]
- Kearns M, Ron D. Algorithmic stability and sanity-check bounds for leave-one-out cross-validation. Neural Computation. 1999;11(6):1427–1453. doi: 10.1162/089976699300016304. [DOI] [PubMed] [Google Scholar]
- Kelly AMC, Uddin LQ, Biswal BB, Castellanos FX, Milham MP. Competition between functional brain networks mediates behavioral variability. Neuroimage. 2008;39(1):527–537. doi: 10.1016/j.neuroimage.2007.08.008. [DOI] [PubMed] [Google Scholar]
- Kendall M, Jean D. Rank correlation methods. New York: Oxford University Press; 1990. [Google Scholar]
- Kriegeskorte N, Goebel R, Bandettini P. Information-based functional brain mapping. Proc Natl Acad Sci U S A. 2006;103(10):3863–3868. doi: 10.1073/pnas.0600244103. [DOI] [PMC free article] [PubMed] [Google Scholar]
- Lanctot KL, Herrmann N, Nadkarni NK, Leibovitch FS, Caldwell CB, Black SE. Medial temporal hypoperfusion and aggression in Alzheimer disease. Archives of Neurology. 2004;61(11):1731–1737. doi: 10.1001/archneur.61.11.1731. [DOI] [PubMed] [Google Scholar]
- Letzen JE, Craggs JG, Perlstein WM, Price DD, Robinson ME. Functional connectivity of the default mode network and its association with pain networks in irritable bowel patients assessed via lidocaine treatment. J Pain. 2013;14(10):1077–1087. doi: 10.1016/j.jpain.2013.04.003. [DOI] [PMC free article] [PubMed] [Google Scholar]
- Liu F, Guo WB, Fouche JP, Wang YF, Wang WQ, Ding JR, et al. Multivariate classification of social anxiety disorder using whole brain functional connectivity. Brain Structure & Function. 2015;220(1):101–115. doi: 10.1007/s00429-013-0641-4. [DOI] [PubMed] [Google Scholar]
- Lyketsos CG, Lopez O, Jones B, Fitzpatrick AL, Breitner J, DeKosky S. Prevalence of neuropsychiatric symptoms in dementia and mild cognitive impairment: results from the cardiovascular health study. JAMA. 2002;288(12):1475–1483. doi: 10.1001/jama.288.12.1475. [DOI] [PubMed] [Google Scholar]
- Magnin B, Mesrob L, Kinkingnehun S, Pelegrini-Issac M, Colliot O, Sarazin M, et al. Support vector machine-based classification of Alzheimer's disease from whole-brain anatomical MRI. Neuroradiology. 2009;51(2):73–83. doi: 10.1007/s00234-008-0463-x. [DOI] [PubMed] [Google Scholar]
- Maldjian JA, Laurienti PJ, Kraft RA, Burdette JH. An automated method for neuroanatomic and cytoarchitectonic atlas-based interrogation of fMRI data sets. Neuroimage. 2003;19(3):1233–1239. doi: 10.1016/s1053-8119(03)00169-1. [DOI] [PubMed] [Google Scholar]
- Marchand WR. Cortico-basal ganglia circuitry: a review of key research and implications for functional connectivity studies of mood and anxiety disorders. Brain Structure & Function. 2010;215(2):73–96. doi: 10.1007/s00429-010-0280-y. [DOI] [PubMed] [Google Scholar]
- Okura T, Plassman BL, Steffens DC, Llewellyn D, Potter GG, Langa KM. Prevalence of Neuropsychiatric Symptoms and Their Association with Functional Limitations in Older Adults in the United States: The Aging, Demographics, and Memory Study. Journal of the American Geriatrics Society. 2010;58(2):330–337. doi: 10.1111/j.1532-5415.2009.02680.x. [DOI] [PMC free article] [PubMed] [Google Scholar]
- Paulesu E, Sambugaro E, Torti T, Danelli L, Ferri F, Scialfa G, et al. Neural correlates of worry in generalized anxiety disorder and in normal controls: a functional MRI study. Psychol Med. 2010;40(1):117–124. doi: 10.1017/S0033291709005649. [DOI] [PubMed] [Google Scholar]
- Pereira F, Mitchell T, Botvinick M. Machine learning classifiers and fMRI: a tutorial overview. Neuroimage. 2009;45(1 Suppl):S199–209. doi: 10.1016/j.neuroimage.2008.11.007. [DOI] [PMC free article] [PubMed] [Google Scholar]
- Poulin SP, Dautoff R, Morris JC, Barrett LF, Dickerson BC, Initia ADN. Amygdala atrophy is prominent in early Alzheimer's disease and relates to symptom severity. Psychiatry Research-Neuroimaging. 2011;194(1):7–13. doi: 10.1016/j.pscychresns.2011.06.014. [DOI] [PMC free article] [PubMed] [Google Scholar]
- Qi Z, Wu X, Wang Z, Zhang N, Dong H, Yao L, et al. Impairment and compensation coexist in amnestic MCI default mode network. Neuroimage. 2010;50(1):48–55. doi: 10.1016/j.neuroimage.2009.12.025. [DOI] [PubMed] [Google Scholar]
- Raudys SJ, Jain AK. Small Sample-Size Effects in Statistical Pattern-Recognition - Recommendations for Practitioners. IEEE Trans Pattern Anal Mach Intell. 1991;13(3):252–264. doi: 10.1109/34.75512. [DOI] [Google Scholar]
- Reeves S, Brown R, Howard R, Grasby P. Increased striatal dopamine (D2/D3) receptor availability and delusions in Alzheimer disease. Neurology. 2009;72(6):528–534. doi: 10.1212/01.wnl.0000341932.21961.f3. [DOI] [PMC free article] [PubMed] [Google Scholar]
- Ren P, Lo RY, Chapman BP, Mapstone M, Porsteinsson A, Lin F, et al. Longitudinal Alteration of Intrinsic Brain Activity in the Striatum in Mild Cognitive Impairment. J Alzheimers Dis. 2016;54(1):69–78. doi: 10.3233/JAD-160368. [DOI] [PMC free article] [PubMed] [Google Scholar]
- Rosenberg PB, Nowrangi MA, Lyketsos CG. Neuropsychiatric symptoms in Alzheimer's disease: What might be associated brain circuits? Molecular Aspects of Medicine. 2015:43–44. 25–37. doi: 10.1016/j.mam.2015.05.005. [DOI] [PMC free article] [PubMed] [Google Scholar]
- Ryan NS, Keihaninejad S, Shakespeare TJ, Lehmann M, Crutch SJ, Malone IB, et al. Magnetic resonance imaging evidence for presymptomatic change in thalamus and caudate in familial Alzheimer's disease. Brain. 2013;136(Pt 5):1399–1414. doi: 10.1093/brain/awt065. [DOI] [PMC free article] [PubMed] [Google Scholar]
- Sekine Y, Iyo M, Ouchi Y, Matsunaga T, Tsukada H, Okada H, et al. Methamphetamine-related psychiatric symptoms and reduced brain dopamine transporters studied with PET. Am J Psychiatry. 2001;158(8):1206–1214. doi: 10.1176/appi.ajp.158.8.1206. [DOI] [PubMed] [Google Scholar]
- Sheline YI, Barch DM, Price JL, Rundle MM, Vaishnavi SN, Snyder AZ, et al. The default mode network and self-referential processes in depression. Proc Natl Acad Sci U S A. 2009;106(6):1942–1947. doi: 10.1073/pnas.0812686106. [DOI] [PMC free article] [PubMed] [Google Scholar]
- Sheline YI, Raichle ME, Snyder AZ, Morris JC, Head D, Wang S, et al. Amyloid plaques disrupt resting state default mode network connectivity in cognitively normal elderly. Biol Psychiatry. 2010;67(6):584–587. doi: 10.1016/j.biopsych.2009.08.024. [DOI] [PMC free article] [PubMed] [Google Scholar]
- Shin IS, Carter M, Masterman D, Fairbanks L, Cummings JL. Neuropsychiatric symptoms and quality of life in Alzheimer disease. Am J Geriatr Psychiatry. 2005;13(6):469–474. doi: 10.1176/appi.ajgp.13.6.469. [DOI] [PubMed] [Google Scholar]
- Sink KM, Covinsky KE, Barnes DE, Newcomer RJ, Yaffe K. Caregiver characteristics are associated with neuropsychiatric symptoms of dementia. Journal of the American Geriatrics Society. 2006;54(5):796–803. doi: 10.1111/j.1532-5415.2006.00697.x. [DOI] [PubMed] [Google Scholar]
- Smith AM, Walker LAS, Freedman MS, DeMeulemeester C, Hogan MJ, Cameron I. fMRI investigation of disinhibition in cognitively impaired patients with multiple sclerosis. J Neurol Sci. 2009;281(1-2):58–63. doi: 10.1016/j.jns.2009.02.366. [DOI] [PubMed] [Google Scholar]
- Sun DQ, van Erp TGM, Thompson PM, Bearden CE, Daley M, Kushan L, et al. Elucidating a Magnetic Resonance Imaging-Based Neuroanatomic Biomarker for Psychosis: Classification Analysis Using Probabilistic Brain Atlas and Machine Learning Algorithms. Biological Psychiatry. 2009;66(11):1055–1060. doi: 10.1016/j.biopsych.2009.07.019. [DOI] [PMC free article] [PubMed] [Google Scholar]
- Tekin S, Mega MS, Masterman DM, Chow T, Garakian J, Vinters HV, et al. Orbitofrontal and anterior cingulate cortex neurofibrillary tangle burden is associated with agitation in Alzheimer disease. Ann Neurol. 2001;49(3):355–361. [PubMed] [Google Scholar]
- Teri L, Ferretti LE, Gibbons LE, Logsdon RG, McCurry SM, Kukull WA, et al. Anxiety of Alzheimer's disease: prevalence, and comorbidity. J Gerontol A Biol Sci Med Sci. 1999;54(7):M348–352. doi: 10.1093/gerona/54.7.m348. [DOI] [PubMed] [Google Scholar]
- Theleritis C, Politis A, Siarkos K, Lyketsos CG. A review of neuroimaging findings of apathy in Alzheimer's disease. Int Psychogeriatr. 2014;26(2):195–207. doi: 10.1017/S1041610213001725. [DOI] [PMC free article] [PubMed] [Google Scholar]
- Thomas AJ, Hendriksen M, Piggott M, Ferrier IN, Perry E, Ince P, et al. A study of the serotonin transporter in the prefrontal cortex in late-life depression and Alzheimer's disease with and without depression. Neuropathol Appl Neurobiol. 2006;32(3):296–303. doi: 10.1111/1365-2990.2006.00728.x. [DOI] [PubMed] [Google Scholar]
- Tzourio-Mazoyer N, Landeau B, Papathanassiou D, Crivello F, Etard O, Delcroix N, et al. Automated anatomical labeling of activations in SPM using a macroscopic anatomical parcellation of the MNI MRI single-subject brain. Neuroimage. 2002;15(1):273–289. doi: 10.1006/nimg.2001.0978. [DOI] [PubMed] [Google Scholar]
- Uher R, Murphy T, Brammer MJ, Dalgleish T, Phillips ML, Ng VW, et al. Medial prefrontal cortex activity associated with symptom provocation in eating disorders. Am J Psychiatry. 2004;161(7):1238–1246. doi: 10.1176/appi.ajp.161.7.1238. [DOI] [PubMed] [Google Scholar]
- Whitfield-Gabrieli S, Ford JM. Default mode network activity and connectivity in psychopathology. Annu Rev Clin Psychol. 2012;8:49–76. doi: 10.1146/annurev-clinpsy-032511-143049. [DOI] [PubMed] [Google Scholar]
- Zeng LL, Shen H, Liu L, Wang L, Li B, Fang P, et al. Identifying major depression using whole-brain functional connectivity: a multivariate pattern analysis. Brain. 2012;135(Pt 5):1498–1507. doi: 10.1093/brain/aws059. [DOI] [PubMed] [Google Scholar]
- Zhao XH, Wang PJ, Li CB, Hu ZH, Xi Q, Wu WY, et al. Altered default mode network activity in patient with anxiety disorders: an fMRI study. Eur J Radiol. 2007;63(3):373–378. doi: 10.1016/j.ejrad.2007.02.006. [DOI] [PubMed] [Google Scholar]
- Zhou B, Liu Y, Zhang Z, An N, Yao H, Wang P, et al. Impaired functional connectivity of the thalamus in Alzheimer's disease and mild cognitive impairment: a resting-state fMRI study. Curr Alzheimer Res. 2013;10(7):754–766. doi: 10.2174/15672050113109990146. [DOI] [PubMed] [Google Scholar]