Abstract
Groundwater level measurements from 3907 monitoring wells, distributed within 22 major river basins of India, are assessed to characterize their spatial and temporal variability. Groundwater storage (GWS) anomalies (relative to the long-term mean) exhibit strong seasonality, with annual maxima observed during the monsoon season and minima during pre-monsoon season. Spatial variability of GWS anomalies increases with the extent of measurements, following the power law relationship, i.e., log-(spatial variability) is linearly dependent on log-(spatial extent). In addition, the impact of well spacing on spatial variability and the power law relationship is investigated. We found that the mean GWS anomaly sampled at a 0.25 degree grid scale closes to unweighted average over all wells. The absolute error corresponding to each basin grows with increasing scale, i.e., from 0.25 degree to 1 degree. It was observed that small changes in extent could create very large changes in spatial variability at large grid scales. Spatial variability of GWS anomaly has been found to vary with climatic conditions. To our knowledge, this is the first study of the effects of well spacing on groundwater spatial variability. The results may be useful for interpreting large scale groundwater variations from unevenly spaced or sparse groundwater well observations or for siting and prioritizing wells in a network for groundwater management. The output of this study could be used to maintain a cost effective groundwater monitoring network in the study region and the approach can also be used in other parts of the globe.
Keywords: Groundwater, India, Groundwater spatial variability, Groundwater monitoring network design
Graphical abstract
Groundwater is a vital fresh water resource that is vulnerable to climate change and unsustainable rates of extraction (e.g., Wada et al., 2010; Famiglietti and Rodell, 2013; Taylor et al., 2013). Globally, about 38% of the irrigated land area are fed using groundwater resources (Siebert et al., 2010). Recent studies have detected rapid depletion of groundwater resources in many parts of the world using satellite observations (Rodell et al., 2009; Voss et al., 2013; Richie et al., 2015).
Spatial variability of soil moisture has been extensively studied (Famiglietti et al., 2008; Brocca et al., 2012; Li and Rodell, 2013) and has been found to increase with increasing extent (the length scale of the major river basins within the study region) (Western and Blösch, 1999), following the power law relationship. Few studies have been conducted on groundwater spatial variability owing to the scarcity of available, high quality measurement time-series at regional scales. Inadequate information on sub-surface properties such as specific yield, which is required to convert water table measurements to water storage, also complicates such analyses. Li et al. (2015) studied groundwater storage variability using data from 181 monitoring wells in the central and northeastern U.S and found that the spatial variability of groundwater storage anomalies follow the power law relationship. However, observation wells in that study were sparse in some areas and sampled only at a small range of climate conditions.
Studying groundwater variability across scales may benefit efforts to evaluate and interpret remote sensing based estimates and to improve numerical models, and also to better predict groundwater responses to climate change and anthropogenic impacts (Taylor et al., 2013). Further, groundwater variability scaling information could be used to improve comparisons between point-scale and remote sensing estimates. The Gravity Recovery and Climate Experiment (GRACE) satellite observations have proven useful for evaluating groundwater variations and trends at regional scales (e.g., Rodell et al., 2007). GRACE data assimilation enables spatial, temporal, and vertical partitioning of GRACE TWS observations using an ensemble Kalman smoother approach (Zaitchik et al., 2008), but it is limited by the fidelity of the land surface model and the accuracy of the meteorological forcing inputs. In particular, models currently used for GRACE data assimilation, are representing hydrogeological processes in a rudimentary fashion and do not account for human interactions. Improved understanding of groundwater dynamics and how they vary with scale may be useful for interpreting large scale groundwater variations from unevenly spaced or sparse groundwater well observations, for siting and prioritizing wells in a network for groundwater management, and for identifying environmental controls on groundwater (Li et al., 2015).
In this study, we examined temporal and spatial groundwater storage anomaly variability within 22 major river basins in India. A dense monitoring network of over 3900 observation wells was used to study the dependency of groundwater storage variability on both extent and spacing, the two components of the scale triplet (Western and Blösch, 1999). Extent describes the spatial scale of a study area and spacing refers to the distance between the two observations (Western and Blösch, 1999). To our knowledge, this is the first study of the effects of well spacing on groundwater spatial variability.
2 Data and Methods
2.1 Study area
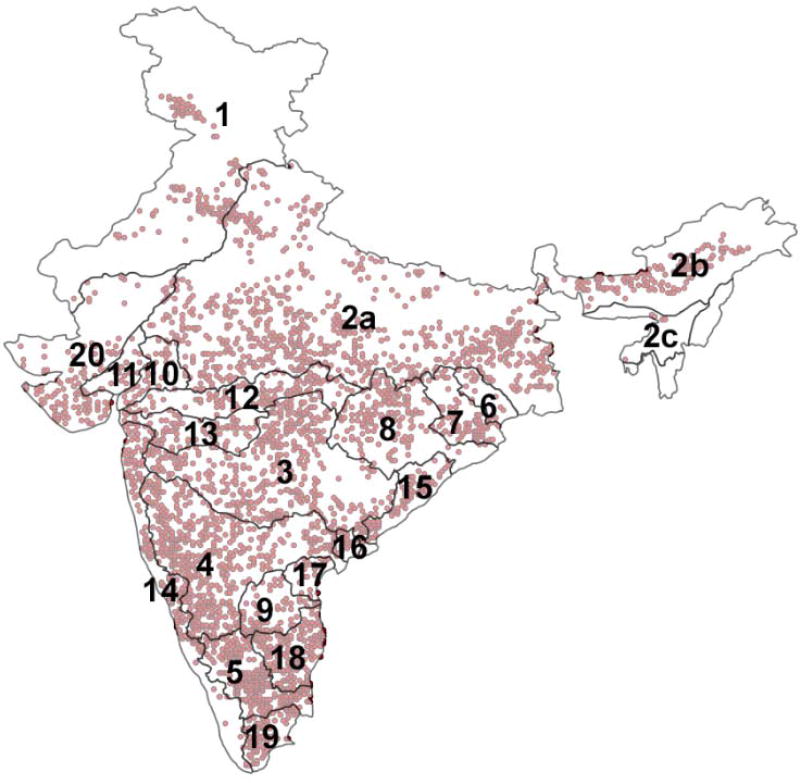
India is comprised of 22 major river basins (Figure 1 and Table 1), based on India-WRIS (2012). The Ganges river basin (basin 2a) is the largest, with an area of 808,334 km2, and the basin 16 is the smallest with an area of 10,345 km2 (Table 1). The hydrogeological settings of the river-basins are highly heterogeneous. For example, major parts of the Ganges basin has comprised of highly conducive, fluvial sediments, while, some parts of southern and western Ganges basin, has comprised of less conducive, volcanic and crystalline materials (Mukherjee et al., 2015; Bhanja et al., 2016). Annual precipitation rate (averaged over 1962 and 2011) in the entire country is 1083 mm/year (WBA, 2015) but varies considerably, with extremely low precipitation (<150 mm/year) observed in the western part of the country, and high precipitation (>2500 mm/year) in the east (Mukherjee et al., 2015). At the basin scale, the maximum and minimum precipitation occur in the basin 2c (2759 mm/year) and the Indus basin (basin 1; 545 mm/year), respectively.
Figure 1.
Boundaries of 22 river basins (names are given in Table 1) within India and locations of groundwater wells used in this study (indicated by small filled circles)
Table 1.
Basin number, name, geographical area, number of wells used, specific yield (Sy), groundwater level depth range, and average annual precipitation
| Basin no. |
Basin name | Area (km2) |
Wells | Sy | GWL Depth Range (m) |
Precipitation (mm/yr) |
|---|---|---|---|---|---|---|
| 1 | Indus Basin (Indian part) | 453932 | 140 | 0.095 | 0 – 78.8 | 545 |
| 2a | Ganges Basin | 808334 | 861 | 0.044 | 0 – 60.6 | 1088 |
| 2b | Brahmaputra Basin | 186422 | 152 | 0.087 | 0 – 19.6 | 2323 |
| 2c | Barak and others Basin | 45622 | 6 | 0.045 | 0 – 6.1 | 2759 |
| 3 | Godavari Basin | 302064 | 460 | 0.023 | 0 – 35.0 | 1255 |
| 4 | Krishna Basin | 254743 | 547 | 0.022 | 0 – 48.1 | 1078 |
| 5 | Cauvery Basin | 85624 | 302 | 0.024 | 0 – 59.3 | 1344 |
| 6 | Subarnarekha Basin | 25792 | 22 | 0.035 | 0 – 14.6 | 1555 |
| 7 | Brahmani and Baitarni Basin | 51894 | 87 | 0.057 | 0 – 13.7 | 1537 |
| 8 | Mahanadi Basin | 139659 | 167 | 0.039 | 0 – 33.2 | 1452 |
| 9 | Pennar Basin | 54243 | 100 | 0.022 | 0 – 47.5 | 800 |
| 10 | Mahi Basin | 38337 | 55 | 0.029 | 0 – 34.3 | 1010 |
| 11 | Sabarmati Basin | 30679 | 36 | 0.023 | 0 – 30.9 | 949 |
| 12 | Narmada Basin | 92671 | 114 | 0.021 | 0 – 30.8 | 1219 |
| 13 | Tapi Basin | 63923 | 87 | 0.020 | 0 – 38.0 | 1066 |
| 14 | West flowing rivers South of Tapi Basin | 111644 | 178 | 0.021 | 0 – 35.0 | 2536 |
| 15 | East flowing rivers between Mahanadi and Godavari Basin | 46243 | 78 | 0.035 | 0 – 21.2 | 1498 |
| 16 | East flowing rivers between Godavari and Krishna Basin | 10345 | 27 | 0.066 | 0 – 20.7 | 1208 |
| 17 | East flowing rivers between Krishna and Pennar Basin | 23336 | 32 | 0.019 | 0 – 26.9 | 961 |
| 18 | East flowing rivers between Pennar and Cauvery Basin | 63646 | 219 | 0.023 | 0 – 49.0 | 1154 |
| 19 | East flowing rivers South of Cauvery Basin | 38646 | 104 | 0.023 | 0 – 24.4 | 1121 |
| 20 | West flowing rivers of Kutch and Saurashtra including Luni Basin | 184441 | 133 | 0.024 | 0 – 51.5 | 616 |
2.2 Groundwater level measurement
Seasonal (during January, May, August and November, respectively) groundwater level measurement data were obtained from a dense network of groundwater observation wells (>13,000) maintained by India’s Central Ground Water Board (CGWB) between 2005 and 2013. More than 85% of these wells are located in unconfined aquifers (CGWB, 2014). The quarterly water level measurements are representing groundwater level scenario in different season such as, measurements in January and November represent post-monsoon water level, that in May represents pre-monsoon and measurement in August represent monsoon-time water level. 3907 wells were selected for this study based on their temporal continuity and seasonality.
The sign of groundwater level depths are reversed in order to represent groundwater level. Subsequently; groundwater level anomalies (GWLA) were calculated after removing long-term mean values from its individual values in each of the selected wells. In order to get time series of groundwater storage (GWS) anomaly, GWLA values were multiplied by specific yield. Aquifer specific yield (Sy) values were obtained from the CGWB database (CGWB, 2012a), which was constructed from long term pumping test results, and assigned to wells based on aquifer characteristics (Mukherjee et al., 2015) and other available information (i.e. map of aquifer systems of India) from CGWB (CGWB, 2012b). The mean Sy values ranged from 0.02 and 0.13 within the study area. The average depth to water in all the basins varies from 2 to 9 m below ground surface. The deepest groundwater table is in the Indus basin (basin 1), where lowest precipitation rate has been observed, and the shallowest is in basin 2c, where precipitation rate is found to be the highest within all the basins (Table 1).
Since the observational network is dense, we designed three additional sampling schemes to study how well spacing may affect groundwater spatial variability and also to study their scale dependency. Figure 2 shows the well locations that are used at the 0.25 degree, 0.5 degree, and 1 degree resolution, respectively. The well closest to each grid center was selected and the rest are discarded. In between three spatial resolutions, well spacing is lowest in 0.25 degree and highest in 1 degree scale. For example, considering all the wells used in our study at all the three spatial resolutions, and total geographical area, well spacing is 1 well per 1671 km2 (0.25 degree), 1 well per 4026 km2, or 1 well per 12253 km2 on average (Figure 2).
Figure 2.
Well locations used at (a) 0.25 degree, (b) 0.5 degree and (c) 1 degree resolution
2.3 Precipitation data
We used precipitation data from the archives of the Tropical Rainfall Measuring Mission (TRMM), a joint satellite mission of NASA and JAXA (Kummerow et al., 2000). In particular, the monthly gridded (0.250 × 0.250) 3B43 product, version 7, was used here. This product combines satellite retrievals with rain gauge data from Global Precipitation Climatology Centre (GPCC). To be consistent with groundwater measurements, seasonal precipitation was calculated for the four time-periods: December-January, February-May, June-August and September–November.
2.4 Scale dependency
Information on scale dependency can be useful for designing effective ground-based monitoring networks and for upscaling point measurements. Earlier studies on soil moisture (Famiglietti et al., 2008; Li and Rodell, 2013) and groundwater (Li et al., 2015), have shown that spatial variability increases as a power function of extent, which can be described as a linear function when log transformation is applied (Li et al., 2015):
| (1) |
where, σy is the spatial variability at extent λ, H and C are the slope and intercept of the linear relationship between log-(spatial variability) and log-extent, respectively.
The power law relationship can be used to estimate sampling sizes for desired accuracies in a region (river basin here) using this equation (Wang et al., 2008; Li et al., 2015):
| (2) |
where, N is the number of samples, σ is the spatial variability, d is the desired accuracy (absolute error), t21−(α/2),N−1 is the Student's t-distribution at the significance level α (5% used here). Since N is unknown initially, we used an iterative method to estimate N (Wang et al., 2008).
Combining equations 1 and 2, we obtain the following equation to calculate the samples needed for any region:
| (2) |
3 Results
3.1 Spatial mean and variability
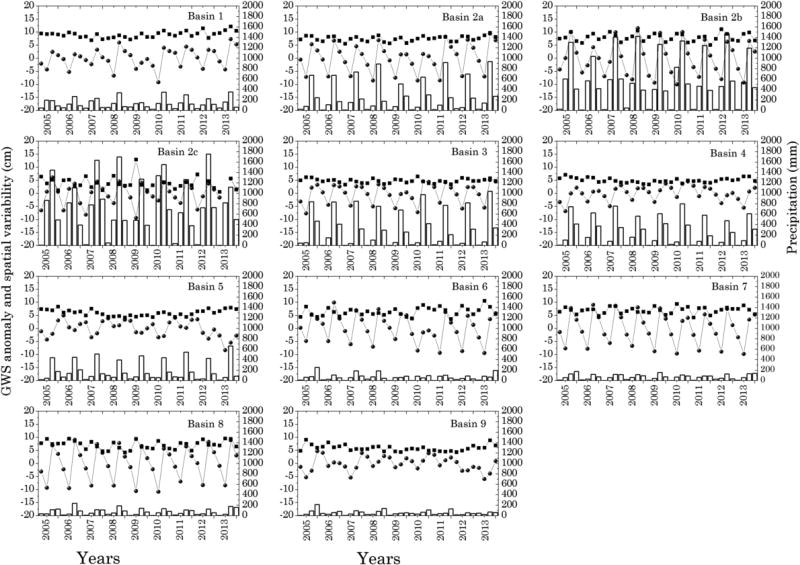
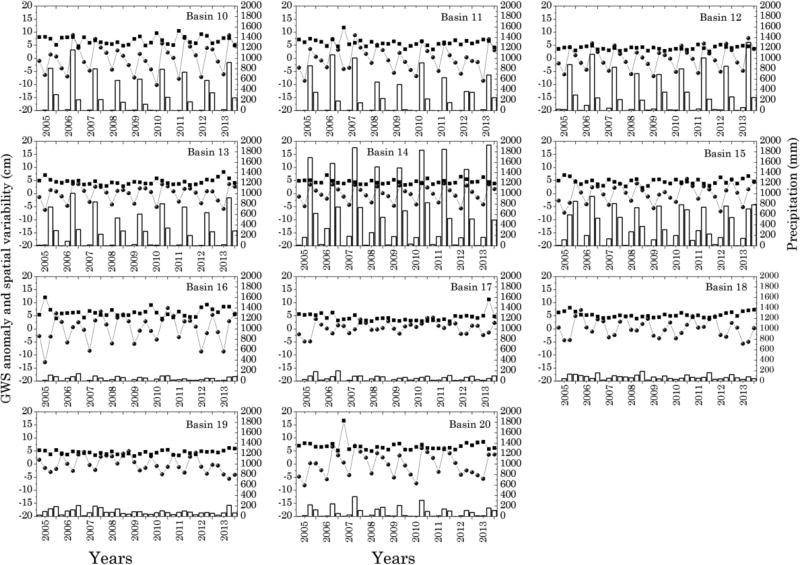
Time-series of groundwater storage anomalies, spatial variability (represented by spatial standard deviation) and precipitation are shown in Figure 3. Major parts of the northern and central India were subjected to drought in 2009–10 (NCC, 2013), consequently, GWS anomalies have also exhibited lowest values in 2009–10 (e.g., in basins 1, 2a, 2b, 3, 6, 7, 8, 10, 11, 12, and 20). India, the country as a whole (except the southern region), receives the maximum precipitation during the monsoon season (June to September) (NCC, 2013). On the other hand, the monsoon season extends to October, sometimes even to November, in the southern part of the country (NCC, 2013). The characteristics of temporal pattern of precipitation are also reflected in the seasonal GWS anomalies (Figure 3). Maximum GWS anomalies are observed during the monsoon period in basins 1, 2a, 2b, 2c, 6, 7, 8, 10, 11, 12, 13, 14, and 20, and immediately after the monsoon in basins 3, 4, 5, 9, 15, 16, and 17 that are located in the southern India. GWS minima are observed during the pre-monsoon period in all the basins.
Figure 3.
Time series of seasonal mean GWS anomaly (cm, blue filled circles), spatial variability (cm, standard deviation, black filled squares) and seasonal precipitation (mm, columns) for all the basins. The X-axis represents the seasons from 2005 to 2013 (four for each year)
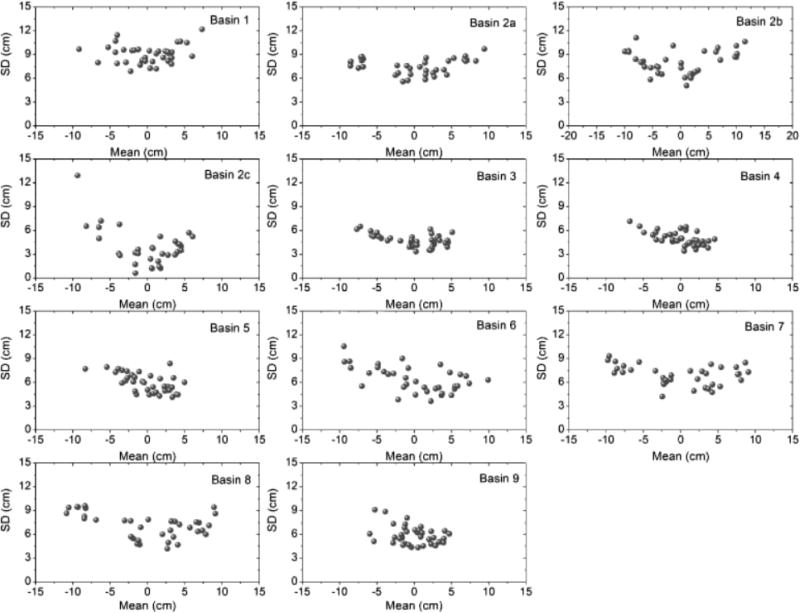
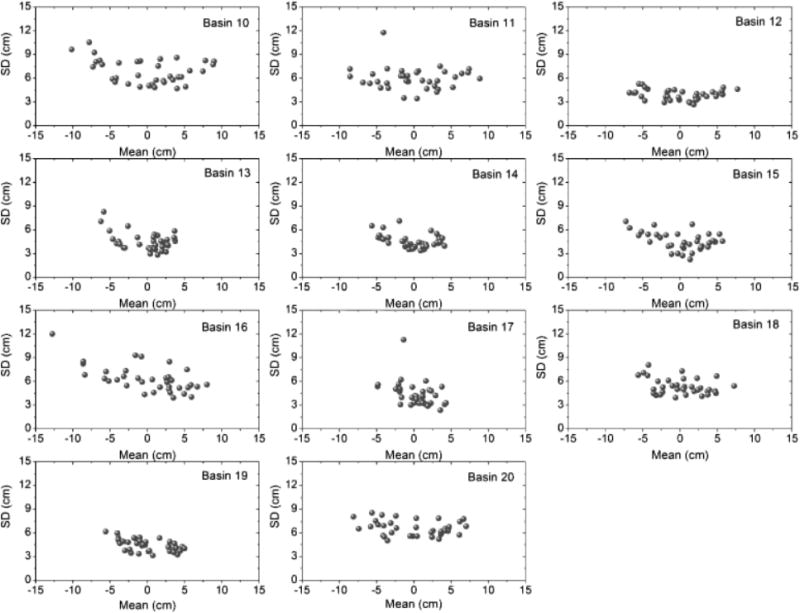
Spatial variability of GWS anomalies, in terms of standard deviation, is shown in Figure 3. The relationship between spatial variability and groundwater storage anomaly is further investigated through Figure 4. Spatial variability show increasing trend with increasing mean GWS anomaly in most of the basins, 1, 2a, 2b, 2c, 3, 4, 6, 7, 8, 10, 11, 12, 13, 15 and 20, respectively. We observe an upward concave relationship between spatial variability and mean GWS anomaly in the above mentioned basins (Figure 4).
Figure 4.
Scatter plots of spatial variability (standard deviation) vs. mean GWS anomaly for all the basins
3.2 Scale dependency
Figure 5a shows the relationship between log-(spatial variability) and log-extent for all the basins. Here the extent of each basin was estimated as the square root of the basin area (Table 1) following Famiglietti et al. (2008) and Li et al. (2015). Here, spatial variability was obtained by taking mean of all standard deviations of all seasons. Log-(spatial variability) increases linearly (significant at the 0.1 level) with the log-(extent). Some of the data points are located far away from the best fitted line. This might be a result of dynamic variability of GWS anomaly across the basins, heterogeneous aquifer hydrogeological properties, or heterogeneous patterns of groundwater usage in different basins. Influence of dynamic range differences are eliminated by computing normalized standard deviation as described by Li et al. (2015) (Figure 5a). Spatial variability was standardized using temporal standard deviations over all wells. However, we found insignificant increase with near-zero slope (0.02) in the log-log graph (Figure 5a).
Figure 5.
Logarithm of spatial mean spatial variability (standard deviation) of (a) GWS anomaly, (b) specific yield and (c) precipitation, plotted against logarithm of spatial mean extent for all the basins
The linear relationship between log-(spatial variability of specific yield) and log-extent (Figure 5b) is insignificant. However, log (spatial variability of precipitation) increases linearly (significant with p value < 0.05) with log-extent (Figure 5c). These combine results suggest that GWS spatial variability is influenced more by climate than by aquifer properties.
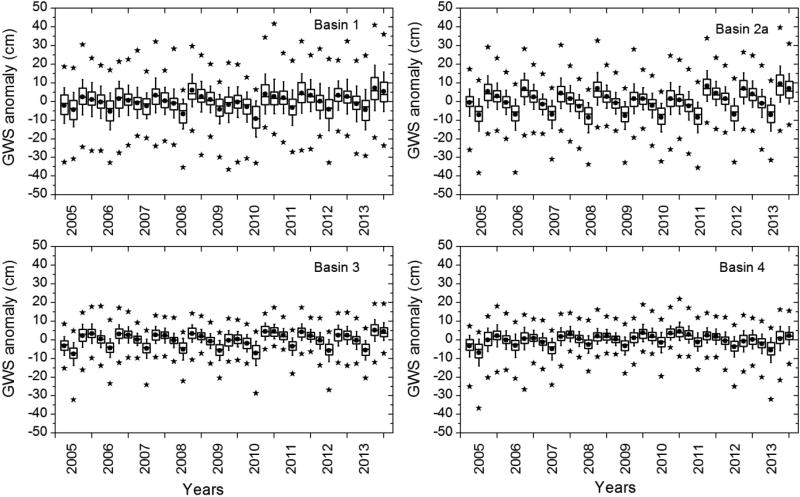
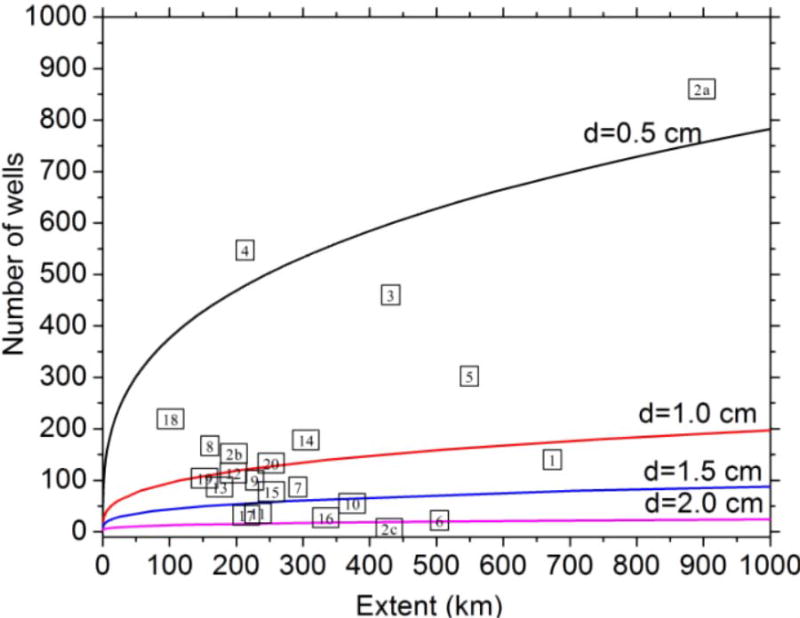
Equation 2 assumes data are normally distributed, which can be tested using the statistical properties of the data. Figure 6 shows distribution of GWS anomaly within 4 largest basins, GWS anomaly follows similar distribution in other basins. The thickness of the box indicates the inter-quartile range (25 to 75th percentile) of the data; horizontal line within the box specify median values; black filled circles inside the box shows mean values; upper and lower limits of whisker indicate ±1 σ deviation from the mean; top and down black filled stars showing 99% and 1% data, respectively. In general, we observe characteristics of normal distribution in GWS anomaly in all the basins: mean and median GWS anomaly values closely follow each other (Figure 6); the inter-quartile range (50% of the data lies between 25% and 75%) is well within 1-σ values (Figure 6). The solutions of Equation (3), for different levels of accuracy, are plotted in Figure 7. The number of wells increase with increasing extent for an absolute error level. The number of wells used within each studied basin vs. their extent are also plotted. It is found that the absolute error level is smallest (less than 0.5 cm) in basins 2a and 4, which contains comparatively higher number of wells, and largest (more than 2.0 cm) in basin 2c, which contains only six wells. 9 basins (basin 2a, 2b, 3, 4, 5, 8, 14, 18, and 20) exhibit absolute error levels less than 1 cm. Absolute error levels of the basins studied here were lower than those of the regions studied by Li et al. (2015) due to the greater density of CGWB’s Indian groundwater level network.
Figure 6.
Box-Whisker plot of GWS anomaly for all the seasons at 4 largest basins. The extent of the box indicates the inter-quartile range (25 to 75th percentile) of the data; horizontal line within the box specify median values; black filled circles inside the box show mean values; upper and lower limits of whisker indicate ±1 σ deviation from the mean; top and down black filled stars showing 99% and 1% data, respectively
Figure 7.
Number of wells required to represent the spatial mean at four different absolute error level as a function of their extent. The number within the squares indicating basin numbers (Table 1) corresponding to their extent and number of wells
4 Discussions
4.1 Spatial variability in groundwater storage anomaly
Spatial variability of GWS anomalies can be attributed to several factors including non-uniformities of precipitation, groundwater withdrawals, hydrogeological properties, and groundwater discharge. Temporal variability of GWS anomalies is linked with seasonal precipitation and subsequent hydrological processes (Li et al., 2015). We observed an upward concave relationship between spatial variability and mean GWS anomaly (also observed by Li et al., 2015), unlike the upward convex relationship observed in soil-moisture studies (Owe et al., 1982; Famiglietti et al., 2008; Rosenbaum et al., 2012). Although soil physical processes control the convexity of the standard deviation vs. mean soil moisture curve, the lower and upper bounds of the curve are entirely dependent upon the saturation capacity of the soil, which will show less variation once it reaches its limit (Li and Rodell, 2013). On the other hand, unconfined groundwater storage rarely has any hard limits and hence, GWS variability is not restricted to any boundary conditions (Li et al., 2015). As the magnitude of GWS is highly variable in space, spatial variability is more likely to be higher during GWS extremes (Li et al., 2015).
The upward concave relationship is less obvious or non-existent in certain basins (e.g., 5, 17, 19). In those basins the mean GWS anomaly rarely exceeded a magnitude of 5 cm, which is when the increase in standard deviation became evident in other basins. These smaller anomalies may be explained by the fact that, in southern India, moderate rainfall occurs during the post-monsoon period unlike the other parts of the country. As a result, GWS is less variable throughout the year in southern India.
Observation of very small insignificant slope in the log-log graph of normalized standard deviation vs. extent, suggesting climate-related temporal variability of groundwater is the dominant factor controlling differences in spatial variability in India. Normalized standard deviation reflects the difference in the seasonal variation of groundwater storage anomalies at different wells. As the data were sampled at only four times a year, the temporal variation of the seasonality was not well captured. On the other hand, groundwater storage may indeed vary in strong synchronization due to the impact of monsoons in most regions. Groundwater spatial variability in India may be strongly influenced by climate (such as annual precipitation) than by other factors such as natural groundwater discharge etc.
4.2 Effect of well spacing across different spatial scales
To investigate the effect of different sampling spacing on the scale dependency, we plotted the logarithm of spatial variability against logarithm of extent for the three sampling schemes mentioned earlier (Figure 8). Statistically significant (p values < 0.05) increasing linear relationship has been observed between logarithm of spatial variability against logarithm of extent similar to that derived based on all data (all the wells present within each basin are used, no spatial scaling are done). The slope of linear relationship increases with decreasing well spacing (Table 2), similar to observation of Li and Rodell (2013) for soil moisture observations. Thus, spatial variability increases rapidly with increasing extent for increasing well spacing. Hence, the effect of change in extent on spatial variability has been reduced with increasing spatial scales, as we observed very large change in spatial variability for smaller change in extent at larger well spacing i.e. data at 1 degree-scale (Figure 8c).
Figure 8.
Logarithm of spatial mean spatial variability (standard deviation) of GWS anomaly plotted against logarithm of spatial mean extent for all the basins at (a) 0.25 degree, (b) 0.5 degree and (c) 1 degree-scale
Table 2.
Slope and intercept values obtained from fitting the log-extent and log-(spatial variability) following equation 1. All the data are statistically significant at 10% level
| Slope (H) | Intercept (C) | |
|---|---|---|
| All data | 0.16 | 0.86 |
| 0.25 d | 0.22 | 0.48 |
| 0.5 d | 0.52 | −1.33 |
| 1 d | 0.72 | −2.67 |
Slope and intercept values (Table 2) at 0.25, 0.5 and 1 degree-scale, were further used in Equation (3), subsequently, the solutions are plotted in Figure 9. The number of representative wells required to maintain a good groundwater monitoring network has been increasing with increasing spatial extent in a particular absolute error level for all the spatial scales. The number of wells (Table 1) used in different spatial scale for each basin against their extent are also plotted in Figure 9. The number of wells are decreasing with increasing spatial scale i.e. between 0.25 and 1 degree; highest number of wells were used in 0.25 degree-scale comparing all the scales. Slope and intercept obtained through Figure 9, are mainly used for calculation of absolute error levels using Equation (3). The absolute errors at 0.25 degree-scale closely matches with that for all data (Figure 7 and 9a). Similar to absolute errors for all data, only one basin (basin 2c) exhibit more than 2 cm absolute error, and 8 basins (out of 9 basins for all data) show errors less than 1 cm. Absolute error level increases at 0.5 degree-scale (absolute error level higher than 2 cm in 6 basins) and showing highest values at 1 degree-scale (absolute error level higher than 2 cm in 12 basins) (Figure 9b and 9c). Only one basin (basin 4) exhibit absolute error level less than 1.5 cm and 9 other basins exhibit less than 2 cm absolute error levels at 1 degree-scale (Figure 9c). We found an increase in absolute error level with increasing spatial scales, i.e., from 0.25 degree to 1 degree.
Figure 9.
Number of wells required to represent the spatial mean at four different absolute error level as a function of their extent at (a) 0.25 degree, (b) 0.5 degree and (c) 1 degree-scale. The number within the squares indicating basin numbers (Table 1) corresponding to their extent and number of wells
Among the three different spatial scales (e.g., 0.25 degree, 0.5 degree and 1 degree-scale), mean GWS anomaly at 0.25 degree spatial scale matches closely with mean values in all wells and the distant matches has been observed at 1 degree-scale. The absolute error in GWS anomaly also increases with increasing spatial scales (Figure 7 and 9). Although the desired accuracy level depends on end-user's application, we recommend using finest available spatial-scale for validating satellite retrievals, model validation etc.
4.3 Designing cost-effective groundwater monitoring network
The output of this study can be used to design a cost-effective groundwater monitoring network within the study area. The end-user could pre-select the optimum error level and use our data to compute the minimum number of wells required to reach the accuracy level in the study area. For example, assuming the end-user want to keep the absolute error level within 2 cm, they could only select the wells used for 1 degree well spacing (Figure 2c) in basins, 2a, 2b, 3, 4, 8, 12, 13, 14, 18, and 20 (Figure 9c). This will largely reduce the maintenance cost for establishing a well-defined groundwater monitoring network. This approach could also be applied in different parts of the globe.
5 Conclusions
We used seasonal groundwater level measurements at 3907 wells located in 22 major river basins in India to study spatio-temporal variability of groundwater storage (GWS) anomalies. Three distinct spatial scales were used to examine the effects of well spacing on the mean and variability of GWS anomalies. Our key findings include:
Spatial variability of groundwater storage anomalies are influenced by well spacing.
Spatial variability of GWS anomalies increases with increasing spatial extent at all spatial scales i.e. 0.25, 0.5 and 1 degree.
The output of this study could be used to design cost-effective groundwater monitoring network in the study region.
A positive linear relationship does exist between the logarithm of GWS anomaly and the logarithm of spatial extent.
Spatial variability of GWS anomaly increases during the wettest (monsoon) and driest (pre-monsoon) periods of the year in most of the regions.
Our study indicates that the uncertainty in regional GWS anomaly estimates based on data from the CGWB’s well network is relatively low, owing to the high density of observations in that network. Results of this study confirm previously inferred scaling behaviors of groundwater storage in the central and eastern U.S. (Li et al., 2015), demonstrating that those behaviors hold true in a region with a different climate and hydrogeology and with a vastly increased sampling density. These data could also be useful for validating satellite-based and model-based estimates of groundwater variability in India and other regions with similar climatic and hydrogeologic features.
Highlights.
3907 in-situ groundwater observation wells are used to compute spatial variability
First study of spatial variability of groundwater storage affected by well spacing
Spatial variability of groundwater storage increases with increasing spatial extent
The output could be used to design cost-effective groundwater monitoring network
Log-linear relationship exists between groundwater spatial variability and extent
Acknowledgments
Acknowledgments and Data
SNB acknowledges CSIR (Government of India) for their support for providing the SPM fellowship. SNB also acknowledges U.S. Department of State for the Fulbright fellowship. We acknowledge CGWB, India and TRMM satellite mission for providing water level data and precipitation data, respectively. SNB thanks Dr. S. Verma for her advice.
References
- Bhanja SN, Mukherjee A, Saha D, Velicogna I, Famiglietti JF. Validation of GRACE based groundwater storage anomaly using in-situ groundwater level measurements in India. J. Hydrol. 2016 (In-Press) [Google Scholar]
- Brocca L, Tullo T, Melone F, Moramarco T, Morbidelli R. Catchment scale soil moisture spatial–temporal variability. J. Hydrol. 2012;422:63–75. [Google Scholar]
- Central Ground Water Board (CGWB), G. o. I., Ministry of Water Resources. Ground Water Year Book – India 2011–12. 2012a:42. [Google Scholar]
- Central Ground Water Board (CGWB), G. o. I., Ministry of Water Resources. Aquifer systems of India. 2012b:92. [Google Scholar]
- Central Ground Water Board (CGWB), G. o. I., Ministry of Water Resources. Ground Water Year Book – India 2013–14. 2014:76. [Google Scholar]
- Famiglietti JS, Rodell M. Water in the Balance. Science. 2013;340(6138):1300–1301. doi: 10.1126/science.1236460. [DOI] [PubMed] [Google Scholar]
- Famiglietti JS, Ryu D, Berg AA, Rodell M, Jackson TJ. Field observations of soil moisture variability across scales. Water Resour. Res. 2008;44:W01423. [Google Scholar]
- India-WRIS, River Basin Atlas of India. RRSC-West, NRSC, ISRO; Jodhpur: 2012. [Google Scholar]
- Kummerow C, et al. The status of the Tropical Rainfall Measuring Mission (TRMM) after two years in orbit. J. Appl. Meteorol. 2000;39:1965–1982. [Google Scholar]
- Li B, Rodell M. Spatial variability and its scale dependency of observed and modeled soil moisture over different climate regions. Hydrol. Earth Syst. Sci. 2013;17:1177–1188. [Google Scholar]
- Li B, Rodell M, Famiglietti JS. Groundwater variability across temporal and spatial scales in the central and northeastern US. J. Hydrol. 2015;525:769–780. [Google Scholar]
- Mukherjee A, Saha D, Harvey CF, Taylor RG, Ahmed KM, Bhanja SN. Groundwater systems of the Indian Sub-Continent. J. Hydrol.: Regional Studies. 2015;4:1–14. [Google Scholar]
- National Climate Centre (NCC), India Meteorological Department. Monsoon report 2012. 2013:193. [Google Scholar]
- Owe J, Jones EB, Schmugge TJ. Soil moisture variation patterns observed in Hand County. South Dakota, Water Resour. Bull. 1982;18:949–954. [Google Scholar]
- Richey AS, Thomas BF, Lo M-H, Famiglietti JS, Reager JT, Voss K, Swenson S, Rodell M. Quantifying renewable groundwater stress with GRACE. Wat. Resour. Res. 2015;51:5217–5238. doi: 10.1002/2015WR017349. [DOI] [PMC free article] [PubMed] [Google Scholar]
- Rodell M, Chen J, Kato H, Famiglietti JS, Nigro J, Wilson CR. Estimating groundwater storage changes in the Mississippi River basin (USA) using GRACE. Hydrogeology Journal. 2007;15:159–166. doi: 10.1007/s10040-006-0103-7. [DOI] [Google Scholar]
- Rodell M, Velicogna I, Famiglietti JS. Satellite-based estimates of groundwater depletion in India. Nature. 2009;460:999–1002. doi: 10.1038/nature08238. [DOI] [PubMed] [Google Scholar]
- Rosenbaum U, Bogena H, Herbst M, Huisman JA, Peterson TJ, Weuthen A, Vereecken H. Seasonal and event dynamics of spatial soil moisture patterns at the small catchment scale. Water Resour. Res. 2012;48 [Google Scholar]
- Siebert S, Burke J, Faures JM, Frenken K, Hoogeveen J, Döll P, Portmann FT. Groundwater use for irrigation–a global inventory. Hydrology and Earth System Sciences. 2010;14:1863–1880. [Google Scholar]
- Taylor RG, et al. Ground water and climate change. Nature Climate Change. 2013;3(4):322–329. [Google Scholar]
- Voss KA, Famiglietti JS, Lo M, Linage C, de, Rodell M, Swenson SC. Groundwater depletion in the Middle East from GRACE with implications for transboundary water management in the Tigris-Euphrates-Western Iran region. Water Resour. Res. 2013;49 doi: 10.1002/wrcr.20078. [DOI] [PMC free article] [PubMed] [Google Scholar]
- Wada Y, van Beek LP, van Kempen CM, Reckman JW, Vasak S, Bierkens MF. Global depletion of groundwater resources. Geophys.res.lett. 2010;37(20) [Google Scholar]
- Wang C, Zuo Q, Zhang R. Estimating the necessary sampling size of surface soil moisture at different scales using a random combination method. J. Hydrol. 2008;352:309–321. [Google Scholar]
- [accessed 20 Jan, 2015];World Bank Archive (WBA) 2015 http://data.worldbank.org/indicator/AG.LND.PRCP.MM.
- Western AW, Blösch G. On the spatial scaling of soil moisture. J. Hydrol. 1999;217:203–224. [Google Scholar]
- Zaitchik BF, Rodell M, Reichle RH. Assimilation of GRACE terrestrial water storage data into a land surface model: results for the Mississippi river basin. J. Hydrometeorol. 2008;9:535–548. [Google Scholar]


