

Abstract
Purpose
The osteocyte exerts important effects on bone remodeling but its rhythmicity and effect on the rhythms of other bone cells are not fully characterized. The purpose of this study was to determine if serum sclerostin displays rhythmicity over a 24-hour (h) interval, similar to that of other bone biomarkers.
Methods
Serum sclerostin, FGF-23, CTX, and P1NP were measured every 2 hours over a 24-h interval on 10 healthy men aged 20-65 years. Maximum likelihood estimates of the parameters in a repeated measures model were used to determine if these biomarkers displayed a diurnal, sinusoidal rhythm.
Results
No discernible 24-h rhythm was identified for sclerostin (p = 0.99) or P1NP (p = 0.65). CTX rhythmicity was confirmed (p < 0.001), peaking at 05:30 (range 01:30–07:30). FGF-23 levels were also rhythmic (p < 0.001) but time of peak was variable (range 02:30-11:30). The only significant association identified between these four bone biomarkers was for CTX and P1NP mean 24-h metabolite levels (r = 0.65, p = 0.04).
Conclusions
Sclerostin levels do not appear to be rhythmic in men. This suggests that in contrast to CTX, serum sclerostin could be measured at any time of day. The 24-h profiles of FGF-23 suggest that a component of osteocyte function is rhythmic but its timing is variable. Our results do not support the hypothesis that osteocytes direct the rhythmicity of other bone turnover markers (CTX), at least not via a sclerostin mediated mechanism.
Keywords: sleep, circadian rhythm, diurnal rhythm, bone remodeling, sclerostin, osteocyte
Introduction
Osteoblasts and osteoclasts display daily patterns with circulating markers of bone resorption and, to a lesser extent, bone formation (i.e., osteocalcin), peaking in the early morning with a nadir in the late afternoon [1,2]. Daily patterns are likely important for normal bone remodeling, but may differ between bone cells. For example, the rhythm of the bone resorption marker serum C-terminal cross-linked telopeptide of type I collagen (CTX) is influenced by food intake (possibly mediated by endocrine and nutritional signals such as glucagon-like peptide 2, GLP-2) [1,3,4], while food has little influence on the less pronounced rhythm of bone formation markers [4]. Overall, bone turnover marker (BTM) rhythmicity in humans appears to be largely independent of posture [1], sex [1], and normal light/dark cycles [4], and therefore may reflect internal circadian rhythmicity.
Although the osteocyte has been described as the “orchestrator” of bone remodeling [5], it’s role in the daily rhythmicity of other BTMs is uncertain. Osteocytes regulate bone resorption and bone formation via paracrine and endocrine effects on osteoclasts and osteoblasts [5]. Therefore, it is possible that the osteocyte and its secreted protein sclerostin also display a physiologically important rhythm that “orchestrates” or influences the rhythmicity of other bone cells. Osteocytes secrete fibroblast growth factor 23 (FGF-23) and sclerostin to regulate phosphate/vitamin D metabolism and bone turnover. Intact FGF-23 levels demonstrate diurnal variation, peaking in the early morning [6,7]. However, the rhythmicity of sclerostin, and therefore the osteocyte, remains incompletely characterized, as does the osteocyte’s role in the rhythms of other bone cell physiology. Understanding the role of the osteocyte and sclerostin in the generation of bone remodeling rhythms is key to understanding the biology of bone turnover rhythmicity and how circadian perturbations (i.e. shift work, jet lag) could lead to metabolic bone disease.
We sought to determine whether a 24-hour (h), diurnal rhythm exists for sclerostin, a marker of osteocyte function, and if so, how that rhythm relates to the 24-h rhythms of other biomarkers of bone metabolism [CTX, N-terminal propeptide of type I procollagen (P1NP), FGF-23].
Methods
Study Participants and Study Design/Experimental Protocol
For this observational study, frozen serum samples from a previous prospectively performed experiment were used. As reported by our group [8] and Buxton et al [9], 11 healthy, adult men, aged 20-65 years were recruited. Participants were admitted to the Intensive Physiological Monitoring Unit of the Center for Clinical Investigation at Brigham and Women’s Hospital between 2007-2010. A ≥ 21-day at home run-in stage of 10-h sleep opportunity per night (verified by wrist actigraphy, sleep diary, and timestamped call-ins) in addition to ≥10 h/day sleep opportunity for three days in the lab prior to sampling ensured that individuals were fully sleep satiated at the time of sampling (see Fig 1 study protocol; adapted from Buxton et al [9]). Serum used for this study was obtained hourly (including during sleep) across a baseline 24-h interval on days 5 to 6 from an intravenous catheter. Participants received an isocaloric, controlled nutrient diet (55-60% carbohydrate, 15-20% protein, 15-30% fat) composed of 3 meals/1 snack and ≥2.5 liters of fluid per 24 h. Wake time was spent in constant dim light (<15 lux) and sleep opportunities in constant darkness (<0.02 lux).
Fig 1. Study Protocol.
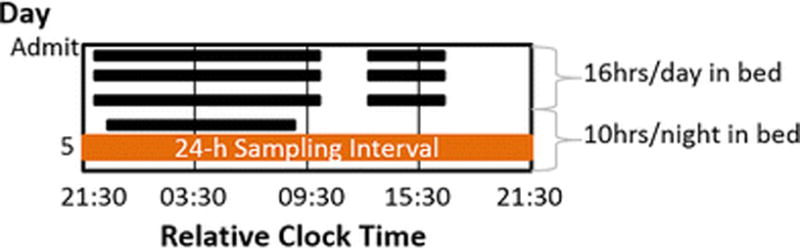
Black bars depict sleep opportunities. Participants were admitted following a ≥ 21-day at-home baseline stage of 10-h sleep opportunity per night. To further ensure participants were fully sleep satiated at time of sampling (horizontal orange bar), in-lab sleep opportunities were as follows: Days 1-3: 12 h/night; Days 2-4: an additional 4-h nap in the middle of the day; Day 4-6: 10 h/night. All clock times are presented as 24-h military time relative to breakfast, which occurred, on average, at 09:27 (SD 3 min). Figure adapted from Buxton et al STM 2012 [9].
Ten men with available serum were used for the current study (one man was excluded for an incomplete 24-h serum profile). Self-reported race/ethnicity were as follows: White/not Hispanic or Latino n = 7, White/Hispanic n = 2, Asian & White/not Hispanic or Latino n=1. All participants were normal sleepers as verified with a polysomnographically recorded adaptation night and questionnaires [9]. Since individual bed times varied, laboratory sleep opportunities and blood sampling were performed relative to the midpoint of the habitual sleep opportunity in order to align participants’ collections relative to sleep/wake and light/dark cycles. Core body temperature minimum, a robust measure of circadian phase, reflected excellent subsequent alignment of the ten profiles (all ten men varied within a 40-minute interval; older men varied within 16-minutes). Times presented here are in “relative clock hour” using 24-h military time with time relative to breakfast (average breakfast time = 09:27, SD 3 min).
All participants [9] provided written informed consent. All procedures were approved by the Partners Human Research Committee and were conducted in accordance with the Declaration of Helsinki. The current analyses were performed at OHSU using de-identified samples, were deemed non-human subjects research by OHSU IRB# 00010357, and were approved by Brigham and Women’s Hospital IRB.
Assays
Assays were performed on samples from every other hour (q2 h samples) for each participant, as this was frequent enough to provide adequate determination of a rhythm, if present. If a sample from the preferred hour was missing, a sample from the adjacent hour was used, which was necessary in approximately 15% of samples. Assays were performed at the Oregon Clinical and Translational Research Institute (OCTRI) laboratory at Oregon Health & Science University (OHSU) in 2015. Each individual’s samples were run in the same assay to minimize inter-assay variability. Serum sclerostin levels were measured in duplicate on previously unthawed samples stored below −80°C until assay by ELISA (ALPCO/Biomedica, Salem, NH). Interassay coefficient of variation (CV) was 7.5% at 60.9 pmol/L. Intra-assay CV was 7% at 33.6 pmol/L and 5% at 118.8 pmol/L. FGF-23 was measured immunometrically (Kainos Laboratory, Tokyo, Japan) in serum that had undergone one freeze/thaw cycle. Interassay CV was 4.9% at 48.4 pg/mL. Intra-assay CV was 3% at 14.2 pg/mL and 2.8% at 28.7 pg/mL. The intact trimer of P1NP was measured by immunoassay (Orion Diagnostica, Finland) in duplicate on serum that had undergone one freeze/thaw cycle. Interassay CV was 2.1% at 38.3 μg/L and 3.0% at 118 μg/L. Intra-assay CV was 5.4% at 23.6 μg/L, 3.2% at 33.1 μg/L, 5.4% at 53.1 μg/L, and 9.6% at 149.2 μg/L. CTX was measured by ELISA (Immunodiagnostic Systems, United Kingdom) on serum that had undergone one freeze/thaw cycle. Interassay CV was 15.7% at 0.18 ng/mL and 12.7% at 0.87 ng/mL. Intra-assay CV was 3% at 0.121 ng/mL, 1.7% at 0.444 ng/mL, and 1.8% at 1.96 ng/mL. All intra-assay CVs are as reported per manufacturers’ specifications. Values were averaged to obtain a final result for the biomarkers measured in duplicate (sclerostin, P1NP).
Statistical Analysis
The primary objective of this study was to determine the presence/absence of diurnal rhythmicity in sclerostin. To this end, we fit a cosinor model [10] controlling for age. Secondary outcomes were to evaluate metabolite associations and to confirm the presence/absence of rhythmicity for the other bone biomarkers, as internal validation of study conditions. No adjustments were made for multiple comparisons because these analyses were intended to be hypothesis generating.
Maximum likelihood (ML) estimates of the parameters in a repeated measures analysis were used to determine if a metabolite displayed a diurnal, sinusoidal rhythm with one or two harmonics, conditioned on age (Equation 1).
| Equation 1 |
where c1=cos((h*2*π)/24) and s1=sin((h*2* π)/24) estimate the first harmonic, c2=cos((h*2*π)/12) and s2=sin((h*2* π)/12) estimate the second harmonic, h is the hour, AGE is an indicator variable for older vs. younger men, M is the mesor (midline statistic of rhythm), and β and γ are the parameters that estimate the amplitude ((β2 + γ2)1/2) and acrophase (arctan(γ/β)) for each harmonic in the cosinor model. “Harmonic” refers to the number of oscillations in the 24-h interval, the fundamental period for circadian rhythm. The first harmonic has period = 24, frequency = 1/24; the second harmonic has period = 12, frequency = 1/12 [10].
After visually inspecting the raw data at the individual and group levels, parameters were estimated at the group level to determine rhythmicity; that is, to estimate the joint significance of the parameters β1 and γ1 and β2 and γ2 in equation 1. Rhythmicity, or significance of each harmonic for each metabolite was tested using the joint null hypothesis Ho: β = γ = 0 [10]. The power of ML repeated measures approach (performed using PROC MIXED in SAS) lies in its ability to incorporate all available longitudinal data even in the unbalanced case, that is, when some observations are missing. This procedure allows for the specification of an error structure to accommodate unevenly spaced observations.
The presence of a pattern in a metabolite’s daily peak was also tested by estimating the time of maximum observed level using the by individual option in the estimation for equation 1 for rhythmic metabolites and applying the Rao test [11] for equal spacing along the circumference of a circle (analyzed using R [12] and plotted using Microsoft Excel).
Peak, nadir, mesor, and amplitude (± standard deviation) for metabolites with confirmed rhythmicity were estimated using the model described by equation 1, retaining the second harmonic and age if significant (p < 0.05). The nadir and peak/acrophase represent the minimum and maximum metabolite level on the regression curve, respectively. Amplitude is defined as half the distance between the nadir and peak. Mesor is the average biomarker level over 24 h for bone biomarkers displaying a 24-h rhythm. A mean level is noted for non-rhythmic biomarkers.
Spearman’s correlation coefficients were used to test the association between mean 24-h metabolite levels (all) and peak levels (for rhythmic metabolites). Spearman’s was chosen over Pearson correlation because the analysis was performed for N = 10 individuals.
Except where noted, all analyses were conducted using SAS software version 9.3 (SAS Institute Inc., Cary, NC, USA). Figures were generated using GraphPad Prism 7.02 (GraphPad Software, La Jolla, CA), Microsoft Excel 2016, and Adobe Photoshop CC 2017.
Results
The 10 participants included 6 younger (20-27 years, mean 23.5 years) and 4 older (55-65 years, mean 58.75 years) healthy men. All 24-h diurnal profile parameters from the cosinor model fit are presented in Table 1. Fig 2a-d displays 24-h serum profile data for each of the 4 biomarkers (see Fig 2 Legend).
Table 1.
Results for cosinor model. Except where noted, data are presented as estimate ± SEE. Times presented here are in “relative clock hour” using 24-h military time with time relative to breakfast (average breakfast time = 09:27, SD 3 min).
| CTX (controlled for age) |
Sclerostin (controlled for age) |
P1NP (controlled for age) |
FGF-23 | ||
|---|---|---|---|---|---|
| Mean 24-h metabolite level (Mesor for rhythmic metabolites) |
Older | 0.42 ± 0.15 ng/mL | 39.95 ± 4.18 pmol/L | 52.18 ± 7.69 μg/L | 37.32 ± 2.14 pg/mL |
| Younger | 0.89 ± 0.10 ng/mL | 23.77 ± 2.70 pmol/L | 73.35 ± 4.96 μg/L | ||
| Amplitude | 1st Harmonic | 0.25 ± 0.05 ng/mL | N/A | N/A | 3.31 ± 1.20 pg/mL |
| 2nd Harmonic | 0.14 ± 0.03 ng/mL | ||||
| Acrophase (Range) | 05:30 (01:30 – 07:30) | N/A | N/A | 08:30 (02:30 – 11:30) | |
| Nadir | 13:30 | N/A | N/A | 20:30 | |
| Joint test Ho: β = γ = 0 | Reject HO p<0.001 | Fail to Reject HO p=0.99 | Fail to Reject HO p=0.65 | Reject HO p<0.001 | |
Fig 2. a-d 24-h serum profiles of (a) Sclerostin (b) CTX, (c) P1NP, and (d) FGF-23.
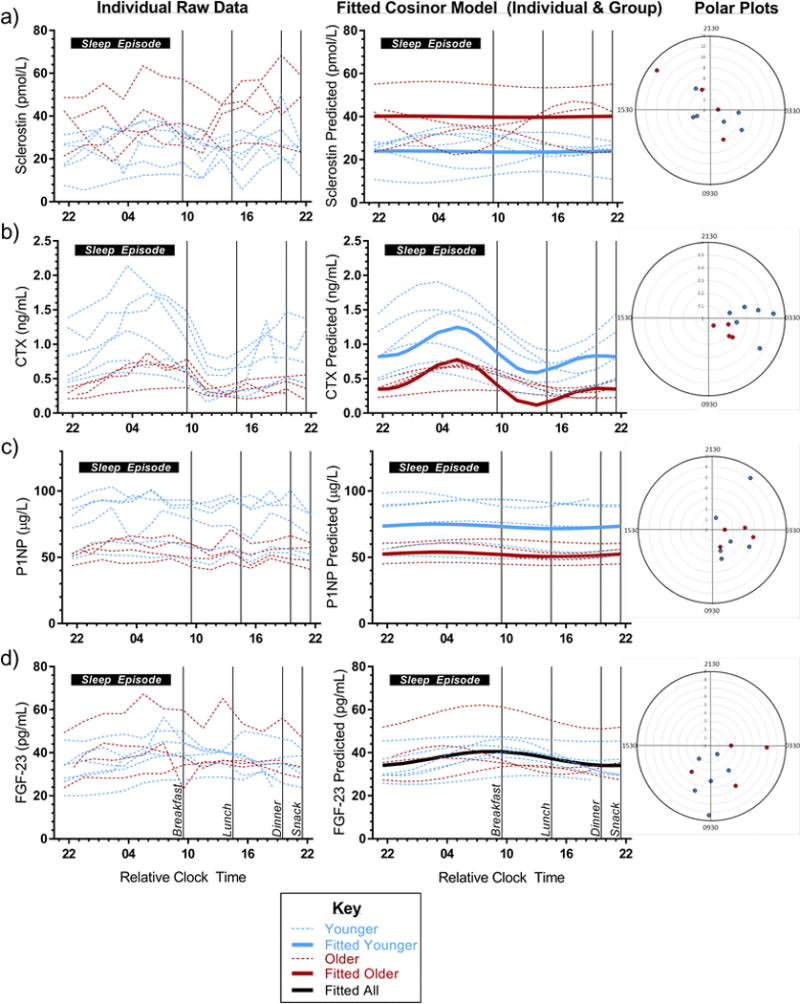
For each biomarker, the left panel shows raw data for each individual’s 24-h serum profile (n = 10); the middle panel shows the fitted cosinor model for each individual (dotted) and for the group (solid) by age (older [dark red] vs. younger [light blue]; whole group in black for FGF-23 since there was no difference by age); right panel displays Polar plots displaying the time of biomarker peak for each of the 10 individuals with red/blue to depict older/younger age group, respectively, and distance from the center representing 24-h amplitude for the individual. In the graphs in left and middle panels, 10-h sleep opportunity is represented as a horizontal black bar along the top of each graph and meal times are depicted by thin black vertical lines. Cosinor analysis and Rao spacing test are two different assessments of rhythmicity using a 24-h profile and one time point, respectively. Polar plots analyzed with Rao Spacing Test to assess clustering of peaks against the null hypothesis of peaks being evenly spaced along the circumference of the circle (representing 24-h). X-axis is in “Relative Clock Time” presented as 2-digit military time in hours relative to breakfast, which occurred, on average, at 09:27 (SD 3 min). No sinusoidal rhythm was identified in sclerostin (p = 0.99 for cosinor model, p > 0.10 for Rao spacing test). Cosinor model did not identify a significant rhythm in P1NP (p = 0.65), however Rao spacing test suggested time of peak was significantly clustered (p < 0.01). A significant rhythm was present in CTX and FGF-23 (both p < 0.001 in cosinor model). Visually, a clear peak and nadir can be seen for CTX even in the individuals’ raw data (left panel). No such rhythm can be seen in sclerostin. Younger men appear to have a greater amplitude and variability in CTX than older men but this was not statistically different (both p > 0.07). It can be appreciated visually in the fitted data (middle panel) that CTX has a greater amplitude than FGF-23. Similarly, as seen in all three panels, the acrophase, or time of peak level for FGF-23 is more variable than that of CTX (p for Rao spacing test p < 0.10 vs. p < 0.001, respectively).
No discernible rhythm was identified for serum sclerostin over 24 hours (Table 1, Fig 2a; p = 0.99 for Ho:β=γ=0 conditioned on age). Mean sclerostin values were higher in the older compared to the younger men (meanolder = 39.95 ± 4.18 pmol/L vs. meanyounger = 23.77 ± 2.70 pmol/L, p = 0.005; Fig 2a).
CTX displayed the most robust rhythm (Fig 2b) with a peak occurring at 05:30 (range 01:30–07:30) and a nadir at 13:30 (p <0.001 for Ho: β = γ = 0 on both harmonics; relative clock time; Rao spacing test p < 0.001). The best fit for CTX was a 2-harmonic model adjusted for age. A sinusoidal rhythm was consistently seen in all individuals in raw and fitted data (Fig 2b). Visually, CTX amplitude appeared larger in younger compared to older men (Fig 2b), but this difference was not statistically significant (p > 0.07). The clear sinusoidal rhythm of CTX is in contrast to the relatively flat 24-h serum P1NP profile (p = 0.65 for Ho:β=γ=0 in the cosinor model conditioned on age; Fig 2c). However, Rao spacing test for P1NP in polar plot suggested time of peaks were significantly clustered (p< 0.01), and a very small amplitude sinusoidal curve can be seen visually in the fitted curve when the y-axis has a smaller range (Online Resource Fig 1). CTX and P1NP levels were higher in the younger, compared to older men (CTX mesoryounger = 0.89 ± 0.10 ng/mL vs. CTX mesorolder = 0.42 ± 0.15 ng/mL, p = 0.01; P1NP meanyounger = 73.35 ± 4.96 μg/L vs. P1NP meanolder = 52.18 ± 7.69 μg/L; p = 0.03).
FGF-23 was rhythmic (p<0.001), best fit with one harmonic and no adjustment for age (Fig 2d). The estimated acrophase was approximately 08:30 (relative clock time) and the nadir occurred at 20:30. There was more variation in the time of FGF-23 peak between individuals (range 02:30-11:30) compared to that of CTX as seen in the polar plots in Fig 2 (right panel) and as suggested by the corresponding p-values (p < 0.001 for CTX vs. p < 0.10 for FGF-23 by Rao spacing test). Unlike the other bone biomarkers in this study, FGF-23 levels did not vary by age (mesor 37.32 ± 2.14 pg/mL).
Mean levels of CTX and P1NP were correlated (r = 0.65, p = 0.04). There were no other significant correlations between maximum or 24-h mean values of the metabolites (Table 2).
Table 2.
Spearman correlations between mean 24-h metabolite levels (all) and peak metabolite levels (for rhythmic metabolites - CTX, FGF-23). Data are presented as correlation coefficient, r (p-value).
| CTX | Sclerostin | P1NP | FGF-23 | FGF-23peak | |
|---|---|---|---|---|---|
| CTX | 1 | −0.25 (0.49) | 0.65 (0.04) | −0.10 (0.77) | N/A |
| Sclerostin | – | 1 | −0.07 (0.85) | 0.33 (0.35) | N/A |
| P1NP | – | – | 1 | −0.01 (0.99) | N/A |
| CTXpeak | N/A | N/A | N/A | N/A | 0.02 (0.96) |
Discussion
Establishing the 24-h profile of serum sclerostin in relation to other bone biomarkers fills a knowledge gap in our understanding of the drivers of normal bone remodeling rhythms and how circadian disturbances could alter bone health. In this group of healthy men we found no significant 24-h rhythm in sclerostin. We verified the previously reported, robust sinusoidal rhythm of CTX, but found no evidence that sclerostin orchestrates the 24-h CTX rhythm. The timing of FGF-23 rhythmicity was variable across individuals and no statistically significant rhythm was identified in P1NP using cosinor analysis. This first published report of the 24-hour profile of serum sclerostin has implications for understanding the rhythmicity of bone turnover markers and the optimal collection time for sclerostin. Our results suggest that serum sclerostin, in contrast to CTX, can be measured at any time of day. Furthermore, these results do not support the hypothesis that osteocytes direct the rhythmicity of other bone turnover markers (CTX), at least not via a sclerostin mediated mechanism.
Previous studies have shown that the osteocyte plays a role in regulating osteoclast formation and activation and that increases in sclerostin (as occurs with mechanical unloading) stimulate osteoclast activity through increased expression of RANKL [5]. Therefore, one might expect sclerostin to display a 24-h profile similar to that of CTX and for these rhythms to be biologically linked. However, we found no clear peak or nadir in 24-h sclerostin profiles using visual inspection or statistical analysis despite confirming the robust rhythmicity of CTX. This suggests the rhythmicity of CTX and bone resorption may be mediated by non-sclerostin mechanisms. These sclerostin data are in contrast to results reported in abstract form which identified a peak in sclerostin levels at 01:00 and a nadir at 10:00 in young men (mean 26 years), using the same Biomedica sclerostin assay used in our study [13]. In that report, the activity and eating patterns of the 6 men were not described and could have resulted in a more pronounced day-night pattern related to environmental/behavioral influence, unrelated to the endogenous rhythmicity of CTX. Our analysis involved controlled lab conditions free of environmental and time cues. In this study food and activity were also carefully controlled - meals were scheduled and exercise prohibited (ambulation allowed). All 24-h profiles were in similar circadian phase. Samples obtained in these controlled lab conditions are more likely to detect the presence or absence of a universal, endogenous rhythmicity across individuals. The significant differences in the 24-h profiles of sclerostin and CTX identified in our study suggest that the rhythmicity in bone resorption reflected by CTX may be mediated by a non-sclerostin mechanism.
In contrast to sclerostin, we did find evidence of a rhythm in the osteocyte derived protein FGF-23. Although a sinusoidal rhythm was identified in FGF-23, there was more inter-individual variation in phase (aka timing of peaks) than for CTX (see Fig 2d, polar plot). If FGF-23 rhythmicity were related to the regulation of dietary phosphate intake, one might expect more consistent timing in this study in which meal timing was aligned across individuals. This variable rhythm may present a challenge with clinical measurements and the establishment of normative values.
These data confirm the presence and timing of CTX 24-h rhythmicity but add to the conflicting reports of P1NP rhythmicity [2,14]. The fitted curves for serum P1NP appeared to have a diurnal profile when assessed visually on a magnified scale (Online Resource Fig 1), albeit with a very small amplitude, and when rhythmicity was assessed by the Rao spacing test (Fig 2c polar plot), which tests whether the individuals’ peak times are clustered. However, no significant rhythm was identified with the more robust cosinor analysis. The variability in P1NP relative to an absent or relatively small amplitude rhythm and its long half-life (10 h) may limit the ability to detect a rhythm in these data [14].
It is interesting that rhythmicity appears diminished in cells of mesenchymal cell lineage (osteoblast, osteocyte) compared to cells of hematopoietic cell lineage (osteoclasts). Clock gene expression (Per1, Per2, Cry, Clock, BMAL1) in osteoclasts/blasts and the observation of altered bone mineral density in clock gene knockout animal models reinforces the concept of endogenous bone cell rhythmicity and the importance of peripheral clocks in bone cells and the rhythmic regulation of bone turnover in bone mass regulation [15-20]. Clock genes have not been identified in osteocytes and therefore, osteocyte rhythmicity is incompletely characterized. Our FGF-23 data suggest that a component of osteocyte function is rhythmic, but that timing varies between individuals. Additional research on the presence or absence of osteocyte clock genes and its relationships/regulation of the circadian rhythmicity of bone turnover in humans are needed to better characterize how sleep and circadian disruptions can affect bone metabolism at the cellular level.
Mean levels of CTX and P1NP were strongly correlated with one another but no other significant correlations were identified. Previous reports of the correlations between sclerostin and other markers have been conflicting [21-28] and may reflect variations in the sclerostin assays utilized [29,30], differences in participant sex/age, timing of sampling, presence/absence of metabolic bone diseases, use of blood vs. mRNA sclerostin levels, and/or analytic variability. In addition, studies of pre- and post-menopausal women suggest race/ethnicity may affect BTM levels [31] and their associations with sclerostin [32]. Similar data in male populations are lacking but the correlations reported here may differ in other studies that have a larger, more ethnically diverse study population. It is unclear how well serum sclerostin correlates with mRNA levels in the bone [28,29] and therefore circulating levels may not reflect biologically relevant relationships. The differences in CTX, P1NP, and sclerostin levels by age are consistent with prior literature [4,33,28]. The relatively limited sample size (n = 4 older; n = 6 younger) limited the ability to detect differences in rhythmicity by age.
This analysis has several strengths. It is the first description of the 24-h profile of sclerostin and its relationship to the 24-h profiles of other bone biomarkers. The study involved a relatively large sample size (n = 10) for a complex sleep protocol. Since rhythmicity was confirmed in CTX and FGF-23, it is likely that we had adequate resolution (in sampling frequency and sample stability) to identify a meaningful rhythm in serum sclerostin. The study also has potential limitations. It is possible that sclerostin or P1NP day-night patterns are present but not detected by our methods. For instance, day/night patterns in sclerostin may be heavily influenced by environmental factors (such as light, food, or posture/mechanical loading) that varied minimally in this study protocol. Furthermore, although a rhythm may have been apparent over a longer sampling interval (i.e. 48 h to obtain at least 2 full periods), the rigorous design employed (with individuals aligned for differences in phase that account for meals and sleep opportunities) should have been capable of detecting a sinusoidal rhythm in the 24-h study interval. In addition, given the variability in commercially available sclerostin assays [29,30], use of a different assay (i.e. one that does not detect fragments as this Biomedica sclerostin assay does) and/or sample type (e.g. EDTA plasma) could yield different results. A cosinor model was chosen for this data analysis because the most robust bone biomarker rhythm (CTX) has a visually clear sinusoidal rhythm [1], as do other bone biomarkers [14,6]. Although a more complex rhythm may be present in sclerostin, the approach we used is the most appropriate for investigating the osteocyte-osteoclast rhythm relationship because it is presumed that endogenous rhythms of the bone biomarkers would be similar (i.e. both sine/cosine), if related. The samples reported here were taken from a baseline 24 h interval from a study intended to examine the metabolic effects of sleep disturbance [9] and not designed a priori to address bone-related questions. Nonetheless, the protocol appeared adequate to answer the bone questions posed herein. Due to limited resources, only healthy adult men were included in this analysis and therefore, sclerostin rhythmicity and its relationship to other bone biomarkers may be different in women or other groups. The duration of sample storage (4-8 years at −80°C) may have compromised our ability to detect rhythmicity in sclerostin. However, most proteins are stable at these temperatures. The half-life of circulating sclerostin is not known and if prolonged could limit the ability to detect a rhythm. Lastly, the serum values obtained in this study may not accurately reflect levels in the bone microenvironment [34].
Conclusions
In contrast to the robust diurnal rhythm of the bone resorption marker CTX, we found no significant rhythm in serum sclerostin in healthy adult men. Our results do not support the hypothesis that osteocytes direct the rhythmicity of other bone turnover markers (CTX), at least not via a sclerostin mediated mechanism. These results also imply that time of day is less important when measuring serum sclerostin. The 24-h profile of FGF-23 suggests that a component of osteocyte function is rhythmic, but that timing varies between individuals.
Supplementary Material
Online Resource Fig 1 24-h fitted serum profile of P1NP (Magnified Y-axis)
P1NP individual (dotted) and group (solid) fitted cosinor curves are displayed for all 10 men by age group (older = dark red; younger = light blue) with a smaller y-axis than used in Fig 2c. When the y-axis is magnified (and meal bars are removed), a very small amplitude profile for P1NP can be appreciated visually. All clock times are presented as 2-digit military time in hours relative to breakfast, which occurred, on average, at 09:27 (SD 3 min). 10-h sleep opportunity is represented as a horizontal black bar.
Acknowledgments
CMS, ESO, SAS, OMB
Study Design: CMS, ESO, SAS, OMB, CAC
Data Collection: SWC, MM
Data Analysis: PW, SM, OMB
Data Interpretation: CMS, SAS, PW, CAC, ESO, OMB
Drafting Manuscript: CMS, PW, ESO, OMB
Manuscript Revisions: CMS, SAS, PW, SM, SWC, MM, CAC, OMB, ESO
Approval of Final Manuscript: CMS, SAS, PW, SM, SWC, MM, CAC, ESO, OMB
Responsibility for Integrity of Data analysis: PW, CMS
Complimentary graphic design consultation for figures were provided by Brian D. Swanson.
Assistance with acquisition of study documentation provided by Nina Vujovic.
Research reported in this publication was supported by the National Institute of Arthritis and Musculoskeletal and Skin Diseases of the National Institutes of Health under Award Number K23 AR070275. The content is solely the responsibility of the authors and does not necessarily represent the official views of the National Institutes of Health.
CMS received support from NIH grant T32 DK007674, NIH grant T32 DK007446, K23 AR070275, and the Medical Research Foundation of Oregon Early Clinical Investigator Grant MRF515.
SAS received support from NASA grant NNX1OAR1OG, CDC grant U19 OH010154 and NIH grant R01 HL125893.
PW, SWC, and MM have no disclosures.
SM received support from Oregon Clinical and Translational Research Institute (OCTRI), grant number (UL1TR000128) from the National Center for Advancing Translational Sciences (NCATS) at the National Institutes of Health (NIH).
CAC Consultant to Amazon.com, Inc., A2Z Development Center, Bose, Boston Celtics, Boston Red Sox, Cleveland Browns, Columbia River Bar Pilots, Institute of Digital Media and Child Development, Jazz Pharma, Merck, NBA Coaches Association, Purdue Pharma, Quest Diagnostics, Samsung, Teva, Vanda Pharma. Dr. Czeisler holds equity in Vanda Pharma; receives research/education support from Cephalon, Mary Ann & Stanley Snider via Combined Jewish Philanthropies, NFL Charities, Jazz Pharma, Optum, ResMed, San Francisco Bar Pilots, Schneider, Simmons, Sysco, Philips, Vanda; is an expert witness in legal cases, including those involving Bombardier, Continental Airlines, Fedex, Greyhound, Purdue Pharma, UPS; serves as the incumbent of a professorship endowed by Cephalon; and receives royalties from McGraw Hill, Houghton Miflin Harcourt, and Philips Respironics for the Actiwatch-2 and Actiwatch Spectrum devices. Dr. Czeisler’s interests were reviewed and are managed by Brigham and Women’s Hospital and Partners HealthCare in accordance with their conflict of interest policies.
OMB Previously served as consultant to Takeda Pharmaceuticals North America (speaker’s bureau), Dinsmore LLC (expert witness testimony), Matsutani America (scientific advisory board), and Chevron (speaking fees). Outside of the submitted work, investigator-initiated research grant support from Sepracor (now Sunovion) and Cephalon (now Teva). This work was supported by grants from the National Institute on Aging (NIA) (P01 AG009975) and was conducted in the Brigham and Women’s Hospital General Clinical Research Center supported by the National Center for Research Resources (NCRR) (M01 RR02635), the CCI of the Harvard Clinical and Translational Science Center (1 UL1 RR025758-01), and with support from the Joslin Diabetes and Endocrinology Research Center Service (5P30 DK 36836) Specialized Assay Core. O.M.B. was supported in part by the NHLBI (R01HL107240).
ESO Consults for and has received research support from Amgen, Lilly, and Merck ESO for The Osteoporotic Fractures in Men (MrOS) Study, and the National Institutes of Health via the following institutes: the National Institute on Aging (NIA), the National Institute of Arthritis and Musculoskeletal and Skin Diseases (NIAMS), the National Center for Advancing Translational Sciences (NCATS), and NIH Roadmap for Medical Research, under the following grant numbers: U01AG027810, U01 AG042124, U01 AG042139, U01 AG042140,U01 AG042143, U01 AG042145, U01 AG042168, U01AR066160, and UL1 TR000128.
Research reported in this manuscript was supported by National Center for Advancing Translational Sciences of the National Institutes of Health under award numberUL1TR000128.
Abbreviations
- CTX
C-terminal cross-linked telopeptide of type I collagen
- P1NP
N-terminal Propeptide of type I collagen
- FGF-23
Fibroblast growth factor 23
- BTM
Bone turnover marker
- h
hour
Footnotes
ORCID: 0000-0003-1554-0862
Financial Disclosures/Conflict of Interest
In the interest of full disclosure, we report the following, however, we do not believe any of these pertain to the current work.
References
- 1.Qvist P, Christgau S, Pedersen BJ, Schlemmer A, Christiansen C. Circadian variation in the serum concentration of C-terminal telopeptide of type I collagen (serum CTx): effects of gender, age, menopausal status, posture, daylight, serum cortisol, and fasting. Bone. 2002;31(1):57–61. doi: 10.1016/s8756-3282(02)00791-3. [DOI] [PubMed] [Google Scholar]
- 2.Luchavova M, Zikan V, Michalska D, Raska I, Jr, Kubena AA, Stepan JJ. The effect of timing of teriparatide treatment on the circadian rhythm of bone turnover in postmenopausal osteoporosis. Eur J Endocrinol. 2011;164(4):643–648. doi: 10.1530/EJE-10-1108. [DOI] [PubMed] [Google Scholar]
- 3.Dovio A, Generali D, Tampellini M, Berruti A, Tedoldi S, Torta M, Bonardi S, Tucci M, Allevi G, Aguggini S, Bottini A, Dogliotti L, Angeli A. Variations along the 24-hour cycle of circulating osteoprotegerin and soluble RANKL: a rhythmometric analysis. Osteoporos Int. 2008;19(1):113–117. doi: 10.1007/s00198-007-0423-z. [DOI] [PubMed] [Google Scholar]
- 4.Szulc P, Bauer DC. Biochemical Markers of Bone Turnover in Osteoporosis. In: Marcus R, Feldman D, Dempster DW, Luckey M, Cauley JA, editors. Osteoporosis. 4th. Academic Press, Elsevier; 2013. pp. 1573–1610. [Google Scholar]
- 5.Dallas SL, Prideaux M, Bonewald LF. The osteocyte: an endocrine cell … and more. Endocr Rev. 2013;34(5):658–690. doi: 10.1210/er.2012-1026. [DOI] [PMC free article] [PubMed] [Google Scholar]
- 6.Smith ER, Cai MM, McMahon LP, Holt SG. Biological variability of plasma intact and C-terminal FGF23 measurements. J Clin Endocrinol Metab. 2012;97(9):3357–3365. doi: 10.1210/jc.2012-1811. [DOI] [PubMed] [Google Scholar]
- 7.Kawai M, Kinoshita S, Shimba S, Ozono K, Michigami T. Sympathetic activation induces skeletal Fgf23 expression in a circadian rhythm-dependent manner. J Biol Chem. 2014;289(3):1457–1466. doi: 10.1074/jbc.M113.500850. [DOI] [PMC free article] [PubMed] [Google Scholar]
- 8.Swanson CM, Shea SA, Wolfe P, Cain SW, Munch M, Vuvjovic N, Czeisler CA, Buxton OM, Orwoll ES. Bone Turnover Markers After Sleep Restriction and Circadian Disruption: A Mechanism for Sleep-Related Bone Loss in Humans. Journal of Clinical Endocrinology and Metabolism. doi: 10.1210/jc.2017-01147. Accepted June 13, 2017. [DOI] [PMC free article] [PubMed] [Google Scholar]
- 9.Buxton OM, Cain SW, O’Connor SP, Porter JH, Duffy JF, Wang W, Czeisler CA, Shea SA. Adverse metabolic consequences in humans of prolonged sleep restriction combined with circadian disruption. Sci Transl Med. 2012;4(129):129ra143. doi: 10.1126/scitranslmed.3003200. [DOI] [PMC free article] [PubMed] [Google Scholar]
- 10.Cornelissen G. Cosinor-based rhythmometry. Theor Biol Med Model. 2014;11:16. doi: 10.1186/1742-4682-11-16. [DOI] [PMC free article] [PubMed] [Google Scholar]
- 11.Rao JS. Some Tests Based on Arc-Lengths for the Circle. (Series B).Sankhya: The Indian Journal of Statistics. 1976;38(4):329–338. [Google Scholar]
- 12.Team RC. R: A language and environment for statistical computing. R Foundation for Statistical Computing; 2014. [Google Scholar]
- 13.Santosh HS, Ahluwalia R, Hamilton A, Barraclough DL, Fraser WD, Vora JP. 15th European Congress of Endocrinology. Vol. 32. Copenhagen, Denmark: 2013. Circadian Rhythm of Circulating Sclerostin in Healthy Young Men; p. 72. [Google Scholar]
- 14.Redmond J, Fulford AJ, Jarjou L, Zhou B, Prentice A, Schoenmakers I. Diurnal Rhythms of Bone Turnover Markers in Three Ethnic Groups. J Clin Endocrinol Metab. 2016:jc20161183. doi: 10.1210/jc.2016-1183. [DOI] [PMC free article] [PubMed] [Google Scholar]
- 15.Fujihara Y, Kondo H, Noguchi T, Togari A. Glucocorticoids mediate circadian timing in peripheral osteoclasts resulting in the circadian expression rhythm of osteoclast-related genes. Bone. 2014;61:1–9. doi: 10.1016/j.bone.2013.12.026. [DOI] [PubMed] [Google Scholar]
- 16.Fu L, Patel MS, Bradley A, Wagner EF, Karsenty G. The molecular clock mediates leptin-regulated bone formation. Cell. 2005;122(5):803–815. doi: 10.1016/j.cell.2005.06.028. [DOI] [PubMed] [Google Scholar]
- 17.Yuan G, Hua B, Yang Y, Xu L, Cai T, Sun N, Yan Z, Lu C, Qian R. The Circadian Gene Clock Regulates Bone Formation via PDIA3. J Bone Miner Res. 2016 doi: 10.1002/jbmr.3046. [DOI] [PubMed] [Google Scholar]
- 18.Xu C, Ochi H, Fukuda T, Sato S, Sunamura S, Takarada T, Hinoi E, Okawa A, Takeda S. Circadian Clock Regulates Bone Resorption in Mice. J Bone Miner Res. 2016;31(7):1344–1355. doi: 10.1002/jbmr.2803. [DOI] [PubMed] [Google Scholar]
- 19.Takarada T, Xu C, Ochi H, Nakazato R, Yamada D, Nakamura S, Kodama A, Shimba S, Mieda M, Fukasawa K, Ozaki K, Iezaki T, Fujikawa K, Yoneda Y, Numano R, Hida A, Tei H, Takeda S, Hinoi E. Bone Resorption Is Regulated by Circadian Clock in Osteoblasts. J Bone Miner Res. 2016 doi: 10.1002/jbmr.3053. [DOI] [PubMed] [Google Scholar]
- 20.Maronde E, Schilling AF, Seitz S, Schinke T, Schmutz I, van der Horst G, Amling M, Albrecht U. The clock genes Period 2 and Cryptochrome 2 differentially balance bone formation. PLoS One. 2010;5(7):e11527. doi: 10.1371/journal.pone.0011527. [DOI] [PMC free article] [PubMed] [Google Scholar]
- 21.Durosier C, van Lierop A, Ferrari S, Chevalley T, Papapoulos S, Rizzoli R. Association of circulating sclerostin with bone mineral mass, microstructure, and turnover biochemical markers in healthy elderly men and women. J Clin Endocrinol Metab. 2013;98(9):3873–3883. doi: 10.1210/jc.2013-2113. [DOI] [PubMed] [Google Scholar]
- 22.Garnero P, Sornay-Rendu E, Munoz F, Borel O, Chapurlat RD. Association of serum sclerostin with bone mineral density, bone turnover, steroid and parathyroid hormones, and fracture risk in postmenopausal women: the OFELY study. Osteoporos Int. 2013;24(2):489–494. doi: 10.1007/s00198-012-1978-x. [DOI] [PubMed] [Google Scholar]
- 23.Gaudio A, Pennisi P, Bratengeier C, Torrisi V, Lindner B, Mangiafico RA, Pulvirenti I, Hawa G, Tringali G, Fiore CE. Increased sclerostin serum levels associated with bone formation and resorption markers in patients with immobilization-induced bone loss. J Clin Endocrinol Metab. 2010;95(5):2248–2253. doi: 10.1210/jc.2010-0067. [DOI] [PubMed] [Google Scholar]
- 24.van Lierop AH, Hamdy NA, Hamersma H, van Bezooijen RL, Power J, Loveridge N, Papapoulos SE. Patients with sclerosteosis and disease carriers: human models of the effect of sclerostin on bone turnover. J Bone Miner Res. 2011;26(12):2804–2811. doi: 10.1002/jbmr.474. [DOI] [PubMed] [Google Scholar]
- 25.van Lierop AH, Hamdy NA, van Egmond ME, Bakker E, Dikkers FG, Papapoulos SE. Van Buchem disease: clinical, biochemical, and densitometric features of patients and disease carriers. J Bone Miner Res. 2013;28(4):848–854. doi: 10.1002/jbmr.1794. [DOI] [PubMed] [Google Scholar]
- 26.Frost M, Andersen T, Gossiel F, Hansen S, Bollerslev J, van Hul W, Eastell R, Kassem M, Brixen K. Levels of serotonin, sclerostin, bone turnover markers as well as bone density and microarchitecture in patients with high-bone-mass phenotype due to a mutation in Lrp5. J Bone Miner Res. 2011;26(8):1721–1728. doi: 10.1002/jbmr.376. [DOI] [PubMed] [Google Scholar]
- 27.Yavropoulou MP, van Lierop AH, Hamdy NA, Rizzoli R, Papapoulos SE. Serum sclerostin levels in Paget’s disease and prostate cancer with bone metastases with a wide range of bone turnover. Bone. 2012;51(1):153–157. doi: 10.1016/j.bone.2012.04.016. [DOI] [PubMed] [Google Scholar]
- 28.Roforth MM, Fujita K, McGregor UI, Kirmani S, McCready LK, Peterson JM, Drake MT, Monroe DG, Khosla S. Effects of age on bone mRNA levels of sclerostin and other genes relevant to bone metabolism in humans. Bone. 2014;59:1–6. doi: 10.1016/j.bone.2013.10.019. [DOI] [PMC free article] [PubMed] [Google Scholar]
- 29.Clarke BL, Drake MT. Clinical Utility of Serum Sclerostin Measurements. BoneKEy Reports. 2013;2(361) doi: 10.1038/bonekey.2013.95. [DOI] [PMC free article] [PubMed] [Google Scholar]
- 30.Piec I, Washbourne C, Tang J, Fisher E, Greeves J, Jackson S, Fraser WD. How Accurate is Your Sclerostin Measurement? Comparison Between Three Commercially Available Sclerostin ELISA Kits. Calcif Tissue Int. 2016;98(6):546–555. doi: 10.1007/s00223-015-0105-3. [DOI] [PMC free article] [PubMed] [Google Scholar]
- 31.Finkelstein JS, Sowers M, Greendale GA, Lee ML, Neer RM, Cauley JA, Ettinger B. Ethnic variation in bone turnover in pre- and early perimenopausal women: effects of anthropometric and lifestyle factors. J Clin Endocrinol Metab. 2002;87(7):3051–3056. doi: 10.1210/jcem.87.7.8480. [DOI] [PubMed] [Google Scholar]
- 32.Costa AG, Walker MD, Zhang CA, Cremers S, Dworakowski E, McMahon DJ, Liu G, Bilezikian JP. Circulating sclerostin levels and markers of bone turnover in Chinese-American and white women. J Clin Endocrinol Metab. 2013;98(12):4736–4743. doi: 10.1210/jc.2013-2106. [DOI] [PMC free article] [PubMed] [Google Scholar]
- 33.Amrein K, Amrein S, Drexler C, Dimai HP, Dobnig H, Pfeifer K, Tomaschitz A, Pieber TR, Fahrleitner-Pammer A. Sclerostin and its association with physical activity, age, gender, body composition, and bone mineral content in healthy adults. J Clin Endocrinol Metab. 2012;97(1):148–154. doi: 10.1210/jc.2011-2152. [DOI] [PubMed] [Google Scholar]
- 34.Chavassieux P, Portero-Muzy N, Roux JP, Garnero P, Chapurlat R. Are Biochemical Markers of Bone Turnover Representative of Bone Histomorphometry in 370 Postmenopausal Women? J Clin Endocrinol Metab. 2015;100(12):4662–4668. doi: 10.1210/jc.2015-2957. [DOI] [PubMed] [Google Scholar]
Associated Data
This section collects any data citations, data availability statements, or supplementary materials included in this article.
Supplementary Materials
Online Resource Fig 1 24-h fitted serum profile of P1NP (Magnified Y-axis)
P1NP individual (dotted) and group (solid) fitted cosinor curves are displayed for all 10 men by age group (older = dark red; younger = light blue) with a smaller y-axis than used in Fig 2c. When the y-axis is magnified (and meal bars are removed), a very small amplitude profile for P1NP can be appreciated visually. All clock times are presented as 2-digit military time in hours relative to breakfast, which occurred, on average, at 09:27 (SD 3 min). 10-h sleep opportunity is represented as a horizontal black bar.