Abstract
Motivation
Increasing amounts of whole exome or genome sequencing data present the challenge of analysing rare variants with extremely small minor allele frequencies. Various statistical tests have been proposed, which are specifically configured to increase power for rare variants by conducting the test within a certain bin, such as a gene or a pathway. However, a gene may contain from several to thousands of markers, and not all of them are related to the phenotype. Combining functional and non-functional variants in an arbitrary genomic region could impair the testing power.
Results
We propose a Zoom-Focus algorithm (ZFA) to locate the optimal testing region within a given genomic region. It can be applied as a wrapper function in existing rare variant association tests to increase testing power. The algorithm consists of two steps. In the first step, Zooming, a given genomic region is partitioned by an order of two, and the best partition is located. In the second step, Focusing, the boundaries of the zoomed region are refined. Simulation studies showed that ZFA substantially increased the statistical power of rare variants’ tests, including the SKAT, SKAT-O, burden test and the W-test. The algorithm was applied on real exome sequencing data of hypertensive disorder, and identified biologically relevant genetic markers to metabolic disorders that were undetectable by a gene-based method. The proposed algorithm is an efficient and powerful tool to enhance the power of association study for whole exome or genome sequencing data.
Availability and Implementation
The ZFA software is available at: http://www2.ccrb.cuhk.edu.hk/statgene/software.html
Supplementary information
Supplementary data are available at Bioinformatics online.
1 Introduction
A nation-wide collection of deep sequencing data was made to facilitate investigation and improve understanding of Mendelian and complex disorders (Ashley, 2015; Auffray et al., 2016; Cyranoski, 2016; Jameson and Longo, 2015). There is a demand for powerful and efficient methods to draw medical and clinical inferences from the data. The challenge of analysing genome sequencing datasets, besides multiple-testing issues arising from high dimensionality, centres on extreme low allele frequencies—classical statistical tests lose power on genetic variants with small variance. In whole genome or exome sequencing data, over 99% of the variants have minor allele frequency (MAF) below 1% (Consortium, 2015). A number of rare variant association tests has been proposed to improve power, either by pulling adjacent variants together and up-weighting the minor allele (burden tests) (Li and Leal, 2008; Liu and Leal, 2010; Madsen and Browning, 2009), or by applying a linear mixed model on a certain genomic region (variance component tests) (Lee et al., 2012; Neale et al., 2011; Wu et al., 2011). For most rare variant methods, a fixed genomic region for testing is assumed, such as a gene or a fixed window. However, in real data application, a gene may contain from several to thousands of variants. Directly applying rare variant association tests based on a fixed window may introduce significant amounts of unnecessary noise that could impair the testing power (Santorico and Hendricks, 2016). Furthermore, many of the exome sequencing data have unknown gene functions and are difficult to pool without prior information. Therefore, it is desirable to optimize the collapsing region so that minimum noise is included and the power of a test can be enhanced. This approach will be most effective when the true signals display a certain degree of clustering, which is not unreasonable as linkage disequilibrium exists among adjacent variants (Pearson and Manolio, 2008). Large sequencing studies also indicated that variants in the same gene regulatory element would physically cluster in DNA sequences (Allen et al., 2010; Raab and Kamakaka, 2010; Robertson et al., 2003; Yue et al., 2010). Scan statistics have been proposed which incorporate a sliding window with varying window size to identify localized signals (Hoh and Ott, 2000; Ionita-Laza et al., 2014a,b). Since scan statistics typically need permutations to evaluate significance, the computing burden prevents its window size selection to be conducted in an exhaustive manner for whole genome evaluation. It also does not provide stand-alone window size optimization for other rare variant association tests.
In this article, we propose a Zoom-Focus algorithm (ZFA) to optimize the testing region for any region-based rare variant association test as a wrapper function. The algorithm consists of two main steps, Zooming and Focusing. In the Zooming step, a fixed genomic region is partitioned by an order of two, and a search is conducted across all partition levels to identify the region with maximum information, evaluated by the smallest association P-value of that partition. Based on the zoomed partition, the next step, Focusing, refines the region by adding or subtracting adjacent variants near the boundaries. Simulation studies of various genetic scenarios demonstrated that ZFA could substantially enhance the statistical power of different rare variant methods, including the SKAT, SKAT-O, burden test and W-test. The ZFA was applied on real exome sequencing data of hypertensive disorder and identified biologically relevant genetic markers that were undetectable by unoptimized testing regions.
2 Materials and Methods
2.1 The Zoom-Focus algorithm
The ZFA can best be explained with an example. Suppose a gene or a fixed window contains 64 variants, among which 8 are causal. For the simplest scenario, the eight causal markers cluster together, as shown in Diagram 1. (Other causal marker distributions are considered in the simulation study.) The ZFA first performs an exhaustive search in all possible binary partitions of the initial region to locate the best partition (Zooming), and then adjusts the zoomed region by considering the increment or decrement of the bounds (Focusing) (Diagram 1).
Diagram 1.
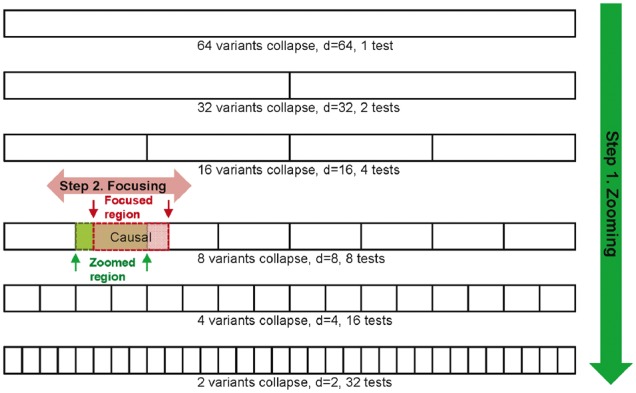
The ZFA first performs an exhaustive search in all possible binary partitions in a given genomic region (Step 1: Zooming); then adjusts the boundary of the zoomed region by considering increment or decrement of bounds (Step 2: Focusing)
We will first define some notations, and then introduce the algorithm. Let P be the total number of variants in a fixed window; R is the maximum order of binary partitions for P, and R = arg max{r: 2r−1 < P, r = 1, 2, …}; r is the order of partitions. At a certain r, the number of partitioned regions is nr = 2r−1, and the size of partition d is the number of variants in a partitioned region, d = P/nr = P/2r−1. A higher order gives a smaller partitioned region size. c is the index for the cth partition, c = 1,…, nr. For Diagram 1, P = 64; the causal region is located at the fourth order and the second partitioned region, at which r = 4, d = 8 and c = 2. (A complete correspondence of partition order and size can be found in Supplementary Material S1.) We denote ϕ(d, c) = {xcj, j = 1,…,d} as the region that contains variants in a partition size d and index c, in which xcj denotes the jth variant located in the cth partitioned region. The causal region in this example is ϕ(8, 2). Let f(·) be the Bonferroni corrected P-value calculated by rare variant method F(·) measured on region ϕ(d, c):
| (1) |
where nr is the number of partitions at order r. The scalar ensures P-values at the different partition orders can be compared. Therefore, we have:
Step 1: Zooming. Search for an optimal () among all partitions of a given initial region such that f (·) is minimized:
| (2) |
The number of tests T(P) in a window of P number of variants is:
Therefore, the computational complexity of Zooming is O(P).
Step 2: Focusing. Refine the boundaries of () by extending both lower and upper bounds, outwardly by , and inwardly by . Let LB denote the lower bound of (), and UB denote the upper bound of (). The focused lower bound (LBf) and upper bound (UBf) are:
| (3) |
Then the P-value of ZFA on a given window of P variants is:
| (4) |
where P – 1 is the number of tests in the Zooming step; and k is the number of tests in the Focusing step, 0 ≤ k ≤ 3. k = 0 when Focusing is not performed; k = 3 when Focusing searches the surroundings of both bounds.
In the Focusing step, the worst-case scenario contains 3P/2 calculations. Thus, the overall computation complexity of the ZFA is O(P). This is much more efficient than searching all possible window sizes, by which the computation complexity is O(P!). In sum, the Zooming step locates the best partition from the global search, and the Focusing step refines the boundaries of the zoomed region from local linear optimization. The terms are motivated by optical zooming lens.
2.2 An alternative fast-Zoom method
The previous Zooming algorithm exhaustively searches binary partitions of a given region. The computing speed of different statistical tests varies: some inherit probability distributions such as the W-test (Wang et al., 2016), while some incorporate approximation tests to obtain the P-values such as the SKAT (Wu et al., 2011). To assist the computing extensive methods to perform ZFA, we propose a fast-Zoom method. Instead of searching all possible partitions, the fast-Zoom performs a binary search, such that at each partition order r, the region is divided into two parts, only the part with the smaller P-value is considered for the next level search, as illustrated in Diagram 2. The computation complexity of fast-Zoom reduces to O(log2(P)).
Diagram 2.
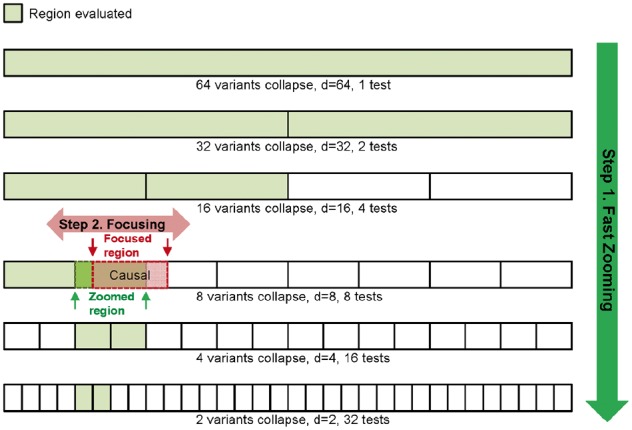
Fast-ZFA. In fast-Zoom, a binary search replaces the exhaustive search—only shaded regions are evaluated. Fast-ZFA’s computation complexity is O(log2(P)), compared with Zooming’s O(P)
2.3 Simulation study design
Each simulation dataset consists of 2000 subjects and 128 rare variants. The MAF of variants is between 0.01 and 1%. Simulated phenotypes are generated using a logistic regression on causal variants (Wu et al., 2011):
where X1 is a standard normal covariate, X2 is a dichotomous covariate that takes the value 0 with probability 0.5 and the value 1 otherwise. Gi is a causal rare variant and βi is the effect size, βi = |log10MAF| × 0.3, such that rarer variants have greater effects. The prevalence is controlled by setting β0 to 10%.
The power of the rare variant association test is also influenced by the distribution of causal variants in the evaluation region (Sham and Purcell, 2014). To fully explore all methods’ performance with ZFA, three scenarios are considered, with varying distributions and different effect sizes and directions (Diagram 3):
Scenario I: eight causal variants cluster together in a same effect direction.
Scenario II: eight causal variants cluster in two groups in a same effect direction.
Scenario III: eight causal variants cluster together in opposite effect directions (five variants display risk effect and three variants show protective effect).
To evaluate the effect of Focusing, distribution of causal variants is simulated to follow the setting of Scenario I but with uneven boundaries.
Diagram 3.
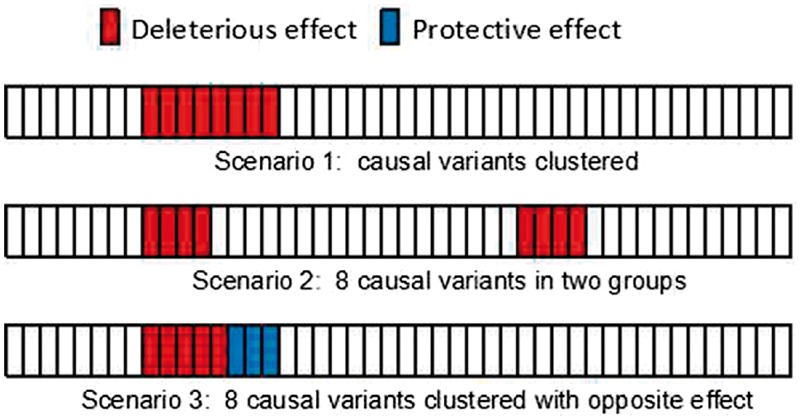
Causal variants distribution scenarios in simulation study
2.4 Statistical tests considered
The ZFA is applicable to all region-based rare variant association tests. Four representative methods are selected for ZFA to be applied in simulation studies, including the SKAT of variance component test, the SKAT-O, a composite burden and variant component method, the classical weighted burden test, and the W-test of burden test category. The SKAT is a quadratic score test that is composed of a weighted prediction error from a linear mixed model; it follows a mixture of Chi-squared distributions, and the P-value is obtained through Davies approximation (Wu et al., 2011). The SKAT is advantageous when a few large effect variants are located in a genomic region, and when the effect directions are not identical (Lee et al., 2014). The SKAT-O combines the SKAT and burden test by a linear model, and computes the asymptotic P-value with 1D numerical integration (Lee et al., 2012). The burden test sums the minor allele counts within a region, and conducts testing based on the collapsed unit with adjusted weight, which is suitable for the scenario when the majority of causal variants have the same effect direction (Sha et al., 2012). The W-test collapsing method is a fast and model-free genetic association test for rare variants. The test calculates a W-statistic on the summed contingency table of variants from a given region, and follows a Chi-squared distribution (Sun et al., 2016; Wang et al., 2016).
2.5 Power, type I error calculation and receiver operating characteristic
For the power calculation, 1000 datasets are generated for each scenario. The power before Zooming is the proportion of initial region (gene-based) tests having a significant P-value (Lee et al., 2012; Wu et al., 2011). The power after Zooming is the proportion of true positives in 1000 simulated datasets. An outcome is regarded as a true positive if the final optimal region overlaps with the causal region and has a Bonferroni corrected P-value smaller than α. The significance level α is set to be 1%. Y is permuted 105 times for type I error estimation. A receiver operating characteristic (ROC) curve is used to assess the improvement of the Focusing step after the Zooming step.
2.5.1 Zooming performance under varying sample sizes and causal variants proportions
The power of rare variants association testing with Zooming is compared when the sample size is allowed to vary. Under scenario I, at causal variant proportion 6.25%, the sample sizes tested are: 1000, 2000, 3000 and 4000 subjects, respectively. The performance of the rare variant association test is also compared at different causal variant proportions using the fast-Zoom. The proportions of causal variants are set to be 3.18%, 6.25%, 12.50% and 18.75%, respectively, under scenario I and using fixed sample size 2,000. All α are set as 1%.
2.6 Real data application
ZFA is applied on real hypertensive disorder sequence data of the Genetics Analysis Workshop 19 (GAW19). The data consist of 398 hypertensive patients and 1453 healthy controls; the exome sequence of chromosome 3 is used. Variants with a missing value percentage over 5%, MAF > 1%, and inconsistent genotyping format are excluded (Laurie et al., 2010). After quality control, 41 788 rare variants remain. The full ZFA is applied on Chromosome 3 using an initial window size P = 256. The chromosome is then divided into 163 non-overlapping regions, and the remaining 60 variants are grouped as the last window. Zoomed regions with P-value < 0.001 are passed to the Focusing step. A region is regarded as significant if its final P-value is smaller than the Bonferroni corrected significance level of 6.1 × 10⁻⁵ (0.01/164). Initial window sizes P = 128 and P = 512 are also applied, with the significance threshold adjusted accordingly (Supplementary Material S3). Genes that are included or overlap with the returned region are reported as susceptible.
3 Results
3.1 Simulation study
3.1.1 Performance of the zooming
The Zooming was evaluated under the three causal marker distribution scenarios, and all rare variant tests received considerable power enhancement (Table 1). In Scenario I, eight causal variants with the same effect direction cluster together. After Zooming, the power of SKAT increased from 20.73 to 25.95%, and SKAT-O improved from 22.15 to 68.18%. The power of burden test and W-test increased from 10.34 and 11.23% to 76.11 and 71.32%, respectively. In Scenario II, four causal variants with the same effect direction form two distinct clustering groups. Before optimizing the testing region, SKAT and SKAT-O gave the highest power: 65.59 and 64.82%, compared with burden test’s 23.93% and W-test’s 28.41%. After applying the Zooming, SKAT power increased to 73.78%, SKAT-O to 87.32%; and the power of burden test and W-test increased greatly to 87.89 and 85.51%, respectively. Both Scenarios I and II favoured unidirectional burden tests, and tests with burden property benefitted most from optimizing the testing region. Before Zooming, SKAT and SKAT-O had higher power; after Zooming, the W-test and burden test outperformed the SKAT methods. Scenario III contains eight causal variants in different effect directions; it is more suitable for variance component tests. Before optimization, SKAT and SKAT-O showed higher power of 49.51 and 44.57%, compared with burden’s 8.49% and W-test’s 10.63%. After optimizing, SKAT’s power increased to 65.98%, SKAT-O to 74.47%; burden test power increased to 72.99% and W-test to 66.85%. The power of SKAT-related method increased around 1.5-fold, and the power of burden-like methods increased 6-8-fold. For the zoomed region size (Table 1), SKAT and SKAT-O usually resulted in wider final optimized regions, while the burden test and W-test gave narrower zoomed regions around the causal variants. Type I error rates after Zooming were all controlled under 1%.
Table 1.
Power and type I error rates of rare variant association tests before and after Zooming
| Scenarios of causal variants distribution | Statistical tests | Powerb before Zooming | Power after Zooming | Zoomed region size Median [Q1, Q3] |
|---|---|---|---|---|
| Scenario Ia | SKAT | 20.73% | 25.95% | 16 [8,64] |
| SKAT-O | 22.15% | 68.18% | 8 [8,8] | |
| Burden | 10.34% | 76.11% | 8 [8,8] | |
| W-test | 11.23% | 71.32% | 8 [8,8] | |
| Scenario II | SKAT | 65.59% | 73.78% | 16 [16,32] |
| SKAT-O | 64.82% | 87.32% | 16 [16,16] | |
| Burden | 23.93% | 87.89% | 16 [4,16] | |
| W-test | 28.41% | 85.51% | 16 [16,16] | |
| Scenario III | SKAT | 49.51% | 65.98% | 16 [8,32] |
| SKAT-O | 44.57% | 74.47% | 8 [8,16] | |
| Burden | 8.49% | 72.99% | 4 [4,8] | |
| W-test | 10.63% | 66.85% | 8 [4,8] | |
| Type I error rateb | SKAT | 0.56% | 0.49% | 128 [64,128] |
| SKAT-O | 0.76% | 0.54% | 128 [16,128] | |
| Burden | 0.93% | 0.47% | 128 [16,128] | |
| W-test | 1.23% | 0.42% | 128 [32,128] |
Note: Under three causal marker distribution scenarios, the statistical power of all rare variant tests by applying Zooming showed a substantial enhancement. The type I error rates were controlled.
Scenario I: 8 unidirectional causal variants; Scenario II: two clusters of four unidirectional causal variants; Scenario III: 8 bi-directional causal variants.
α = 1% for all methods.
3.1.2 Performance of the fast-Zoom
The power of all rare variant methods also improved with fast-Zoom, and the type I error rates were controlled (Supplementary Material S2). Under Scenario I, for the burden test and W-test, fast-Zoom improved their testing power from 10.34 to 68.62% and from 11.23 to 63.68%, respectively. The burden test’s power was ∼10% weaker than in the Zooming due to increased noise level from the crude partitions. The regression-based SKAT methods are more robust as they can discriminate noises within a reasonably sized bin. Fast-Zoom also has a smaller number of multiple tests’ penalties. Therefore, the SKAT-method showed slightly higher power and type I error rates in the fast-Zoom than in the Zooming.
3.1.3 Performance of zooming at different sample sizes
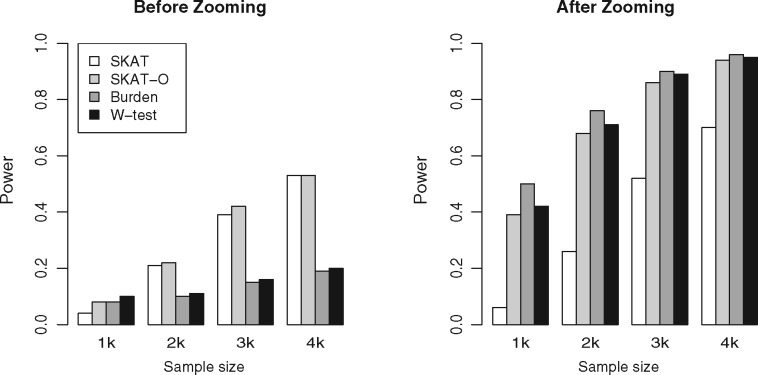
Before Zooming, as the sample size increased, the power of SKAT and SKAT-O increased much quicker than the burden test and W-test (Figs. 1 and 2). After Zooming, the power of SKAT-O, burden test and W-test quickly reached 70–80% at 2000 subjects. The result showed that all the methods’ power increased greatly with Zooming, and tests with burden characteristics improved the most. In whole genome data of insufficient sample size, Zooming could be a useful method to enhance the testing power of a rare variant association study.
Fig. 1.
Power of Zooming at different sample sizes. When sample size increased from 1000 to 4000, tests with burden characteristics improved the most with Zooming
Fig. 2.
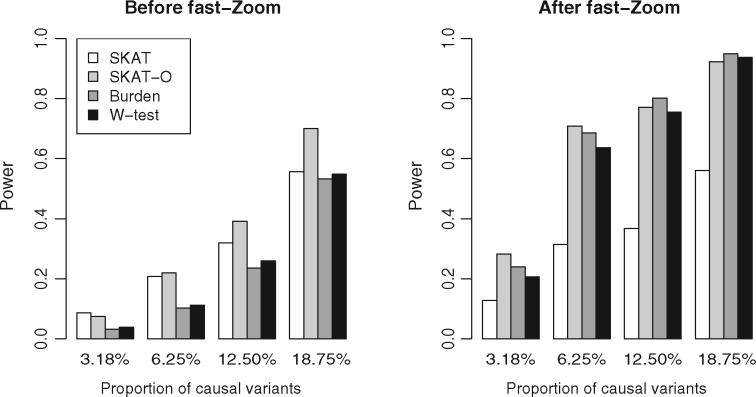
Power of fast-Zoom at different causal variant proportions. Under scenario I and different causal variant proportions, the power of all tests improved when applied with fast-Zoom. Tests with burden-property had more rapid power gain as the causal variant proportion increased
3.1.4 Performance of fast-Zoom at different causal variants proportions
Simulation datasets were generated to carry different causal variant proportions. Without fast-Zoom, as the causal variant proportion increased from 3.18 to 6.25%, the power of burden test increased from 3.2 to 10.3%, and the power of SKAT increased from 8.6 to 20.7%. With fast-Zoom, the power of burden test increased from 23.9 to 68.6%; while the power of SKAT increased from 12.7 to 31.4%. Again, burden tests enjoyed more power enhancement by fast-Zoom as the causal variant proportion increased.
3.1.5 Performance of Focusing
The effect of Focusing is shown by comparing the ROC curves of the Zooming and ZFA in Figure 3. The figure showed that by applying the Zooming step alone, there was already considerable power, and the Focusing step further boosted the overall performance. The binary partition of Zooming resulted in discontinuous optimal regions, and the true and false positive rates were returned as intervals, thus the ROC curves showed forms of step function.
Fig. 3.
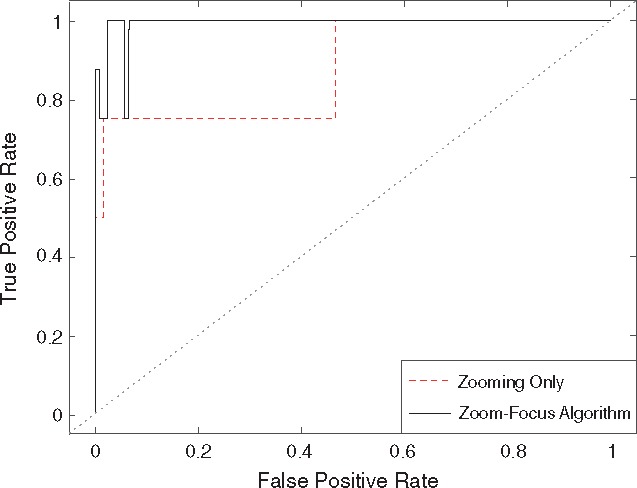
Comparison of ROC curves of Zooming and ZFA. The performance of the rare variant test can be further improved by Focusing
3.2 Computation time
On a laptop computer with 2.3 GHz CPU and 4GB memory, the unit time elapsed for Zooming in a genetic region of 128 variants on 2000 subjects was 9.51 s by SKAT, 26.90 s by SKAT-O, 8.55 s by burden test and 0.12 s by W-test (Table 2). Zooming with W-test was tens of times faster than burden test and SKAT, and hundreds of times faster than SKAT-O. In real data, ZFA with W-test took <10 min to analyse the exome region of one chromosome containing 41 788 variants.
Table 2.
Computing time of different methods (seconds)
| SKAT | SKAT-O | Burden | W-test | |
|---|---|---|---|---|
| Zooming | 9.51 | 26.90 | 8.55 | 0.12 |
| Fast-Zoom | 1.96 | 6.17 | 1.51 | 0.04 |
3.3 Real data application
ZFA was applied on chromosome 3 of the real whole exome sequencing data of hypertensive disorder. ZFA with W-test identified one region of significant P-value (MSL2/PCCB, P-value = 1.04 × 10⁻⁵). Another gene ITPR1 (P-value = 6.36 × 10⁻³) was listed for comparison (Table 3). Before testing region optimization, the gene MSL2/PCCB contained 85 variants and the P-value was 0.279, which meant that it would be undetectable by a gene-based method without ZFA; after ZFA, the final testing region included 27 variants and was statistically significant after multiple testing corrections. Different initial window sizes were applied and ZFA gave the same optimal regions (Supplementary Material S3). This showed that the method was quite robust. The gene MSL2/PCCB was previously reported to be associated with lipid and metabolic disorders (Dehghan et al., 2009; Willer et al., 2013). The results showed that ZFA could enhance the effective selection of rare variants with disease association on exome sequencing data. The phenotypes were permuted 1000 times to evaluate false positives on real data, and the average false positive rate was below 1%, which indicated that there was no inflation of spurious association.
Table 3.
Genes detected by ZFA with W-test on chromosome 3 of real hypertensive disorder data
| Gene | No. of variants in gene | Gene-based P-value | No. of variants in ZFA optimized region | P-value of optimized regiona |
|---|---|---|---|---|
| MSL2 | 85 | 0.279 | 27 | 1.04 × 10⁻⁵ |
| ITPR1 | 251 | 0.853 | 29 | 6.36 × 10⁻³ |
Bonferroni corrected significance level is 6.1 × 10⁻⁵ (details in Section 2.6).
4 Discussion
Rare variant association tests improve the testing power on exome data by jointly considering the effect of many rare variants. The grouping of variants is often based on prior biological knowledge or a fixed genomic region. However, functional annotation of rare variants is still evolving; there are multiple platforms to determine the actual regions of genes, some with overlapping boundaries (ENCODE Project Consortium, 2012; Kircher et al., 2014; Maurano et al., 2012). There is also no consensus on whether the promoters, untranslated regions or introns should be included in gene-based tests (Auer and Lettre, 2015). For coding variants, it is likely that only parts of them are functional and others represent random genetic variation (Ionita-Laza et al., 2014a,b). The problem is more serious with increasing sequencing depth—a gene easily spans two to three thousand variants. The power of direct application of aggregation tests could be affected by the large proportion of noise; therefore, it is crucial to determine the region of testing as a starting point.
The motivation of ZFA is to locate an optimal region with maximum association information, and to exclude noise based on information from the data. In fact, the Zooming step performs a feature selection within a given genomic region; the features are variant-clusters of varying sizes. Based on the best partition, boundaries are further refined by adding or subtracting adjacent variants surrounding them. In this way, noise can be discarded and statistical power can be improved. Simulation studies demonstrated that the ZFA can boost the power of various rare variant tests by several fold.
One challenge of the region optimization problem is how to compare bins fairly from different partition orders. In ZFA, this is solved by weighting each bin using the number of cuts nr in its partition order (Equation 1). The weight corrects for multiple tests arising from different partition levels, and projects the P-values onto the same plane for comparison. A related but different problem is the final P-value calculation in Equation (4), in which the P-value is adjusted by the total number of multiple tests occurring in the global procedure. Note that this step does not change the optimal testing region, which is already determined by optimizing Equation 1. Since the total number of tests in ZFA is related to the initial window size P, the correction implicitly considers the number of maximum partition order R, which is about log2(P), and the number of bins in each partition order. However, multiple testing corrections using the Bonferroni method are conservative, which result in the conservative type I error rates of ZFA.
In real data analysis of one chromosome by ZFA, the gene MSL2/PCCB was found to have significant P-value. The MSL2 is a subunit of a protein complex that functions in chromatin modification, and the protein encoded by PCCB is a subunit of the propionyl-CoA carboxylase enzyme. Application of ZFA with rare variant aggregation tests increased the chance of identifying disease susceptible loci. More experiments are needed to confirm the discovered region’s underlying biological functions related to disease.
To conclude, we propose a ZFA to locate the optimal testing region for rare variant association tests. The method is flexible—it can be applied together with various existing rare variant tests and is computationally efficient. The method is a practical and powerful approach to elucidate the role of rare variants in complex disorders for large genome studies.
Supplementary Material
Acknowledgements
This article is dedicated to Prof. David O. Siegmund for his 75th birthday.
Funding
This work was supported by the National Science Foundation of China [81473035, 31401124 to M.H.W.], and the Health and Medical Research Fund [Project reference no: CU-16-C11 to K.C.C.] of Food and Health Bureau of the Hong Kong Special Administrative Region Government. This study makes use of data provided by the Genetic Analysis Workshop 19 (GAW19), funded by the National Institutes of Health through grant R01 GM031575. This study makes use of data provided by the Genetic Analysis Workshop 19 (GAW19), funded by the National Institutes of Health through grant R01 GM031575.
Conflict of Interest: none declared.
References
- ENCODE Project Consortium. (2012) An integrated encyclopedia of DNA elements in the human genome. Nature, 489, 57–74. [DOI] [PMC free article] [PubMed] [Google Scholar]
- Allen H.L. et al. (2010) Hundreds of variants clustered in genomic loci and biological pathways affect human height. Nature, 467, 832–838. [DOI] [PMC free article] [PubMed] [Google Scholar]
- Ashley E.A. (2015) The precision medicine initiative: a new national effort. JAMA, 313, 2119–2120. [DOI] [PubMed] [Google Scholar]
- Auer P.L., Lettre G. (2015) Rare variant association studies: considerations, challenges and opportunities. Genome Med., 7, 16.. [DOI] [PMC free article] [PubMed] [Google Scholar]
- Auffray C. et al. (2016) From genomic medicine to precision medicine: highlights of 2015. Genome Med., 8, 1. [DOI] [PMC free article] [PubMed] [Google Scholar]
- Consortium G.P. (2015) A global reference for human genetic variation. Nature, 526, 68–74. [DOI] [PMC free article] [PubMed] [Google Scholar]
- Cyranoski D. (2016) China embraces precision medicine on a massive scale. Nature, 529, 9–10. [DOI] [PubMed] [Google Scholar]
- Dehghan A. et al. (2009) Association of novel genetic loci with circulating fibrinogen levels a genome-wide association study in 6 population-based cohorts. Circ. Cardiovasc. Gene, 2, 125. [DOI] [PMC free article] [PubMed] [Google Scholar]
- Hoh J., Ott J. (2000) Scan statistics to scan markers for susceptibility genes. Proc. Natl. Acad. Sci. USA, 97, 9615–9617. [DOI] [PMC free article] [PubMed] [Google Scholar]
- Ionita-Laza I. et al. (2014a) Identification of rare causal variants in sequence-based studies: methods and applications to VPS13B, a gene involved in cohen syndrome and autism. PLoS Genet., 10, e1004729. [DOI] [PMC free article] [PubMed] [Google Scholar]
- Ionita-Laza I. et al. (2014b) Scan statistic-based analysis of exome sequencing data identifies FAN1 at 15q13.3 as a susceptibility gene for schizophrenia and autism. Proc. Natl. Acad. Sci. USA, 111, 343–348. [DOI] [PMC free article] [PubMed] [Google Scholar]
- Jameson J.L., Longo D.L. (2015) Precision medicine—personalized, problematic, and promising. N. Engl. J. Med., 372, 2229–2234. [DOI] [PubMed] [Google Scholar]
- Kircher M. et al. (2014) A general framework for estimating the relative pathogenicity of human genetic variants. Nat. Genet., 46, 310–315. [DOI] [PMC free article] [PubMed] [Google Scholar]
- Laurie C.C. et al. (2010) Quality control and quality assurance in genotypic data for genome - wide association studies. Genetic epidemiology, 34, 591–602. [DOI] [PMC free article] [PubMed] [Google Scholar]
- Lee S. et al. (2014) Rare-variant association analysis: study designs and statistical tests. Am. J. Hum. Genet., 95, 5–23. [DOI] [PMC free article] [PubMed] [Google Scholar]
- Lee S. et al. (2012) Optimal tests for rare variant effects in sequencing association studies. Biostatistics, 13, 762–775. [DOI] [PMC free article] [PubMed] [Google Scholar]
- Li B., Leal S.M. (2008) Methods for detecting associations with rare variants for common diseases: application to analysis of sequence data. Am. J. Hum. Genet., 83, 311–321. [DOI] [PMC free article] [PubMed] [Google Scholar]
- Liu D.J., Leal S.M. (2010) A novel adaptive method for the analysis of next-generation sequencing data to detect complex trait associations with rare variants due to gene main effects and interactions. PLoS Genet., 6, e1001156.. [DOI] [PMC free article] [PubMed] [Google Scholar]
- Madsen B.E., Browning S.R. (2009) A groupwise association test for rare mutations using a weighted sum statistic. PLoS Genet., 5, e1000384.. [DOI] [PMC free article] [PubMed] [Google Scholar]
- Maurano M.T. et al. (2012) Systematic localization of common disease-associated variation in regulatory DNA. Science, 337, 1190–1195. [DOI] [PMC free article] [PubMed] [Google Scholar]
- Neale B.M. et al. (2011) Testing for an unusual distribution of rare variants. PLoS Genet., 7, e1001322. [DOI] [PMC free article] [PubMed] [Google Scholar]
- Pearson T.A., Manolio T.A. (2008) How to interpret a genome-wide association study. JAMA, 299, 1335–1344. [DOI] [PubMed] [Google Scholar]
- Raab J.R., Kamakaka R.T. (2010) Insulators and promoters: closer than we think. Nat. Rev. Genet., 11, 439–446. [DOI] [PMC free article] [PubMed] [Google Scholar]
- Robertson S.P. et al. (2003) Localized mutations in the gene encoding the cytoskeletal protein filamin A cause diverse malformations in humans. Nat. Genet., 33, 487–491. [DOI] [PubMed] [Google Scholar]
- Santorico S.A., Hendricks A.E. (2016) Progress in methods for rare variant association. BMC Genet., 17, 57. [DOI] [PMC free article] [PubMed] [Google Scholar]
- Sha Q. et al. (2012) Detecting association of rare and common variants by testing an optimally weighted combination of variants. Genet. Epidemiol., 36, 561–571. [DOI] [PubMed] [Google Scholar]
- Sham PC., Purcell S.M (2014) Statistical power and significance testing in large-scale genetic studies. Nat. Rev. Genet., 15, 335–346. [DOI] [PubMed] [Google Scholar]
- Sun R. et al. (2016) AW‐test collapsing method for rare‐variant association testing in exome sequencing data. Genet. Epidemiol., 40, 591–596. [DOI] [PubMed] [Google Scholar]
- Wang M.H. et al. (2016) A fast and powerful W-test for pairwise epistasis testing. Nucleic Acids Res., 44, e115. [DOI] [PMC free article] [PubMed] [Google Scholar]
- Willer C.J. et al. (2013) Discovery and refinement of loci associated with lipid levels. Nat. Genet., 45, 1274. +. [DOI] [PMC free article] [PubMed] [Google Scholar]
- Wu M.C. et al. (2011) Rare-variant association testing for sequencing data with the sequence Kernel association test. Am. J. Hum. Genet., 89, 82–93. [DOI] [PMC free article] [PubMed] [Google Scholar]
- Yue P. et al. (2010) Inferring the functional effects of mutation through clusters of mutations in homologous proteins. Hum. Mut., 31, 264–271. [DOI] [PubMed] [Google Scholar]
Associated Data
This section collects any data citations, data availability statements, or supplementary materials included in this article.


