

Abstract
The CTCF protein has emerged as a key architectural protein involved in genome organization. Although hypothesized to initiate DNA looping, direct evidence of CTCF-induced DNA loop formation is still missing. Several studies have shown that the eleven zinc finger (11 ZF) domain of CTCF is actively involved in DNA binding. We here use atomic force microscopy (AFM) to examine the effect of the 11 zinc finger (ZF) domain comprising residues 266–579 (11 ZF CTCF) and the 3 ZF domain comprising residues 402–494 (6–8 ZF CTCF) of human CTCF on the DNA morphology. Our results show that both domains alter the DNA architecture from the relaxed morphology observed in control DNA samples to compact circular complexes, meshes, and networks, offering important insights into the multivalent character of the 11 ZF CTCF domain. AFM images reveal quasi-circular DNA/CTCF complexes, which are destabilized upon replacing the 11 ZF CTCF by the 6–8 ZF CTCF domain, highlighting the role of the 11 ZF motif in loop formation. Intriguingly, formation of circular DNA/CTCF complexes is dominated by non-specific binding, whereby contour length and height profiles suggest a single DNA molecule twice wrapped around the protein.
Keywords: atomic force microscopy, DNA, CTCF, protein-DNA interactions, DNA loop formation
Graphical abstract
Introduction
Higher eukaryotes are characterized by a hierarchical organization of the genome in the nucleus of the cell. Within each chromosome, DNA is wrapped around histones to form 10-nm thick chromatin fibers, which then further organize into complex higher-order structures [1]. The organization of the chromatin structure is facilitated by architectural proteins, of which the CTCF protein is emerging as “the master weaver” of the genome [2]. CTCF was first identified in chicken as a negative regulator of the c-myc oncogene [3] and the lysozyme gene [4]. Since then, CTCF was shown to be involved in a variety of biological functions, including gene repression, chromosome insulator function, X-chromosome inactivation, and genomic imprinting [5–7]. There are 55,000–65,000 CTCF binding sites present in mammalian genomes [8]. CTCF is hypothesized to facilitate interactions between transcription regulatory sequences, both in cis and in trans, thereby linking the spatial organization of the genome to its function [9].
CTCF is characterized by eleven zinc fingers (11 ZFs) in the central DNA-binding domain, flanked by unstructured N- and C-terminal domains (Fig. 1) [10]. The ZF domain has a well defined globular structure and is stabilized through the binding of zinc ions to cysteine and histidine residues [10]. The secondary structure of each ZF consists of a double-stranded antiparallel β-sheet and an α-helix [11]. The central domain with 11 ZFs displays almost 100% homology among the mouse, chicken and human forms of the protein and is highly conserved from fruit fly to human, suggesting its functional importance. CTCF was named after its affinity to bind to the CCCTC motif [7, 12, 13]. However, considerable nucleotide variability exists within this core binding motif across the genome [7] and a substantial number of binding sites lack the consensus sequence altogether [14]. According to the “CTCF code” hypothesis, CTCF recognizes diverse DNA sequences through combinatorial usage of its 11 ZFs [15]. Several studies, in which the effect of deletion of a specific ZF on the binding ability of CTCF was examined, demonstrated that CTCF binds to different consensus sites using different combinations of its 11 ZFs [16, 17]. It was further shown that only four or five ZFs are required to bind to each consensus site [18]. A recent study of CTCF multivalent binding to ∼50,000 sites by Nakahashi et al. revealed that CTCF uses ZFs 4–7 to bind to ∼80% sites with the consensus motif, whereas ZFs 1–2 and ZFs 8–11 bind to non-conserved flanking sequences [19].
Fig. 1. Schematic figure of full-length CTCF protein.
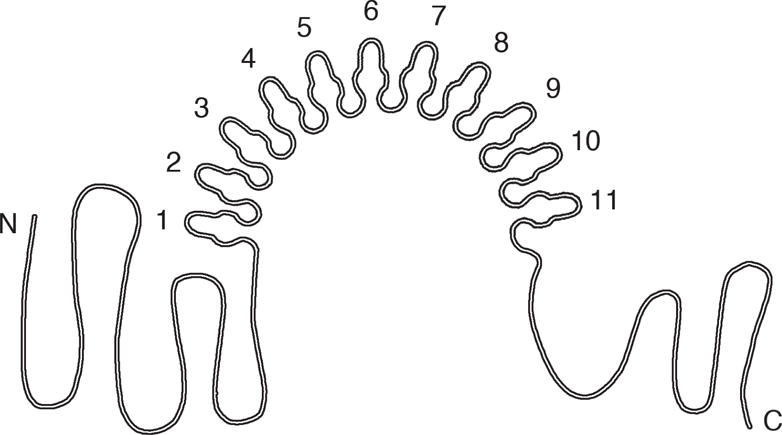
CTCF comprises an 11 ZF motif flanked by unstructured N- and C-termini [10]. The ZFs are stabilized by zinc ions bound to cysteine and histidine residues. The N- and C-terminal domains are not included in the the two CTCF domains used in our study. The 11 ZF CTCF domain contains the central region from the 1st through the 11th ZF, whereas the 6–8 ZF CTCF domain contains the 6th, 7th, and 8th ZFs only.
CTCF binding to DNA is essential for mediating long-range chromatin contacts [13]. For example, the knockdown of CTCF disrupts long-range chromatin interactions at the β-globin locus in chicken cells [20]. The CTCF binding to DNA is required for long-range chromatin interactions at the H19/IGF2 imprinting control region [21]. An essential characteristic of CTCF as an architectural protein may be its ability to bring sequences that are far apart in the linear genome into close proximity. The exact mechanism of CTCF binding and its effect on the DNA conformation is not well understood. Several studies suggest that CTCF induces long-range chromatin looping [2,13,20,22–24]. In an in vitro study, MacPherson and Sadowski reported a unique and unusual DNA structure with aberrant electrophoretic mobility that was induced by CTCF binding to the chicken HS4 β-globin FII insulator site [25]. The authors hypothesized that this structure represents a CTCF-bound DNA loop [25]. Although the above studies are consistent with the existence of CTCF-induced chromatin looping, no direct evidence of CTCF-induced DNA loop complex has been reported so far.
Atomic force microscopy (AFM) is a powerful technique for imaging individual DNA molecules and DNA/protein complexes at ∼10 nm resolution. In numerous studies, AFM imaging has been applied to demonstrate protein-induced changes in DNA morphology [26–32]. DNA was shown to adopt relaxed or stretched conformations [26] and to form supercoiled structures [27]. AFM revealed ternary complexes of DNA with one of the most abundant proteins in E. coli (H-NS) and RNA polymerase subunit σ70, whereby σ70 acted as a co-factor for H-NS-induced DNA looping [28]. In the present study, AFM is applied to examine the effect of human 11 ZF motif of CTCF (11 ZF CTCF) on the morphology of a ∼1,000 base pairs (bp)-long DNA derived from the Kaposi’s Sarcoma-associated Herpes Virus (KSHV). This DNA, which contains a cluster of three CTCF binding sites at the KSHV latency control region, is know to colocalize with cohesins, to alter nucleosome position and to form a higher-order DNA loop with lytic control region of KSHV genome as characterized in vitro by DNase I footprinting and in vivo by ChIP-sequencing [33–35]. We examined DNA morphology in the presence of the 11 ZF CTCF domain (11 ZF CTCF) containing the 1st through the 11th ZF (residues 266–579) as well as the 3 ZF CTCF domain (6–8 ZF CTCF) containing the 6th, 7th, and 8th ZF (residues 402–494). The results of our study demonstrate that in the presence of CTCF, DNA adopts distinct morphologies, including networks, meshes and novel quasi-circular DNA complexes. These circular complexes do not form in the absence of CTCF and their formation is not dominated by specific binding. The measured dimensions of the circular DNA/CTCF complexes suggest that they consist of DNA approximately twice wrapped around the 11 ZF CTCF domain.
Results
Control DNA samples display relaxed DNA morphologies
DNA samples both with (WT DNA) and without (MT DNA) specific binding sites were examined in the absence of CTCF. Both variants of the DNA used in the present study were 941 bp in length. WT DNA possessed three specific CTCF binding sites located at 435–454 (GTGACCA-CAAGGGGGAGCTC), 502–521 (ATGGCCACAGGATGGAGATC), and 570–589 (TGGCCACCA-GATGGCACGCG). The sequence of MT DNA was mutated to remove specific binding sites from the DNA sequence. The full sequences of both WT and MT DNA are reported in the Supporting Information. Incubation of samples on the mica surface was followed by gentle rinsing to remove salt and thereby improve the image clarity, which also removed some of the sample from the surface. Estimating that after rinsing, two thirds of DNA (or ∼10 μL) remained on the 1 cm × 1 cm-area mica surface, there should be ∼60 DNA molecules left on the mica. Despite some variability in the amount of DNA remaining on the mica surface after rinsing, the morphology of the observed DNA was consistent across all images (Fig. S1). DNA molecules were uniformly distributed across all samples and displayed mostly relaxed conformations (Fig. 2A). At the highest DNA number density, network-like conformations were observed (Fig. S1D). WT and MT DNA exhibited similar morphologies. The uniform distribution of DNA molecules across the mica surface can be attributed to overall repulsive interactions among the negatively charged DNA molecules, as reported previously [26,36].
Fig. 2. AFM images of control DNA.
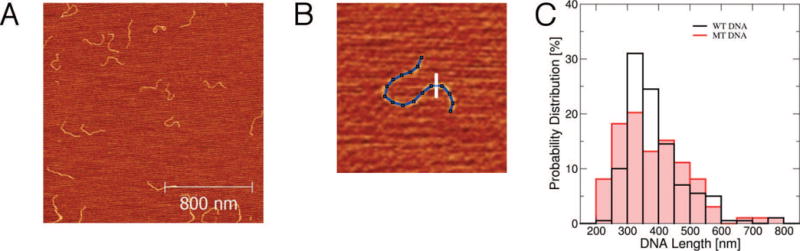
(A) An AFM image with control DNA molecules in relaxed conformations. (B) Measurements of DNA heights (along the white line) and lengths (blue contour line) of individual DNA molecules. Image dimensions are 310 nm × 310 nm. (C) The distributions of WT DNA and MT DNA lengths as measured by tracing 200 and 100 individual DNA molecules, respectively, in the AFM images by ImageJ. The average length and its standard deviation are 315±40 nm and 380±110 nm for WT DNA and MT DNA, respectively.
Using ImageJ, both DNA heights and lengths were recorded by tracing DNA molecules on digitized images (Fig. 2B). The measured heights of 0.4–0.6 nm were 4-fold smaller than the actual DNA diameter of 2 nm, which occurs when the AFM tip compresses DNA during tapping due to water-mediated attractive interactions between the tip and DNA [37]. The length distribution of WT DNA (MT DNA) with the average and standard deviation of 315±40 nm (380±110 nm) is plotted in Fig. 2C. The average length was consistent with the estimated length of DNA in the B-conformation, based on the known number of base pairs (941) and linear density (0.34 nm/bp), resulting in 941 × 0.34 nm = 320 nm. The rather large standard deviations in DNA length measurements was likely caused by (i) finite imaging resolution (4–6 nm/pixel), (ii) errors in manual tracing of curvilinear DNA conformations and/or (iii) partial intrinsic changes from B- to A-conformation upon DNA transitioning from the solvent (buffer) to dry (air) environment on the mica surface, which can affect the DNA length [38]. The measured lengths of both WT DNA and MT DNA were consistent with the source specifications.
Characterization of CTCF protein domains
Based on DNA sequences, molecular weights of the 11 ZF CTCF and 6–8 ZF CTCF domains are 37.7 kDa and 11 kDa, respectively. Both domains, each with the MBP tag of ∼42.5 kDa attached to the N-terminus, were estimated to be >90% pure and migrated with expected mobility. The molecular weights of tagged 11 ZF and 6–8 ZF CTCF domains were thus expected to be ∼80 kDa and ∼55 kDa, respectively. To verify these anticipated molecular weights, the 11 ZF and 6–8 ZF CTCF domains were analyzed by gel electrophoresis followed by colloidal blue staining, which resulted in expected molecular weights (Fig. 3A).
Fig. 3. Characterization of DNA and CTCF by gel electrophoresis and EMSA.
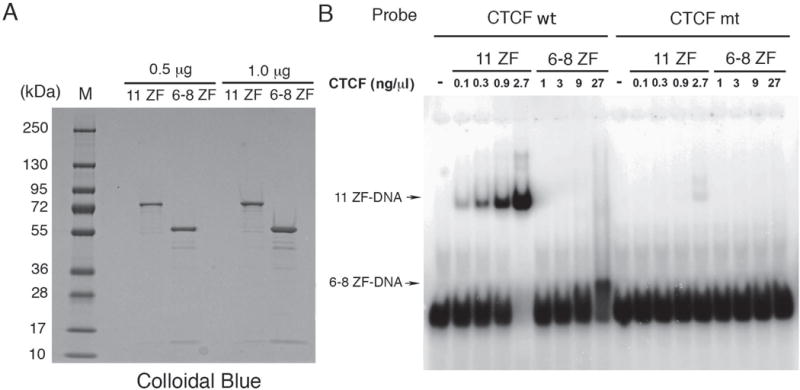
(A) 11 ZF and 6–8 ZF MBP-CTCF fusion proteins at 1.0 or 0.5 μg assayed by SDS-PAGE and visualized with Colloidal blue staining. Molecular weight markers are indicated (M). (B) EMSA analysis of 11 ZF or 6–8 ZF CTCF at 0, 0.1, 0.3, 0.9, and 2.7 ng/μL and 0, 1, 3, 9, and 27 ng/μL, respectively, incubated with either CTCF wt or CTCF mt radiolabeled DNA probes. 11 ZF and 6–8 ZF CTCF bound DNA complexes are indicated by arrows.
Electrophoretic mobility shift assay (EMSA) experiments were then performed to characterize DNA binding activity of the two MBP-CTCF fusion protein domains. These measurements served as a protein quality control to show that the purified CTCF domains displayed DNA binding activity. We compared the affinities of the 11 ZF and 6–8 ZF CTCF domains for binding to either consensus CTCF binding sites (CTCF wt) or to CTCF mutated sites that lacked specific binding sites (CTCF mt). 11 ZF CTCF bound strongly to the wt probe, generating a WT DNA/protein complex of expected mobility. In contrast, 6–8 ZF CTCF bound weakly to the wt probe and generated a WT DNA/protein complex that migrated with much faster in the EMSA (Fig. 3B). The dissociation constant of 11 ZF CTCF binding to the consensus CTCF binding sites was estimated from EMSA measurements (Fig. S2A) and the resulting binding curve (Fig. S2B) to be 9.9 nM, whereas the dissociation constant of 6–8 ZF CTCF to the consensus CTCF binding sites could not be determined. 11 ZF CTCF bound the mt probe only at the highest concentration, while 6–8 ZF CTCF did not show detectable binding (Fig. 3B). Due to low binding affinities, the dissociation constants for 11 ZF CTCF and 6–8 ZF CTCF binding to the mutated DNA binding sites could not be determined. Although the MBP tag could have affected binding affinities of the two CTCF domains, it is more likely and consistent with previous findings that 6–8 ZF CTCF had a significantly lower binding affinity than 11 ZF CTCF. These results thus provide evidence that the 11 ZF CTCF domain binds DNA probes with specific binding sites with a higher affinity and lower electrophoretic mobility than the 6–8 ZF CTCF domain.
Protein control samples with either 11 ZF CTCF or 6–8 ZF CTCF were prepared in the same buffer as DNA control samples and thus contained Mg2+ ions as an essential component needed for DNA to adhere to the mica surface. AFM images of protein control samples revealed small circular protein signals that most likely represented monomeric CTCF (Fig. 4A-B, black arrows), consistent with the results of size exclusion chromatography characterization performed on protein preparations prior to AFM imaging, which showed eluted volumes corresponding to monomeric proteins. Larger irregularly-shaped signals, most likely representing proteins multimers (aggregated forms of CTCF), were also observed (Fig. 4A-B, green arrows). Using Image J, we measured the heights and diameters of the observed 11 ZF CTCF and 6–8 ZF CTCF signals (Fig. 4C, inserts). The analysis of diameters and heights of both protein domains revealed distinct diameter and height distributions (Fig. 4C, top versus bottom graph). The average and standard deviation diameter (height) values were 67±13 nm (6±4 nm) and 49±6 nm (3±0.5 nm) for 11 ZF CTCF and 6–8 ZF CTCF, respectively. As expected, both diameters and heights of 11 ZF CTCF were larger than the corresponding dimensions of 6–8 ZF CTCF (Fig. 4C).
Fig. 4. AFM images of control CTCF and volumetric calibration of molecular weight.
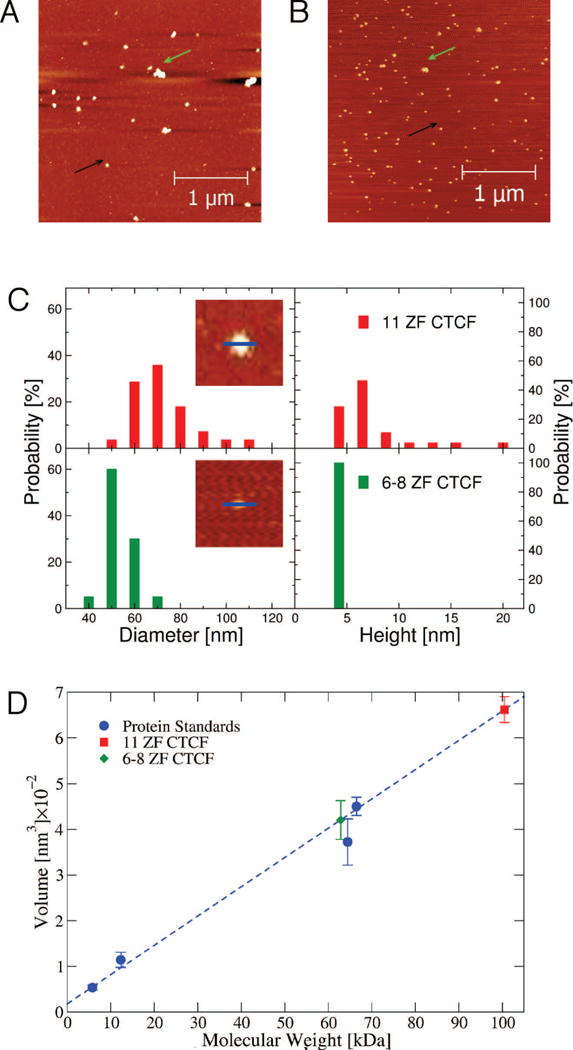
AFM images of control (A) 11 ZF CTCF and (B) 6–8 ZF CTCF protein samples with small circular (black arrows) as well as larger aggregated (green arrows) signals. (C) Distributions of diameters and heights of 11 ZF CTCF (top) and 6–8 ZF CTCF (bottom). There were 25 11 ZF CTCF and 20 6–8 ZF CTCF proteins measured by ImageJ for the distributions. The two inserted images (310 nm × 310 nm) of 11 ZF CTCF (top) and 6–8 ZF CTCF (bottom) show directions (blue lines) along which lateral dimensions (diameters) and heights of protein signals were measured. (D) Volume dependence on molecular weight is calibrated with volume measurements from AFM images of insulin (5.808 kDa), cytochrome c (12.327 kDa), hemoglobin (64.458 kDa), and BSA (66.463 kDa) (blue circles): V = 6.41 nm3/kDa × (MW) + 17.87 nm3 with R2 = 0.97 (blue dashed line). The calculated molecular weight for 11 ZF CTCF of 100.49±39.93 kDa was determined using the measured volume of 662.08±28.06 nm3 (red square). The calculated molecular weight for 6–8 ZF CTCF of 62.82±25.69 kDa was determined using the measured volume of 420.62±42.55 nm3 (green diamond). The number of protein samples measured for 11 ZF and 6–8 ZF CTCF are 97 and 96, respectively. Histograms of the volume distributions for either sample are presented in Fig. S3. Error bars are given as SEM values.
The average volumes of four protein standards were extracted from AFM images using the WSxM software package [39]. These volumes were plotted against the respective protein molecular weights to generate a volumetric calibration curve in order to extrapolate molecular weights based on measurements of protein volumes from AFM images, as described in Materials and Methods (Fig. 4D). Using this method, the average molecular weight of 11 ZF CTCF protein signals was estimated from AFM images to be 100.49±39.93 kDa, which falls between molecular weights of a monomer (80 kDa) and dimer (160 kDa). The molecular weight of 6–8 ZF CTCF was estimated to be 62.82±25.69 kDa, in agreement with gel electrophoresis (Fig. 3A). As expected, the molecular weight is lower than that of 11 ZF CTCF, consistent with the diameter and height analysis obtained from AFM images using Image J. The respective distributions of volume measurements for 11 ZF CTCF and 6–8 ZF CTCF protein signals are shown in Fig. S3. A previous AFM study that reported volume distributions of protein signals yielded symmetric Gaussian distributions [40]. Our volume distributions of 11 ZF CTCF and 6–8 ZF CTCF signals revealed right-skewed Gaussian distributions with peaks at ∼190 nm3 for 11 ZF CTCF ∼65 nm3 for 6–8 ZF CTCF (Fig. S3).
It could be argued that if a distribution is non-symmetric Gaussian (in our case, right-skewed Gaussian), the median of the distribution is a better representation of the average than its mean value, which was used in the estimation of the molecular weights in Fig. 4D. We thus calculated the molecular weights of the two CTCF domains by also using the median and the mode of the two respective volume distributions. The results shown in Fig. S4 demonstrate that both the median and even more so the mode shifts the calculated molecular weights to lower values relative to the weights derived based on the mean values of the volume distributions. The mode of the volume distributions resulted in molecular weights of 26.46 kDa and 6.91 kDa for 11 ZF and 6–8 ZF CTCF, respectively, that were significantly smaller than molecular weights of the CTCF monomers (Fig. S4, green symbols). The median and the interquartile range of the volume distribution yielded molecular weights of 72.93 kDa and 47.92 kDa for 11 ZF and 6–8 ZF CTCF, respectively, which are in the best agreement with the actual molecular weights of the monomeric CTCF domains (Fig. S4, red symbols).
We then estimated the percentage of aggregated proteins using the volume distributions combined with the volumetric calibration curve. The molecular weights of 11 ZF CTCF and 6–8 ZF CTCF dimers, 160 kDa and 90 kDa, correspond to volumes of 1060 nm3 and 740 nm3, respectively. Any protein signal with a larger volume was identified as an aggregate, resulting in 20% of all 11 ZF CTCF signals and 13% of all 6–8 ZF CTCF signals corresponding to dimers or larger aggregates. The above analysis supports our observation that control protein signals were predominantly monomeric.
CTCF significantly alters DNA morphology
AFM images revealed that in the absence of CTCF, both WT DNA and MT DNA adopted predominantly relaxed conformations. The EMSA results showed that both CTCF proteins were able to bind DNA probes with specific binding sites but the binding affinity was significantly higher for 11 ZF CTCF than for 6–8 ZF CTCF, consistent with previously published research implicating the ZF motif of CTCF in its binding to DNA. We here asked whether or not the presence of CTCF alters the DNA morphology observed by AFM. In addition to WT DNA control samples described above, we prepared samples of WT DNA incubated with 11 ZF CTCF or 6–8 ZF CTCF. To address the importance of specific binding, we also prepared samples of MT DNA incubated with 11 ZF CTCF. Multiple samples (between 19 and 30) of each sample types were prepared and 5–10 images per sample acquired, resulting in 100–300 AFM images for each of the five sample types (control WT DNA, control MT DNA, WT DNA/11 ZF CTCF, WT DNA/6–8 ZF CTCF, and MT DNA/11 ZF CTCF). In all five cases, we followed the preparation protocol, which is described in Materials and Methods.
To quantify the extent to which DNA morphology is affected by CTCF, the number of samples that displayed exclusively relaxed DNA conformations on all images was counted. The number of samples characterized by relaxed DNA conformations (Figs. 2A and S1) was 26 out of 30 (∼87%) for the WT DNA control, 14 out of 19 (∼74%) for the MT DNA control, 10 out of 26 (∼38%) for the WT DNA incubated with 11 ZF CTCF, 18 out of 28 (∼64%) for the WT DNA incubated with 6–8 ZF CTCF, and 7 out of 28 (∼25%) for the MT DNA incubated with 11 ZF CTCF. The remaining samples did not exhibit relaxed DNA conformations on any image. The above statistical analysis of samples was subjected to chi-square test to find statistical significance of differences in the occurrence of relaxed DNA conformations among the five sample types. Table 1 shows the results of the pairwise comparisons with the corresponding p-values, which indicate that 11 ZF CTCF altered both WT DNA and MT DNA morphologies in a statistically significant way. Both 11 ZF CTCF and 6–8 ZF CTCF significantly altered the WT DNA morphology as compared to the control WT DNA samples, which showed predominantly relaxed conformations. However, the 11 ZF CTCF (p-value <0.001) was significantly more efficient in modifying the WT DNA morphology than 6–8 ZF CTCF (p-value <0.01), implying that the ZF motif of CTCF is actively involved in DNA binding that subsequently alters its morphology.
Table 1. Statistical analysis of the occurrence of relaxed versus non-relaxed DNA conformations for five different DNA sample types.
The five sample types, WT DNA control, MT DNA control, WT DNA with 11 ZF CTCF, WT DNA with 6–8 ZF CTCF, and MT DNA with 11 ZF CTCF. The five sample types displayed significantly different occurrences of relaxed versus non-relaxed DNA morphologies as indicated by the chi-square test sums and p-values (in square brackets).
| chi-square sum [p-value] | WT DNA | MT DNA | WT DNA/6–8 ZF | WT DNA/11 ZF | MT DNA/11 ZF |
|---|---|---|---|---|---|
| WT DNA | 0 [1] | 1.79 [0.18] | 4.61 [0.04]* | 22.78 [<10−5]* | 22.81 [<10−5]* |
| MT DNA | 0 [1] | 0.46 [0.50] | 10.53 [0.001]* | 10.85 [<0.001]* | |
| WT DNA/6–8 ZF | 0 [1] | 7.64 [<0.01]* | 8.74 [0.003]* | ||
| WT DNA/11 ZF | 0 [1] | 0.12 [0.73] | |||
| MT DNA/l1 ZF | 0 [1] |
CTCF-induced DNA morphologies
Whereas relaxed conformations dominated the control DNA samples, both WT DNA and MT DNA samples incubated with 11 ZF CTCF displayed several distinct DNA morphologies. In addition to relaxed DNA conformation, we observed compact circular complexes, meshes, and networks (Figs. 5A-D and S5A-D). Relaxed conformations (Fig. 5A) resembled those found in control DNA samples, i.e., extended random-coil-like molecules of length ∼320±40 nm and height ∼0.6 nm. A close inspection revealed protein signals bound to relaxed DNA. In Fig. 5A, blue arrows point to individual DNA molecules with two protein signals bound and green arrows point to DNA molecules with protein signals bound to a DNA end. Thus, 11 ZF CTCF displayed the capacity to bind multiple DNA sites, including ends that lacked specific binding sites. Compact DNA morphologies (Fig. 5B) were characterized by collapsed DNA of various shapes and uniform heights of 1.5–2 nm intermingled with CTCF signals with heights of 4–10 nm. We further identified a subset of compact conformations comprising a quasi-circular DNA complex with a protein signal at the center (Fig. 5B, black arrows). The remaining compact structures were irregularly-shaped collapsed DNA meshes intertwined with multiple protein signals (Fig. 5C, black arrows), which co-existed with larger, elongated meshes comprising multiple DNA molecules (Fig. 5C). The heights of these meshes and protein signals were 1.5–2 nm and 4–10 nm, respectively. The increased heights of the DNA within these meshes relative to heights of relaxed DNA were likely due to overlapping DNA strands within meshes, which resembled the mesh morphology observed in control DNA samples. Lateral dimensions of elongated meshes surpassed the length of a single DNA molecule, indicating that meshes were likely comprised of multiple DNA molecules. In contrast to DNA meshes, which were isolated from each other, the network morphology consisted of homogeneously distributed interconnected DNA molecules that spanned the entire visible region of AFM images and appeared to have been held together by numerous protein signals (Fig. 5D). Although DNA meshes and network morphologies were observed in DNA control samples, their relative occurrence increased in DNA samples prepared with 11 ZF CTCF (Fig. 5E). Our observation of CTCF-induced DNA meshes and network morphologies intertwined by CTCF signals is consistent with previously reported ability of CTCF to bridge different DNA segments both in cis and in trans [13,41].
Fig. 5. AFM images of distinct DNA morphologies in the presence of CTCF and their occurrences in the five sample types.
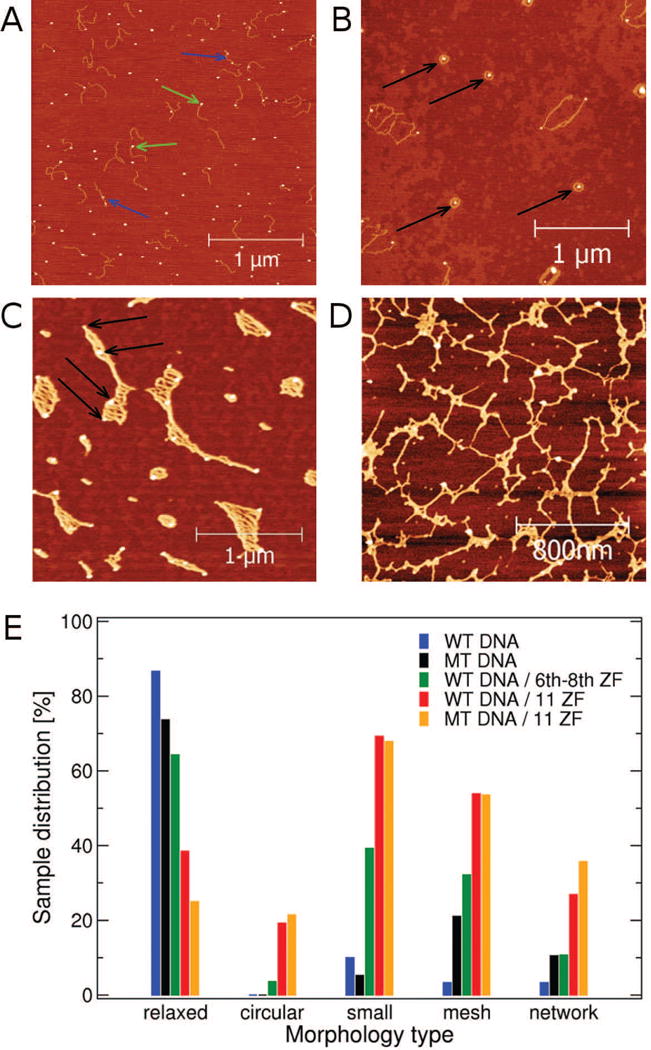
Four distinct morphologies observed by AFM: (A) relaxed DNA conformations, similar to those found in DNA control, with a protein signal bound to one of the DNA ends (green arrows) and/or with more than one protein signals bound to the same DNA molecule (blue arrows); and (B) circular DNA/CTCF complexes (black arrows); (C) mesh-like structures with multiple protein signals (black arrows) and (D) protein signal-rich network structures spanning the entire image. All shown images are of WT DNA and 11ZF CTCF. (E) Occurrence of five distinct morphologies in three different sample preparations. The statistical analysis included 30 control DNA samples, 26 samples of DNA prepared with 11 ZF CTCF, and 28 samples of DNA prepared with 6–8 ZF CTCF. Note that multiple morphologies were occasionally observed within the same sample.
Upon careful inspection of AFM images with different CTCF-induced DNA morphologies (Figs. 5), we noted that quasi-circular complexes typically coexisted on images that contained fewer protein signals, whereas images with network morphologies revealed a larger number of protein signals. We thus hypothesized that the observed DNA polymorphism stemmed from differences in a local protein concentration. To test this observation, we counted the number of protein signals on each morphologically-characterized image and calculated the average number of protein signals and standard error of the mean (SEM) for each of the three distinct morphologies: compact structures, meshes, and networks. The results of this analysis revealed that, on average, circular complexes coexisted with a lower number of protein signals (5.2±1.3/μm2), whereas meshes and network structures were found to coexist with a larger number of protein signals, 9.3±2.5/μm2 and 12.9±2.1/μm2, respectively. This result suggested that circular DNA complexes were more likely to form at lower protein concentrations, whereas higher protein concentrations were more likely to induce interconnected DNA meshes and networks.
Circular DNA complex formation is facilitated by the ZF region of CTCF
To examine the effect of specific binding and the ZF motif on the observed CTCF-induced DNA morphologies, we classified each of the five sample types according to the observed morphologies (Fig. 5A-D). We split the class of compact conformations into (i) circular DNA/CTCF complexes and (ii) other more irregular DNA/CTCF complexes that were too small to be classified as meshes. In total, five morphologies were considered in the analysis: relaxed conformations, circular complexes, small irregular complexes, meshes and networks. A significant number of DNA/CTCF samples that lacked relaxed DNA conformations displayed and contributed to two or more distinct morphologies (Fig. 5E). In WT and MT DNA control samples, DNA adopted predominantly relaxed conformations although irregular compact structures, meshes, and networks were also observed (Fig. 5E, blue and black histograms). The mesh morphology formed with a slightly higher occurrence in MT DNA control samples as compared to WT DNA (Fig. 5E, black histogram and S5E). WT and MT DNA control samples displayed no notable differences between these morphologies (Fig. 2C). No circular complex conformations were observed in either WT or MT DNA control samples. In contrast, in WT and MT DNA samples incubated with 11 ZF CTCF, DNA morphology was dominated by small compact structures, including circular complexes, and meshes, followed by networks and relaxed DNA (Fig. 5E, red and orange histograms). The most unique CTCF-induced DNA morphology was the circular complex, which was detected in 19% and 21% of all WT and MT DNA samples incubated with 11 ZF CTCF, respectively. This circular complex was not observed in any control DNA sample. WT and MT DNA samples prepared with 11 ZF CTCF exhibited similar morphologies with occurrence probabilities that were statistically indistinguishable (Fig. 5E, red and orange histograms, see also Table 1).
The absence of circular complexes in DNA control samples demonstrated that 11 ZF CTCF was an essential component of the circular DNA/CTCF complex. The importance of the ZF motif of CTCF was further supported by characterization of WT DNA samples incubated with 6–8 ZF CTCF. The distribution of the observed morphologies in WT DNA samples incubated with 6–8 ZF CTCF was statistically distinct from all other distributions (Fig. 5E, green histogram, see also Table 1). The circular DNA/CTCF complex was observed in < 4% of the WT DNA samples incubated with 6–8 ZF CTCF, which corresponded to a 5-fold decrease in the occurrence relative to the occurrence in the WT DNA samples prepared with 11 ZF CTCF. The observation of the circular DNA/CTCF complex conformation in DNA samples with 11 ZF CTCF, its 5-fold decreased abundance in DNA samples with 6–8 ZF CTCF, and the absence of this morphology from the DNA control samples highlights the critical role of ZFs in CTCF-induced circular DNA complex formation.
Characterization of the circular DNA/CTCF complex
AFM images and their analysis demonstrated that the ZF domain of CTCF is essential for circular DNA complex formation. To elucidate the circular DNA/CTCF complex morphology, we collected a series of images of circular complexes from WT and MT DNA incubated with 11 ZF CTCF (Figs. 6A and 6B, respectively) and from WT DNA samples incubated with 6–8 ZF CTCF (Figs. 6C). Visual inspection of the three sets of circular complex morphologies revealed well-defined circular complexes formed by both WT and MT DNA in the presence of 11 ZF CTCF, whereas significantly fewer circular complexes formed by WT DNA in samples prepared with 6–8 ZF CTCF (Figs. 6C, images with green arrows). Instead, WT DNA coincubated with 6–8 ZF CTCF exhibited mostly irregularly-shaped compact structures (Figs. 6C, images without arrows).
Fig. 6. AFM images of circular DNA/CTCF complexes and small meshes.
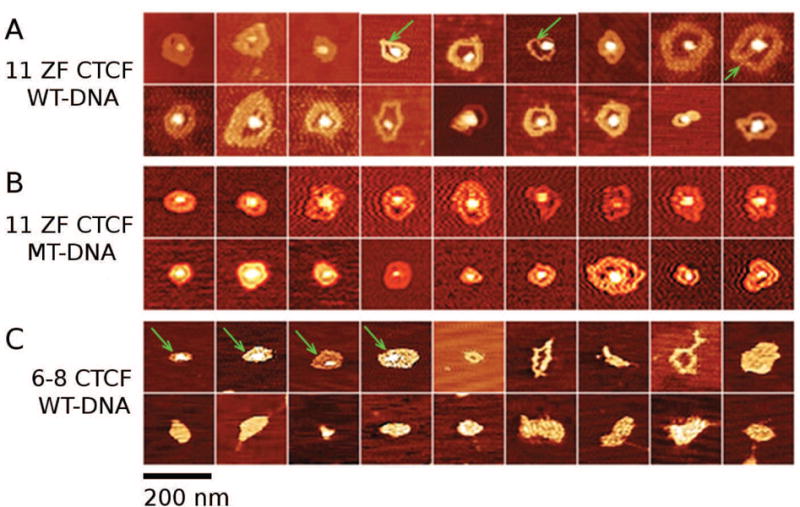
Characteristic circular complexes formed by: (A) WT DNA in the presence of 11 ZF CTCF, (B) MT DNA in the presence of 11 ZF CTCF, and (C) WT DNA in the presence of 6–8 ZF CTCF. Circular complex structures induced by 6–8 ZF CTCF (C) were fewer and more irregularly-shaped (green arrows) than those induced by 11 ZF CTCF (A-B). In most images, the protein was located at the center of the complex. In some complexes in (A) multiple DNA strands were visible (green arrows). Image dimensions are 310 nm × 310 nm.
We further characterized circular WT DNA complex structures induced by 11 ZF CTCF by collecting 250 images of these circular complexes (Fig. 6A) and measuring their height profiles (Fig. 7A, white trace) and contour lengths (Fig. 7A, blue trace). A typical height profile, shown in Fig. 7B, consisted of a central peak corresponding to the central protein signal height (Fig. 6A), flanked by two side peaks corresponding to the height of the DNA strand(s). The height of these outer peaks was 1.5–2.0 nm, which was larger than the measured height of the relaxed WT DNA conformation (∼0.5 nm), indicating that these outer peaks corresponded to two or more DNA strands. The average and standard deviation of the protein signal heights in Fig. 7C were 6.0±1.8 nm, in agreement with heights measured for control 11 ZF CTCF samples. The diameter of the central protein signal measured from the width of the central peak in Fig. 7B was 20–30 nm, which was below the lower limit of diameter measurements obtained from control 11 ZF CTCF samples (∼40 nm), suggesting a conformational change in the 11 ZF CTCF protein upon circular DNA/CTCF complex formation. The lower limit of diameter measurements in control 11 ZF CTCF samples most likely corresponded to monomers. Thus, both height and diameter distributions of the central protein signal in the circular complex were consistent with 11 ZF CTCF monomer, although a possibility of 11 ZF CTCF dimers or even higher order protein assemblies interacting with DNA and forming morphologically similar circular complexes could not be excluded.
Fig. 7. Analysis of the circular DNA/CTCF complex dimensions.
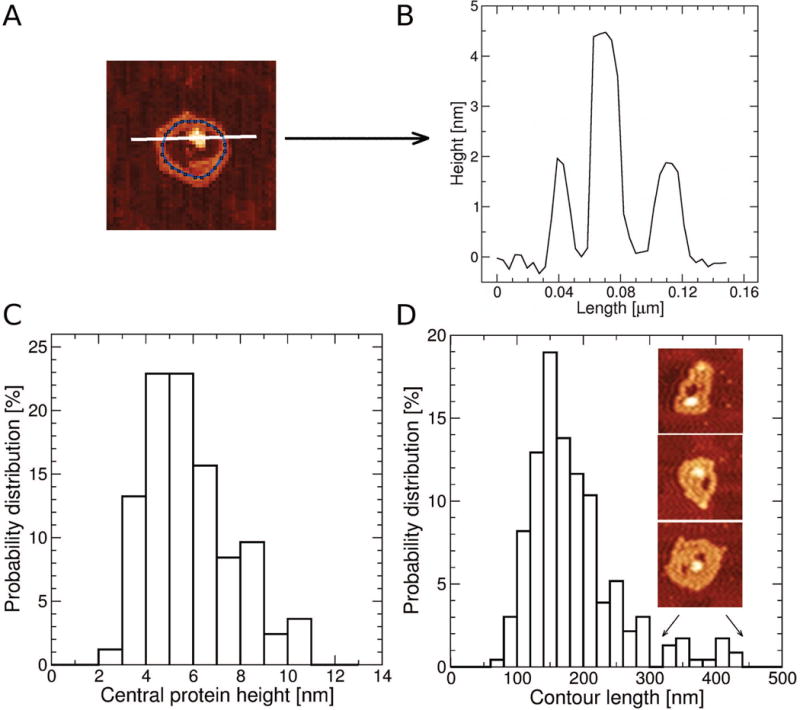
(A) Measurements of height profiles (along the white line) and the contour length (blue contour line) of the DNA-CTCF complex. (B) The height profile of the complex (A) measured across the center of the complex. (C) The distribution of central heights of the DNA/CTCF complex with the average and standard deviation of 6.0±1.8 nm (based on 83 measured height profiles). (D) The distribution of contour lengths with the average and standard deviation of 186±69 nm (based on 237 measured contour lengths). Contour lengths larger than 300 nm corresponded to loop-like structures with more irregular morphologies bordering on meshes as shown on the inserted images (size of 195 nm × 195 nm).
The contour length distribution of the circular WT DNA/CTCF complex was slightly asymmetric and skewed towards larger sizes (Fig.7D). The average and standard deviation of the contour length distribution were 186±69 nm. The most probable contour length was ∼150 nm, corresponding to a half of the DNA length (compare with the distribution of DNA lengths in control DNA samples, Fig. 2C). Circular complex structures with contour lengths >300 nm revealed larger complexes with multiple DNA strands and/or multiple CTCF molecules that occasionally resembled mesh-like morphologies (Fig. 7D, inset images). Circular DNA/CTCF complexes used in the statistical analysis were carefully identified based on their lateral dimensions and shape. However, due to AFM resolution limitations some overlap between mesh-like and compact conformations was unavoidable. Multiple DNA strands were also noted upon closer inspection of several circular DNA/CTCF complexes (Fig. 6A, green arrows). Although higher-order complexes of 11 ZF CTCF multimers and multiple DNA molecules might have contributed to the above distributions, the results of the dimensional analysis suggest that a circular DNA/CTCF complex likely consisted of an 11 ZF CTCF protein monomer and a single DNA molecule, folded into approximately two stacked quasi-circular loops around the protein.
The DNA/CTCF complex described above was observed in samples prepared in 20 mM NaCl buffer. In order to test whether these complexes could form at a more physiological NaCl concentration, we collected a series of AFM images using sample buffers with higher salt concentrations: 50, 100, and 200 mM NaCl. Adhesion of DNA to the mica substrate was significantly inhibited as the salt concentration increased. In contrast, increased NaCl concentrations did not affect adhesion of 11 ZF CTCF and even adhesion of DNA incubated with 11 ZF CTCF. All NaCl concentrations higher than 20 mM affected the clarity of AFM images due to NaCl crystals that coexisted with DNA and protein signals. Nonetheless, we observed CTCF-induced circular DNA complexes at all NaCl concentrations. Below we provide more detail on AFM data acquired in samples containing 100 mM NaCl. AFM images of samples with WT DNA and 11 ZF CTCF in the buffer with 100 mM NaCl displayed circular DNA/CTCF complexes that were very similar to those observed in the buffer with 20 mM NaCl (Fig. S6B-C). To ensure that the complexes observed at 100 NaCl were indeed quantitatively similar to those observed at 20 NaCl, we collected the height and width profiles of DNA/CTCF complexes formed at 100 mM NaCl and compared them to the corresponding profiles of complexes formed at 20 mM NaCl (Fig. 7B). The shape of the height profile of the circular DNA/CTCF complex, consisting of a central protein peak flanked by two DNA peaks, and the relative positions of the two side peaks relative to the central peak were comparable between the two NaCl concentrations. The average heights of the central protein signals in the DNA/CTCF complexes obtained at 100 mM and 20 mM NaCl were 3.9±0.24 nm and 4.4±0.34 nm, respectively. The average height of the flanked DNA strands within these complexes was 1.6±0.3 nm, which is again comparable to the corresponding heights observed in 20 mM NaCl. The average contour length of complexes formed in the 100 mM NaCl buffer (201±33 nm) was similar to the average contour length of complexes formed in the 20 mM NaCl buffer (186±69 nm). We noted, however, that the central protein signal was visibly wider in complexes formed in 100 mM NaCl than those formed in 20 mM NaCl, such that there was a partial overlap between the central protein and the two flanked DNA signals. To examine whether the width of the protein signal was caused by an increased propensity of 11 ZF CTCF itself to self-assemble at higher NaCl concentrations, we acquired AFM images of 11 ZF CTCF protein in the 100 mM NaCl buffer (Fig. S6A) and compared them to AFM images of 11 ZF CTCF protein in the 20 mM NaCl. Our results show that the average width (and SEM value) of the 11 ZF CTCF protein signals in the 100 mM NaCl buffer was 80.4±3.67 nm, i.e., larger than the width of the protein signals in 11 ZF CTCF control images acquired from 20 mM NaCl buffer (67±2.6 nm). This difference might be suggesting an increased propensity of CTCF to form multimeric assemblies at higher salt concentrations, although the resolution of AFM images, in particular those obtained at the higher NaCl concentration, was insufficient to draw a definite conclusion. The above findings overall indicate that the DNA/CTCF complex remains stable in the physiological NaCl concentration range.
Specific binding affects the contour length distribution of the circular DNA/CTCF complex
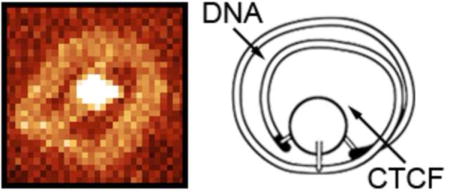
The results described above indicate that 11 ZF CTCF induced similar morphologies in WT and MT DNA, suggesting that specificity of CTCF binding to DNA did not strongly contribute to the resulting morphologies. We then asked whether or not the height and contour length distributions of the observed circular DNA/CTCF complexes were affected by the presence (WT DNA) or absence (MT DNA) of the three specific binding sites. We acquired the height profiles of the central protein signal and measured contour lengths for circular complexes formed by MT DNA in the presence of 11 ZF CTCF akin to the protein signal height and contour length distributions of the circular complexes formed by WT DNA in the presence of 11 ZF CTCF, shown in Fig. 7C-D. A comparison of the protein signal height and contour length distributions of CTCF-induced circular complexes formed by WT DNA and MT DNA is shown in Fig. 8A-B (red versus orange histograms). The protein signal height distributions of the circular complexes formed by WT DNA and MT DNA (Fig. 8A) were statistically indistinguishable from each other as assessed by the Kolmogorov-Smirnov test (p-value of 0.292). In contrast, the contour length distribution of the circular complexes formed by MT DNA was significantly narrower than the corresponding distribution of circular complexes formed by WT DNA (Fig. 8B), as confirmed by the Kolmogorov-Smirnov test (p-value of 0.014). Because WT DNA differed from MT DNA only by the presence of the three specific binding sites in the central region of the sequence, our results indicate that the width of the contour length distribution was affected by specific binding in a statistically significant way. Based on these findings, we propose a model of circular complex formation, in which CTCF binds DNA and then anchors itself to the central region of DNA with a subset of ZFs while utilizing the remaining ZFs to bind the DNA ends as schematically shown in Fig. 8C. In the case of WT DNA, CTCF preferentially anchors itself to one of the three specific binding sites in the central region, followed by binding to DNA ends, which results in three different contour lengths of the circular DNA/CTCF complex (Fig. 8C, top three schemes). In the case of MT DNA with no specific binding sites, a similar albeit non-specific anchoring of CTCF to the central region occurs, followed by binding to MT DNA ends, which results in more more uniform contour lengths and therefore a narrower contour length distribution of the circular MT DNA/CTCF complex (Fig. 8C, bottom scheme). This model thus accounts for the observed circular DNA/CTCF complex structure and provides a plausible explanation for distinct widths of the WT DNA and MT DNA contour length distributions.
Fig. 8. Central protein height and contour length distributions of circular complexes formed by WT DNA versus MT DNA and the proposed model of circular complex formation.
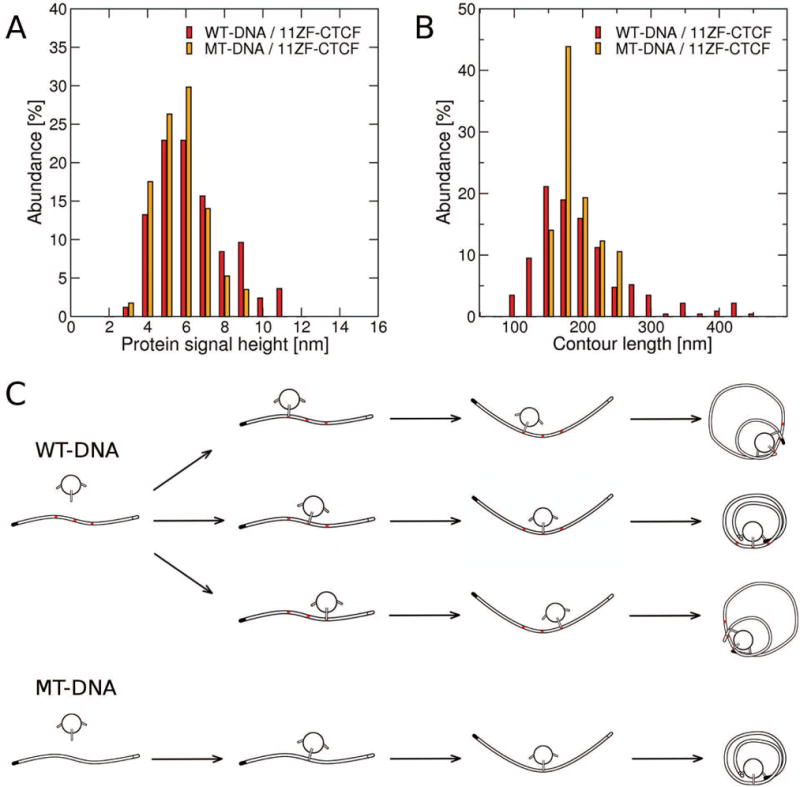
Distributions of (A) the height of the central protein signal and (B) the contour length of the WT-DNA (83 central protein height and 233 contour length measurements) versus MT-DNA (57 central protein height and 57 contour length measurements) circular complex. (C) The proposed model of WT-DNA (top three schemes) and MT-DNA (bottom scheme) complex formation. Specific binding sites on WT-DNA are marked in red. One of the two distinct DNA ends is colored solid black.
Discussion
Substantial evidence shows that ubiquitously expressed protein CTCF is an essential component of genome organization, linking higher-order chromatin structure with complex biological functions, whereby the absence of CTCF from the germline is incompatible with cell viability [20, 42, 43]. Numerous studies support an eminent role of CTCF in formation of DNA loops, which regulates gene expression [2,13,20,22–24]. In vivo, DNA loops can form between complex regulatory elements that are separated by tens of thousands base pairs. In comparison, most in vitro studies utilize relatively short DNA sequences with fewer than 1,000 bp. While in vitro observed DNA morphologies may not be identical to DNA conformations formed in vivo, in vitro studies offer important insight into possible mechanisms of DNA loop formation and unique DNA morphologies induced by CTCF. Two studies reported somewhat contradicting effects of CTCF on the DNA conformation. Arnold et al. showed that although both full-length CTCF and its 11 ZF domain displayed comparable DNA binding affinities, only the former induced bending of ∼300 bp-long DNA [44]. In contrast, MacPherson and Sadowski reported that the 11 ZF domain of CTCF itself was sufficient to induce an unusual conformation of ∼156 bp-long DNA, which was hypothesized to be a DNA loop [25]. Both studies relied on EMSA experiments alone and neither of them employed imaging techniques to directly visualize CTCF-induced DNA morphologies.
We used AFM imaging to examine the effect of CTCF binding to 941 bp-long DNA sequence from the KSHV genome (WT DNA), which contains a cluster of three specific binding sites and has been previously examined in detail for its biological function and properties [33,34]. To address the role of specific binding, an analogous DNA sequence without specific binding sites (MT DNA) was also utilized. To assess the role of the ZF motif, our experiment employed in addition to the CTCF protein domain with a complete set of 11 ZFs (11 ZF CTCF) also the protein domain with a subset of 3 ZFs (6–8 ZF CTCF). Our results show that relaxed DNA conformations dominated the morphology of DNA control samples. In comparison, DNA samples incubates with CTCF revealed an increased abundance of networks and meshes alongside unique compact circular complexes that were absent from all DNA control samples. AFM images of meshes and networks from DNA sample incubated with CTCF revealed multiple protein signals bound to individual DNA molecules, providing a direct evidence that CTCF can bind to multiple DNA sites. The unique circular DNA/CTCF complex observed by AFM was of a particular interest due to the report of the unusual CTCF-induced DNA structures by MacPherson and Sadowski, although the DNA used in their study was six-fold shorter than the DNA in present study [25]. Statistical analysis of height profiles and contour length measurements support a circular complex model, in which the protein folds the DNA into two stacked quasi-circular loops with a contour length of ∼160 nm (or ∼470 bp). Future research will reveal to which extent the proposed circular complex structure depends on the DNA length.
Classification of AFM samples into distinct morphologies and a subsequent calculation of their occurrences for each sample type confirmed that 6–8 ZF CTCF had a significantly weaker effect on the DNA morphology and produced 5-times fewer circular complexes than did 11 ZF CTCF. Instead of well-defined circular complexes induced by 11 ZF CTCF, compact structures induced by 6–8 ZF CTCF were irregularly shaped. Although 6–8 ZF CTCF was able to bind DNA, it was unable to stabilize the circular DNA/CTCF complex as well as 11 ZF CTCF. These results confirmed that the 11 ZF motif was directly involved in the circular DNA/CTCF complex formation. We also examined the effect of increased ionic strength on formation of the DNA/CTCF complex by increasing the NaCl concentration from 20 mM, which was optimal for AFM imaging, to 100 mM, which is closer to the physiological salt concentration. Despite the reduced quality of AFM images, increasing the NaCl concentration from 20 mM to 100 mM did not affect the ability of 11 ZF CTCF to induce formation of the circular DNA complexes.
A comparison between CTCF-induced WT DNA and MT DNA morphologies demonstrated that the observed changes in DNA conformations were not strongly affected by specific binding. Nonetheless, the presence of three binding sites in the central region of WT DNA resulted in a significantly broader contour length distribution of WT DNA/CTCF relative to MT DNA/CTCF complexes, suggesting that the three binding sites increased the contour length variability. Previous studies showed that CTCF uses different combinations of 11 ZFs to bind to different DNA sites and that only a subset of ZFs is needed for binding [15, 45]. If no more than 4 ZFs were needed for binding to a single site at the central region of WT DNA, the remaining 7 ZFs might have been utilized to bind to additional sites, including DNA ends, which would facilitate formation of the observed complex. We thus propose a mechanism of circular complex formation that consists of three stages: (i) CTCF uses a subset of 11 ZFs to bind and anchor to the central region of DNA, (ii) bound CTCF causes local DNA bending that subsequently brings DNA ends into its proximity and (iii) bound CTCF uses the remaining free ZFs to bind DNA ends, stabilizing the circular complex, as shown schematically in Fig. 8C. This mechanism provides plausible explanations for reduced occurrence of circular complexes induced by 6–8 ZF CTCF relative to 11 ZF CTCF and for the broader contour length distribution of WT DNA/CTCF relative to MT DNA/CTCF complexes (Fig. 8C). Protein-induced DNA bending is rather common among DNA-binding proteins such as TATA binding protein (TBP), which is required for all transcription initiation in eukaryotes [46]. AFM images revealed that CTCF protein signals could bind DNA at multiple sites, including to the ends of relaxed DNA strands. The above mechanism is also consistent with AFM images of circular DNA/CTCF complexes, which did not display any obvious free DNA ends, suggesting that DNA ends were bound. Our findings are clearly limited by AFM imaging resolution and other constraints of in vitro experimentation. CTCF binding to DNA ends in vitro may thus not be of physiological relevance, as free DNA ends are mostly inaccessible in chromosomal DNA in vivo. Future studies of CTCF-induced DNA morphologies, in which the full-length CTCF is used and DNA length is systematically varied, might provide further insights into DNA looping in vivo.
It might be argued that 11 ZF CTCF should utilize all ZFs to bind the three specific binding sites on WT DNA rather than binding non-specifically to DNA ends. The affinity of CTCF binding to more than one specific site depends on the proximity of these sites within the 155 bp- or 53 nm-long central region and the free energy associated with such binding. As the length of the central region with specific binding sites used here is comparable to the persistence length of double-stranded DNA (50 nm), substantial bending of such a short locus would be required, which would unfavorably increase the bending free energy [47, 48]. This free energy cost could have prevented simultaneous binding of CTCF to all three specific binding sites of WT DNA in our experiments. As this bending free energy decreases with the circular DNA complex radius, a larger CTCF-induced DNA loop formed by two or more distal binding sites, brought into proximity by sequential binding of different subsets of ZFs, would require less bending and would thus be more likely to form, consistent with the reported ability of CTCF to bind distal DNA loci in cis. In agreement with reported CTCF binding in trans, our AFM images revealed DNA/CTCF network morphologies, whereby CTCF protein signals “weaved” together multiple DNA strands into an extended network structure spanning the entire visual field (Fig. 5D). The multiple CTCF-induced DNA morphologies observed in our study thus support the model, in which CTCF forms multiple contacts with DNA, whereby additional ZF valencies promote formation of circular complexes in cis or meshes and networks in trans.
Previous studies using AFM and electron microscopy (EM) imaging techniques have elucidated many protein-induced DNA morphologies formed in vitro. Su et al. showed that Sp1 protein, which is involved in transcription in eukaryotes, facilitates formation of DNA loops through protein-protein self-association [49]. The DNA in their study was 342 bp-long, which is 2–3-fold shorter than the DNA in our study. In comparison to a quasi-circular shape of the circular DNA/CTCF complex observed here, DNA loops observed by Su et al. were irregular in shape and comprised a single DNA connected to protein signals through DNA ends [49]. Knight et al. used EM to visualize irregularly shaped DNA loops of lengths that depended on the placement of specific binding sites for E2 transactivator protein of bovine papillomavirus [50]. Distinct from CTCF-induced circular DNA complex formation in our study, the mechanism of DNA loop formation was facilitated by E2 dimers binding to DNA, followed by E2 dimer self-association into multimers, whereby DNA with three widely separated binding sites was shown to form a bow-tie conformation [50]. Another study by Shin et al. utilized AFM to reveal a rather large and irregularly shaped ternary complex of H-NS-induced DNA loop with a contour length of 250–300 nm (∼700–900 bp), which was wrapped around Eσ70 [28]. Leng et al. visualized lac repressor-, gal repressor-, and λΩ protein-induced topological domains of supercoiled DNA that were irregular in shape and formed significantly larger loops than the circular complex observed here [31]. Using optical tweezers and AFM, Murugesapillai et al. showed that an architectural factor involved in regulation of chromatin structure, HMO1, induced in vitro bridging and looping of 4361 bp-long DNA [32]. Whereas some of DNA morphologies shown by Murugesapillai et al. marginally resembled mesh-like or network-like morphologies observed here, no circular DNA complexes were reported. Thus, our observation of the CTCF-induced circular DNA complex is unique and distinct from previously reported protein-induced DNA morphologies.
In cells, CTCF mediates DNA-DNA interactions, but it is not known how many CTCF molecules are involved in this process, nor how CTCF searches to find other DNA sites to form “loops” or “bridges” [9]. Substantial evidence shows that CTCF itself is not sufficient for DNA loop formation in vivo. Cohesins, which colocalize with CTCF genome-wide, are critically involved in formation of chromosomal cis-interactions at the developmentally regulated IFNG locus, whereby cohesin depletion abrogates loop formation even though CTCF itself remains at a given site [51]. Another study demonstrated that cohesins play a key role in maintaining CTCF-mediated chromatin conformation at the IGF2-H19 locus in human cells, suggesting that cohesin mediates interactions between DNA molecules in cis to insulate genes through formation of chromatin loops [52]. In agreement with these reports, Kang et al. proposed that KSHV genomes are organized into chromatin loops mediated by CTCF and cohesin interactions [34]. Although our study did not address the role of cohesins in DNA/CTCF loop formation, it demonstrated that upon binding DNA, CTCF induced formation of DNA morphologies that were distinct from the relaxed DNA morphology observed in control DNA samples and were not strongly affected by binding specificity, hinting at a universal ability of CTCF to interact with DNA and modify its conformation. This study thus offers the first visual evidence of the CTCF-induced circular DNA complex and demonstrates that CTCF is capable of interacting with multiple (∼3) DNA sites in cis. Findings of our study are consistent with previously-reported properties of CTCF, provide new mechanistic insights into in vitro CTCF-induced DNA loop formation, and open new venues for future research on CTCF and its role in DNA looping in vivo.
Materials and Methods
DNA synthesis and purification
The sequences of WT DNA and MT DNA (DNA sequence without specific binding sites) used in our study are included in Supporting Information. Both DNA molecules were produced through the polymerase chain reaction (PCR) using KSHV bacmid wild type N1069 as the template DNA with OPL882 and OPL3032 as primers. The resulting WT and MT DNA comprised 941 bp, whereby WT (but not MT) DNA included three CTCF binding sites located within the 155 bp-long middle region, flanked by the 434 and 352 bp-long regions at the 3′ and 5′ ends, respectively. PCR DNA product was purified by QIAquick PCR purification Kit (Qiagen, Inc) and eluted in water.
Expression and purification of recombinant CTCF protein
The sequences of the 11 ZF CTCF (residues 266–579) and 6–8 ZF CTCF (residues 402–494) DNA binding domains are provided in Supporting Information. The molecular weights of 11 ZF CTCF and 6–8 ZF CTCF are 37.7 kDa and 11 kDa, respectively. The proteins each have an isoelectric point pI = 9.1. Both protein domains were cloned into a pMal-c2X vector with an N-terminal MBP tag and expressed in BL21(DE3) E. coli cells. Cells were grown at 37°C until they reached an OD600 of 0.8, then protein expression was induced by adding 0.3 mM IPTG and carried on overnight at 18°C. Prior to induction, media was supplemented with 200 μM of ZnSO4. Cells were harvested and lysed by sonication in 25 mM HEPES pH 7.5, 250 mM NaCl and 10 μM ZnSO4 (lysis buffer). The lysate was cleared by centrifugation and applied to an amylose affinity column. The protein was eluted from the column with the lysis buffer supplemented with 10 mM maltose. Collected protein was further purified by passage through a HiTrap SP column and a size-exclusion Superdex 200 column equilibrated with 25 mM HEPES pH 7.5, 250 mM NaCl, and 10 μM ZnSO4. Purified protein was concentrated to 7 mg/ml, flash frozen in liquid nitrogen and stored at −80°C.
EMSA
EMSA experiments were performed by 11 ZF CTCF and 6–8 ZF CTCF to validate and compare binding characteristics of the two protein domains following the previously published protocol [55, 56]. The buffer used in EMSA experiments was 20 mM HEPES with 20 mM NaCl, 5 mM MgCl2, 0.1 mM ZnSO4, 0.05 mg/ml poly(dI-dC), 0.5 mg/ml bovine serum albumin (BSA), 0.05% NP-40, 35 mM b-mercaptoethanol, and 6% glycerol. This buffer was adjusted to that used for AFM imaging with additional components, which are specifically required for EMSA. Briefly, DNA probes with and without CTCF binding sites were derived from a human subtelomeric sequence. Complementary wt oligonucleotides (with specific binding sites) or mt oligonucleotides (without a specific binding site) were annealed to form double-stranded DNA probes, radio labeled, and assayed by EMSA as described previously [55]. The wt and mt oligonucleotide sequences are included in Supporting Information. Dissociation constants were extracted from plots of the bound fraction of CTCF as a function of CTCF concentration. The fraction bound was determined by densitometry analysis of the gel bands using ImageJ [59].
AFM sample preparation protocols
DNA control samples
The DNA control samples were prepared by incubating DNA (at the initial stock concentration of 50–100 nM) in 20 mM HEPES buffer with 20 mM NaCl, 5 mM MgCl2 and 0.1 mM ZnSO4 (pH 7.5). Addition of ZnSO4 to the buffer provided Zn2+ ions to stabilize the ZF folded structure of CTCF and thereby ensure its functionality. Addition of multivalent ions, such as Mg2+, to the buffer enables DNA to adhere to the mica surface [26,30,36,57]. Because the molar concentration of ZnSO4 was 50-times lower than the molar concentration of MgCl2, Zn ions were not expected to strongly affect adhesion of DNA to the mica surface. 1 μL of the DNA stock solution mixed with 59 μL of the buffer resulted in a 60 μL sample with the DNA concentration of 1–2 nM, which was incubated for 5 min at room temperature. After incubation, 15 μL of the DNA solution was deposited on a freshly cleaved mica surface area (1 cm × 1 cm), and incubated for 2 min to allow DNA to adhere to the substrate. The mica surface with DNA was lightly rinsed with 150 μL Milli-Q water and dried with a gentle nitrogen flow prior to AFM imaging.
Protein control samples
The protein control samples with either 11 ZF CTCF or 6–8 ZF CTCF were prepared from stock concentrations of 6 mg/mL or 12 mg/mL, respectively, using the same buffer that was used in preparation of the DNA control samples. The stock CTCF was diluted 1:100 twice. Briefly, 4 μL of the protein diluted stock solution was mixed with 56 μL of the buffer, resulting in a 60 μL sample with protein concentrations in the range of 5–10 nM. The solution was deposited on the mica surface, rinsed and dried prior to AFM imaging, following the same protocol as for the DNA control sample preparation.
DNA/CTCF samples
The DNA/CTCF samples were prepared by incubating stock solutions of either 11 ZF CTCF protein or 6–8 ZF CTCF protein with the DNA stock solution in the same buffer used for DNA and protein controls. Briefly, 1 μL of DNA and 4 μL of protein stock solutions mixed with 55 μL buffer resulted in 60 μL of DNA/CTCF solution with the final protein and DNA concentrations of 5–10 nM and 1–2 nM, respectively. DNA was allowed to coincubate with CTCF for 2 min prior to deposition onto the mica surface. The remaining sample preparation followed the same protocol as for the DNA and protein control samples.
Protein volume standards
Four proteins were used to establish the dependence of AFM volume measurements on molecular weight. Human recombinant insulin (5.808 kDA), equine cytochrome c (12.327 kDa), human hemoglobin (64.458 kDa), and BSA (66.463 kDa) (Sigma-Aldrich, St. Louis, MO) were used as the protein standards, all of which were prepared at a concentration of ∼5 nM. Protein concentrations were determined by Beer’s Law with a measured molar absorbance at 280 nm through a path length of 1 cm using a BioPhotometer Plus (Eppendorf, Germany). The extinction coefficients used are as follows: 6710 M−1cm−1 for insulin, 10220 M−1cm−1 for cytochrome c, 9970 M −1cm −1 for hemoglobin, and 52165 M−1cm−1 for BSA. Insulin was prepared in 20% acetic acid and cytochrome c, hemoglobin, and BSA were prepared in Milli-Q water, all at room temperature. 15 μL of each protein samples were deposited on freshly cleaved mica for 2 min followed by rinsing and drying as described above.
AFM imaging and analysis
Images were captured in air with a MultiMode Scanning Probe Microscope (Digital Instruments, Santa Barbara, CA) equipped with a NanoScope IIIa controller (Digital Instruments, Santa Barbara, CA) in a tapping AFM mode. A 125 μm-long and 40 μm-wide silicon AFM probe with aluminum reflex coating, tip radius <10 nm, spring constant 40 N/m, and resonance frequency of 300 kHz (NanoScience Instruments, Phoenix, AZ) was used. All images were scanned from a 2 μm × 2 μm or 3 μm × 3 μm viewing area on the sample within 2 hours after preparation using a scan rate of 1.6 Hz. Each image was digitized to 512 × 512 pixels (4–6 nm/pixel). For each sample, 5–10 images were acquired from different regions within the sample to capture the heterogeneity within the sample. Raw images were flattened in the x- and y-directions by the native Nanoscope software to eliminate the drift and normalized using Gwyddion [58]. Measurements of the morphologies observed on the final digitized images were performed within Gwyddion and ImageJ (http://rsb.info.nih.gov/ij/index.html) [59].
Volumetric analysis on AFM images was performed using WSxM [39] software to measure volumes of protein signals as described by Li et al. [60]. Volume distributions of the protein standards were used to determine average volumes and the respective SEM values. A linear regression was fit between the average volumes and known molecular weights of the protein standards using a Levenberg-Marquardt least squares minimization algorithm. This calibration curve was then used to extrapolate the average molecular weight of the CTCF protein signals with a measured volume distribution.
Supplementary Material
Highlights.
CTCF-induced DNA morphologies are visualized by atomic force microscopy.
DNA conformations induced by CTCF deviate from relaxed DNA conformations.
CTCF induces formation of unique circular DNA/CTCF complexes.
The eleven zinc finger motif of CTCF stabilizes circular DNA/CTCF complexes.
Analysis of DNA/CTCF complexes suggests a DNA twice wrapped around CTCF.
Acknowledgments
The authors wish to dedicate this manuscript to the memory of Dr. Guoling Yang who initiated this research project. P.M.L. acknowledges the support through the NIH grants R01 DE017336 and R01 CA117830.
Abbreviations
- AFM
atomic force microscopy
- BSA
bovine serum albumin
- EM
electron microscopy
- EMSA
Electrophoretic mobility shift assay
- KSHV
Kaposi’s Sarcoma-associated HerpesVirus
- MW
molecular weight
- PCR
polymerase chain reaction
- TBP
TATA binding protein
- ZF
zinc finger
Footnotes
Publisher's Disclaimer: This is a PDF file of an unedited manuscript that has been accepted for publication. As a service to our customers we are providing this early version of the manuscript. The manuscript will undergo copyediting, typesetting, and review of the resulting proof before it is published in its final citable form. Please note that during the production process errors may be discovered which could affect the content, and all legal disclaimers that apply to the journal pertain.
Author contributions
P.M.L. and B.U. designed the research. R.L. and M.T.M. prepared DNA, CTCF, and DNA/CTCF samples, acquired AFM images, conducted AFM data analysis, and contributed to manuscript preparation. J.M., K.D., and R.M. purified and prepared 11 ZF and 6–8 ZF CTCF proteins. F.L. and P.M.L. provided DNA samples and conducted EMSA measurements. P.M.L. and R.M. provided constructive suggestions and contributed to manuscript writing. B.U. was involved in data analysis, interpretation of the results, and wrote the manuscript.
References
- 1.Misteli T. Beyond the sequence: cellular organization of genome function. Cell. 2007;128:787–800. doi: 10.1016/j.cell.2007.01.028. [DOI] [PubMed] [Google Scholar]
- 2.Phillips JE, Corces VG. CTCF: master weaver of the genome. Cell. 2009;137:1194–1211. doi: 10.1016/j.cell.2009.06.001. [DOI] [PMC free article] [PubMed] [Google Scholar]
- 3.Lobanenkov VV, Nicolas RH, Adler VV, Paterson H, Klenova EM, Polotskaja AV, Goodwin GH. A novel sequence-specific DNA binding protein which interacts with three regularly spaced direct repeats of the CCCTC-motif in the 5′-flanking sequence of the chicken c-myc gene. Oncogene. 1990;5:1743–1753. [PubMed] [Google Scholar]
- 4.Baniahmad A, Steiner C, Köhne AC, Renkawitz R. Modular structure of a chicken lysozyme silencer: involvement of an unusual thyroid hormone receptor binding site. Cell. 1990;61:505–514. doi: 10.1016/0092-8674(90)90532-j. [DOI] [PubMed] [Google Scholar]
- 5.Bell AC, West AG, Felsenfeld G. The protein CTCF is required for the enhancer blocking activity of vertebrate insulators. Cell. 1999;98:387–396. doi: 10.1016/s0092-8674(00)81967-4. [DOI] [PubMed] [Google Scholar]
- 6.Hark AT, Schoenherr CJ, Katz DJ, Ingram RS, Levorse JM, Tilghman SM. CTCF mediates methylation-sensitive enhancer-blocking activity at the H19/Igf2 locus. Nature. 2000;405:486–489. doi: 10.1038/35013106. [DOI] [PubMed] [Google Scholar]
- 7.Kim TH, Abdullaev ZK, Smith AD, Ching KA, Loukinov DI, Green RD, Zhang MQ, Lobanenkov VV, Ren B. Analysis of the vertebrate insulator protein CTCF-binding sites in the human genome. Cell. 2007;128:1231–1245. doi: 10.1016/j.cell.2006.12.048. [DOI] [PMC free article] [PubMed] [Google Scholar]
- 8.Chen H, Tian Y, Shu W, Bo X, Wang S. Comprehensive identification and annotation of cell type-specific and ubiquitous CTCF-binding sites in the human genome. PLoS One. 2012;7:e41374. doi: 10.1371/journal.pone.0041374. [DOI] [PMC free article] [PubMed] [Google Scholar]
- 9.Ong CT, Corces VG. CTCF: an architectural protein bridging genome topology and function. Nat Rev Genet. 2014;15:234–246. doi: 10.1038/nrg3663. [DOI] [PMC free article] [PubMed] [Google Scholar]
- 10.Martinez SR, Miranda JJL. CTCF terminal segments are unstructured. Protein Sci. 2010;19:1110–1116. doi: 10.1002/pro.367. [DOI] [PMC free article] [PubMed] [Google Scholar]
- 11.Hashimoto H, Wang DX, Horton JR, Zhang X, Corces VG, Cheng XD. Structural basis for the versatile and methylation-dependent binding of CTCF to DNA. Mol Cell. 2017;66:711–711. doi: 10.1016/j.molcel.2017.05.004. [DOI] [PMC free article] [PubMed] [Google Scholar]
- 12.Holohan EE, Kwong C, Adryan B, Bartkuhn M, Herold M, Renkawitz R, Russell S, White R. CTCF genomic binding sites in Drosophila and the organisation of the bithorax complex. PLoS Genet. 2007;3:e112. doi: 10.1371/journal.pgen.0030112. [DOI] [PMC free article] [PubMed] [Google Scholar]
- 13.Zlatanova J, Caiafa R. CCCTC-binding factor: to loop or to bridge. Cell Mol Life Sci. 2009;66:1647–1660. doi: 10.1007/s00018-009-8647-z. [DOI] [PMC free article] [PubMed] [Google Scholar]
- 14.Schmidt D, Schwalie PC, Wilson MD, Ballester B, Gonçalves A, Kutter C, Brown GD, Marshall A, Flicek P, Odom DT. Waves of retrotransposon expansion remodel genome organization and CTCF binding in multiple mammalian lineages. Cell. 2012;148:335–348. doi: 10.1016/j.cell.2011.11.058. [DOI] [PMC free article] [PubMed] [Google Scholar]
- 15.Ohlsson R, Renkawitz R, Lobanenkov V. CTCF is a uniquely versatile transcription regulator linked to epigenetics and disease. Trends Genet. 2001;17:520–527. doi: 10.1016/s0168-9525(01)02366-6. [DOI] [PubMed] [Google Scholar]
- 16.Filippova GN, Fagerlie S, Klenova EM, Myers C, Dehner Y, Goodwin G, Neiman PE, Collins SJ, Lobanenkov VV. An exceptionally conserved transcriptional repressor, CTCF, employs different combinations of zinc fingers to bind diverged promoter sequences of avian and mammalian c-myc oncogenes. Mol Cell Biol. 1996;16:2802–2813. doi: 10.1128/mcb.16.6.2802. [DOI] [PMC free article] [PubMed] [Google Scholar]
- 17.Quitschke WW, Taheny MJ, Fochtmann LJ, Vostrov A. Differential effect of zinc finger deletions on the binding of CTCF to the promoter of the amyloid precursor protein gene. Nucl Acids Res. 2000;28:3370–3378. doi: 10.1093/nar/28.17.3370. [DOI] [PMC free article] [PubMed] [Google Scholar]
- 18.Renda M, Baglivo I, Burgess-Beusse B, Esposito S, Fattorusso R, Felsenfeld G, Pedone PV. Critical DNA binding interactions of the insulator protein CTCF: a small number of zinc fingers mediate strong binding, and a single finger-DNA interaction controls binding at imprinted loci. J Biol Chem. 2007;282:33336–33345. doi: 10.1074/jbc.M706213200. [DOI] [PubMed] [Google Scholar]
- 19.Nakahashi H, Kieffer Kwon KR, Resch W, Vian L, Dose M, Stavreva D, Hakim O, Pruett N, Nelson S, Yamane A, Qian J, Dubois W, Welsh S, Phair RD, Pugh BF, Lobanenkov V, Hager GL, Casellas R. A genome-wide map of CTCF multivalency redefines the CTCF code. Cell Reports. 2013;3:1678–1689. doi: 10.1016/j.celrep.2013.04.024. [DOI] [PMC free article] [PubMed] [Google Scholar]
- 20.Splinter E, Heath H, Kooren J, Palstra RJ, Klous P, Grosveld F, Galjart N, de Laat W. CTCF mediates long-range chromatin looping and local histone modification in the beta-globin locus. Genes Dev. 2006;20:2349–2354. doi: 10.1101/gad.399506. [DOI] [PMC free article] [PubMed] [Google Scholar]
- 21.Engel N, Raval AK, Thorvaldsen JL, Bartolomei SM. Three-dimensional conformation at the H19/Igf2 locus supports a model of enhancer tracking. Hum Mol Genet. 2008;17:3021–3029. doi: 10.1093/hmg/ddn200. [DOI] [PMC free article] [PubMed] [Google Scholar]
- 22.Yusufzai TM, Tagami H, Nakatani Y, Felsenfeld G. CTCF tethers an insulator to subnuclear sites, suggesting shared insulator mechanisms across species. Mol Cell. 2004;13:291–298. doi: 10.1016/s1097-2765(04)00029-2. [DOI] [PubMed] [Google Scholar]
- 23.Kurukuti S, Tiwari VK, Tavoosidana G, Pugacheva E, Murrell A, Zhao Z, Lobanenkov V, Reik W, Ohlsson R. CTCF binding at the H19 imprinting control region mediates maternally inherited higher-order chromatin conformation to restrict enhancer access to Igf2. Proc Natl Acad Sci U S A. 2006;103:10684–10689. doi: 10.1073/pnas.0600326103. [DOI] [PMC free article] [PubMed] [Google Scholar]
- 24.Li T, Hu JF, Qiu X, Ling J, Chen H, Wang S, Hou A, Vu TH, Hoffman AR. CTCF regulates allelic expression of Igf2 by orchestrating a promoter-polycomb repressive complex 2 intrachromosomal loop. Mol Cell Biol. 2008;28:6473–6482. doi: 10.1128/MCB.00204-08. [DOI] [PMC free article] [PubMed] [Google Scholar]
- 25.MacPherson MJ, Sadowski PD. The CTCF insulator protein forms and unusual DNA structure. BMC Mol Biol. 2010;11:101. doi: 10.1186/1471-2199-11-101. [DOI] [PMC free article] [PubMed] [Google Scholar]
- 26.Thundat T, Allison DP, Warmack RJ. Stretched DNA structures observed with atomic force microscopy. Nucl Acids Res. 1994;22:4224–4228. doi: 10.1093/nar/22.20.4224. [DOI] [PMC free article] [PubMed] [Google Scholar]
- 27.Lyubchenko YL, Shlyakhtenko LS. Visualization of supercoiled DNA with atomic force microscopy in situ. Proc Natl Acad Sci U S A. 1997;94:496–501. doi: 10.1073/pnas.94.2.496. [DOI] [PMC free article] [PubMed] [Google Scholar]
- 28.Shin M, Song M, Rhee J, Hong Y, Kim Y, Seok Y, Ha K, Jung S, Choy H. DNA looping-mediated repression by histone-like protein H-NS: specific requirement of Eσ70 as a cofactor for looping. Genes Dev. 2005;19:2388–2398. doi: 10.1101/gad.1316305. [DOI] [PMC free article] [PubMed] [Google Scholar]
- 29.Yang Y, Sass LE, Du CW, Hsieh P, Erie DA. Determination of protein-DNA binding constants and specificities from statistical analyses of single molecules: MutS-DNA interactions. Nucl Acids Res. 2005;33:4322–4334. doi: 10.1093/nar/gki708. [DOI] [PMC free article] [PubMed] [Google Scholar]
- 30.Cassina V, Seruggia D, Beretta GL, Salerno D, Brogioli D, Manzini S, Zunino F, Mantegazza F. Atomic force microscopy study of DNA conformation in the presence of drugs. Eur Biophys J. 2011;40:59–68. doi: 10.1007/s00249-010-0627-6. [DOI] [PubMed] [Google Scholar]
- 31.Leng F, Chen B, Dunlap DD. Dividing a supercoiled DNA molecule into two independent topological domains. Proc Natl Acad Sci U S A. 2011;108:19973–19978. doi: 10.1073/pnas.1109854108. [DOI] [PMC free article] [PubMed] [Google Scholar]
- 32.Murugesapillai D, McCauley MJ, Huo R, Nelson Holte MH, Stepanyants A, Maher LJ, III, Israeloff NE, Williams MC. DNA bridging and looping by HMO1 provides a mechanism for stabilizing nucleosome-free chromatin. Nucl Acids Res. 2014;42:8996–9004. doi: 10.1093/nar/gku635. [DOI] [PMC free article] [PubMed] [Google Scholar]
- 33.Stedman W, Kang H, Lin S, Kissil JL, Bartolomei MS, Lieberman PM. Cohesins localize with CTCF at the KSHV latency control region and at cellular c-myc and H19/Igf2 insulators. EMBO J. 2008;27:654–666. doi: 10.1038/emboj.2008.1. [DOI] [PMC free article] [PubMed] [Google Scholar]
- 34.Kang H, Wiedmer A, Yuan Y, Robertson E, Lieberman PM. Coordination of KSHV latent and lytic gene control by CTCF-cohesin mediated chromosome conformation. PLoS Pathog. 2011;7:e1002140. doi: 10.1371/journal.ppat.1002140. [DOI] [PMC free article] [PubMed] [Google Scholar]
- 35.Kang H, Cho H, Sung G, Lieberman PM. CTCF regulates Kaposi’s sarcoma-associated herpesvirus latency transcription by nucleosome displacement and RNA polymerase programming. J Virol. 2013;87:1789–1799. doi: 10.1128/JVI.02283-12. [DOI] [PMC free article] [PubMed] [Google Scholar]
- 36.Liu Z, Li Z, Zhou H, Wei G, Song Y, Wang L. Imaging DNA molecules on mica surface by atomic force microscopy in air and in liquid. Microscopy Res Tech. 2005;66:179–185. doi: 10.1002/jemt.20156. [DOI] [PubMed] [Google Scholar]
- 37.Rippe K, Mücke N, Langowski J. Superhelix dimensions of a 1868 base pair plasmid determined by scanning force microscopy in air and in aqueous solution. Nucl Acids Res. 1997;25:1736–1744. doi: 10.1093/nar/25.9.1736. [DOI] [PMC free article] [PubMed] [Google Scholar]
- 38.Rivetti C, Codeluppi S. Accurate length determination of DNA molecules visualized by atomic force microscopy: evidence for a partial B- to A-form transition on mica. Ultramicroscopy. 2001;87:55–66. doi: 10.1016/s0304-3991(00)00064-4. [DOI] [PubMed] [Google Scholar]
- 39.Horcas I, Fernndez R, Gmez-Rodrguez JM, Colchero J, Gmez-Herrero J, Baro AM. WSXM: a software for scanning probe microscopy and a tool for nanotechnology. Rev Sci Instrum. 2007;78:013705. doi: 10.1063/1.2432410. [DOI] [PubMed] [Google Scholar]
- 40.Verhoeven EEA, Wyman C, Moolenaar GF, Goosen N. The presence of two UvrB subunits in the UvrAB complex ensures damage detection in both DNA strands. EMBO J. 2002;21:4196–4205. doi: 10.1093/emboj/cdf396. [DOI] [PMC free article] [PubMed] [Google Scholar]
- 41.Bartkuhn M, Renkawitz R. Long range chromatin interactions involved in gene regulation, Biochim. Biophys Acta. 2008;1783:2161–2166. doi: 10.1016/j.bbamcr.2008.07.011. [DOI] [PubMed] [Google Scholar]
- 42.Heath H, Ribeiro de Almeida C, Sleutels F, Dingjan G, van de Nobelen S, Jonkers I, Ling KW, Gribnau J, Renkawitz R, Grosveld F, Hendriks RW, Galjart N. CTCF regulates cell cycle progression of αβ T cells in the thymus. EMBO J. 2008;27:2839–2850. doi: 10.1038/emboj.2008.214. [DOI] [PMC free article] [PubMed] [Google Scholar]
- 43.Ribeiro de Almeida C, Stadhouders R, de Bruijn MJ, Bergen IM, Thongjuea S, Lenhard B, van Ijcken W, Grosveld F, Galjart N, Soler E, Hendriks RW. The DNA-Binding Protein CTCF Limits Proximal Vκ Recombination and Restricts κ Enhancer Interactions to the Immunoglobulin κ Light Chain Locus. Immunity. 2011;35:501–513. doi: 10.1016/j.immuni.2011.07.014. [DOI] [PubMed] [Google Scholar]
- 44.Arnold R, Burcin M, Kaiser B, Muller M, Renkawitz R, Rudiger A. DNA bending by the silencer protein NeP1 is modulated by TR and RXR. Nucl Acids Res. 1996;24:2640–2647. doi: 10.1093/nar/24.14.2640. [DOI] [PMC free article] [PubMed] [Google Scholar]
- 45.Fox AH, Liew C, Holmes M, Kowalski K, Mackay J, Crossley M. Transcriptional cofactors of the FOG family interact with GATA proteins by means of multiple zinc fingers. EMBO J. 1999;18:2812–2822. doi: 10.1093/emboj/18.10.2812. [DOI] [PMC free article] [PubMed] [Google Scholar]
- 46.Starr BD, Hoopes BC, Hawley DK. DNA bending is an important component of site-specific recognition by the TATA binding protein. J Mol Biol. 2007;250:434–446. doi: 10.1006/jmbi.1995.0388. [DOI] [PubMed] [Google Scholar]
- 47.Shore D, Baldwin RL. Energetics of DNA twisting. I. Relation between twist and cyclization probability. J Mol Biol. 1983;170:957–981. doi: 10.1016/s0022-2836(83)80198-3. [DOI] [PubMed] [Google Scholar]
- 48.Saiz L, Vilar JM. DNA looping: the consequences and its control. Curr Opin Struc Biol. 2006;16:344–350. doi: 10.1016/j.sbi.2006.05.008. [DOI] [PubMed] [Google Scholar]
- 49.Su W, Jackson S, Tjian R, Echols H. DNA looping between sites for transcriptional activation: self-association of DNA-bound Sp1. Genes Dev. 1991;5:820–826. doi: 10.1101/gad.5.5.820. [DOI] [PubMed] [Google Scholar]
- 50.Knight J, Li R, Botchan M. The activation domain of the bovine papillomavirus E2 protein mediates association of DNA-bound dimers to form DNA loops. Proc Natl Acad Sci U S A. 1991;88:3204–3208. doi: 10.1073/pnas.88.8.3204. [DOI] [PMC free article] [PubMed] [Google Scholar]
- 51.Hadjur S, Williams LM, Ryan NK, Cobb BS, Sexton T, Fraser P, Fisher AG, Merkenschlager M. Cohesins form chromosomal cis-interactions at the developmentally regulated IFNG locus. Nature. 2009;460:410–U130. doi: 10.1038/nature08079. [DOI] [PMC free article] [PubMed] [Google Scholar]
- 52.Nativio R, Wendt KS, Ito Y, Huddleston JE, Uribe-Lewis S, Woodfine K, Krueger C, Reik W, Peters JM, Murrell A. Cohesin is required for higher-order chromatin conformation at the imprinted IGF2-H19 locus. PLoS Genet. 2009;5:e1000739. doi: 10.1371/journal.pgen.1000739. [DOI] [PMC free article] [PubMed] [Google Scholar]
- 53.Peters JP, Maher LJ., III DNA curvature and flexibility in vitro and in vivo. Q Rev Biophys. 2010;43:23–63. doi: 10.1017/S0033583510000077. [DOI] [PMC free article] [PubMed] [Google Scholar]
- 54.Ringrose L, Chabanis S, Angrand P, Woodroofe C, Stewart A. Quantitative comparison of DNA looping in vitro and in vivo: chromatin increases effective DNA flexibility at short distances. EMBO J. 1999;18:6630–6641. doi: 10.1093/emboj/18.23.6630. [DOI] [PMC free article] [PubMed] [Google Scholar]
- 55.Deng Z, Wang Z, Stong N, Plasschaert R, Moczan A, Chen HS, Hu S, Wikramasinghe P, Davuluri RV, Bartolomei MS, Riethman H, Lieberman PM. A role for CTCF and cohesin in subtelomere chromatin organization, TERRA transcription, and telomere end protection. EMBO J. 2012;31:4165–4178. doi: 10.1038/emboj.2012.266. [DOI] [PMC free article] [PubMed] [Google Scholar]
- 56.Chen HS, Martin KA, Lu F, Lupey LN, Mueller JM, Lieberman PM, Tempera I. Epigenetic deregulation of the LMP1/LMP2 locus of Epstein-Barr virus by mutation of a single CTCF-cohesin binding site. J Virol. 2014;88:1703–1713. doi: 10.1128/JVI.02209-13. [DOI] [PMC free article] [PubMed] [Google Scholar]
- 57.Wu A, Li Z, Zhou H, Zheng J, Wang E. Construction and control of plasmid DNA network. Analyst. 2002;127:585–587. doi: 10.1039/b201811j. [DOI] [PubMed] [Google Scholar]
- 58.Nečas D, Klapetek P. Gwyddion: an open-source software for SPM data analysis. Centr Eur J Phys. 2012;10:181–188. [Google Scholar]
- 59.Abramoff M, Magelhaes P, Ram S. Image processing with ImageJ. Biophotonics International. 2004;11:36–42. [Google Scholar]
- 60.Li YL, Meng YF, Zhang ZM, Jiang Y. Detecting the oligomeric state of Escherichia coli MutS from its geometric architecture observed by an atomic force microscope at a single molecular level. J Phys Chem B. 2014;118:9218–9224. doi: 10.1021/jp504644r. [DOI] [PubMed] [Google Scholar]
Associated Data
This section collects any data citations, data availability statements, or supplementary materials included in this article.